Article

Prognostic Implication of SOX2 Expression Associated with p16 in Oropharyngeal Cancer: A Study of Consecutive Tissue Microarrays and TCGA

1
Department of Otorhinolaryngology-Head and Neck Surgery, National Cancer Center, 323 Ilsan-ro, Ilsandong-gu, Goyang-si 10408, Gyeonggi-do, Korea
2
Division of Cancer Immunology, National Cancer Center, 323 Ilsan-ro, Ilsandong-gu, Goyang-si 10408, Gyeonggi-do, Korea
3
Department of Pathology, National Cancer Center, 323 Ilsan-ro, Ilsandong-gu, Goyang-si 10408, Gyeonggi-do, Korea
*
Author to whom correspondence should be addressed.
Biology 2020, 9(11), 387; https://doi.org/10.3390/biology9110387
Submission received: 24 August 2020 / Revised: 29 October 2020 / Accepted: 6 November 2020 / Published: 9 November 2020

Abstract

:

Simple Summary

The role of human papillomavirus (HPV) in oropharyngeal cancer (OPSCC) as a cause agent has been reported in much of the literature. As a surrogate marker, p16 immunohistochemical staining is used as the standard for classifying OPSCC, and the prognosis of p16+ OPSCC has been reported to be better than p16− OPSCC. However, it was necessary to study what is the next biomarker that could predict the prognosis after classification by p16. We assumed that SOX2 may be a potential biomarker. For each p16+ and p16− OPSCC, SOX2 was used to analyze whether the degree of expression level differed in survival and recurrence rates. The results showed that both immunohistochemical staining and mRNA expression level of SOX2 significantly affected the survival and recurrence rates of p16+ OPSCC patients in two different datasets which were constructed in differently ways. Our study presented the clinical applicability of SOX2 as a biomarker.

Abstract

For oropharyngeal squamous cell carcinoma (OPSCC), there are not enough additional robust biomarkers for subgrouping after the distinct classification using p16. As SOX2 is an emerging biomarker for cancer treatment, its clinical implication in OPSCC was evaluated using a consecutive tissue microarray (TMA) cohort consisting of 111 patients who underwent surgery as an initial treatment from May 2002 to December 2016 and 79 patients in The Cancer Genome Atlas (TCGA) dataset. In both datasets, p16+/SOX2High (HPV+/SOX2High in TCGA) showed the best prognosis among the four groups classified by SOX2 and p16 for 5-year overall survival (OS) and recurrence (all p < 0.05), but SOX2 did not make a significant difference in the prognosis of the p16− group. In the TMA cohort, SOX2High was significantly correlated with response to radiotherapy and lower pathologic T classification in the p16+ group (p = 0.001). In TCGA, correlations between SOX2 and tumor stage classification or radiotherapy were not observed; however, HPV+/SOX2High had a significantly low tumor mutation burden among the four groups (all p < 0.05). In summary, SOX2 was proven to be a potential marker to predict overall survival and recurrence in p16+ OPSCC. However, the role of SOX2 has not yet been confirmed in p16− OPSCC patients.

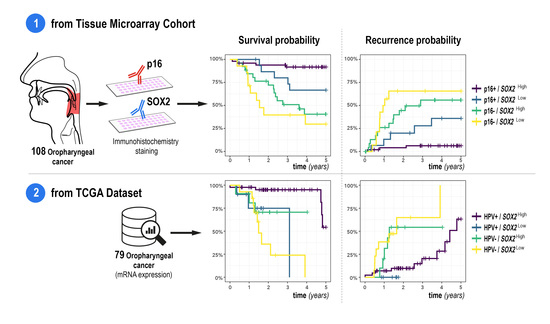
Graphical Abstract

1. Introduction

Head and neck cancers, which occur at the oral cavity, oropharynx, nasopharynx, hypopharynx and unspecified pharynx, are the seventh most frequent cancer and the ninth leading cause of cancer-related death worldwide [1]. The majority of cases represent head and neck squamous cell carcinoma (HNSCC) that arises from the oral cavity, oropharynx and larynx, which accounts for more than 90% of head and neck cancers [2]. The prognosis of HNSCC is still poor even, with combined multimodality treatment, including surgery, radiotherapy and chemotherapy [3]. The current classification based on anatomic site and tumor stage fails to reflect due to their remarkable heterogeneity [4], and the lack of improving patient survival from the uniformity of treatment propelled the establishment of a novel strategy that uses biomarkers based on the genetic and biological behavior of tumors [3,5].
SOX2, a pluripotency-associated transcription factor, is an emerging biomarker for the prediction of prognosis and therapeutic targets for cancer treatment because it plays an important role in the development and maintenance of the stem cell state and is associated with cancer progression [6]. However, whether higher SOX2 expression is a favorable or unfavorable risk factor depends on the primary organ of cancer [7,8,9,10,11,12]. Even in head and neck cancer, SOX2 and its associated pathway have been presented as novel biomarkers but the results are controversial [3,13,14,15,16,17,18,19].
Among head and neck cancers, oropharyngeal squamous cell carcinoma (OPSCC) is one of the major subsites of HNSCC. Since human papilloma virus (HPV) is known to be a causative agent [20], OPSCC is now classified into HPV+ and HPV− OPSCC by using immunohistochemistry (IHC) of p16INK4a, which is a surrogate marker for HPV status [21]. HPV-related OPSCC is recognized as a distinct category because of its unique etiology, biology, clinical presentation and therapeutic responses [2]. Recently, two groups have different staging systems in the latest guidelines [22]. However, there are not enough additional robust biomarkers for subgrouping after molecular classification using p16 IHC.
In light of evidence that SOX2 can be a biomarker, we hypothesized that SOX2 may be a potential marker for OPSCC and sought to find the implication of SOX2 in OPSCC after classification by p16INK4a IHC. After evaluation of the hypothesis using a head and neck cancer cohort of our institute, we also examined whether a similar finding can be validated at the mRNA expression level through The Cancer Genome Atlas Head–Neck Squamous Cell Carcinoma (TCGA-HNSC) dataset.

2. Materials and Methods

2.1. Ethical Consideration

All participants provided written informed consent according to the policies and procedures approved by the institutional review board of the National Cancer Center, Republic of Korea (approval number: NCC-NCS-08200).

2.2. Patients

From May 2002 to December 2016, a “Head and Neck Cancer Tissue Microarray Cohort (TMA cohort)” was established for a total of 397 consecutive patients (431 specimens) who visited the head and neck cancer center of our institute and agreed to a prospective study. Inclusion criteria were adults over 18 years old who were diagnosed with head and neck cancer through surgery or biopsy, and cases of follow-up-loss before specimen acquisition were excluded from the cohort.
TMA blocks were generated using three representative tumor areas (2 mm in core size) and paired normal control tissue from formalin-fixed, paraffin-embedded tumor material and marked on standard hematoxylin/eosin (H&E)-stained sections for the expression of tissue markers [23].
The source (primary site, lymph node, etc.) and timing of tumor tissue sampling (surgery or biopsy), age at the time of tissue acquisition, clinical information related to radiation therapy and chemotherapy, cancer staging and the date of death and recurrence were collected. A total of 124 patients with oropharyngeal cancer were extracted from the cohort, including only the tissue at the primary site and excluding cases who received treatment other than surgery as an initial treatment.
A case without SOX2 IHC score was excluded, and a total of 111 eligible patients were enrolled (Figure 1). Radiotherapy as an adjuvant treatment for initial operation (postoperative radiotherapy; PORT) was defined when it was delivered within 180 days after initial surgery.

2.3. Immunohistochemistry of p16 and SOX2

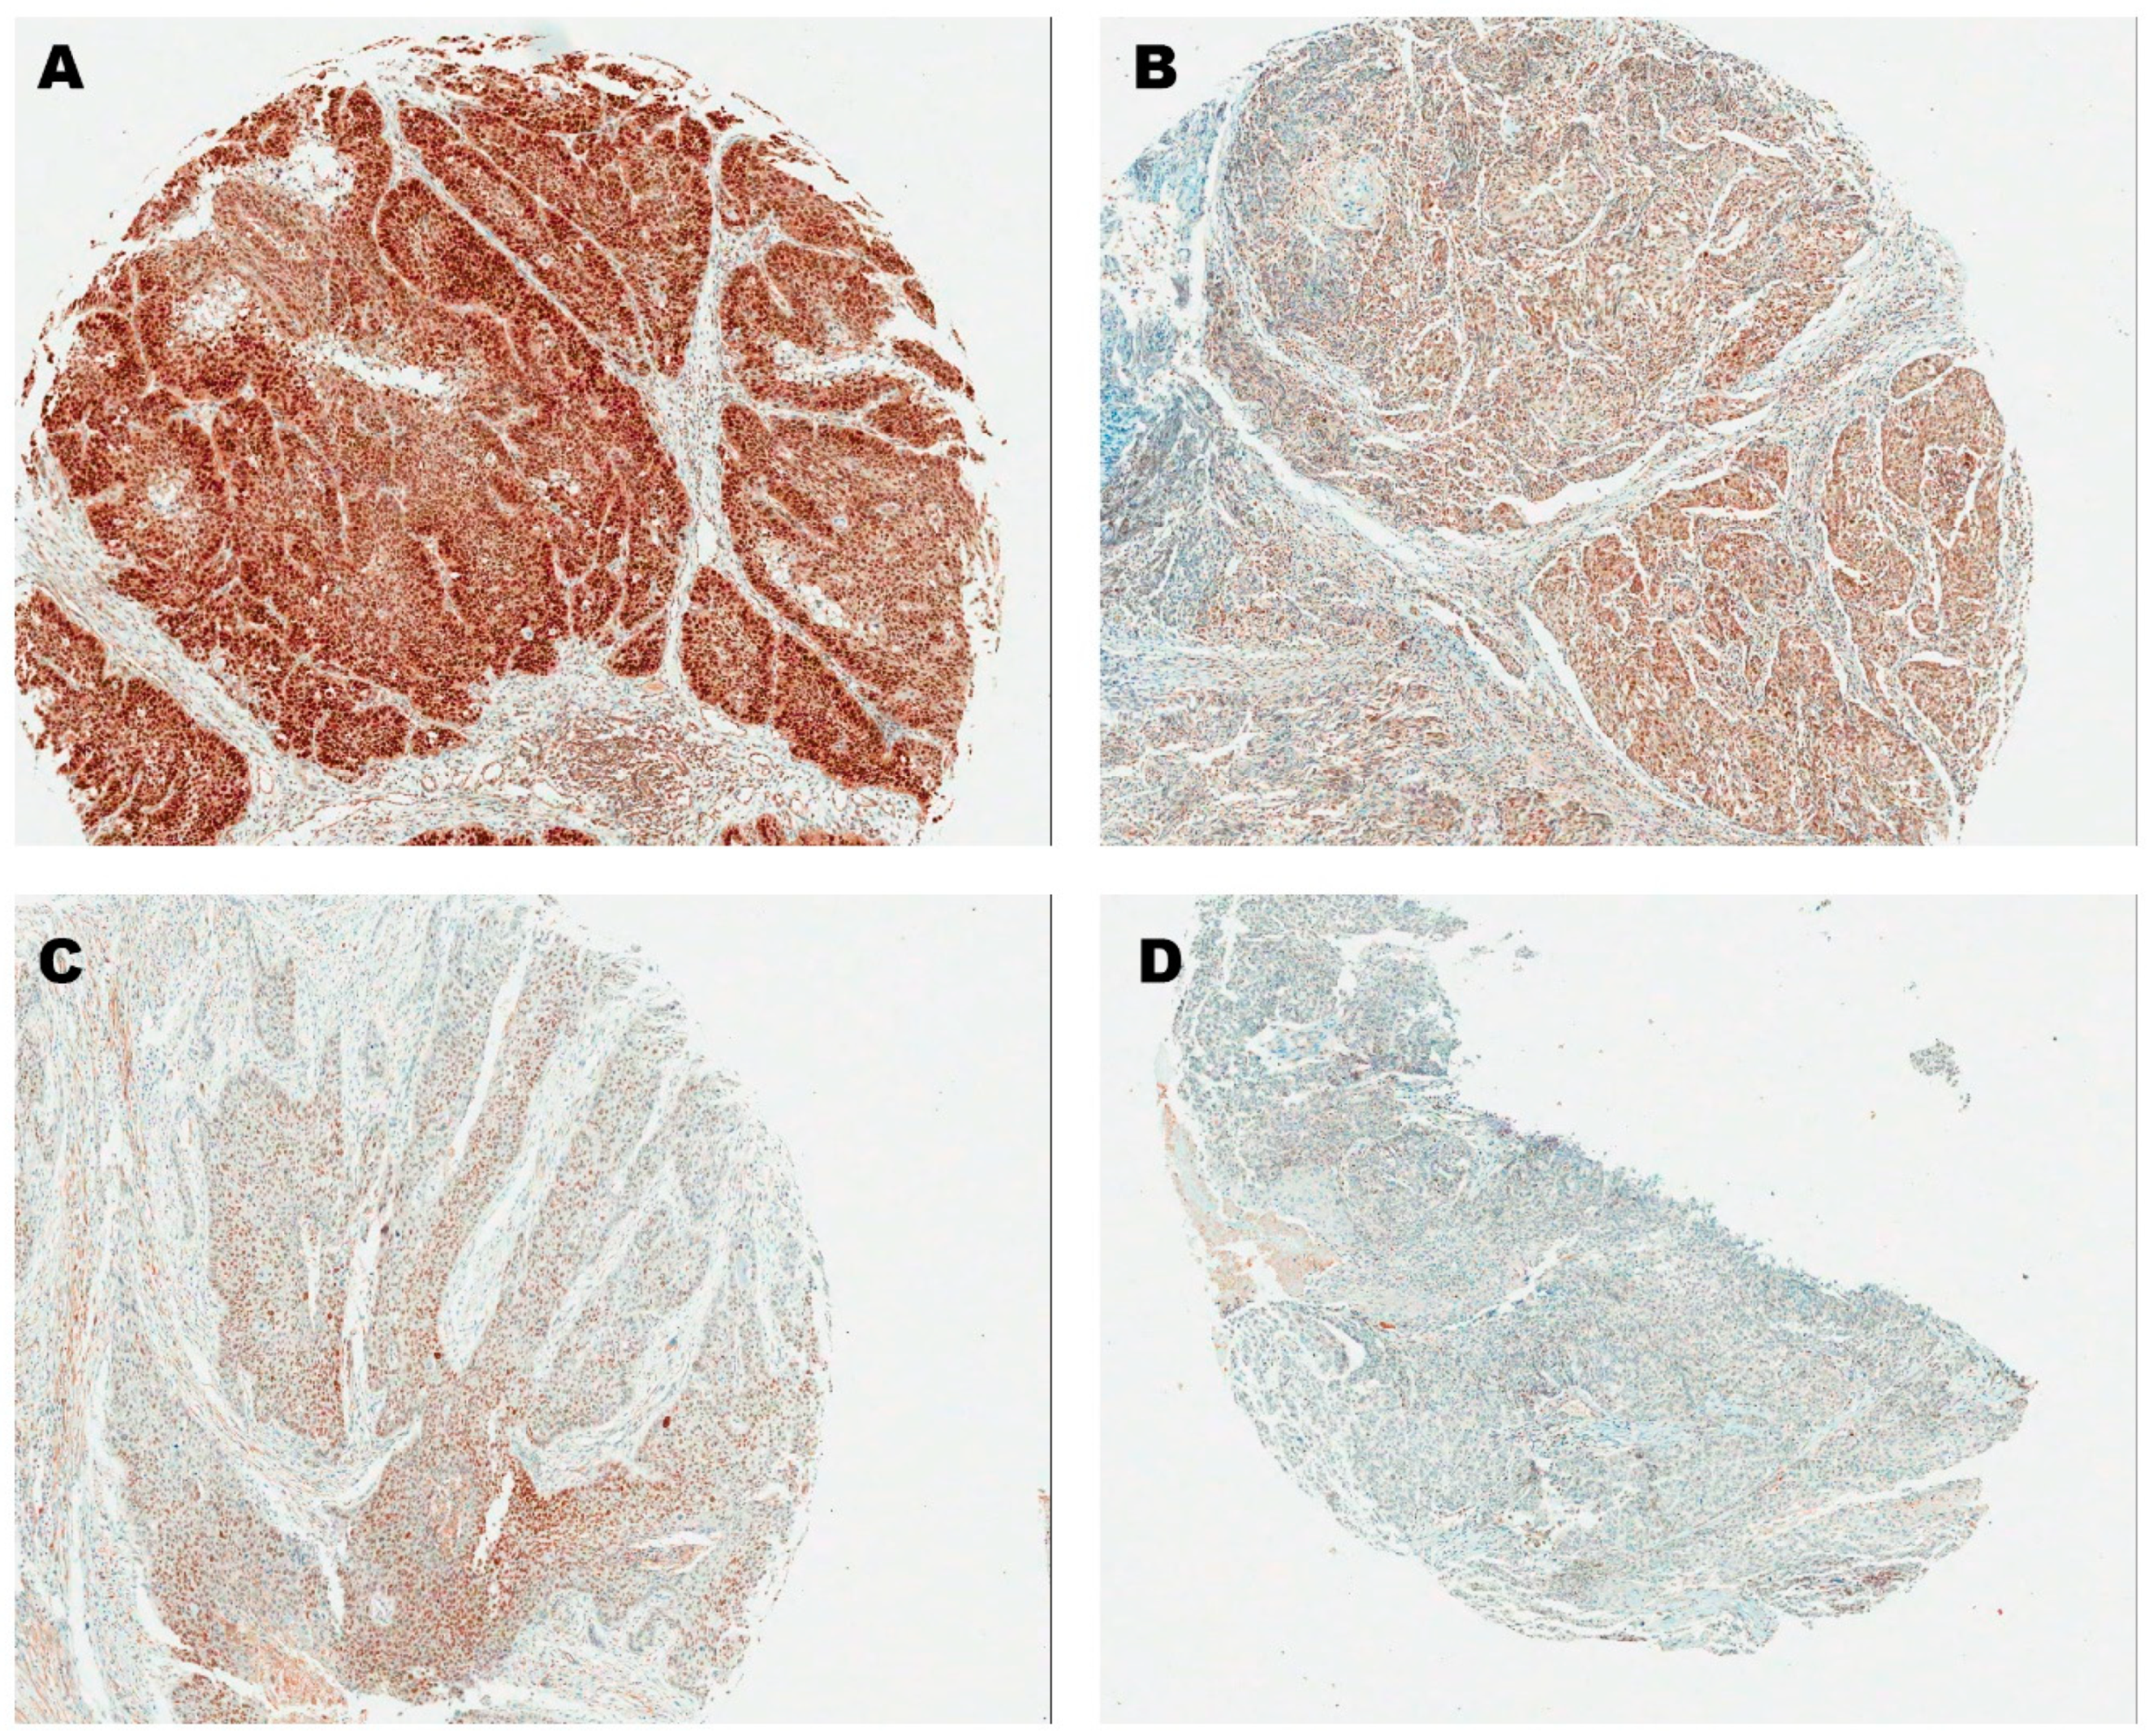
Immunostaining of p16 protein was performed using a monoclonal anti-p16 antibody (clone E6h4; ready-to-use; Dako, Carpinteria, CA, USA), and that of SOX2 protein was performed using a rabbit polyclonal anti-SOX2 antibody (clone EPR3131; 1:100 dilution; Abcam, Australia). The method of scoring the IHC stating was similar to Park et al.’s previous research [24]: without clinical information of the samples, semiquantitative composite scoring was conducted by an experienced pathologist (W.S.P). The stained tumor was divided into 10 parts and each part was graded from 0 (negative) to 3 (strong). Accordingly, IHC scores from 0 to 30 were obtained (Figure 2). The score distribution of the two markers is shown in Figure S1. For p16 IHC, there were no scores between 11 and 27 and 25 was set as a cutoff value to define samples with a strong intensity as p16+.

2.4. The Cancer Genome Atlas (TCGA)

Clinical data and mRNA expression values obtained from tumor tissue were collected from the TCGA-HNSC dataset for 79 patients with OPSCC who had information on HPV status. HPV status was classified based on the item labeled “patient.hpv_test_results.hpv_test_result.hpv_status”. Information on survival and recurrence was collected based on the items labeled “followup_treatment_success”, “vital_status”, “primary_therapy_outcome_sucess” and “new_tumor_event_after_initial_treatment”, and the duration (days) of each status from the initial treatment was obtained from the corresponding items labeled “days_to_last_followup”, “days_to_death” and “days_to_new_tumor_event_after_initial_treatment”. TNM classification was defined based on the clinical information provided. Pathologic classification (pTNM) was adopted, but clinical classification (cTNM) was used when pTNM information was not provided or if there was a record of chemotherapy but no record of surgery. Information on radiotherapy as an adjuvant treatment was collected on the items labeled “radioation_therapy” and “postoperative_rx_tx”, only “days_to_radiation_therapy_start” was the same or less than 180 days following initial diagnosis was accepted.

2.5. Statistical Analysis

In the cohort, follow-up of 17 of the 111 eligible patients was lost at some point, and the information about recurrence was not tracked after, but the time of death was obtained from the Ministry of Public Administration, Republic of Korea. For these patients, 5-year overall survival (OS) was calculated based on the time of death, and 5-year recurrence was calculated based on the information at the last follow-up.
In the TCGA dataset, the expression level of SOX2 mRNA was changed to a base-2 log scale and then standardized using the ‘scale’ function of R software. The immune cell signature was calculated using the single-sample gene set enrichment analysis (ssGSEA) method in the Gene Set Variation Analysis (GSVA) package of R software [25]. The tumor mutation burden (TMB) score was calculated as follows [26]:
Total number of truncating mutations × 1.5 + total number of nontruncating mutations × 1.0
In both datasets, the survival and recurrence rates were calculated using the Kaplan–Meier method. Hazard ratios (HRs) and confidence intervals (CIs) were calculated using the Cox regression method. The statistical significance of differences between the actuarial curves was tested by log-rank tests. A pairwise log-rank test was used as a post hoc analysis for comparison of more than two groups.
All statistical analyses were performed using R Statistical Software (version 3.5.1; R Foundation for Statistical Computing, Vienna, Austria). Time-dependent receiver operating characteristic (ROC) curve and area under curve (AUC) were estimated using the survivalROC package of R software [27].

3. Results

The cohort showed significant differences in age at operation, smoking, subsite, pathological T (pT) classification and postoperative radiotherapy and recurrence according to p16+ and p16− (all p < 0.01) (Table 1).

3.1. SOX2 Cut-Off Value and Correlation with p16

Using a time-dependent ROC curve, an SOX2 IHC score > 20 was determined as a cut-off value for 5-year overall survival in which the overall number of false positives and false negatives were minimized (AUC: 57.9, sensitivity: 43.9%, specificity: 74.0%). There was no IHC score between 25 and 20; accordingly, a group with an SOX2 IHC score of 25 or higher was referred to SOX2High, and a group with 20 or lower was referred to SOX2Low.
SOX2High showed a higher ratio in p16+ oropharyngeal cancer than p16−, but there was no statistically significant difference (76.1% vs. 63.4%, respectively, p = 0.157, Table 1). Age and sex were not significantly different in the two groups according to SOX2 (SOX2High vs. SOX2Low, 61.6 ± 11.4 vs. 58.7 ± 10.5, p = 0.231 for age and 96.8% vs. 83.8% for fraction of male patient, p = 0.107 from Fisher’s exact test).

3.2. SOX2 and Pathological Classification

In this study, p16+ oropharyngeal cancer had a significantly higher proportion of low pathologic T classification (pT1 and -2) than the p16− group (91.0% vs. 68.3%, p = 0.003) and a higher proportion of pathologically identified lymph node metastasis without significance (pN+, 70.1% vs. 48.8% of pN−, p = 0.060).
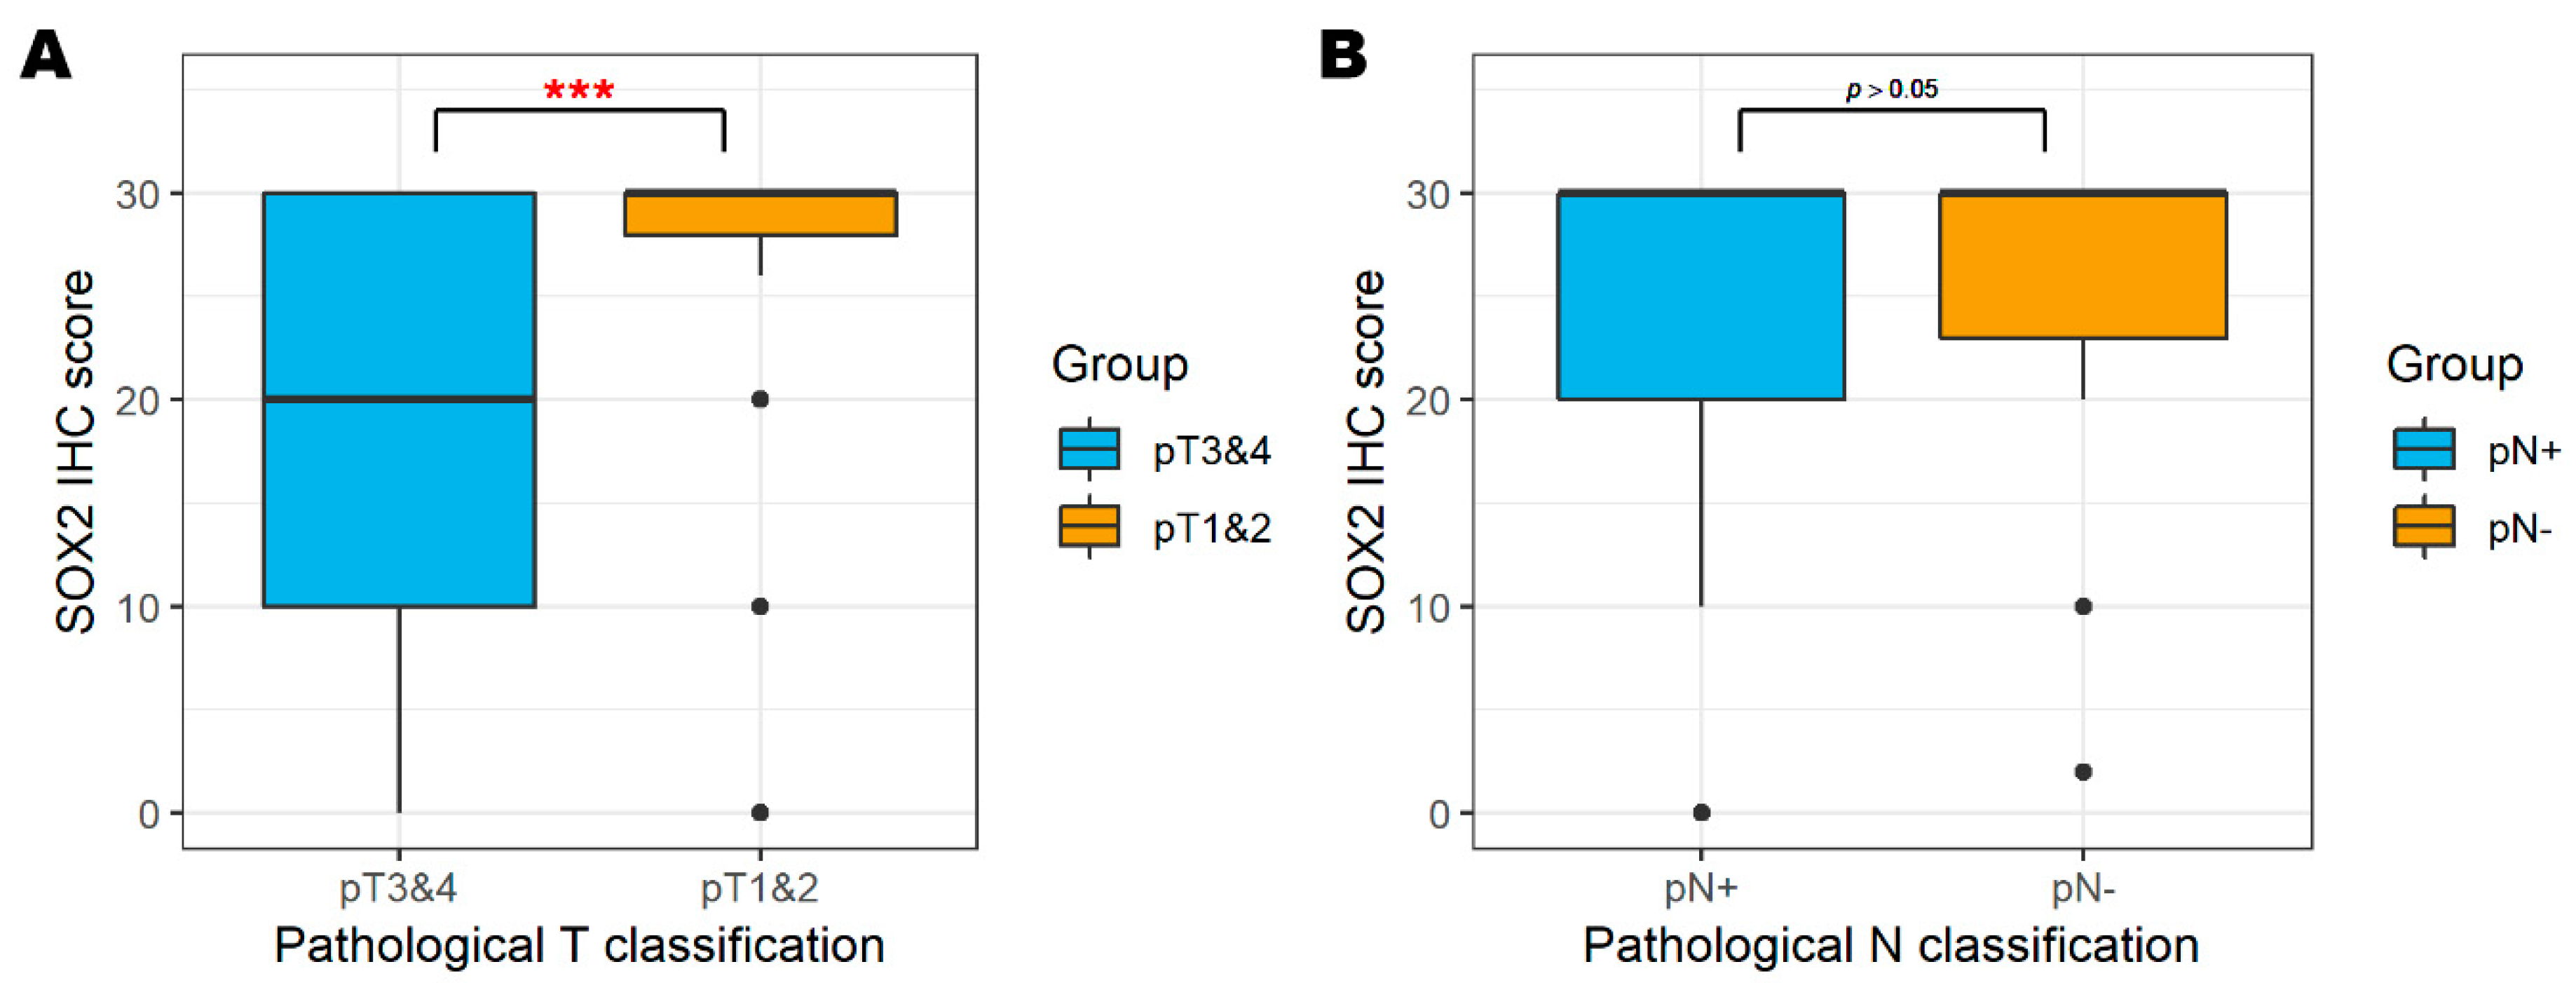
Higher SOX2 status had more pT1 and -2 stage significantly; SOX2High had 90% of pT1 and -2 and SOX2Low had 68.3% (p = 0.003). In comparison with the SOX2 IHC score, lower scores were more distributed in higher pT classification (median [IQR] IHC score of pT3 and -4 vs. pT1 and -2:30 [28,29,30] vs. 20 [10,11,12,13,14,15,16,17,18,19,20,21,22,23,24,25,26,27,28,29,30], p < 0.001) (Figure 3). This trend was also significant in p16+ oropharyngeal cancer (proportion of SOX2High in pT1 and -2 vs. pT3 and -4: 81.8% vs. 16.7%, p = 0.001, Fisher’s exact test) but not significant in the p16− group (proportion of SOX2High in pT1 and -2 vs. pT3 and -4: 71.4% vs. 46.2%, p = 0.169, Fisher’s exact test) (Table 2). However, pN classification was not significantly different in either group (pN+, 60% in SOX2High vs. 64.5% in SOX2Low, p = 0.661).

3.3. Risk Factors for Overall Survival and Recurrence

In the risk factor analysis (Table 3), a low SOX2 IHC score was identified as a significant risk factor for 5-year OS (HR (95% CI): 2.39 (1.19–4.81), p = 0.015) and 5-year recurrence (HR (95% CI): 2.72 (1.32–5.59), p = 0.005) in the univariate analysis. Accordingly, SOX2High and SOX2Low showed a significant difference in 5-year OS and recurrence (Figure S2). When SOX2 was multivariate analyzed with p16 and PORT, SOX2Low was a still risk factor for 5-year recurrence (HR (95% CI): 2.33 (1.11–4.89), p = 0.025), but in 5-year OS, SOX2 was not significant but still showed a tendency to increase the risk (HR (95% CI): 1.99 (0.99–4.04), p = 0.054). Only p16 was a significant factor in both 5-year OS and recurrence in multivariate analysis.
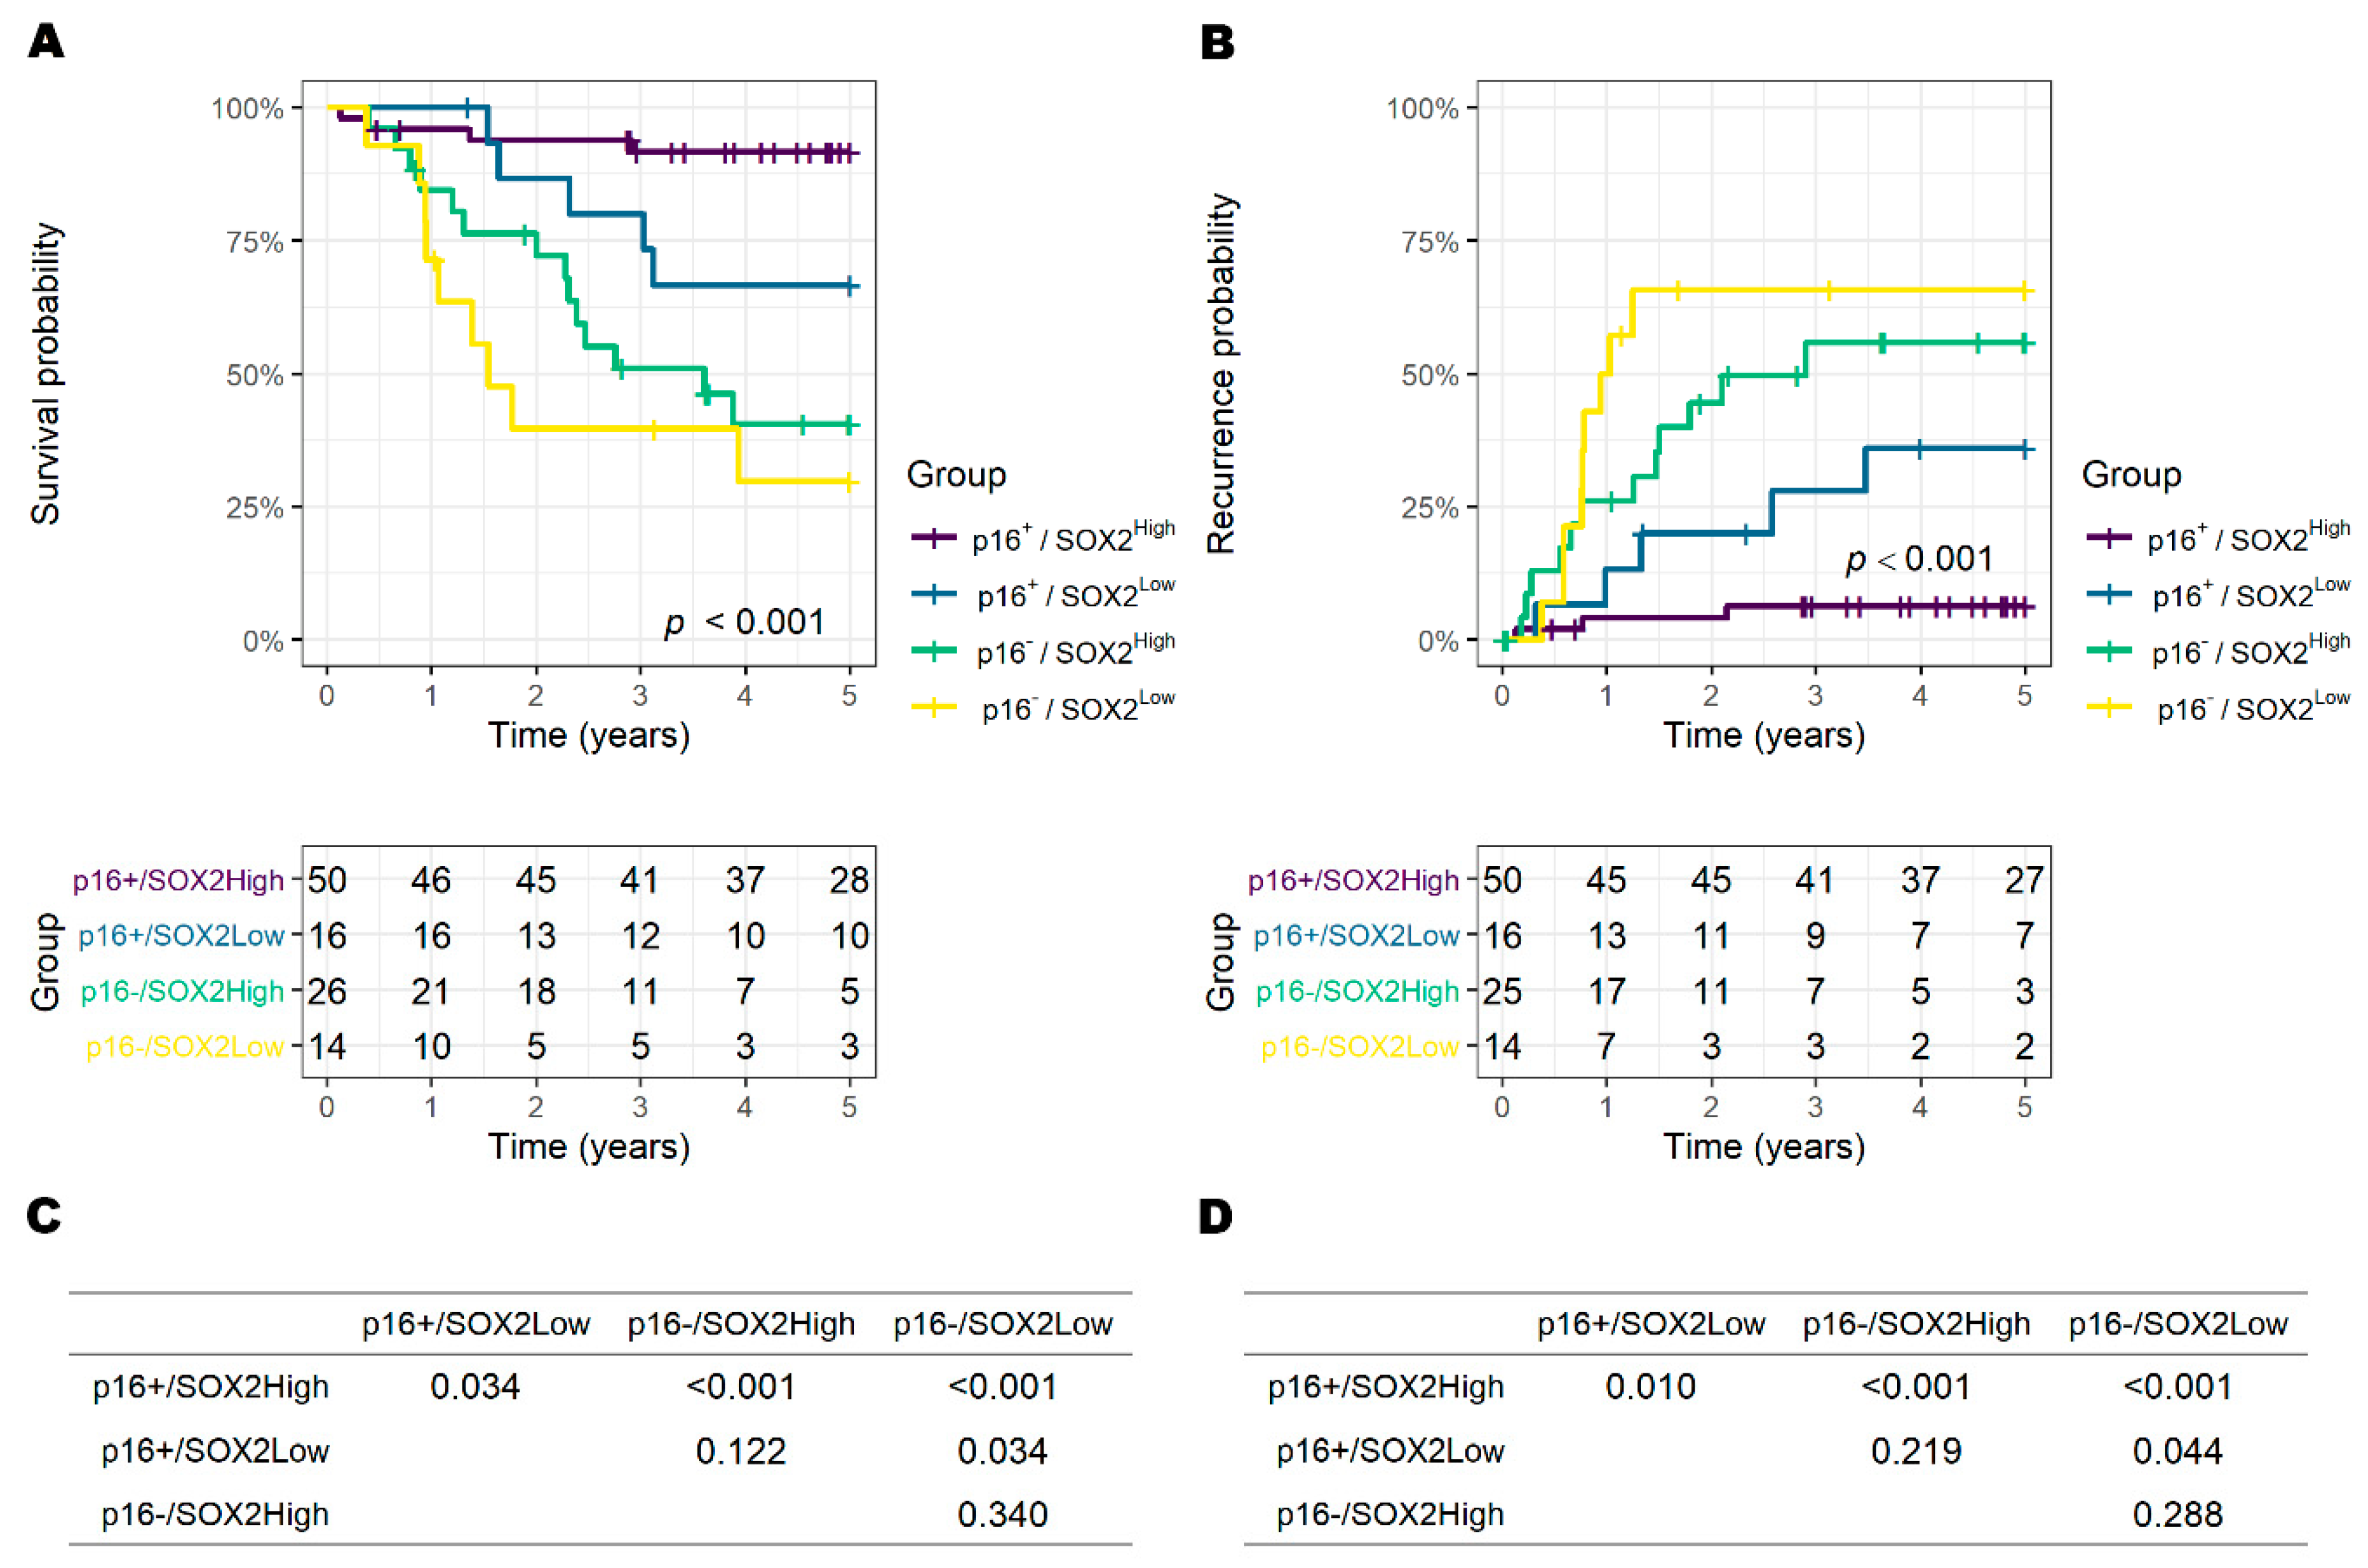
When p16 was included in the classification (Figure 4), the overall survival rate of p16+/SOX2High was 91.7% (95% CI: 84.3–99.8), p16+/SOX2Low was 66.7% (95% CI: 46.6–95.3), p16−/SOX2High was 40.5% (95% CI: 24.4–67.3) and p16−/SOX2Low was 29.8% (95% CI: 12.4–71.6). The 5-year recurrence rate of p16+/SOX2High was 6.3% (95% CI: 0.0–1.3), p16+/SOX2Low was 36.0% (95% CI: 4.5–57.1), p16−/SOX2High was 55.9% (95% CI: 27.8–73.1) and p16− /SOX2Low was 65.7% (95% CI: 27.6–83.8).
In a post hoc pairwise analysis of both 5-year OS and recurrence, p16+/SOX2High was significant compared to p16+/SOX2Low, p16−/SOX2High and p16−/SOX2Low, and p16+/SOX2Low was significant compared to p16−/SOX2Low (all p < 0.05). In the p16− group, p16−/SOX2High showed a significantly better OS rate at 2 years after surgery (76.4% (95% CI: 61.5–94.9) vs. 39.7% (95% CI: 20.3–77.7), p = 0.043), but SOX2 did not make a significant difference from 3 years of observation.
When analyzing the type of recurrence, the TMA cohort had a total of 22 locoregional recurrence cases and 9 distant metastases as the first progression. At the time the recurrence was diagnosed, local recurrence and distant metastasis were detected simultaneously in four patients. There was significantly more locoregional recurrence in p16− than p16+ (16 (39.0%) vs. 6 (9.0%), p < 0.001) and more distant metastasis as the first progression, but this difference was not significant (6 (14.6%) vs. 3 (4.5%), p = 0.064). SOX2Low had significantly more locoregional recurrence (11 (35.5%) vs. 11 (14.3%), p = 0.013) but not distant metastasis (4 (12.9%) vs. 5 (6.5%), p = 0.276). Risk factor analysis revealed that p16 significantly increased the risk of both locoregional recurrence and distant metastasis (all p < 0.05), whereas SOX2Low significantly increased only locoregional recurrence, even when analyzed in combination with p16 (Table S1).

3.4. SOX2 and Radiotherapy

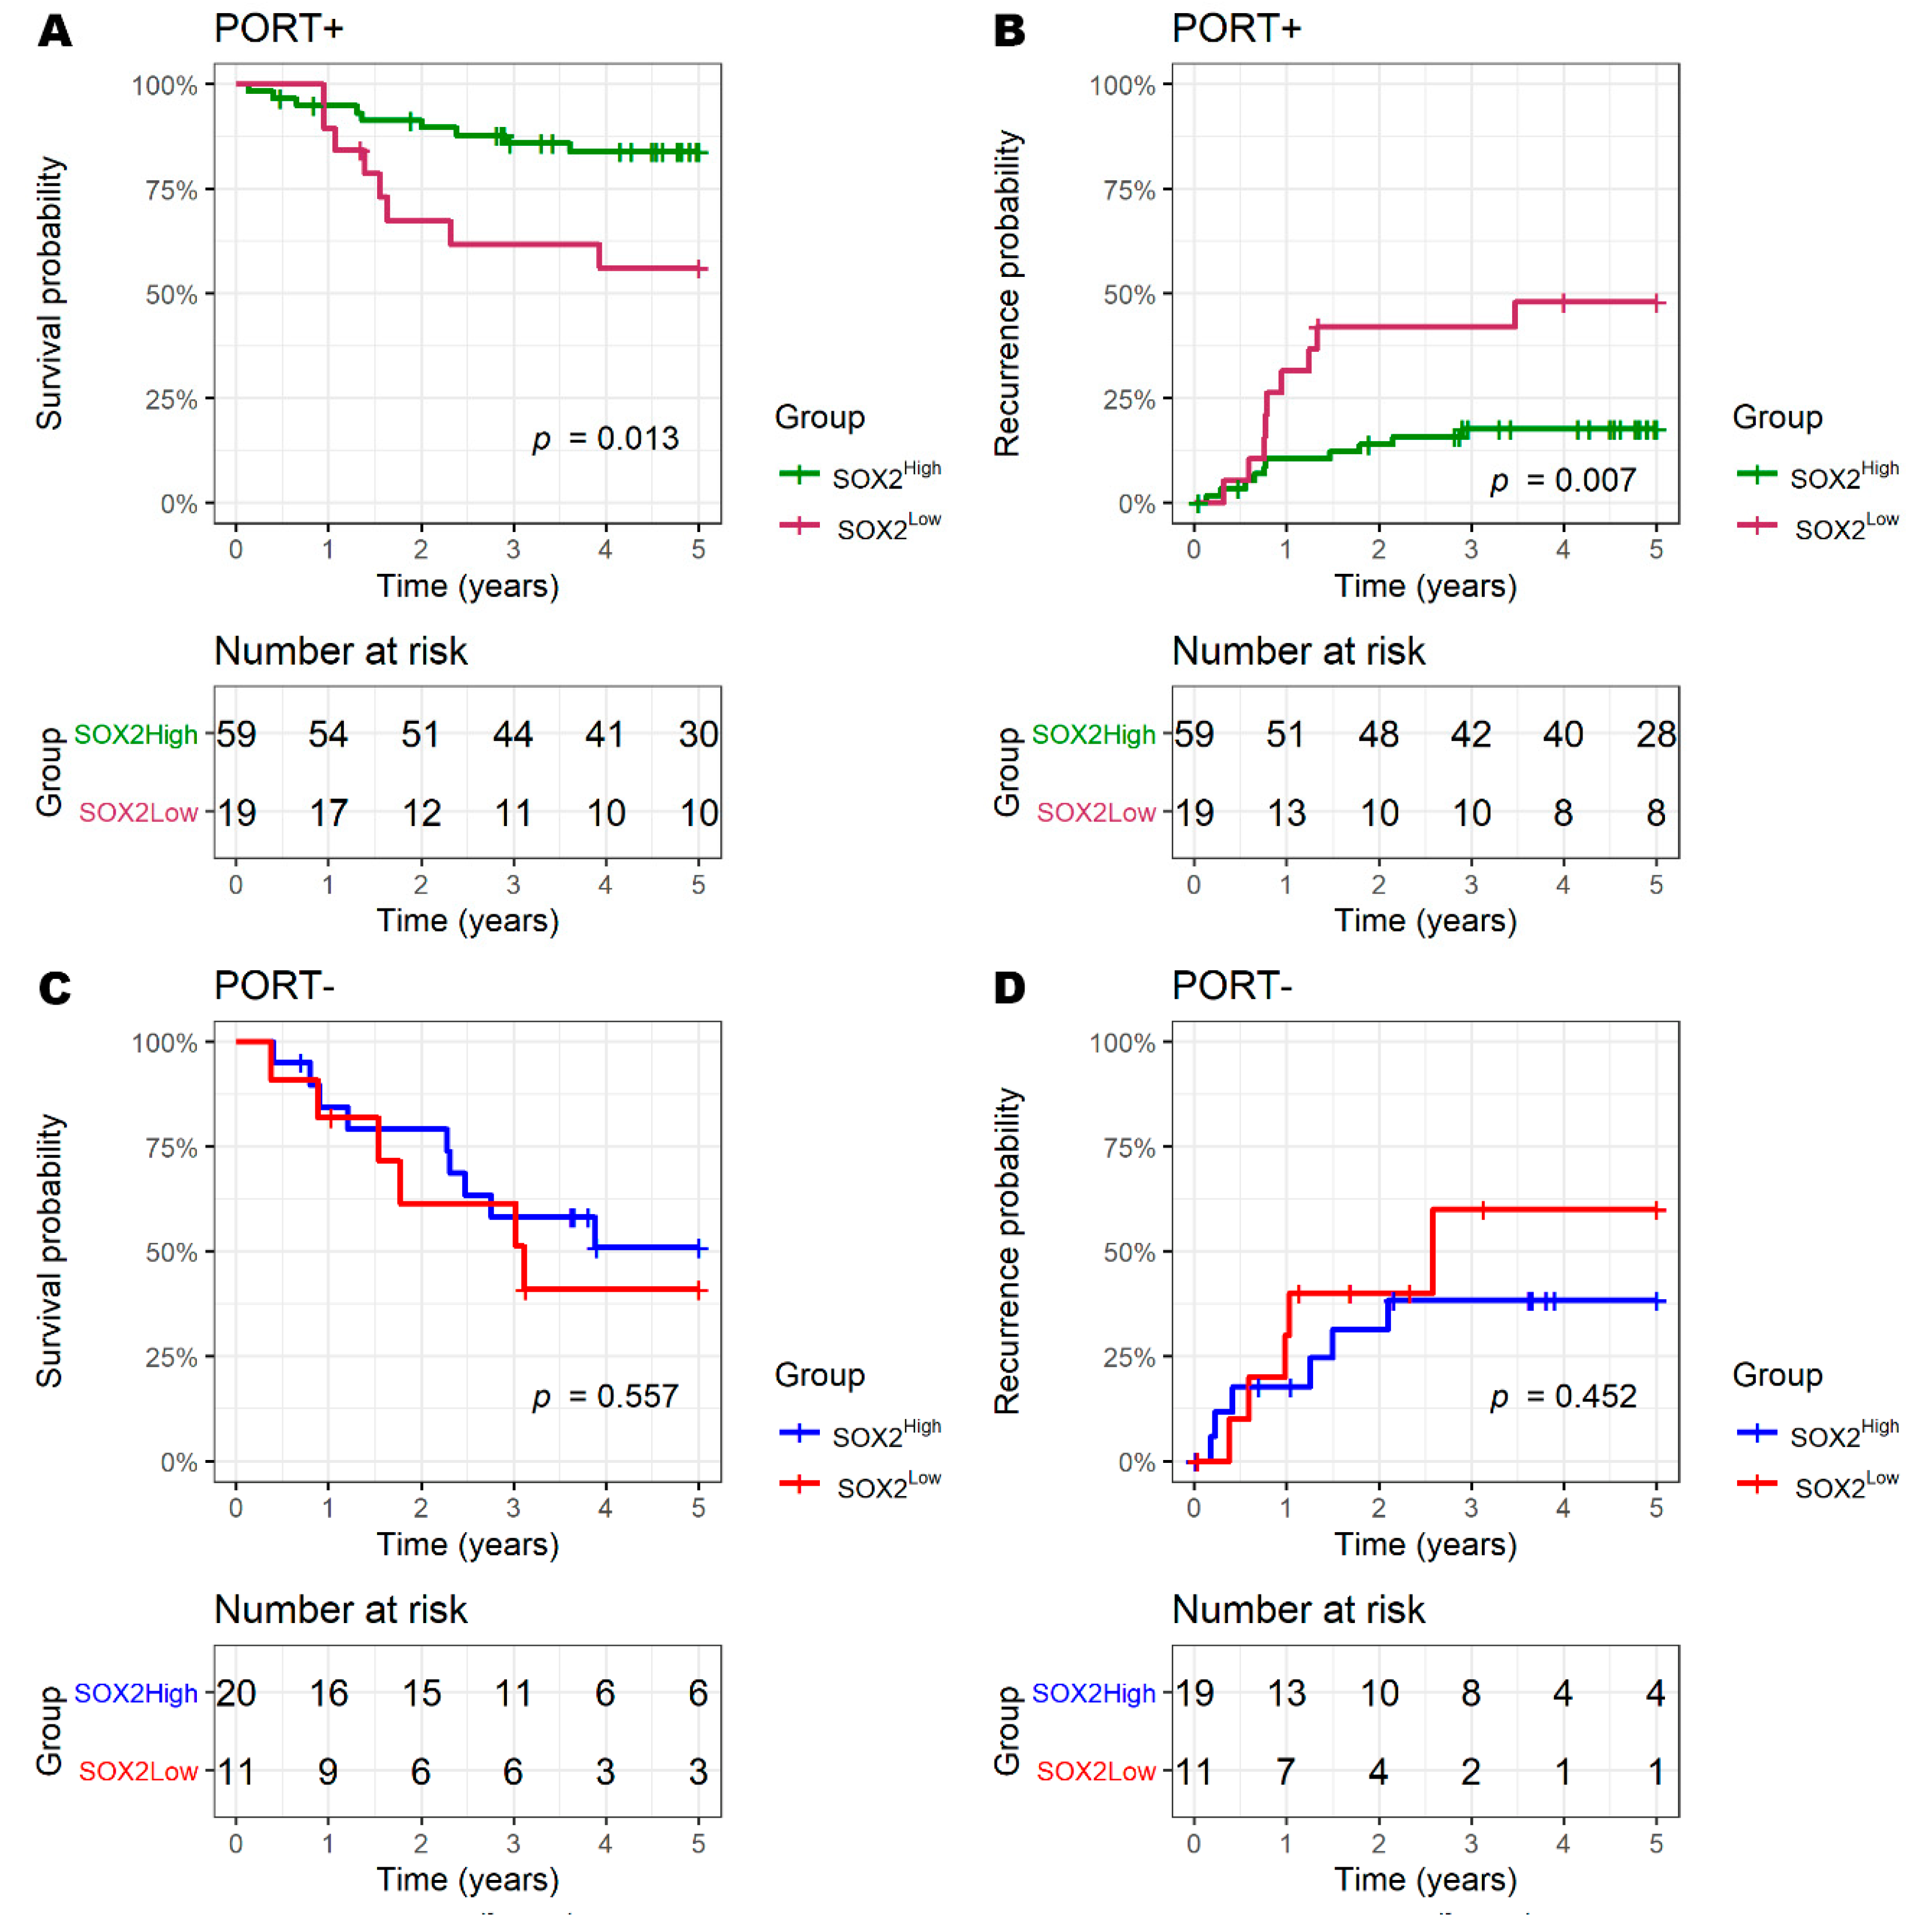
The significance of SOX2 was different in patients according to PORT (Figure 5). The prognosis of the SOX2High and SOX2Low groups was significantly different in PORT+ patients (5-year OS of SOX2High vs. SOX2Low: 83.8% (95%CI: 74.7–94.1) vs. 56.1% (95%CI: 37.4–84.4), p = 0.013; 5-year recurrence: 17.6% (95%CI: 7.1–27.0) vs. 47.9% (95%CI: 19.5–66.3), p = 0.007). Meanwhile, the difference in prognosis was not significant in PORT− patients (5-year OS of SOX2High vs. SOX2Low: 50.8% (95%CI: 32.0–80.7) vs. 40.9% (95%CI: 19.4–86.3), p = 0.557; 5-year recurrence: 38.2% (95%CI: 8.4–58.3) vs. 60.0% (95%CI: 0.0–84.5), p = 0.452).
The difference in prognosis did not reach a significance level when divided by p16; however, the SOX2High group tended to have an improved prognosis (5-year recurrence of SOX2High vs. SOX2Low in PORT+/p16+: 7.3% (95%CI: 0.0–14.8) vs. 25.9% (95%CI: 0.0–47.4), p = 0.088; 5-year OS in PORT+/p16−: 54.5% (95%CI: 32.8–90.4) vs. 14.3% (95%CI: 2.3–87.7), p = 0.065; 5-year recurrence in PORT+/p16−: 52.4% (95%CI: 15.1–73.3) vs. 85.7% (95%CI: 12.3–96.7), p = 0.092) (Figure S3).

3.5. Results of TCGA Data Set Analysis

In the TCGA-HNSC dataset, 79 of 528 cases were oropharyngeal cancer samples with HPV status based on in situ hybridization (ISH) or p16 tests. Accordingly, the cohort consisted of 54 cases (68.4%) of HPV+ and 25 cases (31.6%) of HPV− cancers; 54 cases (68.4%) had information about radiotherapy and 25 cases (31.6%) did not. Detailed demographic data of the TCGA subset are shown in Table S2.
The median value of standardized SOX2 mRNA expression level was 0.35 [IQR: −0.17–0.71] for HPV+ and −0.59 [IQR: −1.31–0.38] for HPV−, significantly different (p = 0.005, Wilcoxon rank sum test). Regarding TNM classification, 0.03 [IQR: −0.61–0.38] for T3 and -4 and 0.38 [IQR: −0.36–0.72] for T1 and -2, which was a similar trend observed in the TMA cohort but not significant in the TCGA dataset (p = 0.141), 0.01 [−0.77–0.77] for patients without nodal metastasis (N−) and 0.15 [−0.35–0.63] for patients with node metastasis (N+), which was not significant (p = 0.664).
A cut-off value of −0.3020 was chosen using time-dependent ROC analysis to minimize false positives and false negatives, which was obtained from the overall survival data of the fourth year, which recorded the highest AUC (0.925). Accordingly, 55 cases were SOX2High and 24 cases were SOX2Low.
SOX2Low increased the risk of 5-year OS univariately (HR (95%CI): 8.98 (3.08–26.2), p < 0.001), even in multivariate analysis (HR (95%CI): 4.87 (1.44–16.5), vs. SOX2High p = 0.011); rather, the significance of HPV− status was weakened in multivariate analysis (HR (95%CI): 3.24 (0.96–10.9), vs. HPV+, p = 0.059) when compared to univariate analysis (HR (95%CI): 7.11 (2.45–20.6), vs. HPV+, p < 0.001) (Table 4). For the 5-year recurrence, SOX2Low was revealed to increase the risk only in univariate analysis (HR (95% CI): 2.82 (1.12–7.09), p = 0.028). Accordingly, 5-year OS and recurrence were significantly different between the SOX2High and SOX2Low groups (Figure S4).
When analyzed according to HPV status, SOX2Low increased the risk of 5-year survival in HPV+ patients (HR (95% CI): 2.34 (1.66–65.6), p = 0.012 for HPV+ and 2.52 (0.68–9.35), p = 0.168 for HPV−), and a similar result was even seen when SOX2 was set as a continuous value of standardized mRNA expression level (Table S3).
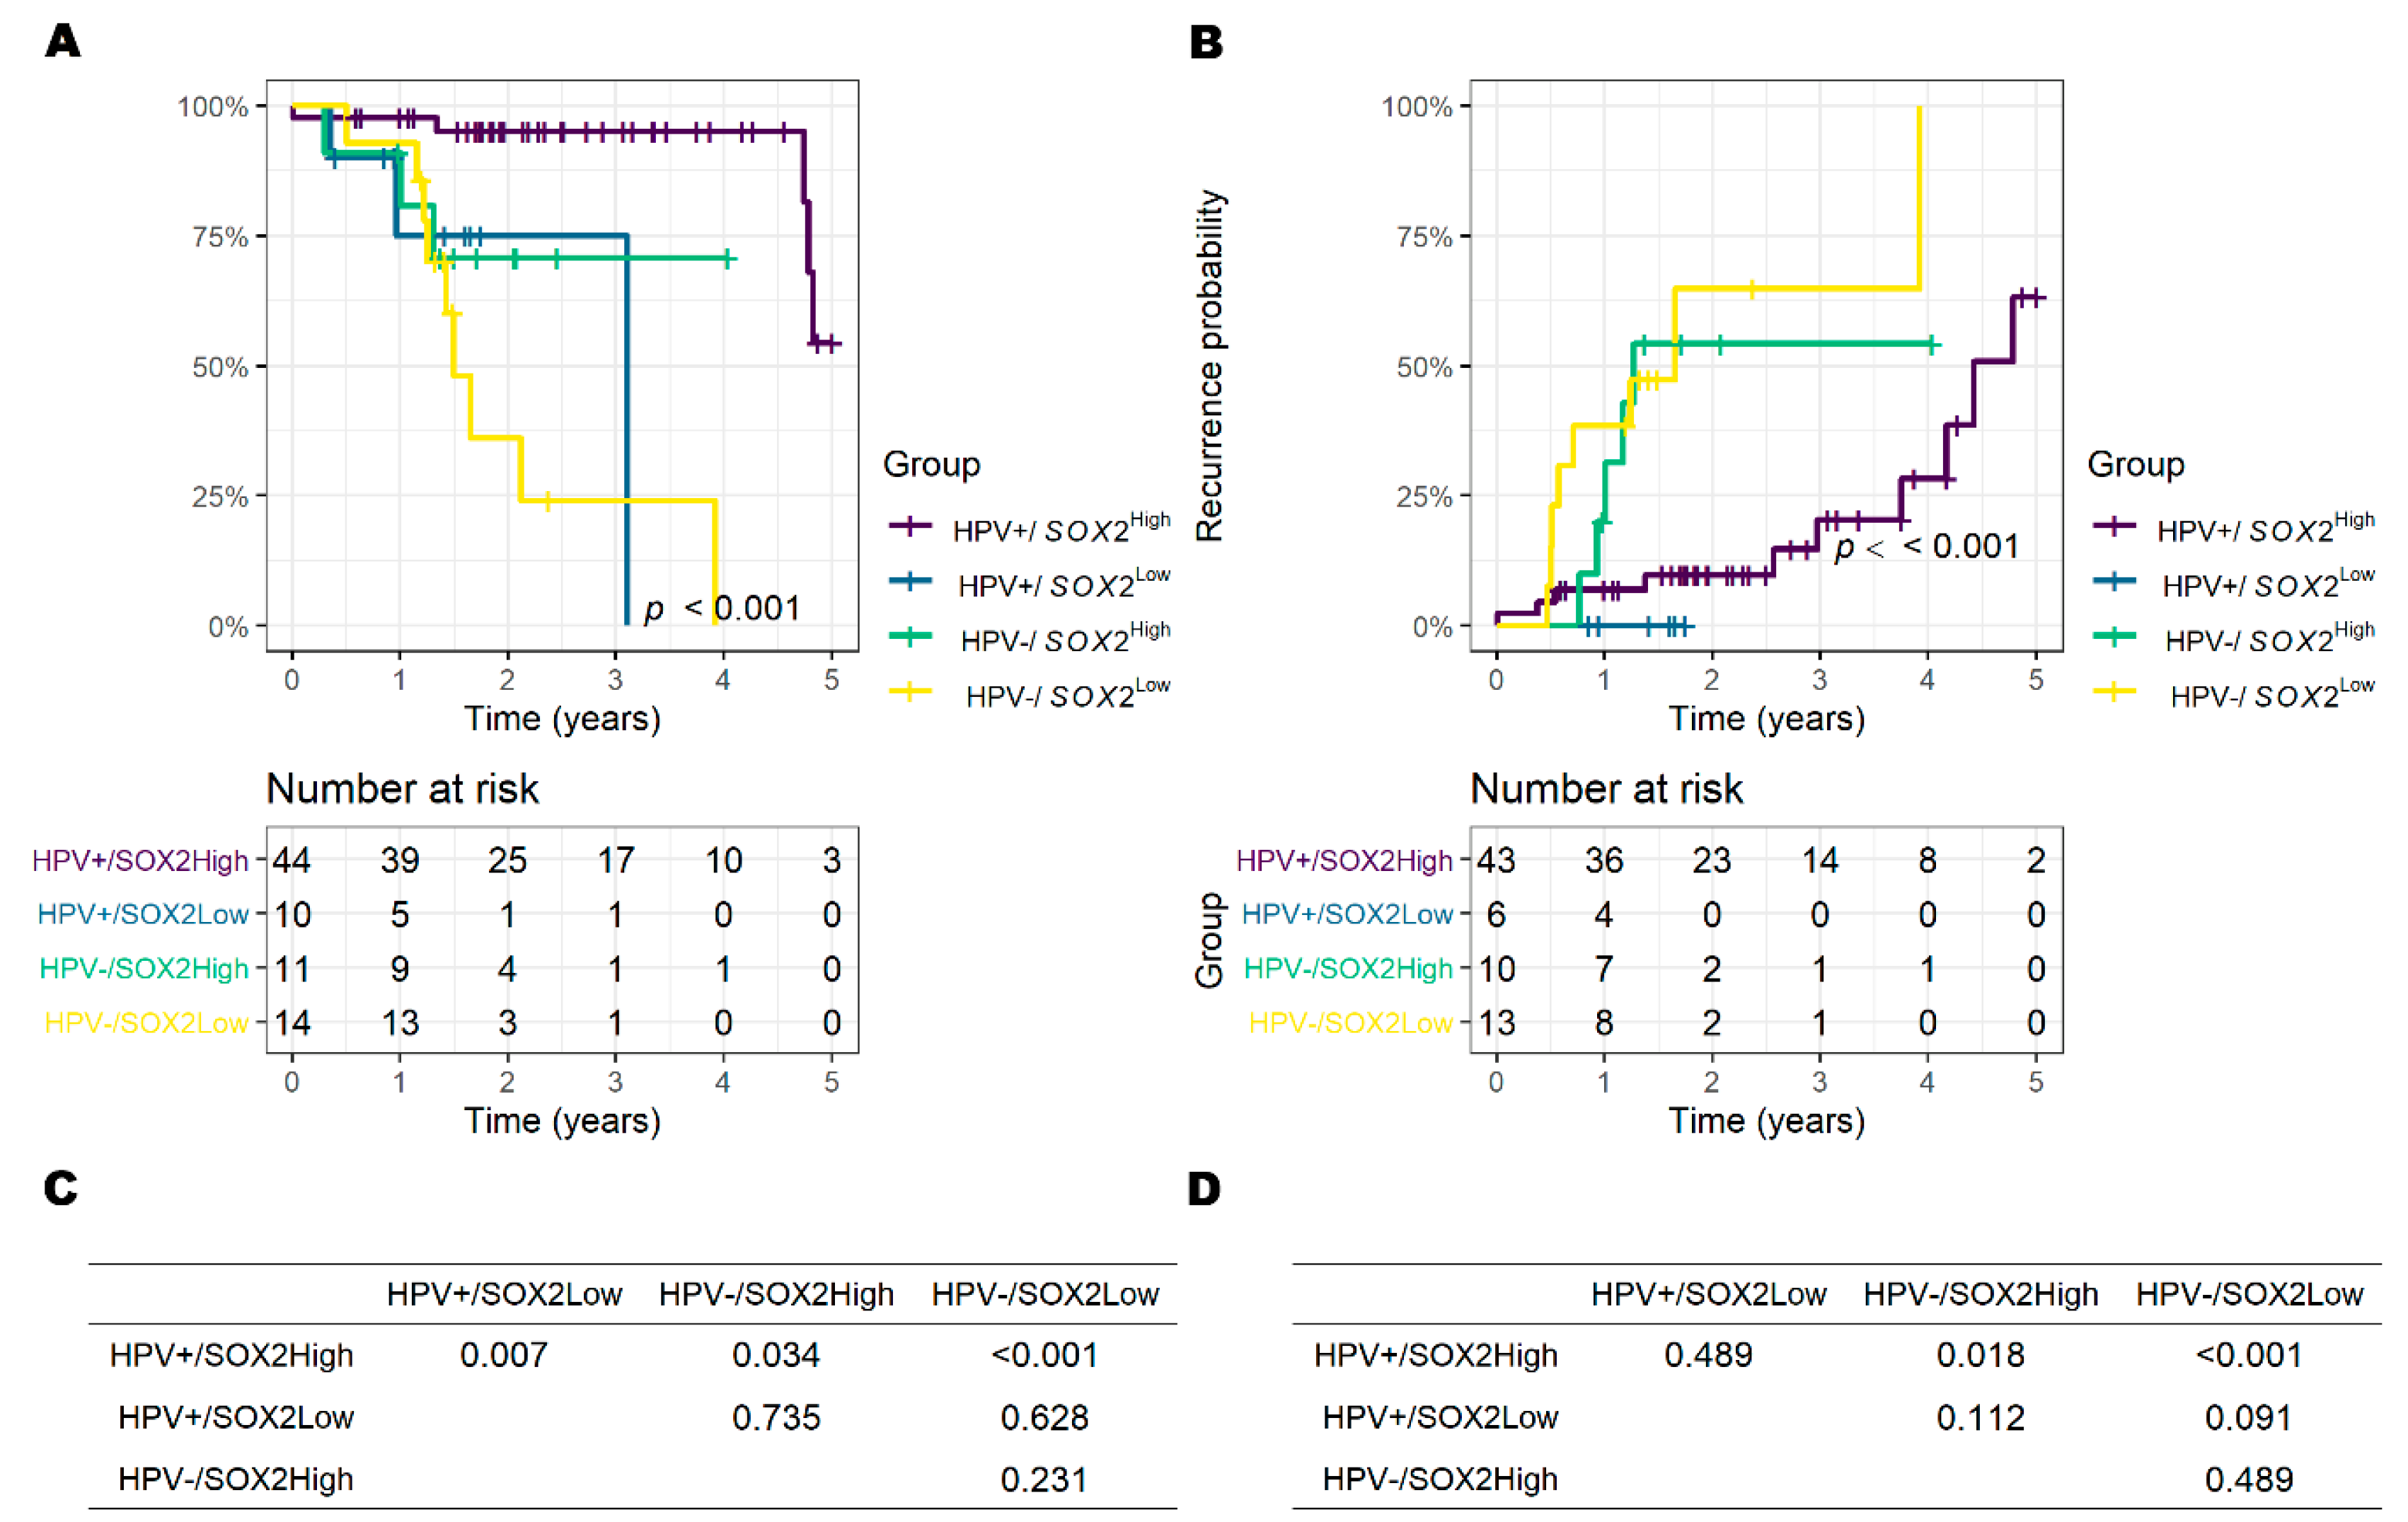
The overall survival and recurrence seemed to be significantly different between groups according to HPV status and SOX2 mRNA expression (Figure 6). In the post hoc analysis, the 5-year overall survival of HPV+/SOX2High was significantly improved compared with the other three groups (all p < 0.05), but there was no significant difference among HPV+/SOX2Low, HPV−/SOX2High and HPV−/SOX2Low. For 5-year recurrence, HPV+/SOX2High had the best prognosis, but only significant when compared to HPV−/SOX2High and HPV−/SOX2Low (all p < 0.05).
In contrast to the TMA cohort, RT was not a significant factor that affected prognosis in the TCGA dataset (Table 4). The prognosis of SOX2High was good regardless of whether a history of RT was present (Figure S5), and the effect of RT was not significant when classified as SOX2 expression (Figure S6). Subgroup analysis of more than two factors was difficult to perform due to the small number of patients and unequal deviations in the status of HPV and SOX2 expression in the TCGA-HNSC dataset.
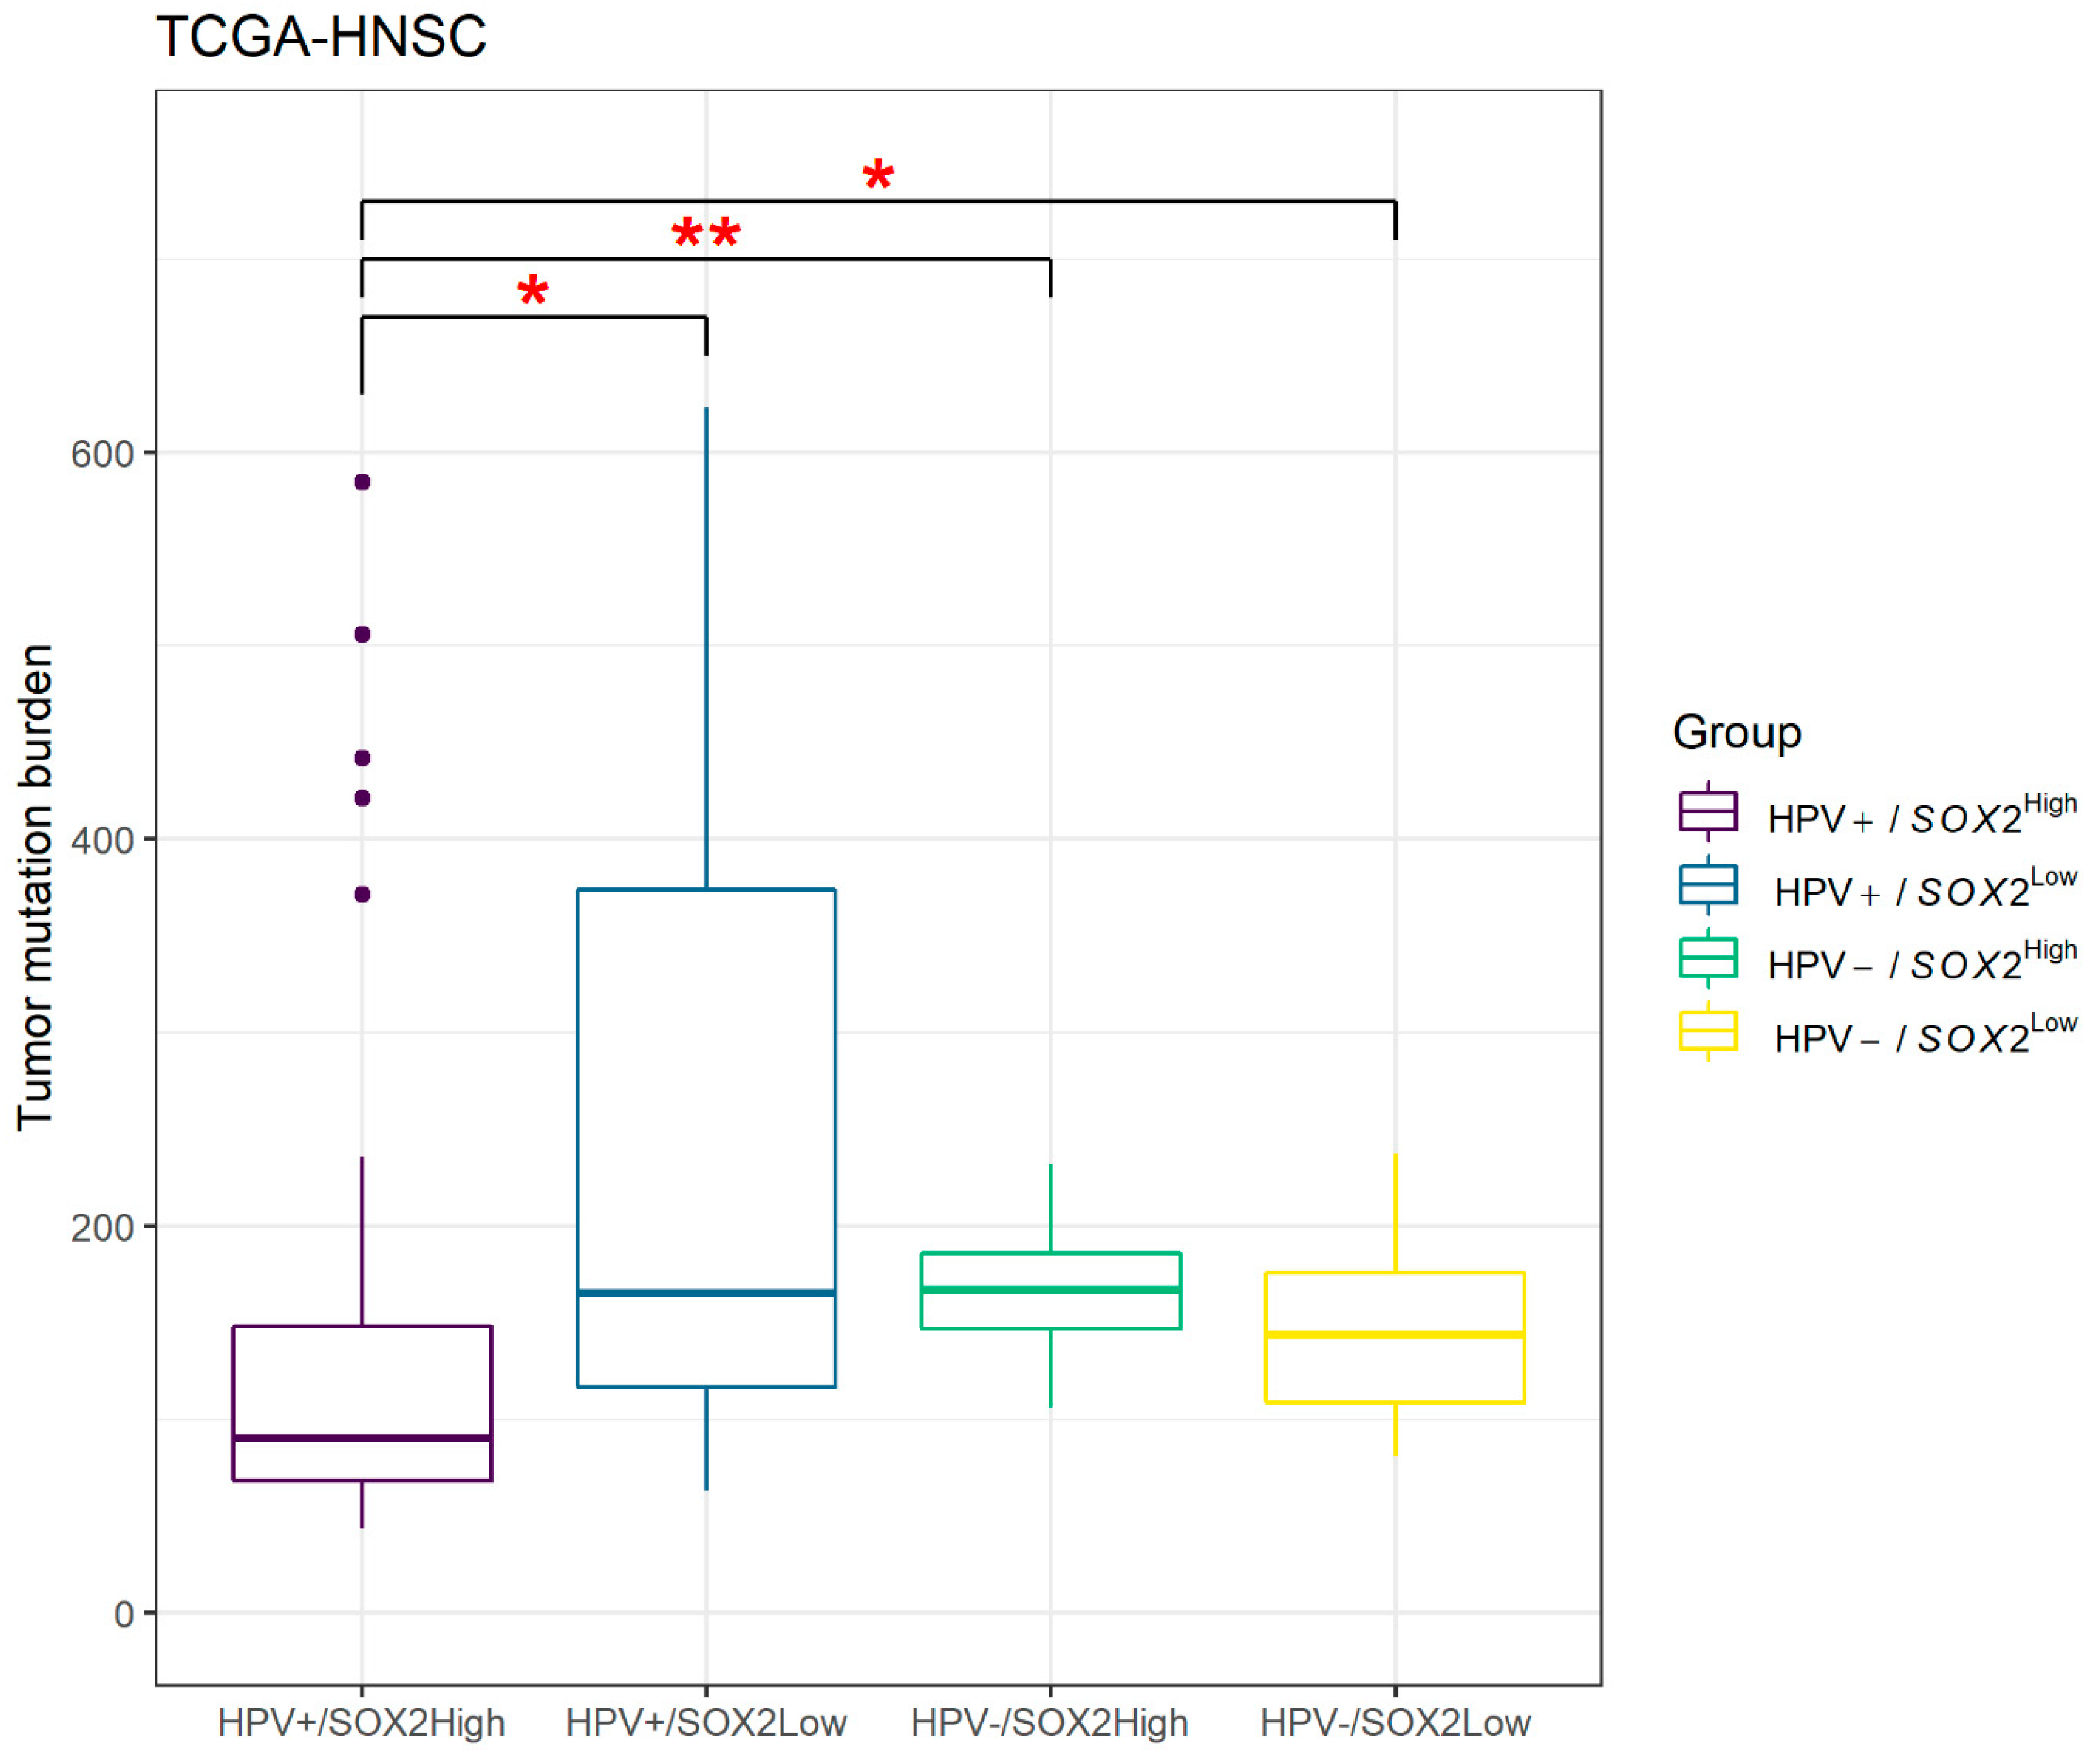
TMB was calculated in groups classified by HPV+/− and SOX2High/Low (Figure 7). The TMB score of HPV+/SOX2High (median [IQR]: 90.5 [68.4–147.9]) was the lowest among the four groups at a significant level; TMB of HPV+/SOX2Low (median [IQR]: 165.5 [116.6–373.9], p = 0.042). HPV−/SOX2High (median [IQR]: 166.8 [146.8–185.5], p = 0.005) and HPV−/SOX2Low (median [IQR]: 143.8 [108.9–175.5], p = 0.025). However, there was no significant difference between SOX2High and SOX2Low in HPV− groups (p = 0.279).
From the immune landscape of OPSCC in the TCGA-HNSC dataset (Figure S7), HPV+ cancers had a significantly higher rate of immune infiltration than HPV− cancers (83.7% vs. 16.3%, p = 0.001). Three markers, PD-1, PD-L1 and CTLA-4, related to immune therapy were not significantly different according to SOX2 expression in either HPV+ or HPV− oropharyngeal cancers (all p > 0.05) (Figure S8).

4. Discussion

Over the past decades, the overall incidence of HNSCC has been decreasing in the United States, Europe and Australia, while the incidence of OPSCC has been increasing [28]. Infection with high-risk HPV, especially type 16, as a pathogen of HNSCC arising from the oropharynx has been implicated in this trend [29]. Although HNSCC has a high incidence of therapy-resistant local and regional recurrence and distant metastases [30], HPV+ OPSCC is regarded to have a better prognosis, better response to chemotherapy and radiotherapy and distinct biology from HPV- OPSCC [28,31]. However, to the best of our knowledge, there is no robust biomarker that can molecularly subclassify OPSCC after p16.
SOX2 has been reported to be related to HPV infection. HPV infection drives switches in SOX2 expression in the transformation zone in the uterine cervix [32], and SOX2 locus amplification was associated with HPV ISH positivity in vulvar carcinoma [33]. Furthermore, SOX2 was revealed to be a regulator of HPV16 at the transcriptional level [34]. Therefore, the purpose of the study was to analyze the implication of SOX2 in oropharyngeal cancer as the next available marker following p16 and to validate our results in the TCGA-HNSC dataset.
Even in the genomic era, IHC is still the most important tool because the method is quick, widely available, technically less challenging and cost-effective [35,36]. Here, SOX2 was quantified using IHC and stratified with p16 to confirm that the prognosis was significantly divided. This finding was confirmed in the TCGA-HNSC dataset using the SOX2 mRNA expression level. This implies that SOX2, either by IHC scoring or measuring mRNA expression level, may be a potential prognostic marker for p16+ OPSCC. These results are in contrast to the known role of SOX2 because SOX2 is known to play an important role in maintaining the stemness of pluripotent stem cells, and many studies have reported that SOX2 is involved in cancer stem cell regulation [37]. A migrative, invasive and metastatic characteristic of tumors is the epithelial–mesenchymal transition (EMT), and SOX2 is well known to promote EMT in various cancers [6,37]. Nevertheless, whether the expression of SOX2 correlates with prognosis has not yet been determined, and the results vary from organ to organ, even in the head and neck cancer subsites [7,8,9,16,17,18,19]. For example, two studies showed the opposite results in HPV− HNSCC [38,39]. On the other hand, a meta-analysis revealed that SOX2 has poor outcomes [40]; however, SOX2 activation was associated with improved outcomes in the TCGA-HNSC dataset [19]. Specifically, higher SOX2 expression was reported to have better prognosis in oral cavity cancer [17,18], and the opposite result was reported in laryngeal cancer [16]. In their series, Dogan et al. reported that SOX2 overexpression was related to poor outcome only in HPV-OPSCC [13]. These varying results may be attributed to differences in patient groups for each study. Another possible reason may be that the interplay between multiple molecular factors may affect the course and severity of cancer [37].
In this study, one of the mechanisms underlying the poor prognosis of lower SOX2 IHC scores was that lower SOX2 scores were associated with advanced T classification (pT3 and -4), which was similar to other studies on oral cavity cancer [17,18]. Fu et al. considered SOX2 to play an important role in the early stages of tumorigenesis and that it was an independent prognostic marker [18]. However, contrary results have been reported; SOX2 expression was associated with large tumors [41]. In contrast to T classification, our data showed that N classification was not significantly correlated with SOX2. Studies on oral squamous cell cancer showed that the presence of nodal metastasis and lower SOX2 expression were associated [17,42], but not OPSCC for the patients in our study or TCGA-HNSC dataset. This result may be due to the small number of study populations or the anatomical difference between the oral cavity and oropharynx, but this cannot be concluded.
The second possible mechanism for the poor prognosis of lower SOX2 levels may be recurrence. When looking closely at the pattern of recurrence, the analysis revealed that SOX2 had a significant effect on locoregional recurrence independent of p16 expression level but not distant metastasis. In OPSCC, the results are still controversial, but there are several studies on the recurrence pattern according to the positivity of HPV [43,44,45]. However, SOX2 has not been discussed as much as HPV status. The results of this study suggest the role of SOX2 as a potential marker for the prediction of progression patterns. However, as a single institutional study, caution needs to be taken when interpreting the results and more evidence is needed.
Since evidence for p16 has been established, p16+ oropharyngeal cancer is generally regarded to have a better prognosis than p16−. In this study, the trend that p16+ had a better prognosis regardless of SOX2 score and mRNA expression level was confirmed, but there was no significant difference in 5-year OS and recurrence between p16+/SOX2Low and p16−/SOX2High in the TMA cohort and between HPV+/SOX2Low and HPV−/SOX2High in the TCGA−HNSC dataset. These data further imply that the combination of these markers might help with more precise molecular typing for HNSCC, either in p16+ or p16−. Similar results have not yet been previously questioned or reported. Since the study population was not sufficient, further analysis to draw conclusions cannot be done, but this should be confirmed in the future.
Cancer stem cell features are generally associated with higher radioresistance [46]. SOX2 is a regulatory marker of cancer stem cells, and accordingly, the association between SOX2 and radiosensitivity has been widely discussed [19,47,48,49]. Here, SOX2 showed a significant difference in OS and recurrence in patients receiving PORT; the prognosis of SOX2High was better in 5-year OS and recurrence. In the subgroup analysis by p16+/− with PORT+/−, however, these differences were not significant. Although not significant, it is noteworthy that the difference in prognosis between SOX2High and SOX2Low was more prominent in PORT+/p16− than PORT+/p16+. Because RT-related outcome was known to be worse in p16− oropharyngeal cancer than p16+ [50], SOX2 needs to be further investigated as a candidate prognosticator to precisely select RT as a treatment option, especially in p16− OPSCC. In the TCGA-HNSC dataset, the effect of RT and SOX2 on prognosis was not significant.
Recently, immunotherapy has been introduced in the treatment of head and neck cancers. As the oropharynx is an immune-privileged site, OPSCC can be a candidate for immunotherapy [51]. As TMB is one of the response predictors for immuno-oncologic (I-O) treatment [52,53], we traced the TMB in our four groups according to SOX2 and HPV status. Interestingly, HPV+/SOX2High, which showed the best prognosis, had a significantly lower TMB among groups (all p < 0.05). However, these groups with higher TMB and worse prognosis might be the groups for which I-O treatment would work. Moreover, HPV+/SOX2High might not be a good target for I-O treatment in terms of low TMB. In this case, other predictors might be combined to properly predict the response. Future trials are warranted.
There are several limitations in the study. The TMA cohort consists of patients who underwent surgery as an initial treatment and the results cannot be applied to all OPSCC patients. In addition, due to the relatively small number of populations, a larger-scaled prospective study is necessary to ensure the results of the study. Finally, given that we did not detect HPV infection directly through ISH, there may be a limit to interpreting the results because p16 does not guarantee the presence of HPV infection. However, the significance of this study may remain, given that HPV positivity of OPSCC is determined by p16 in the latest cancer staging manual [22].

5. Conclusions

In p16+ OPSCC, the SOX2 IHC score can be used as a marker to predict overall survival and recurrence. From analysis of the TCGA-HNSC dataset, SOX2 mRNA expression was also proven to be a biomarker to predict prognosis. However, the role of SOX2 has not yet been confirmed in p16- (HPV−) patients. T classification and the RT response are being considered as mechanisms for SOX2 to have different outcomes in p16+ OPSCC, however, further study is needed to prove.

Supplementary Materials

The following are available online at https://www.mdpi.com/2079-7737/9/11/387/s1. Figure S1: The score distribution of p16 and SOX immunohistochemistry from the tissue microarray cohort, Figure S2: Overall survival and recurrence according to the SOX2 IHC score in the TMA, Figure S3: Effect of SOX2 on overall survival and recurrence according to the classification with postoperative radiotherapy, Figure S4: Overall survival and recurrence according to SOX2 mRNA expression level in patients with oropharyngeal squamous cell carcinoma in TCGA, Figure S5: The survival rate and recurrence rate of patients who underwent radiotherapy (RT+) and the survival rate and recurrence rate of those who did not (RT−), Figure S6: The survival rate and recurrence rate of patients with higher SOX2 mRNA expression levels (SOX2High) and survival rate and recurrence rate of SOX2Low, Figure S7: Immune landscape of oropharyngeal cancers in the TCGA-HNSC dataset, Figure S8: The mRNA expression levels of three immune therapy-related markers (PD-1, PD-L1, and CTLA-4), Table S1: Risk analysis according to the pattern of recurrence using p16 and SOX2 in TMA datasets, Table S2: Demographics for 79 oropharyngeal cancer patients in the TCGA dataset, Table S3: Cox regression hazard ratio of SOX2 mRNA expression for 5-year overall survival and recurrence rate in TCGA-HNSC dataset.

Author Contributions

J.S.: formal analysis, funding acquisition and writing—original draft. C.H.R.: data curation. J.R.: data curation. J.-H.K.: data curation. S.-J.L.: methodology. W.S.P.: conceptualization and methodology. Y.-S.J.: conceptualization, funding acquisition, project administration and writing—review and editing. All authors have read and agreed to the published version of the manuscript.

Funding

This study was supported by the National Cancer Center Grant, Korea (NCCCDA2019-01) and the Basic Science Research Program, National Research Foundation, Ministry of Science and ICT, Future Planning, Korea (NRF-2031130-1). The authors have no financial ties to disclose.

Acknowledgments

The results shown here are in whole or part based upon data generated by the TCGA Research Network: https://www.cancer.gov/tcga.

Conflicts of Interest

The authors declare no conflict of interest.

References

  1. Ferlay, J.; Lam, F.; Colombet, M.; Mery, L.; Pineros, M.; Znaor, A. Global Cancer Observatory: Cancer Today. Lyon Fr. Int. Agency Res. Cancer 2020. Available online: https://gco.iarc.fr/today (accessed on 17 March 2020).
  2. Vigneswaran, N.; Williams, M.D. Epidemiologic Trends in Head and Neck Cancer and Aids in Diagnosis. Oral Maxillofac. Surg. Clin. North Am. 2014, 26, 123–141. [Google Scholar] [CrossRef] [PubMed]
  3. Budach, V.; Tinhofer, I. Novel prognostic clinical factors and biomarkers for outcome prediction in head and neck cancer: A systematic review. Lancet Oncol. 2019, 20, e313–e326. [Google Scholar] [CrossRef]
  4. Jou, A.; Hess, J. Epidemiology and Molecular Biology of Head and Neck Cancer. Oncol. Res. Treat. 2017, 40, 328–332. [Google Scholar] [CrossRef] [PubMed]
  5. Leemans, C.R.; Snijders, P.J.F.; Brakenhoff, R.H. The molecular landscape of head and neck cancer. Nat. Rev. Cancer 2018, 18, 269–282. [Google Scholar] [CrossRef] [PubMed]
  6. Hüser, L.; Novak, D.; Umansky, V.; Altevogt, P.; Utikal, J.S. Targeting SOX2 in anticancer therapy. Expert Opin. Ther. Targets 2018, 22, 983–991. [Google Scholar] [CrossRef]
  7. Bass, A.J.; Watanabe, H.; Mermel, C.H.; Yu, S.; Perner, S.; Verhaak, R.G.; Kim, S.Y.; Wardwell, L.; Tamayo, P.; Gat-Viks, I.; et al. SOX2 is an amplified lineage-survival oncogene in lung and esophageal squamous cell carcinomas. Nat. Genet. 2009, 41, 1238–1242. [Google Scholar] [CrossRef]
  8. Wuebben, E.L.; Rizzino, A. The dark side of SOX2: Cancer-a comprehensive overview. Oncotarget 2017, 8, 44917–44943. [Google Scholar] [CrossRef] [Green Version]
  9. Bayo, P.; Jou, A.; Stenzinger, A.; Shao, C.; Gross, M.; Jensen, A.; Grabe, N.; Herold-Mende, C.; Rados, P.V.; Debus, J.; et al. Loss of SOX2 expression induces cell motility via vimentin up-regulation and is an unfavorable risk factor for survival of head and neck squamous cell carcinoma. Mol. Oncol. 2015, 9, 1704–1719. [Google Scholar] [CrossRef] [PubMed]
  10. Piva, M.; Domenici, G.; Iriondo, O.; Rábano, M.; Simões, B.M.; Comaills, V.; Barredo, I.; López-Ruiz, J.A.; Zabalza, I.; Kypta, R.; et al. Sox2 promotes tamoxifen resistance in breast cancer cells. EMBO Mol. Med. 2013, 6, 66–79. [Google Scholar] [CrossRef]
  11. Lundberg, I.V.; Edin, S.; Eklöf, V.; Öberg, Å.; Palmqvist, R.; Wikberg, M.L. SOX2 expression is associated with a cancer stem cell state and down-regulation of CDX2 in colorectal cancer. BMC Cancer 2016, 16, 1–11. [Google Scholar] [CrossRef] [Green Version]
  12. Chen, Y.; Huang, Y.; Zhu, L.; Chen, M.; Huang, Y.; Zhang, J.; He, S.; Li, A.; Chen, R.; Zhou, J. SOX2 inhibits metastasis in gastric cancer. J. Cancer Res. Clin. Oncol. 2016, 142, 1221–2130. [Google Scholar] [CrossRef] [PubMed]
  13. Dogan, S.; Xu, B.; Middha, S.; Vanderbilt, C.M.; Bowman, A.S.; Migliacci, J.; Morris, L.G.; Seshan, V.E.; Ganly, I. Identification of prognostic molecular biomarkers in 157 HPV-positive and HPV-negative squamous cell carcinomas of the oropharynx. Int. J. Cancer 2019, 145, 3152–3162. [Google Scholar] [CrossRef] [Green Version]
  14. Vokač, N.K.; Ćižmarević, B.; Zagorac, A.; Zagradišnik, B.; Lanišnik, B. An evaluation of SOX2 and hTERC gene amplifications as screening markers in oral and oropharyngeal squamous cell carcinomas. Mol. Cytogenet. 2014, 7, 5. [Google Scholar] [CrossRef] [Green Version]
  15. Freier, K.; Knoepfle, K.; Flechtenmacher, C.; Pungs, S.; Devens, F.; Toedt, G.; Hofele, C.; Joos, S.; Lichter, P.; Radlwimmer, B. Recurrent copy number gain of transcription factorSOX2and corresponding high protein expression in oral squamous cell carcinoma. Genes Chromosom. Cancer 2010, 49, 9–16. [Google Scholar] [CrossRef]
  16. Tang, X.-B.; Shen, X.-H.; Li, L.; Zhang, Y.-F.; Chen, G. SOX2 overexpression correlates with poor prognosis in laryngeal squamous cell carcinoma. Auris Nasus Larynx 2013, 40, 481–486. [Google Scholar] [CrossRef]
  17. Fu, T.-Y.; Hsieh, I.-C.; Cheng, J.-T.; Tsai, M.-H.; Hou, Y.-Y.; Lee, J.-H.; Liou, H.-H.; Huang, S.-F.; Chen, H.-C.; Yen, L.-M.; et al. Association of OCT4, SOX2, and NANOG expression with oral squamous cell carcinoma progression. J. Oral Pathol. Med. 2015, 45, 89–95. [Google Scholar] [CrossRef]
  18. Pradhan, S.; Guddattu, V.; Solomon, M. Association of the co-expression of SOX2 and Podoplanin in the progression of oral squamous cell carcinomas-an immunohistochemical study. J. Appl. Oral Sci. 2019, 27, e20180348. [Google Scholar] [CrossRef]
  19. Chung, J.H.; Jung, H.R.; Jung, A.R.; Lee, Y.C.; Kong, M.; Lee, J.-S.; Eun, Y.-G. SOX2 activation predicts prognosis in patients with head and neck squamous cell carcinoma. Sci. Rep. 2018, 8, 1677. [Google Scholar] [CrossRef] [Green Version]
  20. Gillison, M.L. Human papillomavirus-associated head and neck cancer is a distinct epidemiologic, clinical, and molecular entity. Semin. Oncol. 2004, 31, 744–754. [Google Scholar] [CrossRef]
  21. Preti, M.; Rotondo, J.C.; Holzinger, D.; Micheletti, L.; Gallio, N.; McKay-Chopin, S.; Carreira, C.; Privitera, S.S.; Watanabe, R.; Ridder, R.; et al. Role of human papillomavirus infection in the etiology of vulvar cancer in Italian women. Infect. Agents Cancer 2020, 15, 1–8. [Google Scholar] [CrossRef] [PubMed] [Green Version]
  22. Lydiatt, W.M.; Patel, S.G.; O’Sullivan, B.; Brandwein, M.S.; Ridge, J.A.; Migliacci, J.C.; Loomis, A.M.; Shah, J.P. Head and neck cancers-major changes in the American Joint Committee on cancer eighth edition cancer staging manual. CA Cancer J. Clin. 2017, 67, 122–137. [Google Scholar] [CrossRef]
  23. Vogel, U.F.; Bueltmann, B.D. Simple, inexpensive, and precise paraffin tissue microarrays constructed with a conventional microcompound table and a drill grinder. Am. J. Clin. Pathol. 2006, 126, 342–348. [Google Scholar] [CrossRef]
  24. Park, W.S.; Ryu, J.; Cho, K.H.; Choi, M.K.; Moon, S.H.; Yun, T.; Chun, B.-S.; Lee, G.K.; Ahn, H.J.; Lee, J.H.; et al. Human papillomavirus in oropharyngeal squamous cell carcinomas in korea: Use of G1 cycle markers as new prognosticators. Head Neck 2011, 34, 1408–1417. [Google Scholar] [CrossRef]
  25. Hänzelmann, S.; Castelo, R.; Guinney, J. GSVA: Gene set variation analysis for microarray and RNA-Seq data. BMC Bioinform. 2013, 14, 7. [Google Scholar] [CrossRef] [Green Version]
  26. Liu, Z.; Li, M.; Jiang, Z.; Wang, X. A Comprehensive Immunologic Portrait of Triple-Negative Breast Cancer. Transl. Oncol. 2018, 11, 311–329. [Google Scholar] [CrossRef] [PubMed]
  27. Heagerty, P.J.; Saha-Chaudhuri, P.; Saha-Chaudhuri, M.P. Package ‘survivalROC’. 2013. Available online: http://www2.uaem.mx/r-mirror/web/packages/survivalROC/survivalROC.pdf (accessed on 15 February 2013).
  28. Chaturvedi, A.K.; Engels, E.A.; Pfeiffer, R.M.; Hernandez, B.Y.; Xiao, W.; Kim, E.; Jiang, B.; Goodman, M.T.; Sibug-Saber, M.; Cozen, W.; et al. Human Papillomavirus and Rising Oropharyngeal Cancer Incidence in the United States. J. Clin. Oncol. 2011, 29, 4294–4301. [Google Scholar] [CrossRef]
  29. Economopoulou, P.; Perisanidis, C.; Giotakis, E.I.; Psyrri, A. The emerging role of immunotherapy in head and neck squamous cell carcinoma (HNSCC): Anti-tumor immunity and clinical applications. Ann. Transl. Med. 2016, 4, 173. [Google Scholar] [CrossRef] [Green Version]
  30. Yamano, Y.; Uzawa, K.; Saito, K.; Nakashima, D.; Kasamatsu, A.; Koike, H.; Kouzu, Y.; Shinozuka, K.; Nakatani, K.; Negoro, K.; et al. Identification of cisplatin-resistance related genes in head and neck squamous cell carcinoma. Int. J. Cancer 2010, 126, 437–449. [Google Scholar] [CrossRef] [PubMed]
  31. Wang, M.B.; Liu, I.Y.; Gornbein, J.A.; Nguyen, C.T. HPV-Positive Oropharyngeal Carcinoma: A Systematic Review of Treatment and Prognosis. Otolaryngol. Neck Surg. 2015, 153, 758–769. [Google Scholar] [CrossRef]
  32. Moshi, J.M.; Hoogduin, K.J.; Ummelen, M.; Henfling, M.E.R.; Van Engeland, M.; Wouters, K.A.D.; Stoop, H.; Demers, I.; Looijenga, L.H.J.; Ramaekers, F.C.S.; et al. Switches of SOX17 and SOX2 expression in the development of squamous metaplasia and squamous intraepithelial lesions of the uterine cervix. Cancer Med. 2020, 9, 6330–6343. [Google Scholar] [CrossRef]
  33. Gut, A.; Moch, H.; Choschzick, M. SOX2 Gene Amplification and Overexpression is Linked to HPV-positive Vulvar Carcinomas. Int. J. Gynecol. Pathol. 2018, 37, 68–73. [Google Scholar] [CrossRef] [PubMed] [Green Version]
  34. Martínez-Ramírez, I.; Del-Castillo-Falconi, V.; Mitre-Aguilar, I.B.; Amador-Molina, A.; Carrillo-García, A.; Langley, E.; Zentella-Dehesa, A.; Soto-Reyes, E.; García-Carrancá, A.; Herrera, L.A.; et al. SOX2 as a New Regulator of HPV16 Transcription. Viruses 2017, 9, 175. [Google Scholar] [CrossRef]
  35. Kenudson, M.M. Immunohistochemistry for predictive biomarkers in non-small cell lung cancer. Transl. Lung Cancer Res. 2017, 6, 570–587. [Google Scholar] [CrossRef] [Green Version]
  36. Khotskaya, Y.B.; Mills, G.B.; Shaw, K.R.M. Next-Generation Sequencing and Result Interpretation in Clinical Oncology: Challenges of Personalized Cancer Therapy. Annu. Rev. Med. 2017, 68, 113–125. [Google Scholar] [CrossRef]
  37. Novak, D.; Hüser, L.; Elton, J.J.; Umansky, V.; Altevogt, P.; Utikal, J. SOX2 in development and cancer biology. Semin. Cancer Biol. 2019. [Google Scholar] [CrossRef] [PubMed]
  38. Baumeister, P.; Hollmann, A.; Kitz, J.; Afthonidou, A.; Simon, F.; Shakhtour, J.; Mack, B.; Kranz, G.; Libl, D.; Leu, M.; et al. High Expression of EpCAM and Sox2 is a Positive Prognosticator of Clinical Outcome for Head and Neck Carcinoma. Sci. Rep. 2018, 8, 1–15. [Google Scholar] [CrossRef] [Green Version]
  39. Schröck, A.; Bode, M.; Göke, F.J.M.; Bareiss, P.M.; Schairer, R.; Wang, H.; Weichert, W.; Franzen, A.; Kirsten, R.; Van Bremen, T.; et al. Expression and role of the embryonic protein SOX2 in head and neck squamous cell carcinoma. Carcinogenesis 2014, 35, 1636–1642. [Google Scholar] [CrossRef]
  40. Dong, Z.; Liu, G.; Huang, B.; Sun, J.; Wu, D. Prognostic significance of SOX2 in head and neck cancer: A meta-analysis. Int. J. Clin. Exp. Med. 2014, 7, 5010–5020. [Google Scholar]
  41. Du, L.; Yang, Y.; Xiao, X.; Wang, C.; Zhang, X.; Wang, L.; Zhang, X.; Li, W.; Zheng, G.; Wang, S.; et al. Sox2 nuclear expression is closely associated with poor prognosis in patients with histologically node-negative oral tongue squamous cell carcinoma. Oral Oncol. 2011, 47, 709–713. [Google Scholar] [CrossRef] [PubMed]
  42. Züllig, L.; Roessle, M.; Weber, C.; Graf, N.; Haerle, S.; Jochum, W.; Stoeckli, S.; Moch, H.; Huber, G. High sex determining region Y-box 2 expression is a negative predictor of occult lymph node metastasis in early squamous cell carcinomas of the oral cavity. Eur. J. Cancer 2013, 49, 1915–1922. [Google Scholar] [CrossRef] [Green Version]
  43. Nguyen-Tan, P.F.; Zhang, Q.; Ang, K.K.; Weber, R.S.; Rosenthal, D.I.; Soulieres, D.; Kim, H.; Silverman, C.; Raben, A.; Galloway, T.J.; et al. Randomized Phase III Trial to Test Accelerated Versus Standard Fractionation in Combination with Concurrent Cisplatin for Head and Neck Carcinomas in the Radiation Therapy Oncology Group 0129 Trial: Long-Term Report of Efficacy and Toxicity. J. Clin. Oncol. 2014, 32, 3858–3867. [Google Scholar] [CrossRef] [PubMed]
  44. Guo, T.; Qualliotine, J.R.; Nishant, A.; Califano, J.A.; Kim, Y.; Saunders, J.R.; Blanco, R.G.; D’Souza, G.; Zhang, Z.; Chung, C.H.; et al. Surgical salvage improves overall survival for patients with HPV-positive and HPV-negative recurrent locoregional and distant metastatic oropharyngeal cancer. Cancer 2015, 121, 1977–1984. [Google Scholar] [CrossRef]
  45. Sinha, P.; Thorstad, W.; Nussenbaum, B.; Haughey, B.; Adkins, D.R.; Kallogjeri, D.; Lewis, J.S., Jr. Distant metastasis in p16-positive oropharyngeal squamous cell carcinoma: A critical analysis of patterns and outcomes. Oral Oncol. 2014, 50, 45–51. [Google Scholar] [CrossRef] [Green Version]
  46. Saigusa, S.; Tanaka, K.; Toiyama, Y.; Yokoe, T.; Okugawa, Y.; Ioue, Y.; Miki, C.; Kusunoki, M. Correlation of CD133, OCT4, and SOX2 in Rectal Cancer and Their Association with Distant Recurrence after Chemoradiotherapy. Ann. Surg. Oncol. 2009, 16, 3488–3498. [Google Scholar] [CrossRef]
  47. Chou, M.-Y.; Hu, F.-W.; Yu, C.-H.; Yu, C.-C. Sox2 expression involvement in the oncogenicity and radiochemoresistance of oral cancer stem cells. Oral Oncol. 2015, 51, 31–39. [Google Scholar] [CrossRef]
  48. Huang, C.; Lu, H.; Li, J.; Xie, X.; Fan, L.; Wang, N.; Tan, W.; Wang, Y.; Lin, Z.; Yao, T. SOX2 regulates radioresistance in cervical cancer via the hedgehog signaling pathway. Gynecol. Oncol. 2018, 151, 533–541. [Google Scholar] [CrossRef]
  49. Shen, L.; Huang, X.; Xie, X.; Su, J.; Yuan, J.; Chen, X. High Expression of SOX2 and OCT4 Indicates Radiation Resistance and an Independent Negative Prognosis in Cervical Squamous Cell Carcinoma. J. Histochem. Cytochem. 2014, 62, 499–509. [Google Scholar] [CrossRef]
  50. Lassen, P.; Primdahl, H.; Johansen, J.; Kristensen, C.A.; Andersen, E.; Andersen, L.J.; Evensen, J.F.; Eriksen, J.G.; Overgaard, J. Impact of HPV-associated p16-expression on radiotherapy outcome in advanced oropharynx and non-oropharynx cancer. Radiother. Oncol. 2014, 113, 310–316. [Google Scholar] [CrossRef] [Green Version]
  51. Hay, A.; Nixon, I.J. Recent advances in the understanding and management of oropharyngeal cancer. F1000Research 2018, 7. [Google Scholar] [CrossRef]
  52. Steuer, C.E.; Ramalingam, S.S. Tumor Mutation Burden: Leading Immunotherapy to the Era of Precision Medicine? J. Clin. Oncol. 2018, 36, 631–632. [Google Scholar] [CrossRef]
  53. Goodman, A.M.; Kato, S.; Bazhenova, L.; Patel, S.P.; Frampton, G.M.; Miller, V.; Stephens, P.J.; Daniels, G.A.; Kurzrock, R. Tumor Mutational Burden as an Independent Predictor of Response to Immunotherapy in Diverse Cancers. Mol. Cancer Ther. 2017, 16, 2598–2608. [Google Scholar] [CrossRef] [PubMed] [Green Version]
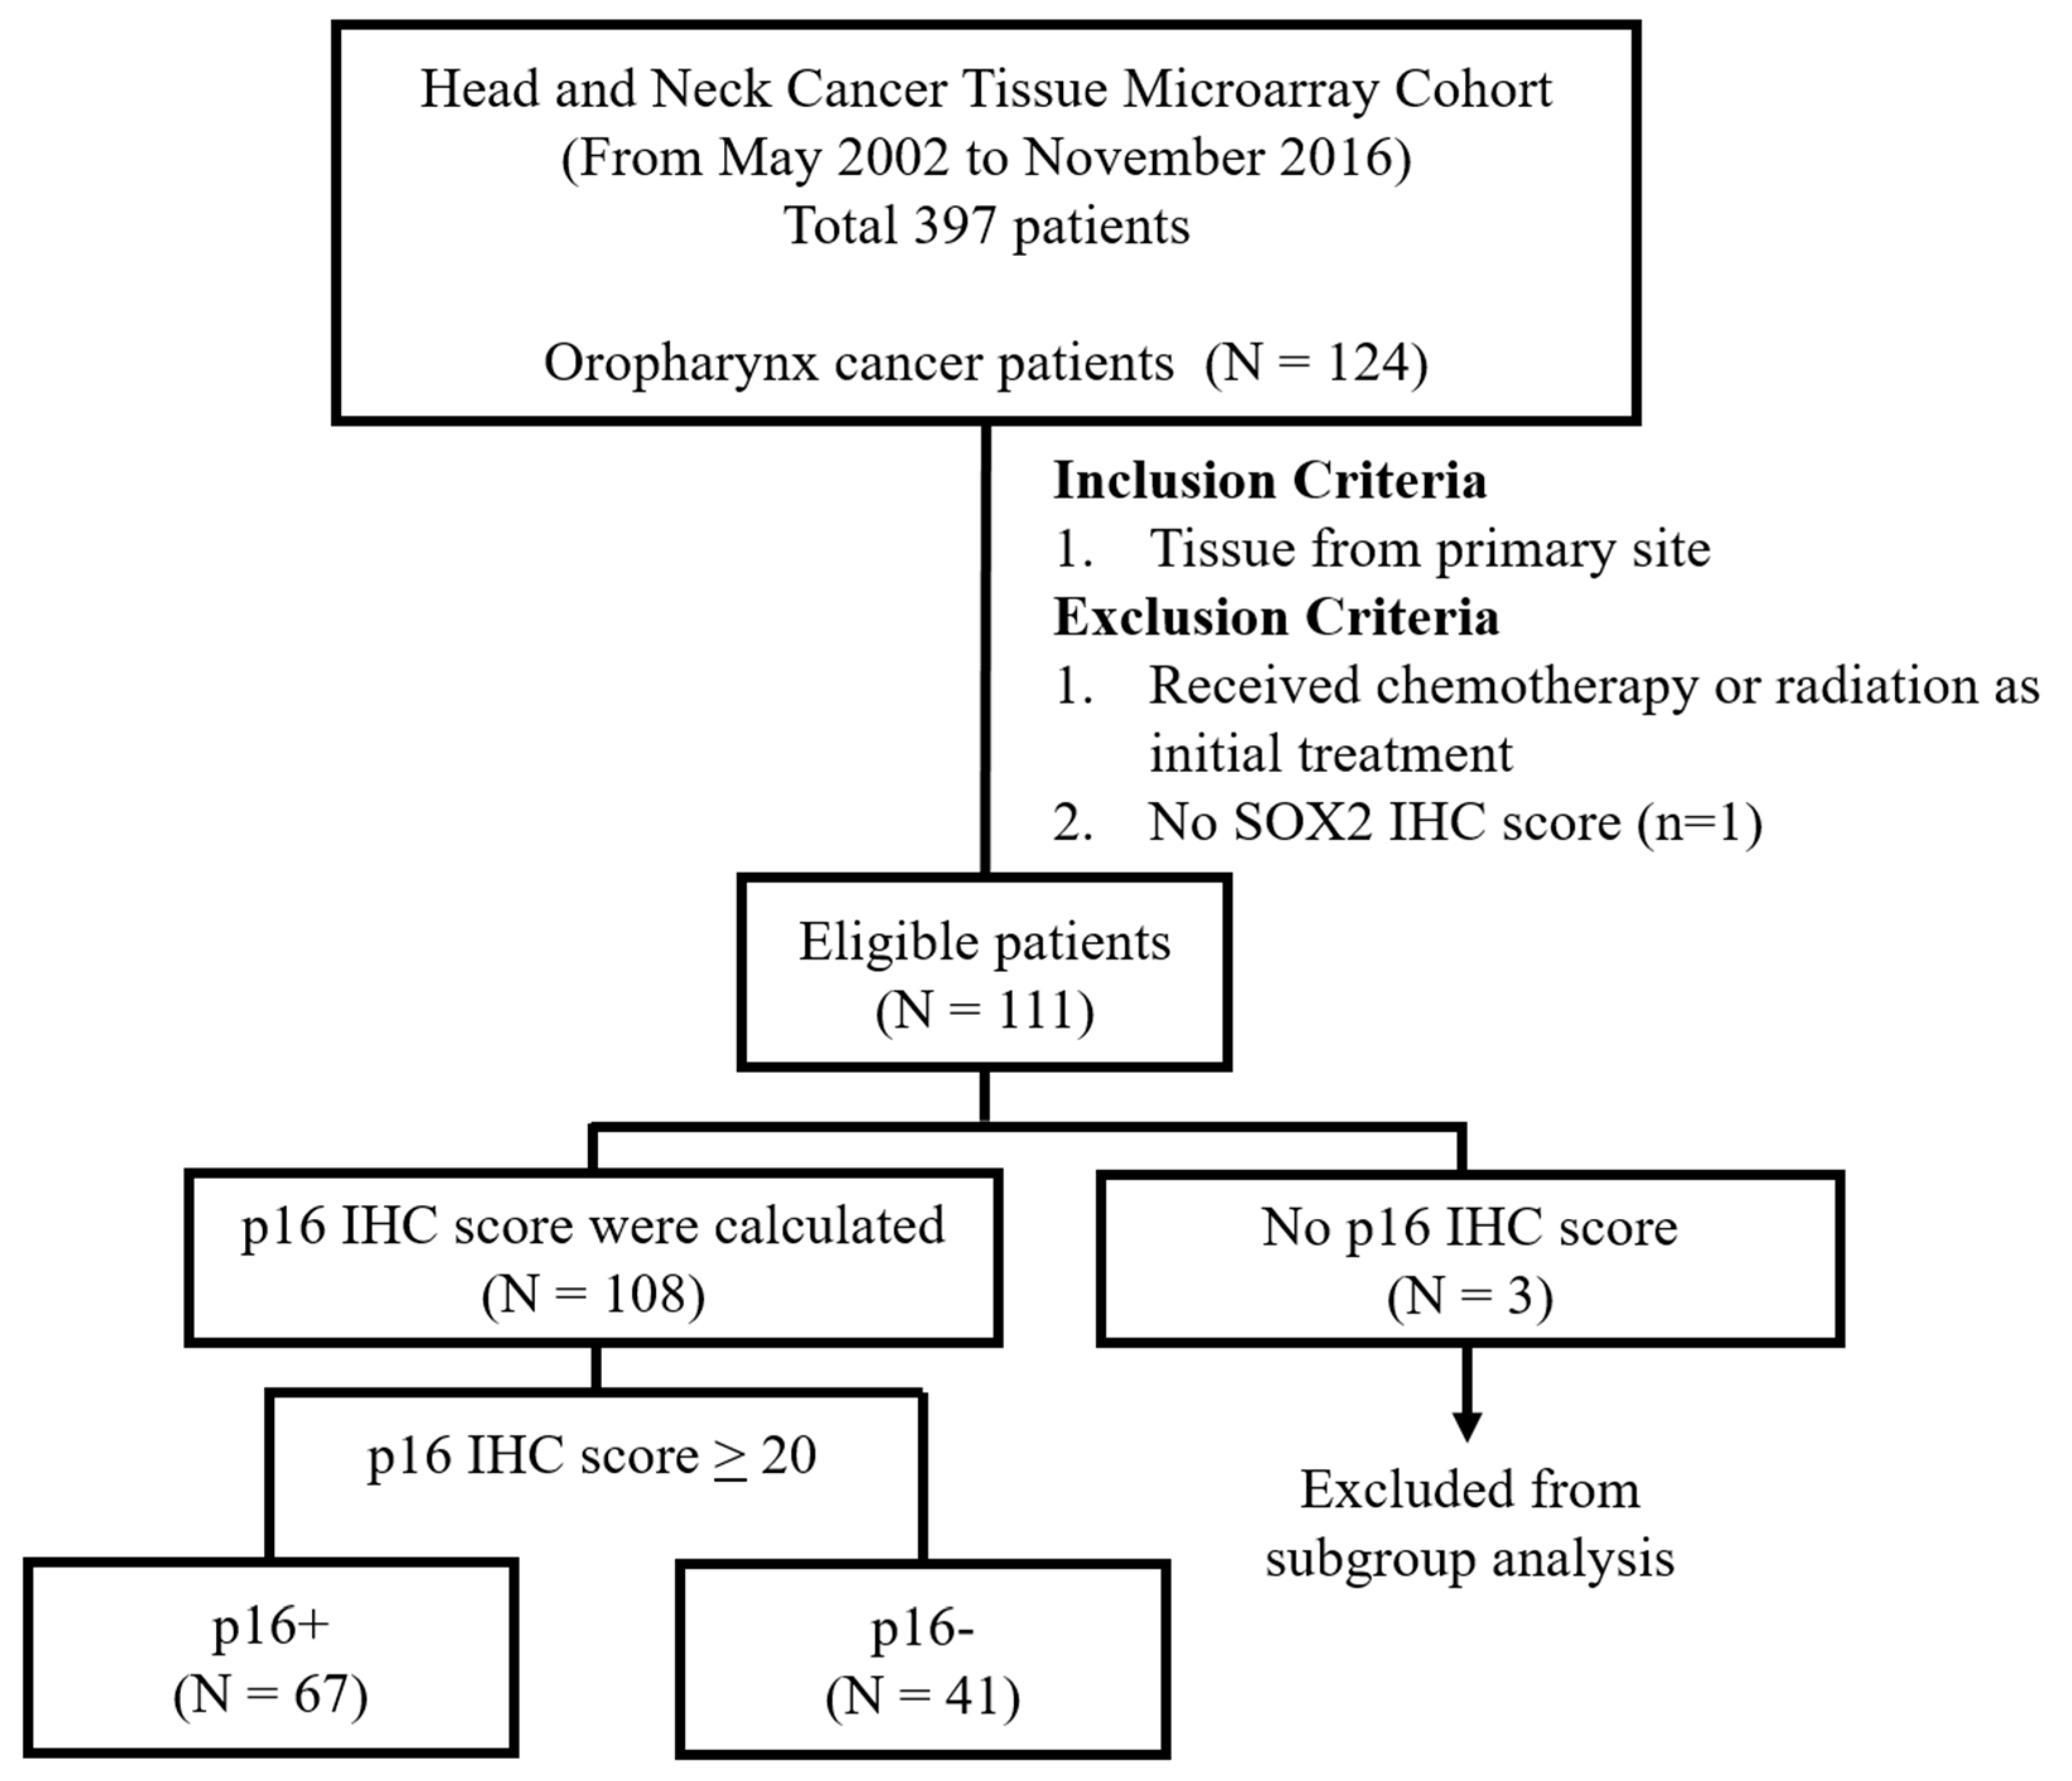
Figure 1. Schematic diagram of the study design.
Biology 09 00387 g001
Figure 2. Exemplary images of SOX2 immunohistochemistry staining in tonsil tissue and their corresponding scores ((A): 30, (B): 20, (C): 10 and (D): 0).
Biology 09 00387 g002
Figure 3. SOX2 IHC scores according to pathological T classification (A) and pathological N classification (B). *** p < 0.001.
Biology 09 00387 g003
Figure 4. Survival and recurrence in four groups classified by p16+/− and SOX2High/Low. (A) The 5-year overall survival (OS) and number at risk table. (B) The 5-year recurrence and number at risk table. Pairwise log-rank test as a post hoc analysis for 5-year OS (C) and recurrence (D).
Biology 09 00387 g004
Figure 5. Prognosis according to SOX2 score and postoperative radiotherapy (PORT). In the PORT+ group, the expression level of SOX2 had a significant effect on survival (A) and recurrence (B). However, in the PORT- group, it did not significantly affect the survival (C) and recurrence (D).
Biology 09 00387 g005
Figure 6. Survival and recurrence in four groups classified by HPV+/− and SOX2High/Low in TCGA dataset. (A) The 5-year overall survival (OS) and number at risk table. (B) The 5-year recurrence and number at risk table. Pairwise log-rank test as a post hoc analysis for 5-year OS (C) and recurrence (D).
Biology 09 00387 g006
Figure 7. HPV+/SOX2High scored significantly lower tumor mutation burden (** p < 0.01; * p < 0.05).
Biology 09 00387 g007
Table 1. Demographics for 111 oropharyngeal cancer patients. Three patients without p16 immunohistochemistry (IHC) scores were excluded from the subgroup analysis.
Total
(n = 111)
p16+
(n = 67)
p16−
(n = 41)
p
Age at operation (years)Avg. ± SD59.5 ± 10.857.0 ± 9.364.3 ± 11.3<0.001 *
SexMale97 (87.4%)57 (85.1%)38 (92.7%)0.363
Female14 (12.6%)10 (14.9%)3 (7.3%)
SmokingYes85 (76.6%)46 (68.7%)37 (90.2%)0.010 ††
No26 (23.4%)21 (31.3%)4 (9.8%)
SubsiteTonsil89 (80.2%)59 (88.1%)27 (65.9%)0.007 ††
Base of tongue13 (11.7%)7 (10.4%)6 (14.6%)
Soft palate6 (5.4%)1 (1.5%)5 (12.2%)
Uvula3 (2.7%)0 (0.0%)3 (7.3%)
T classificationpT3 and -419 (17.1%)6 (9.0%)13 (31.7%)0.003 ††
pT1 and -292 (82.9%)61 (91.0%)28 (68.3%)
Nodal statuspN+68 (61.3%)47 (70.1%)20 (48.8%)0.060 ††
pN−35 (31.5%)18 (26.9%)17 (41.5%)
pNx (cN0)8 (7.2%)2 (3.0%)4 (9.8%)
Postoperative radiotherapyYes78 (70.5%)55 (80.9%)22 (53.7%)0.003 ††
No33 (29.5%)13 (19.1%)19 (46.3%)
Follow-up duration (year)Median [IQR]4.6 [2.3–6.8]5.4 [3.5–7.3]2.3 [1.1–4.1]<0.001 §
RecurrenceRecurred28 (25.2%)7 (10.4%)20 (48.8%)0.007 ††
NED ≥ 3 years80 (72.1%)59 (88.1%)19 (46.3%)
PD or f/u loss3 (2.7%)1 (1.5%)2 (2.9%)
SurvivalNED63 (56.8%)51 (76.1%)10 (24.4%)
AWD6 (5.4%)0 (0.0%)5 (12.2%)
DOD23 (20.8%)7 (10.5%)16 (3.9%)
DOC17 (15.2%)8 (11.9%)9 (22.0%)
f/u loss2 (1.3%)1 (1.5%)1 (2.5%)
SOX2 IHC scoreHigh3074 (66.7%)47 (70.1%)24 (58.5%)0.157 ††
25–296 (5.4%)4 (6.0%)2 (4.9%)
Low2015 (13.5%)10 (14.9%)5 (12.2%)
1013 (11.7%)4 (6.0%)9 (22.0%)
<53 (2.7%)2 (3.0%)1 (2.4%)
Avg., average; SD, standard deviation; IQR, interquartile range; NED, no evidence of disease; PD, progression disease; IHC, immunohistochemistry; * Welch Two-Sample t-test, Fisher’s exact test, †† Chi-square test, § Wilcox rank sum test.
Table 2. Relationship between SOX2 immunohistochemistry score and pathologic T classification (pT) according to p16+ and p16−.
p16+ Oropharyngeal Cancer (n = 67)p16− Oropharyngeal Cancer (n = 41)
pT1 and -2pT3 and -4p *pT1 and -2pT3 and -4p *
SOX2High50 (82.0%)1 (16.7%)0.00120 (71.4%)6 (46.2%)0.169
SOX2Low11 (18.0%)5 (83.3%)8 (28.6%)7 (53.8%)
* Fisher’s exact test.
Table 3. Risk factor analysis for 5-year overall survival and recurrence in tumor microarray cohort.
5-Year Overall Survival5-Year Recurrence
HR (95% CI)p *HR (95% CI)p *
Univariate Analysis
p16− (vs. p16+)6.16 (2.83–13.4)<0.0016.79 (2.98–15.5)<0.001
SOX2Low (vs. SOX2High)2.39 (1.19–4.81]0.0152.72 (1.32–5.59)0.005
PORT− (vs. PORT+)2.70 (1.34–5.41)0.0042.02 (0.96–4.24)0.065
Multivariate Analysis
p16− (vs. p16+)5.87 (2.69–12.8)<0.0016.26 (2.73–14.4)<0.001
SOX2Low (vs. SOX2High)1.99 (0.99–4.04)0.0542.33 (1.11–4.89)0.025
PORT− (vs. PORT+)>0.05>0.05
HR, hazard ratio; CI, confidence interval; PORT, postoperative radiotherapy; * Cox proportional hazard ratio model.
Table 4. Risk factor analysis for 5-year overall survival and recurrence in The Cancer Genome Atlas Head–Neck Squamous Cell Carcinoma (TCGA-HNSC) dataset.
5-Year Overall Survival5-Year Recurrence
HR (95% CI)p *HR (95% CI)p *
Univariate Analysis
HPV− (vs. HPV+)7.11 (2.45–20.6)<0.0015.97 (2.33–15.3)<0.001
SOX2Low (vs. SOX2High)8.98 (3.08–26.2)<0.0012.82 (1.12–7.09)0.028
RT− (vs. RT+)>0.05>0.05
Multivariate Analysis
HPV − (vs. HPV +)3.24 (0.96–10.9)0.0595.56 (1.95–15.9)0.001
SOX2Low (vs. SOX2High)4.87 (1.44–16.5)0.0111.17 (0.43–3.22)0.759
HR, hazard ratio; CI, confidence interval; RT, radiotherapy; * Cox proportional hazard ratio model.
Publisher’s Note: MDPI stays neutral with regard to jurisdictional claims in published maps and institutional affiliations.