Parsimony and Model-Based Analyses of Indels in Avian Nuclear Genes Reveal Congruent and Incongruent Phylogenetic Signals


Abstract
:
1. Introduction
2. Methods
2.1. DNA Sequence Data, Alignment and Gap Coding
2.2. Phylogenetic Analyses
2.2.1. Parsimony Analyses
2.2.2. Likelihood Analyses
2.2.3. Combined Analyses of Nucleotides and Gaps
2.3. Evaluating the Results of Phylogenetic Analyses Using Gap Characters
2.3.1. Evaluating the Gap Phylogeny Using Congruence

| Support from Independent Evidence | ||||
|---|---|---|---|---|
| Clade | Name | Mitochondrial | Other Nuclear | TE insertions |
| A | Psittacopasserae [60] | — | + | ++ |
| B | Eufalconimorphae [60] | — | — | ++ |
| C | Australaves [66] (PPFC clade [30]) | — | + | + |
| D | Picodynastornithes | — | ++ | |
| E | Picocoraciae [68] | — | ++ | |
| F | Eucavitaves (CPBT clade [30]) | ++ | ++ | |
| G | Cavitaves | |||
| H | Telluraves (“Landbirds” [13]) | — | ++ | + |
| I | Litoritelluraves | — | + | + |
| J | Austrodyptornithes | + | ||
| K | Aequornithes [68] (“Waterbirds” [13]) | ++ | ||
| L | Insolitaves | — | — | |
| M | Strisores [67] (Cypselomorphae) | + | ||
| N | Novaeratitae | ++ | ++ | + |
| O | Notopalaeognathae | ++ | ++ | ++ |
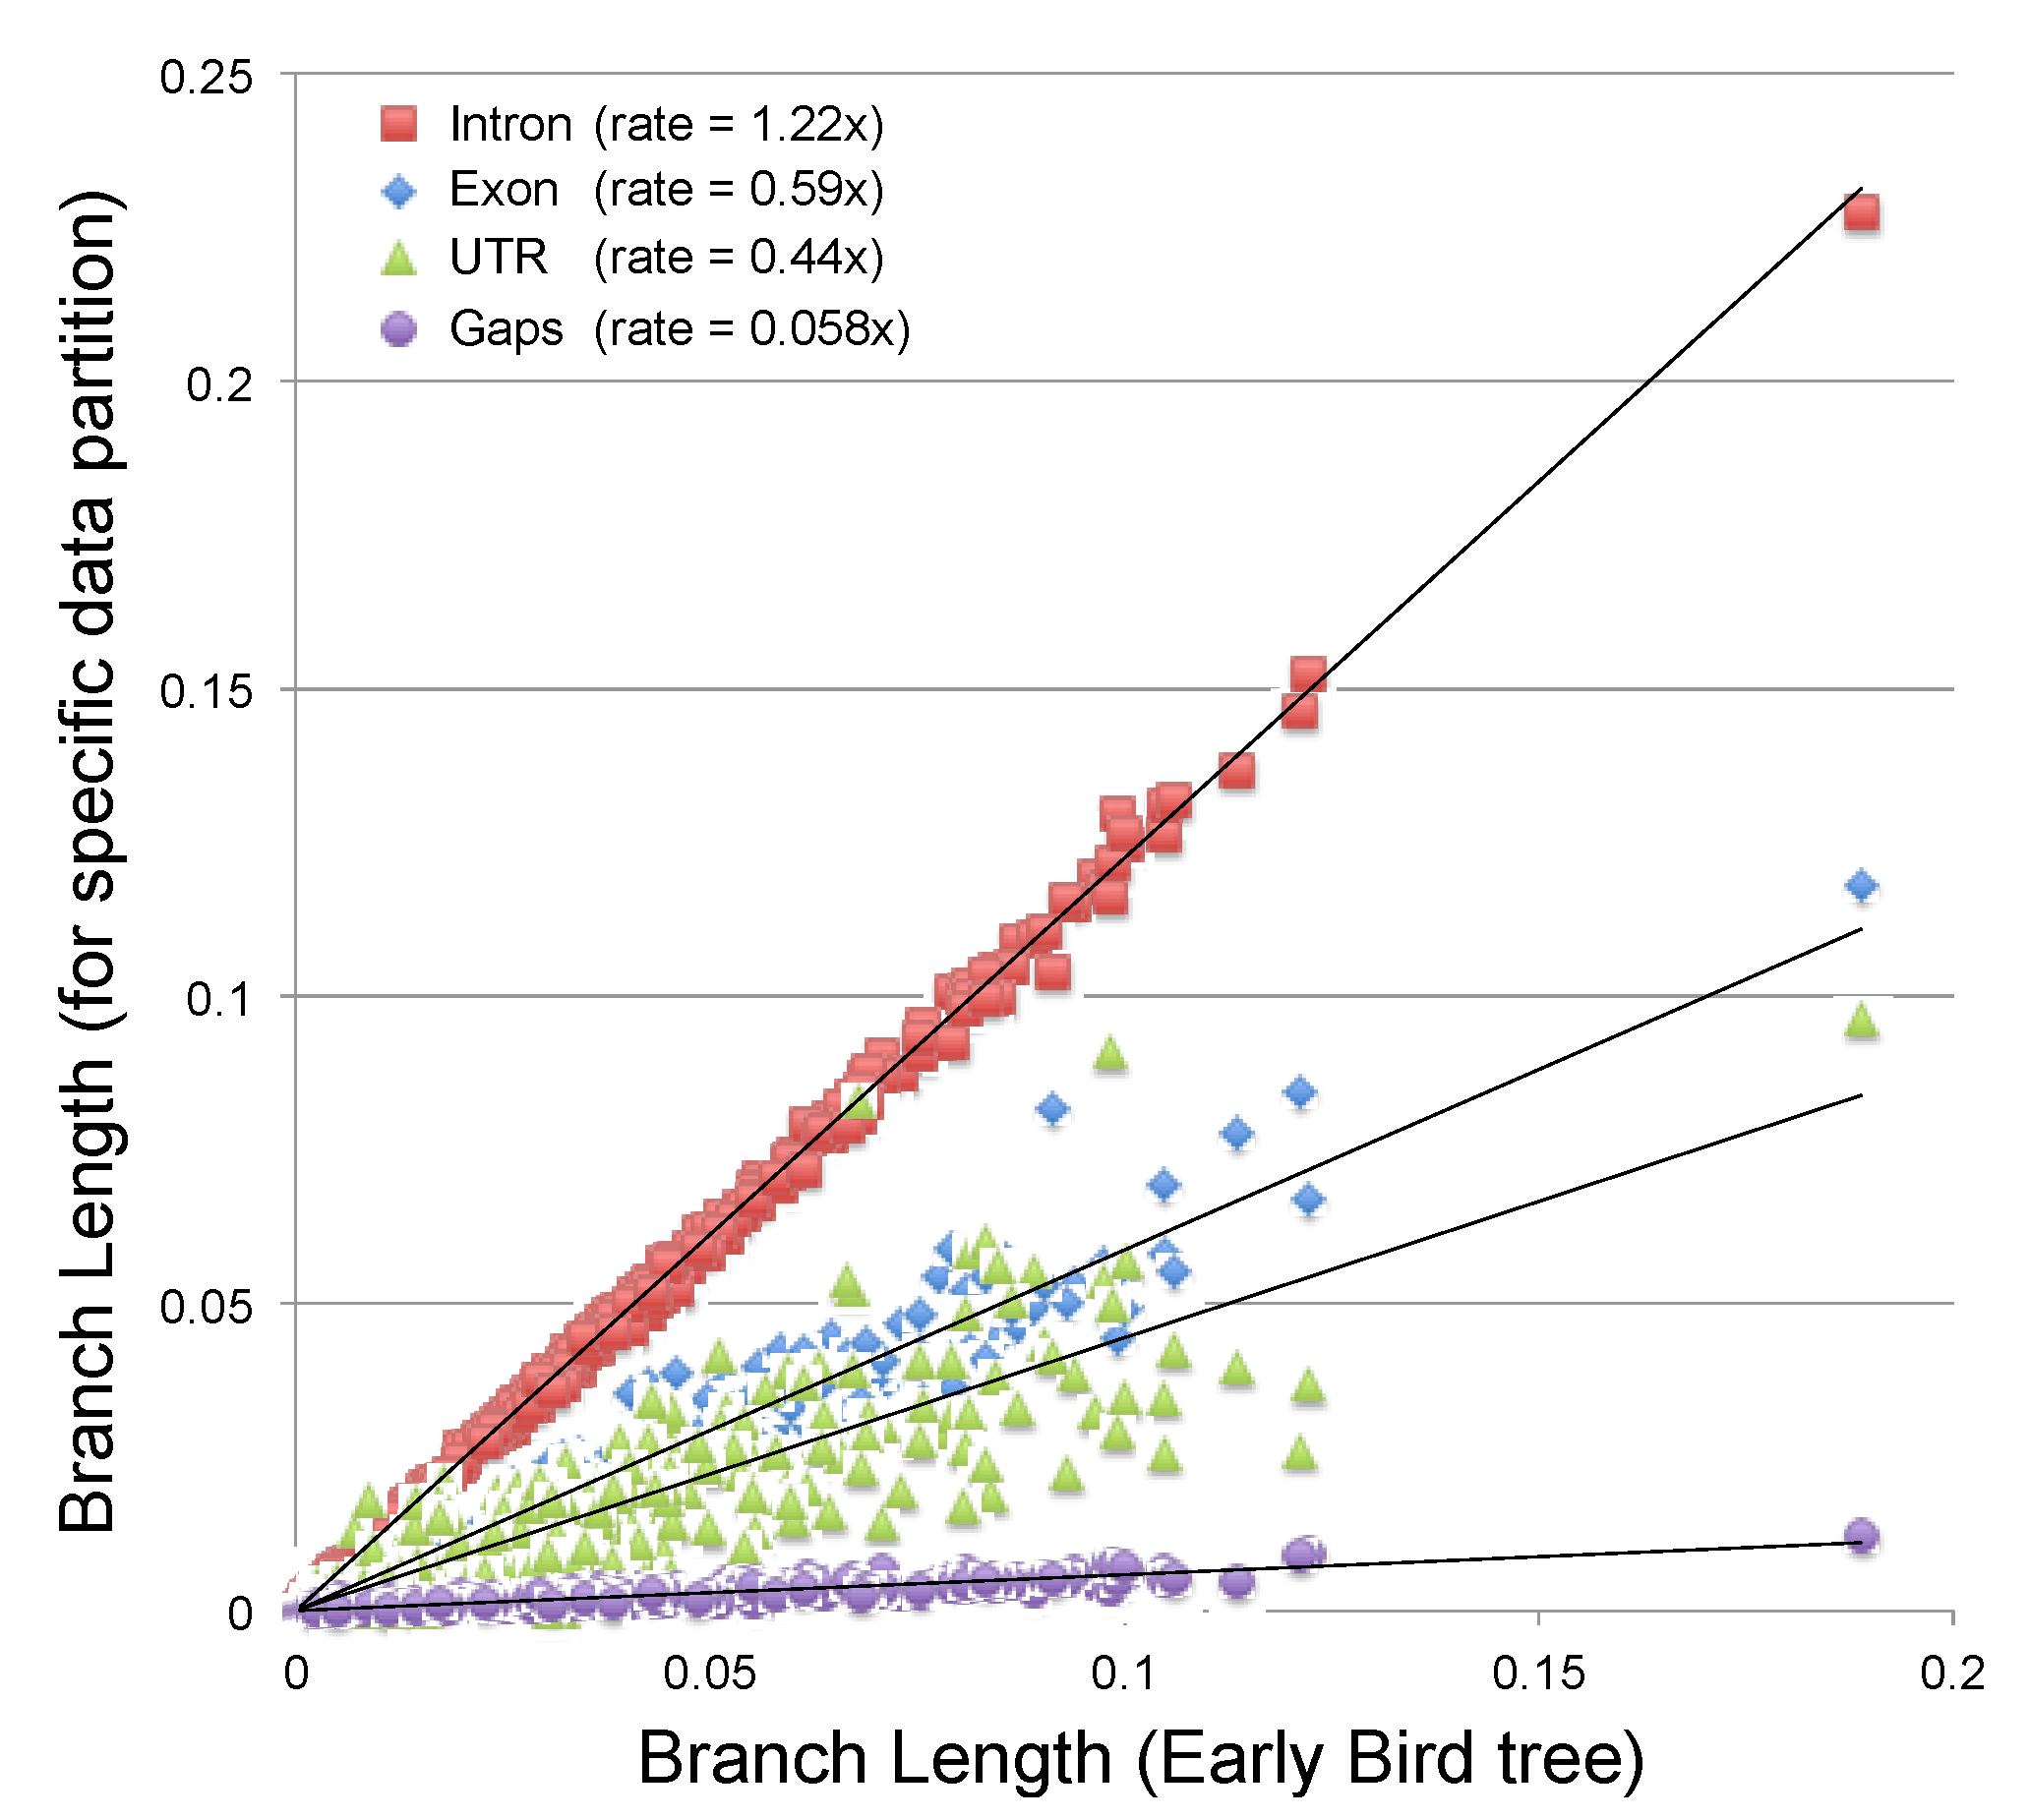
2.3.2. Estimating the Rate at Which Gap Character Changes Accumulate
2.3.3. Evaluating the Information Content of Gap Characters
3. Results and Discussion
3.1. The Power of Gap Characters to Resolve the Avian Tree of Life

3.2. Phylogenetic Signal in Gap Characters Based upon Indels of Different Lengths
| Topology | |||
|---|---|---|---|
| Data Matrix | Nucleotide tree | Gap tree | |
| Gaps | |||
| All | 0.7154 | 0.7209 | |
| >1-bp (excluding 1-bp gaps) | 0.7141 | 0.7190 | |
| >2-bp (excluding 1- and 2-bp gaps) | 0.7238 | 0.7288 | |
| Nucleotides | |||
| All | 0.5231 | 0.5188 | |
| Introns | 0.5206 | 0.5167 | |
| Coding exons | 0.5315 | 0.5251 | |
| 3' untranslated regions | 0.5632 | 0.5597 | |
3.3. Combined Analyses of Nucleotide Substitutions and Gap Characters
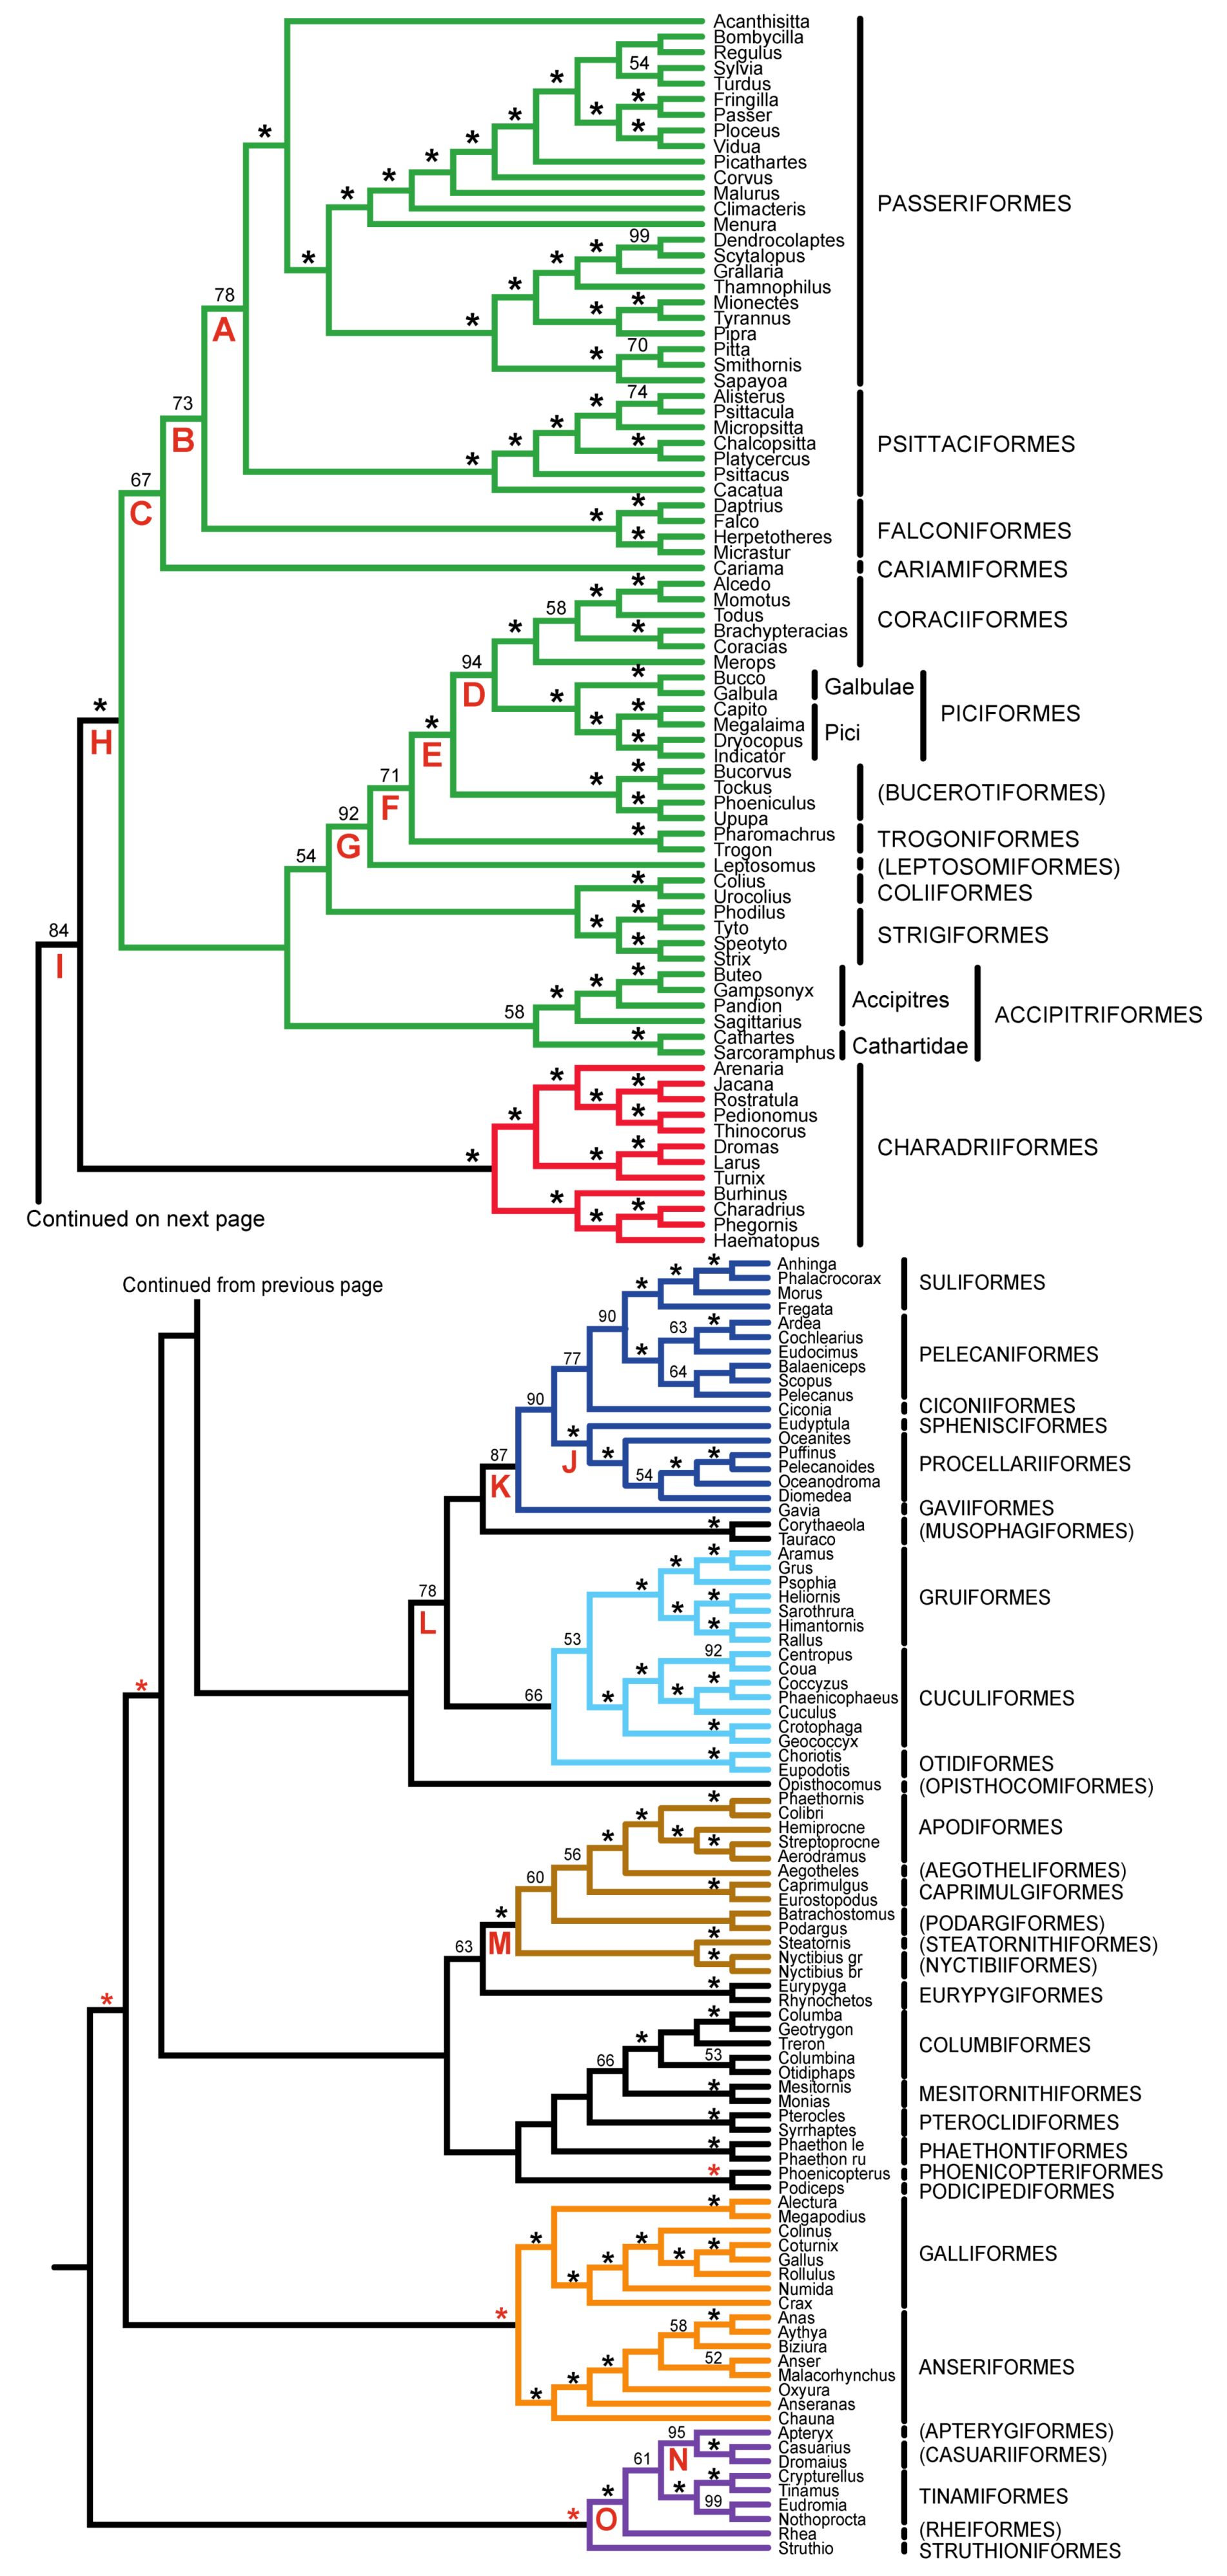
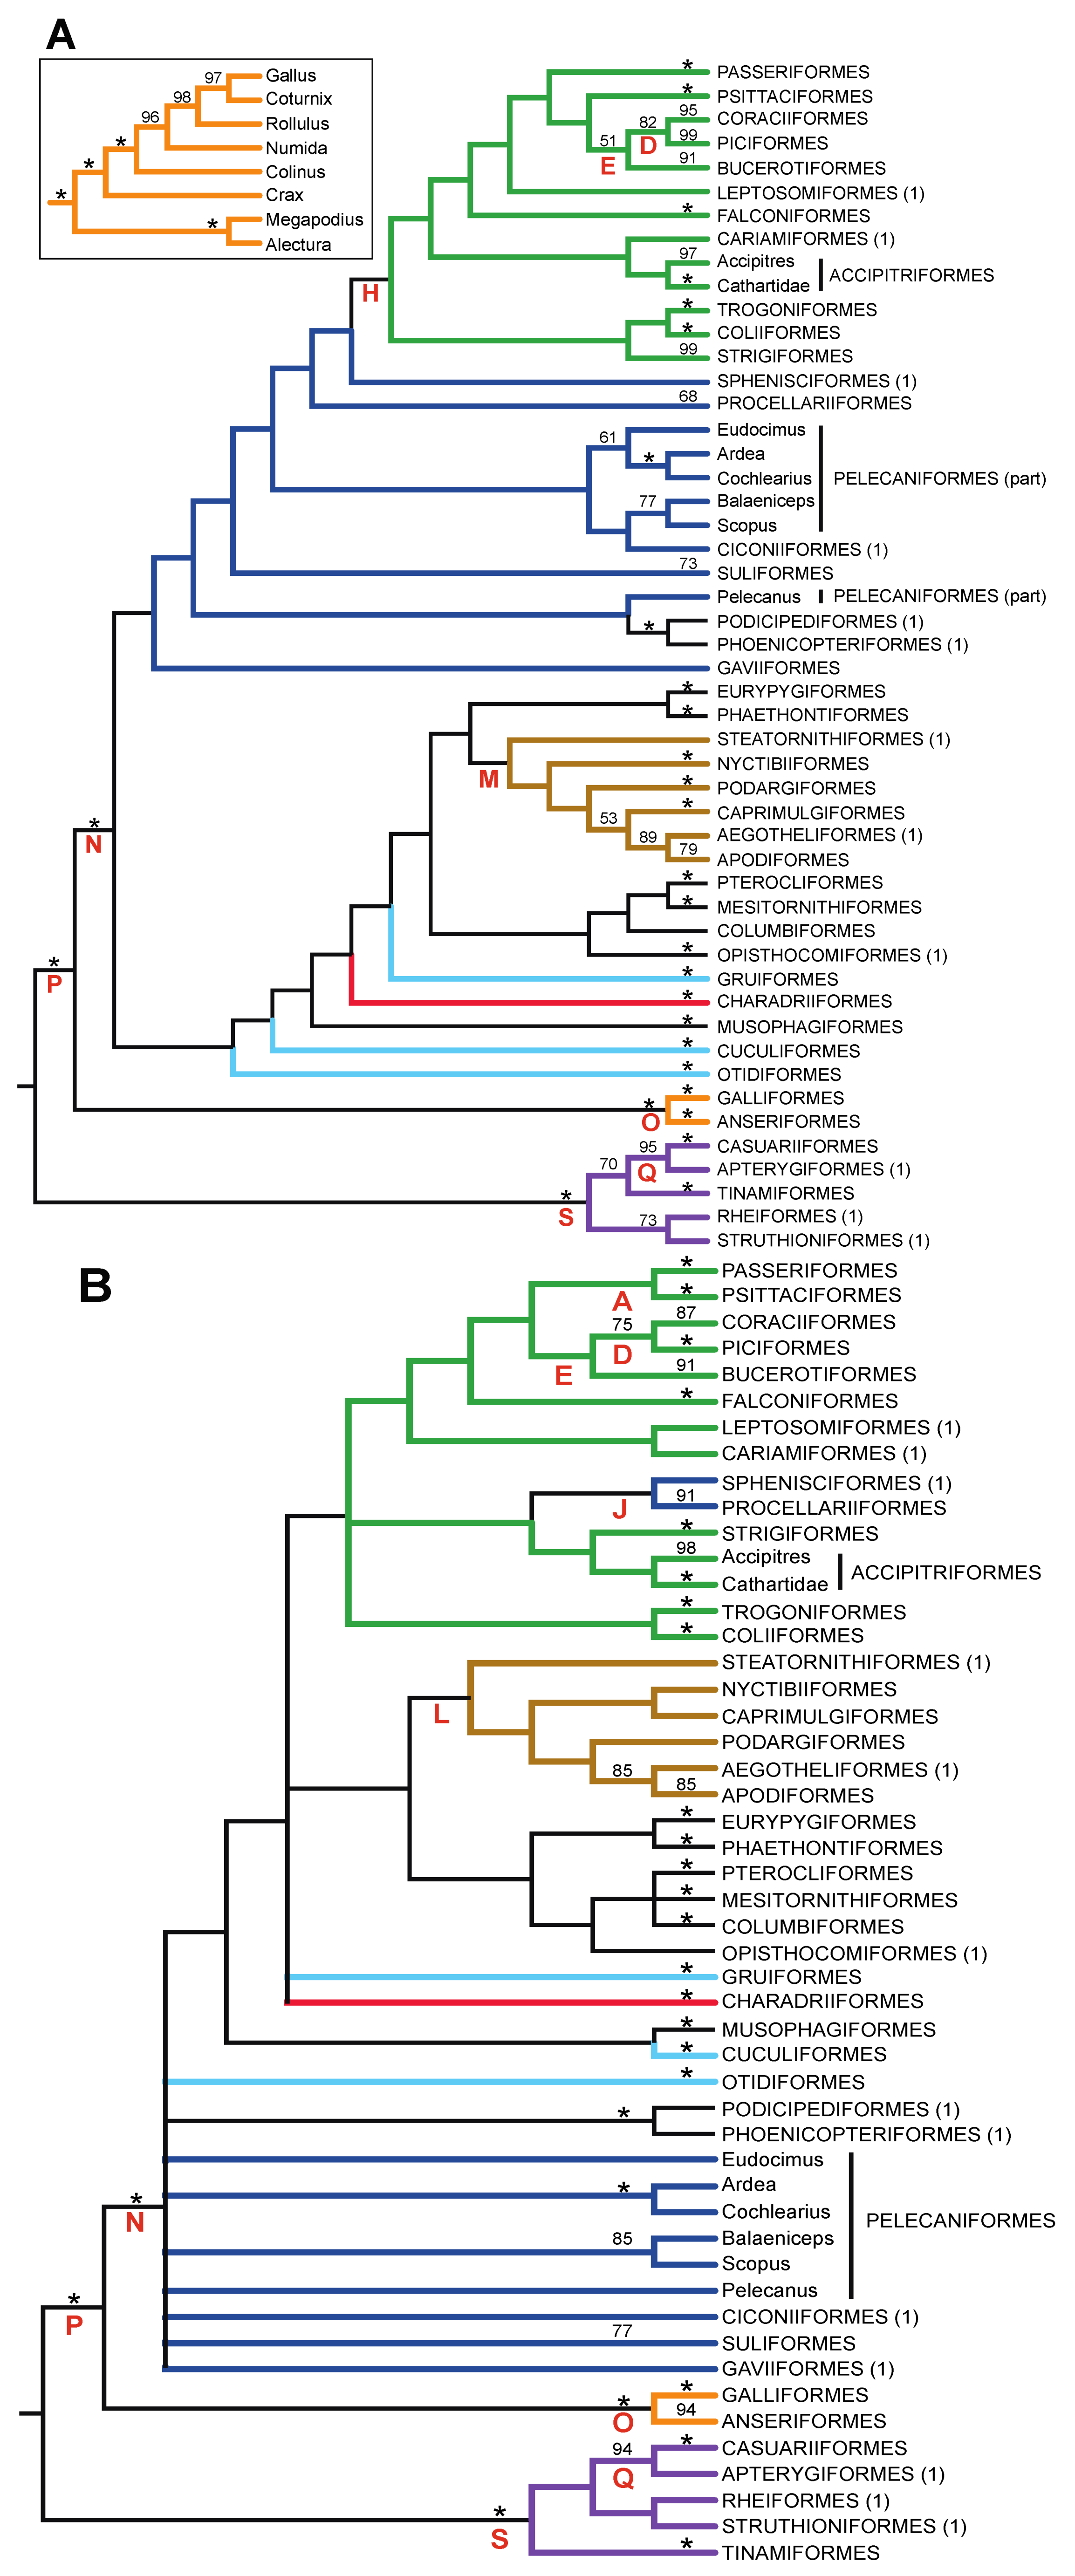
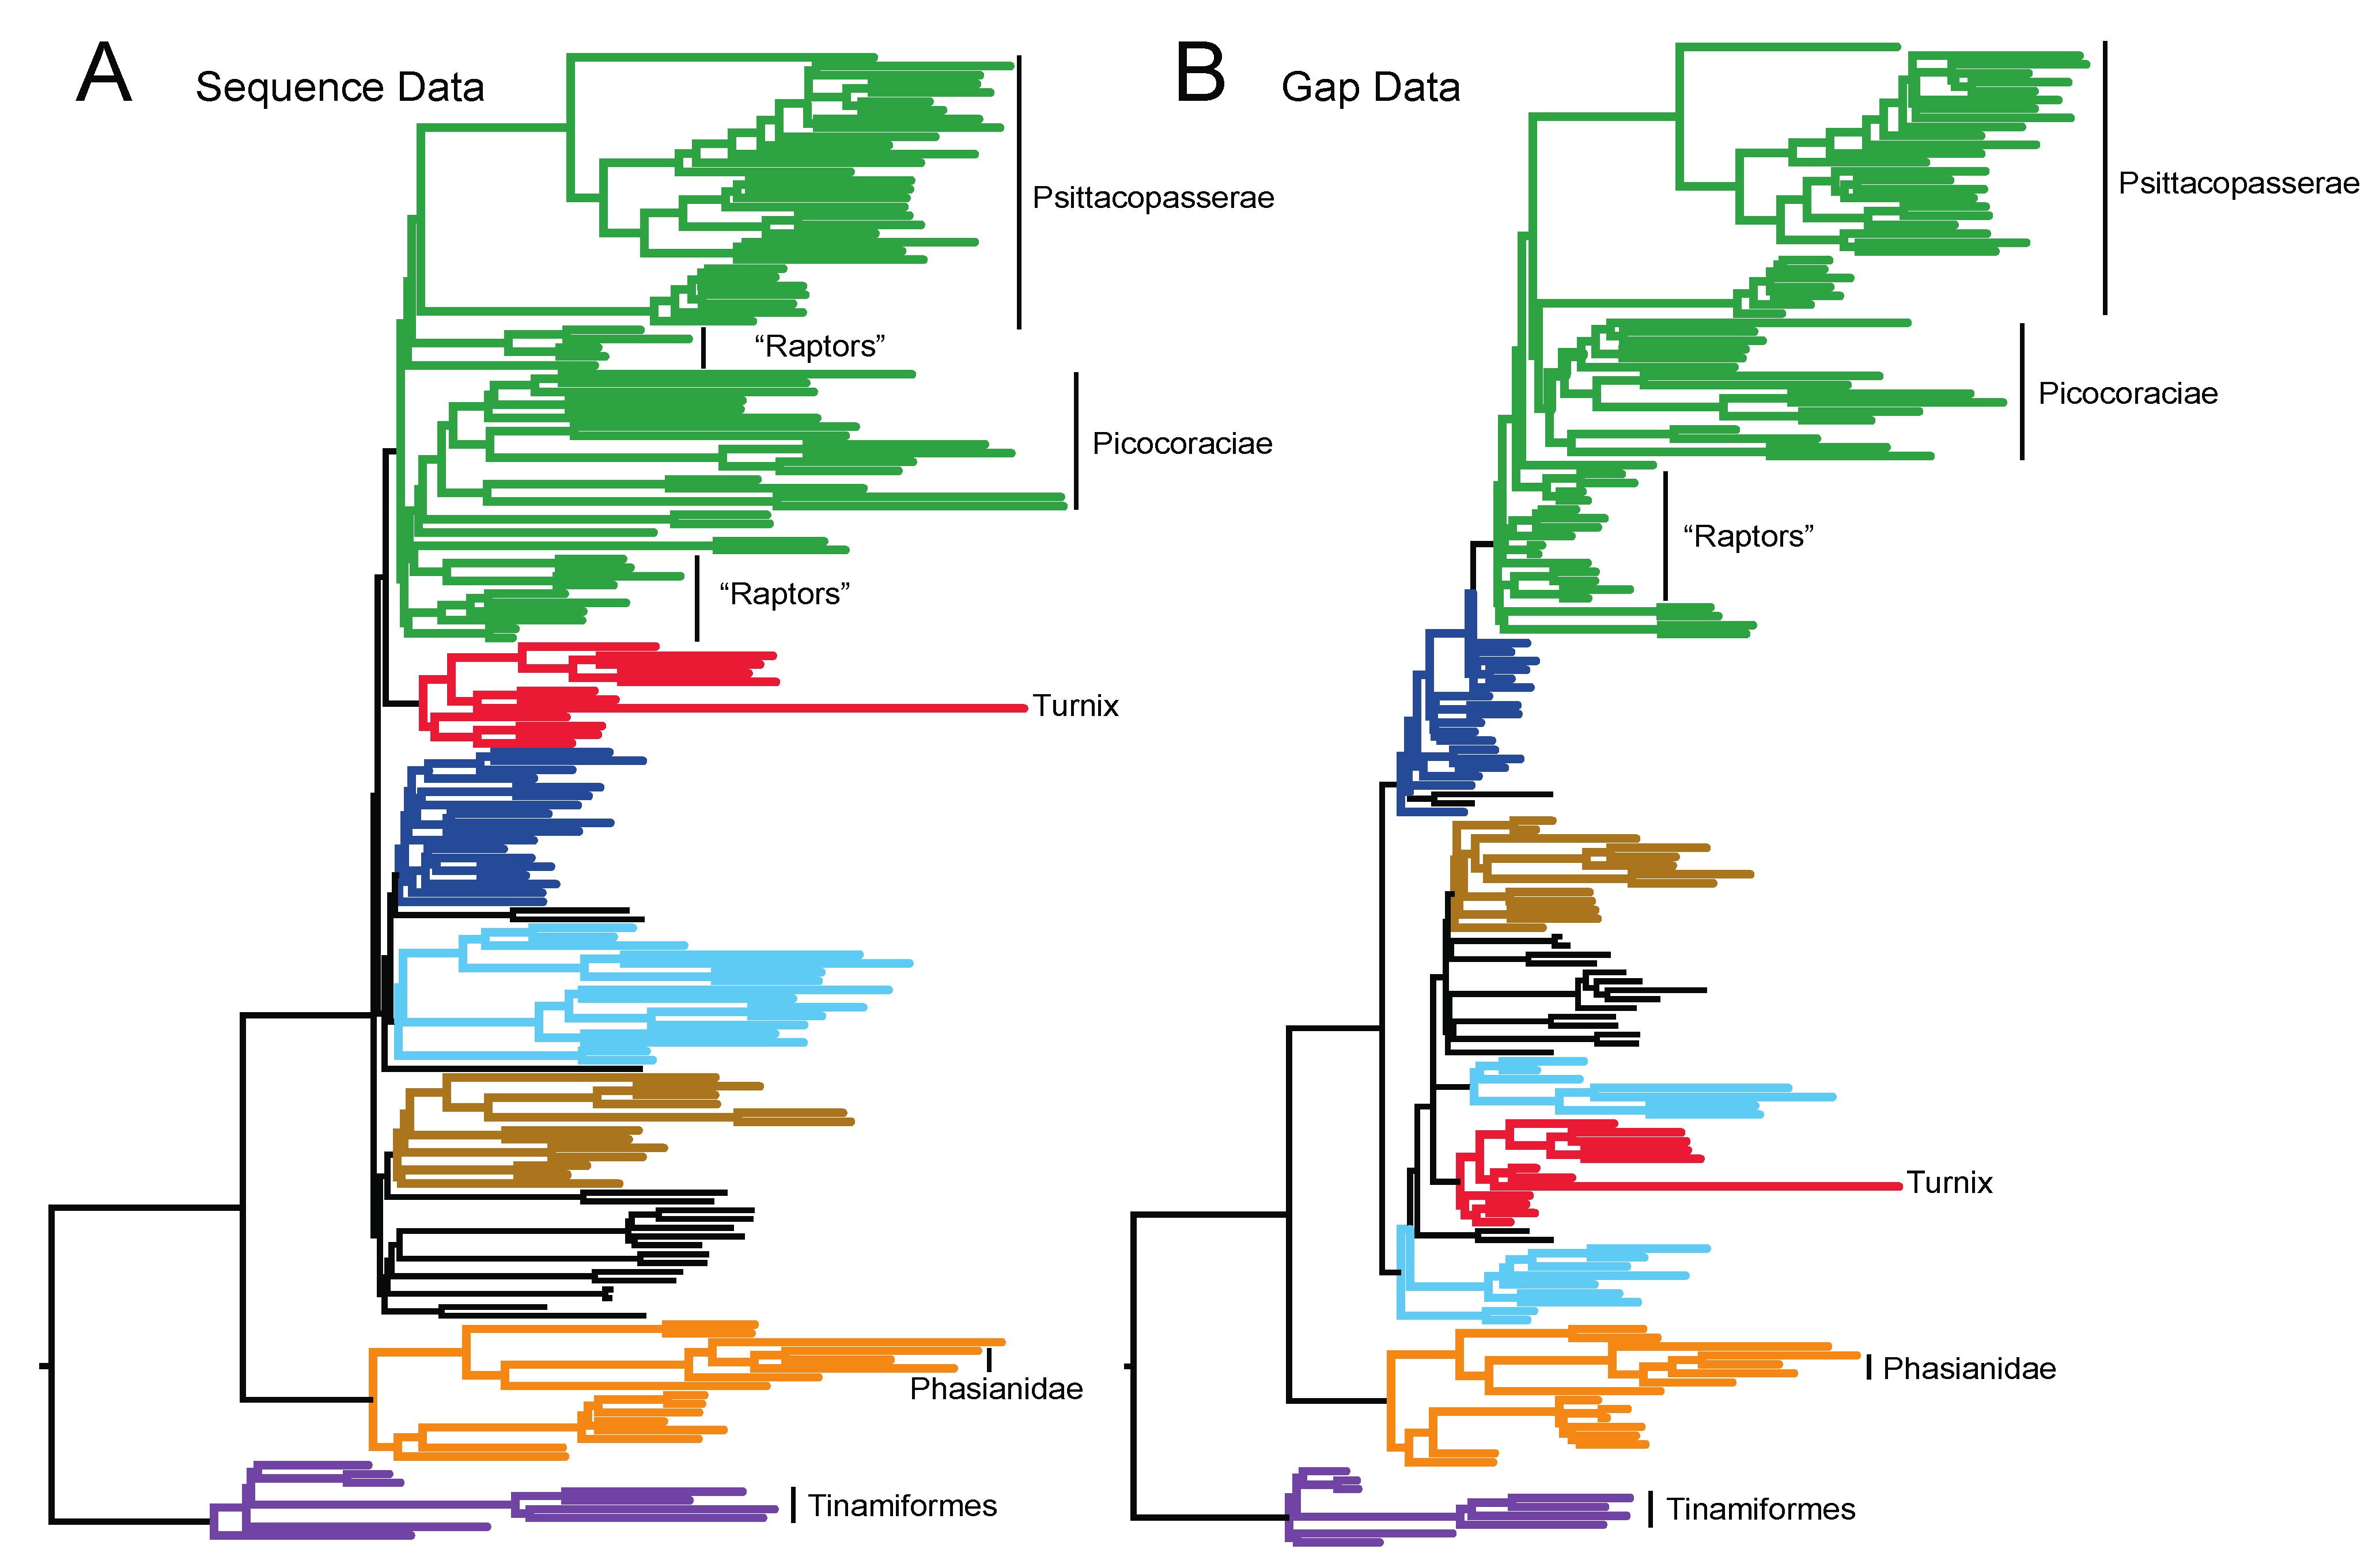
- The nucleotide tree supports the monophyly of Notopalaeognathae in contrast to both the MP and ML gap trees (Figure 3), although only the latter had high bootstrap support. The nucleotide topology is strongly supported by independent evidence, including reanalyses of complete mitochondrial genomes [29], analyses of independent nuclear data matrices [31], TE insertions [62] and analyses of morphological data.
- The nucleotide tree supports a clade comprising New World quail (Colinus) and Phasianidae within Galliformes (Figure 1), whereas the gap tree supports a clade comprising Guineafowl (Numida) and Phasianidae (Figure 3B). The former topology is supported by analyses of multiple nuclear and mitochondrial sequences [8,83], TE insertions [92] and morphology [84].
3.4. Analyses of Gap Characters and Models of Indel Evolution
4. Conclusions
Additional Note
Acknowledgments
References
- DeBry, R.W.; Seshadri, S. Nuclear intron sequences for phylogenetics of closely related mammals: An example using the phylogeny of Mus. J. Mammal. 2001, 82, 280–288. [Google Scholar] [CrossRef]
- Kimball, R.T.; Braun, E.L.; Ligon, J.D.; Randi, E.; Lucchini, V. A molecular phylogeny of the Peacock-pheasants (Galliformes: Polyplectron spp.) indicates loss and reduction of ornamental traits and display behaviors. Biol. J. Linn. Soc. 2001, 73, 187–198. [Google Scholar]
- Creer, S.; Malhotra, A.; Thorpe, R.S.; Pook, C.E. Targeting optimal introns for phylogenetic analyses in non-model taxa: Experimental results in Asian pitvipers. Cladistics 2005, 21, 390–395. [Google Scholar]
- Benavides, E.; Baum, R.; McClellan, D.; Sites, J.W. Molecular phylogenetics of the lizard genus Microlophus (Squamata: Tropiduridae): Aligning and retrieving indel signal from nuclear introns. Syst. Biol. 2007, 56, 776–797. [Google Scholar] [CrossRef]
- Igea, J.; Juste, J.; Castresana, J. Novel intron markers to study the phylogeny of closely related mammalian species. BMC Evol. Biol. 2010, 10, 369. [Google Scholar]
- Harshman, J.; Huddleston, C.J.; Bollback, J.P.; Parsons, T.J.; Braun, M.J. True and false gharials: A nuclear gene phylogeny of Crocodylia. Syst. Biol. 2003, 52, 386–402. [Google Scholar]
- Kimball, R.T.; Braun, E.L. A multigene phylogeny of Galliformes supports a single origin of erectile ability in non-feathered facial traits. J. Avian Biol. 2008, 39, 438–445. [Google Scholar]
- Bonilla, A.J.; Braun, E.L.; Kimball, R.T. Comparative molecular evolution and phylogenetic utility of 3'-UTRs and introns in Galliformes. Mol. Phylogenet. Evol. 2010, 56, 536–542. [Google Scholar] [CrossRef]
- Prychitko, T.M.; Moore, W.S. Alignment and phylogenetic analysis of β-Fibrinogen intron 7 sequences among avian orders reveal conserved regions within the intron. Mol. Biol. Evol. 2003, 20, 762–771. [Google Scholar] [CrossRef]
- Fain, M.G.; Houde, P. Parallel radiations in the primary clades of birds. Evolution 2004, 58, 2558–2573. [Google Scholar]
- Matthee, C.A.; Eick, G.; Willows-Munro, S.; Montgelard, C.; Pardini, A.T.; Robinson, T.J. Indel evolution of mammalian introns and the utility of non-coding nuclear markers in eutherian phylogenetics. Mol. Phylogenet. Evol. 2007, 42, 827–837. [Google Scholar] [CrossRef]
- Chojnowski, J.L.; Kimball, R.T.; Braun, E.L. Introns outperform exons in analyses of basal avian phylogeny using clathrin heavy chain genes. Gene 2008, 410, 89–96. [Google Scholar]
- Hackett, S.J.; Kimball, R.T.; Reddy, S.; Bowie, R.C.K.; Braun, E.L.; Braun, M.J.; Chojnowski, J.L.; Cox, W.A.; Han, K.-L.; Harshman, J.; et al. A phylogenomic study of birds reveals their evolutionary history. Science 2008, 320, 1763–1768. [Google Scholar]
- Giribet, G.; Wheeler, W.C. On gaps. Mol. Phylogenet. Evol. 1999, 13, 132–143. [Google Scholar] [CrossRef]
- Kjer, K.M.; Gillespie, J.J.; Ober, K.A. Opinions on multiple sequence alignment, and an empirical comparison of repeatability and accuracy between POY and structural alignment. Syst. Biol. 2007, 56, 133–146. [Google Scholar] [CrossRef]
- Morrison, D.A. Why would phylogeneticists ignore computerized sequence alignment? Syst. Biol. 2009, 58, 150–158. [Google Scholar] [CrossRef]
- Lee, J.Y.; Joseph, L.; Edwards, S.V. A species tree for the Australo-Papuan Fairy-wrens and allies (Aves: Maluridae). Syst. Biol. 2012, 61, 253–271. [Google Scholar]
- Saurabh, K.; Holland, B.R.; Gibb, G.C.; Penny, D. Gaps: An elusive source of phylogenetic information. Syst. Biol. 2012, 61, 1075–1082. [Google Scholar] [CrossRef]
- Simmons, M.P.; Ochoterena, H. Gaps as characters in sequence-based phylogenetic analyses. Syst. Biol. 2000, 49, 369–381. [Google Scholar]
- Simmons, M.P.; Ochoterena, H.; Carr, T.G. Incorporation, relative homoplasy, and effect of gap characters in sequence-based phylogenetic analyses. Syst. Biol. 2001, 50, 454–462. [Google Scholar]
- Dwivedi, B.; Gadagkar, S.R. Phylogenetic inference under varying proportions of indel-induced alignment gaps. BMC Evol. Biol. 2009, 9, 211. [Google Scholar] [CrossRef]
- Warnow, T. Standard maximum likelihood analyses of alignments with gaps can be statistically inconsistent. PLoS Curr. 2012, 4, RN1308. [Google Scholar] [CrossRef]
- Lake, J.A. The order of sequence alignment can bias the selection of tree topology. Mol. Biol. Evol. 1991, 8, 378–385. [Google Scholar]
- Ogden, T.H.; Rosenberg, M.S. Multiple sequence alignment accuracy and phylogenetic inference. Syst. Biol. 2006, 55, 314–328. [Google Scholar]
- Smythe, A.B.; Sanderson, M.J.; Nadler, S.A. Nematode small subunit phylogeny correlates with alignment parameters. Syst. Biol. 2006, 55, 972–992. [Google Scholar] [CrossRef]
- Liu, K.; Raghavan, S.; Nelesen, S.; Linder, C.R.; Warnow, T. Rapid and accurate large-scale coestimation of sequence alignments and phylogenetic trees. Science 2009, 324, 1561–1564. [Google Scholar] [CrossRef]
- Liu, K.; Linder, C.R.; Warnow, T. Multiple sequence alignment: A major challenge to large-scale phylogenetics. PLoS Curr. 2010, 2, RN1198. [Google Scholar]
- Pratt, R.C.; Gibb, G.C.; Morgan-Richards, M.; Phillips, M.J.; Hendy, M.D.; Penny, D. Toward resolving deep Neoaves phylogeny: Data, signal enhancement, and priors. Mol. Biol. Evol. 2009, 26, 313–326. [Google Scholar]
- Phillips, M.J.; Gibb, G.C.; Crimp, E.A.; Penny, D. Tinamous and Moa flock together: Mitochondrial genome sequence analysis reveals independent losses of flight among ratites. Syst. Biol. 2010, 59, 90–107. [Google Scholar] [CrossRef]
- Wang, N.; Braun, E.L.; Kimball, R.T. Testing hypotheses about the sister group of the Passeriformes using an independent 30 locus dataset. Mol. Biol. Evol. 2012, 29, 737–750. [Google Scholar]
- Smith, J.V.; Braun, E.L.; Kimball, R.T. Ratite non-monophyly: Independent evidence from 40 novel loci. Syst. Biol. 2013, 62, 35–49. [Google Scholar] [CrossRef]
- Golenberg, E.M.; Clegg, M.T.; Durbin, M.L.; Doebley, J.; Ma, D.P. Evolution of a noncoding region of the chloroplast genome. Mol. Phylogenet. Evol. 1993, 2, 52–64. [Google Scholar] [CrossRef]
- Regier, J.C.; Zwick, A. Sources of signal in 62 protein-coding nuclear genes for higher-level phylogenetics of arthropods. PLoS One 2011, 6, e23408. [Google Scholar]
- Belinky, F.; Cohen, O.; Huchon, D. Large-scale parsimony analysis of metazoan indels in protein-coding genes. Mol. Biol. Evol. 2010, 27, 441–451. [Google Scholar]
- Braun, E.L.; Kimball, R.T.; Han, K.-L.; Iuhasz-Velez, N.R.; Bonilla, A.J.; Chojnowski, J.L.; Smith, J.V.; Bowie, R.C.K.; Braun, M.J.; Hackett, S.J.; et al. Homoplastic microinversions and the avian tree of life. BMC Evol. Biol. 2011, 11, 141. [Google Scholar]
- Yang, Z. On the best evolutionary rate for phylogenetic analysis. Syst. Biol. 1998, 47, 125–133. [Google Scholar] [CrossRef]
- Braun, E.L.; Kimball, R.T. Polytomies, the power of phylogenetic inference, and the stochastic nature of molecular evolution: A comment on Walsh et al. (1999). Evolution 2001, 55, 1261–1263. [Google Scholar]
- Ericson, P.G.P.; Elzanowski, A. Phylogenetic utility and evolution of indels: A study in neognathous birds. Mol. Phylogenet. Evol. 2011, 61, 760–771. [Google Scholar] [CrossRef]
- Wolf, Y.I.; Rogozin, I.B.; Koonin, E.V. Coelomata and not Ecdysozoa: Evidence from genome-wide phylogenetic analysis. Genome Res. 2004, 14, 29–36. [Google Scholar]
- Kimball, R.T.; Braun, E.L.; Bowie, R.C.K.; Braun, M.J.; Chojnowski, J.L.; Hackett, S.J.; Han, K.-L.; Harshman, J.; Heimer-Torres, V.; Holznagel, W.; et al. A set of resources to amplify nuclear regions across the avian genome. Mol. Phylogenet. Evol. 2009, 50, 654–660. [Google Scholar] [CrossRef]
- Shetty, S.; Griffin, D.K.; Graves, J.A.M. Comparative painting reveals strong chromosome homology over 80 million years of bird evolution. Chromosome Res. 1999, 7, 289–295. [Google Scholar] [CrossRef]
- Yuri, T.; Kimball, R.T.; Braun, E.L.; Braun, M.J. Duplication and accelerated evolution of growth hormone gene in passerine birds. Mol. Biol. Evol. 2008, 25, 352–361. [Google Scholar]
- Müller, K. SeqState: Primer design and sequence statistics for phylogenetic DNA datasets. Appl. Bioinformatics 2005, 4, 65–69. [Google Scholar] [CrossRef]
- Reddy, S.; Braun, E.L. Assembling the Tree of Life: Early Bird. Available online: http://www.biology.ufl.edu/earlybird/ (accessed on 21 February 2013).
- Swofford, D.L. PAUP*. Phylogenetic Analysis Using Parsimony (*and other methods). Version 4.0b10; Sinauer Associates: Sunderland, MA, USA, 2007. [Google Scholar]
- Nixon, K.C. The Parsimony Ratchet, a new method for rapid parsimony analysis. Cladistics 1999, 15, 407–414. [Google Scholar] [CrossRef]
- Cavender, J.A. Taxonomy with confidence. Math. Biosci. 1978, 40, 271–280. [Google Scholar]
- Farris, J.S. Probability model for inferring evolutionary trees. Syst. Zool. 1973, 22, 250–256. [Google Scholar]
- Neyman, J. Molecular studies of evolution: A source of novel statistical problems. In Molecular Studies of Evolution: A Source of Novel Statistical Problems; Gupta, S.S., Yackel, J., Eds.; New York Academic Press: New York, NY, USA, 1971; pp. 1–27. [Google Scholar]
- Lewis, P.O. A likelihood approach to estimating phylogeny from discrete morphological character data. Syst. Biol. 2001, 50, 913–925. [Google Scholar]
- Felsenstein, J. Phylogenies from restriction sites: A maximum-likelihood approach. Evolution 1992, 46, 156–173. [Google Scholar]
- Zwickl, D.J. Genetic Algorithm Approaches for the Phylogenetic Analysis of Large Biological under the Maximum Likelihood Criterion; The University of Texas at Austin: Austin, TX, USA, 2006. [Google Scholar]
- Russo, C.A.M.; Takezaki, N.; Nei, M. Efficiencies of different genes and different tree-building methods in recovering a known vertebrate phylogeny. Mol. Biol. Evol. 1996, 13, 525–536. [Google Scholar]
- Miyamoto, M.M.; Fitch, W.M. Testing species phylogenies and phylogenetic methods with congruence. Syst. Biol. 1995, 44, 64–76. [Google Scholar]
- Håstad, O.; Björklund, M. Nucleotide substitution models and estimation of phylogeny. Mol. Biol. Evol. 1998, 15, 1381–1389. [Google Scholar] [CrossRef]
- Harshman, J. Classification and phylogeny of birds. In Reproductive Biology and Phylogeny of Birds; Jamieson, B.G.M., Ed.; Science Publishers: Enfield, NH, USA, 2007; pp. 1–35. [Google Scholar]
- Clements, J.F.; Schulenberg, T.S.; Iliff, M.J.; Sullivan, B.L.; Wood, C.L.; Roberson, D. The Clements Checklist of Birds of the World: Version 6.6. Available online: http://www.birds.cornell.edu/clementschecklist/downloadable-clements-checklist/ (accessed on 12 August 2012).
- Gill, F.; Donsker, D. IOC World Bird Names (v 3.2). Available online: http://www.worldbirdnames.org/ (accessed on 12 November 2012).
- Pacheco, M.A.; Battistuzzi, F.U.; Lentino, M.; Aguilar, R.F.; Kumar, S.; Escalante, A.A. Evolution of modern birds revealed by mitogenomics: Timing the radiation and origin of major orders. Mol. Biol. Evol. 2011, 28, 1927–1942. [Google Scholar] [CrossRef]
- Suh, A.; Paus, M.; Kiefmann, M.; Churakov, G.; Franziska, A.F.; Brosius, J.; Kriegs, J.O.; Schmitz, J. Mesozoic retroposons reveal parrots as the closest living relatives of passerine birds. Nat. Commun. 2011, 2, 443. [Google Scholar] [CrossRef]
- Matzke, A.; Churakov, G.; Berkes, P.; Arms, E.M.; Kelsey, D.; Brosius, J.; Kriegs, J.O.; Schmitz, J. Retroposon insertion patterns of neoavian birds: Strong evidence for an extensive incomplete lineage sorting era. Mol. Biol. Evol. 2012, 29, 1497–1501. [Google Scholar] [CrossRef]
- Haddrath, O.; Baker, A.J. Multiple nuclear genes and retroposons support vicariance and dispersal of the palaeognaths, and an Early Cretaceous origin of modern birds. Proc. R. Soc. B 2012, 279, 4617–4625. [Google Scholar] [CrossRef]
- Van Tuinen, M.; Butvill, D.B.; Kirsch, J.A.; Hedges, S.B. Convergence and divergence in the evolution of aquatic birds. Proc. R. Soc. B 2001, 268, 1345–1350. [Google Scholar]
- McCormack, J.E.; Harvey, M.G.; Faircloth, B.C.; Crawford, N.G.; Glenn, T.C.; Brumfield, R.T. A phylogeny of birds based on over 1,500 loci collected by target enrichment and high-throughput sequencing. PLoS One 2013, 8, e54848. [Google Scholar]
- Wetmore, A. A Classification for the Birds of the World; Smithsonian Institution: Washington, DC, USA, 1960; Volume 139, pp. 1–37. [Google Scholar]
- Ericson, P.G.P. Evolution of terrestrial birds in three continents: Biogeography and parallel radiations. J. Biogeogr. 2012, 39, 813–824. [Google Scholar] [CrossRef]
- Mayr, G. Phylogenetic relationships of the paraphyletic “caprimulgiform” birds (nightjars and allies). J. Zool. Syst. Evol. Res. 2010, 48, 126–137. [Google Scholar]
- Mayr, G. Metaves, Mirandornithes, Strisores and other novelties—A critical review of the higher-level phylogeny of neornithine birds. J. Zool. Syst. Evol. Res. 2011, 49, 58–76. [Google Scholar] [CrossRef]
- Cracraft, J.; Barker, F.K.; Braun, M.; Harshman, J.; Dyke, G.J.; Feinstein, J.; Stanley, S.; Cibois, A.; Schikler, P.; Beresford, P.; et al. Phylogenetic relationships among modern birds (Neornithes): Towards an avian tree of life. In Assembling the Tree of Life; Cracraft, J., Donoghue, M., Eds.; Oxford University Press: Oxford, UK, 2004; pp. 468–489. [Google Scholar]
- Sangster, G. A name for the clade formed by owlet-nightjars, swifts and hummingbirds (Aves). Zootaxa 2005, 799, 1–6. [Google Scholar]
- Sangster, G. A name for the flamingo-grebe clade. Ibis 2005, 147, 612–615. [Google Scholar]
- Groth, J.G.; Barrowclough, G.F. Basal divergences in birds and the phylogenetic utility of the nuclear RAG-1 gene. Mol. Phylogenet. Evol. 1999, 12, 115–123. [Google Scholar] [CrossRef]
- Chubb, A.L. New nuclear evidence for the oldest divergence among neognath birds: The phylogenetic utility of ZENK (i). Mol. Phylogenet. Evol. 2004, 30, 140–151. [Google Scholar] [CrossRef]
- Barrowclough, G.F.; Groth, J.G.; Mertz, L.A. The RAG-1 exon in the avian order Caprimulgiformes: Phylogeny, heterozygosity, and base composition. Mol. Phylogenet. Evol. 2006, 41, 238–248. [Google Scholar]
- Ericson, P.G.P.; Anderson, C.L.; Britton, T.; Elzanowski, A.; Johansson, U.S.; Källersjö, M.; Ohlson, J.I.; Parsons, T.J.; Zuccon, D.; Mayr, G. Diversification of Neoaves: Integration of molecular sequence data and fossils. Biol. Lett. 2006, 2, 543–547. [Google Scholar]
- Mindell, D.P.; Sorenson, M.D.; Huddleston, C.J.; Miranda, H.C., Jr.; Knight, A.; Sawchuk, S.J.; Yuri, T. Phylogenetic relationships among and within select avian orders based on mitochondrial DNA. In Avian Molecular Evolution and Systematics; Mindell, D.P., Ed.; Academic Press: San Diego, CA, USA, 1997; pp. 214–247. [Google Scholar]
- Poe, S.; Chubb, A.L. Birds in a bush: Five genes indicate explosive evolution of avian orders. Evolution 2004, 58, 404–415. [Google Scholar]
- Hardison, R.C.; Roskin, K.M.; Yang, S.; Diekhans, M.; Kent, W.J.; Weber, R.; Elnitski, L.; Li, J.; O'Connor, M.; Kolbe, D.; et al. Covariation in frequencies of substitution, deletion, transposition, and recombination during eutherian evolution. Genome Res. 2003, 13, 13–26. [Google Scholar] [CrossRef]
- Tuffley, C.; Steel, M. Links between maximum likelihood and maximum parsimony under a simple model of site substitution. Bull. Math. Biol. 1997, 59, 581–607. [Google Scholar] [CrossRef]
- Holder, M.T.; Lewis, P.O.; Swofford, D.L. The Akaike information criterion will not choose the no common mechanism model. Syst. Biol. 2010, 59, 477–485. [Google Scholar] [CrossRef]
- Huelsenbeck, J.P.; Alfaro, M.E.; Suchard, M.A. Biologically inspired phylogenetic models strongly outperform the No Common Mechanism model. Syst. Biol. 2011, 60, 225–232. [Google Scholar] [CrossRef]
- Goloboff, P.A. Parsimony, likelihood, and simplicity. Cladistics 2003, 19, 91–103. [Google Scholar] [CrossRef]
- Cox, W.A.; Kimball, R.T.; Braun, E.L. Phylogenetic position of the New World quail (Odontophoridae): Eight nuclear loci and three mitochondrial regions contradict morphology and the Sibley-Ahlquist tapestry. Auk 2007, 124, 71–84. [Google Scholar] [CrossRef]
- Crowe, T.M.; Bowie, R.C.K.; Bloomer, P.; Mandiwana, T.G.; Hedderson, T.A.J.; Randi, E.; Pereira, S.L.; Wakeling, J. Phylogenetics, biogeography and classification of, and character evolution in, gamebirds (Aves: Galliformes): Effects of character exclusion, data partitioning and missing data. Cladistics 2006, 22, 495–532. [Google Scholar] [CrossRef]
- Wenzel, J.W.; Siddall, M.E. Noise. Cladistics 1999, 15, 51–64. [Google Scholar] [CrossRef]
- Han, K.-L.; Robbins, M.B.; Braun, M.J. A multi-gene estimate of phylogeny in the nightjars and nighthawks (Caprimulgidae). Mol. Phylogenet. Evol. 2010, 55, 443–453. [Google Scholar] [CrossRef]
- Robinson, D.F.; Foulds, L.R. Comparison of phylogenetic trees. Math. Biosci. 1981, 53, 131–147. [Google Scholar]
- Farris, J.S. The retention index and the rescaled consistency index. Cladistics 1989, 5, 417–419. [Google Scholar] [CrossRef]
- Livezey, B.C.; Zusi, R.L. Higher-order phylogeny of modern birds (Theropoda, Aves: Neornithes) based on comparative anatomy: II.—Analysis and discussion. Zool. J. Linn. Soc. 2007, 149, 1–94. [Google Scholar] [CrossRef]
- Clarke, J.A.; Ksepka, D.T.; Smith, N.A.; Norell, M.A. Combined phylogenetic analysis of a new North American fossil species confirms widespread Eocene distribution for stem rollers (Aves, Coracii). Zool. J. Linn. Soc. 2009, 157, 586–611. [Google Scholar]
- Mayr, G.; Mourer-Chauviré, C.; Weidig, I. Osteology and systematic position of the Eocene Primobucconidae (Aves, Coraciiformes sensu stricto), with first records from Europe. J. Syst. Paleontol. 2004, 2, 1–12. [Google Scholar] [CrossRef]
- Kriegs, J.O.; Matzke, A.; Churakov, G.; Kuritzin, A.; Mayr, G.; Brosius, J.; Schmitz, J. Waves of genomic hitchhikers shed light on the evolution of gamebirds (Aves: Galliformes). BMC Evol. Biol. 2007, 7, 190. [Google Scholar]
- Sullivan, J.; Swofford, D.L. Should we use model-based methods for phylogenetic inference when we know assumptions about among-site rate variation and nucleotide substitution pattern are violated? Syst. Biol. 2001, 50, 723–729. [Google Scholar] [CrossRef]
- Johnson, K.P. Deletion bias in avian introns over evolutionary timescales. Mol. Biol. Evol. 2004, 21, 599–602. [Google Scholar] [CrossRef]
- Alekseyenko, A.V.; Lee, C.J.; Suchard, M.A. Wagner and Dollo: A stochastic duet by composing two parsimonious solos. Syst. Biol. 2008, 57, 772–784. [Google Scholar]
- Maddison, W.P. Gene trees in species trees. Syst. Biol. 1997, 46, 523–536. [Google Scholar] [CrossRef]
- Oliver, J.C. Microevolutionary processes generate phylogenomic discordance at ancient divergences. Evolution 2013. [Google Scholar] [CrossRef]
- Edwards, S.V. Is a new and general theory of molecular systematics emerging? Evolution 2009, 63, 1–19. [Google Scholar] [CrossRef]
- Cracraft, J. Avian higher-level relationships and classification: Nonpasseriforms. In The Howard and Moore Complete Checklist of the Birds of the World, 4th; Dickinson, E.C., Remsen, J.V., Eds.; Aves Press: Northhampton, UK, 2013; Volume 1, Non-passerines, in press. [Google Scholar]
Supplementary Files
© 2013 by the authors; licensee MDPI, Basel, Switzerland. This article is an open access article distributed under the terms and conditions of the Creative Commons Attribution license (http://creativecommons.org/licenses/by/3.0/).
Share and Cite
Yuri, T.; Kimball, R.T.; Harshman, J.; Bowie, R.C.K.; Braun, M.J.; Chojnowski, J.L.; Han, K.-L.; Hackett, S.J.; Huddleston, C.J.; Moore, W.S.; et al. Parsimony and Model-Based Analyses of Indels in Avian Nuclear Genes Reveal Congruent and Incongruent Phylogenetic Signals. Biology 2013, 2, 419-444. https://doi.org/10.3390/biology2010419
Yuri T, Kimball RT, Harshman J, Bowie RCK, Braun MJ, Chojnowski JL, Han K-L, Hackett SJ, Huddleston CJ, Moore WS, et al. Parsimony and Model-Based Analyses of Indels in Avian Nuclear Genes Reveal Congruent and Incongruent Phylogenetic Signals. Biology. 2013; 2(1):419-444. https://doi.org/10.3390/biology2010419
Chicago/Turabian StyleYuri, Tamaki, Rebecca T. Kimball, John Harshman, Rauri C. K. Bowie, Michael J. Braun, Jena L. Chojnowski, Kin-Lan Han, Shannon J. Hackett, Christopher J. Huddleston, William S. Moore, and et al. 2013. "Parsimony and Model-Based Analyses of Indels in Avian Nuclear Genes Reveal Congruent and Incongruent Phylogenetic Signals" Biology 2, no. 1: 419-444. https://doi.org/10.3390/biology2010419
APA StyleYuri, T., Kimball, R. T., Harshman, J., Bowie, R. C. K., Braun, M. J., Chojnowski, J. L., Han, K.-L., Hackett, S. J., Huddleston, C. J., Moore, W. S., Reddy, S., Sheldon, F. H., Steadman, D. W., Witt, C. C., & Braun, E. L. (2013). Parsimony and Model-Based Analyses of Indels in Avian Nuclear Genes Reveal Congruent and Incongruent Phylogenetic Signals. Biology, 2(1), 419-444. https://doi.org/10.3390/biology2010419