1. Introduction
Proso millet (
Panicum miliaceum L.) is a vital traditional minor cereal crop in the arid and semi-arid regions of northern China, valued for its desirable agronomic traits including drought tolerance, low soil fertility adaptability, and short growth cycle [
1,
2,
3]. Its grains are rich in high-quality protein, dietary fiber, and various trace minerals, conferring significant potential for functional food development. However, production has long been severely constrained by smut disease, caused by the basidiomycete fungus
Anthracocystis destruens [
4,
5]. As a typical systemic fungal disease, smut is characterized by asymptomatic colonization following seedling-stage infection, with pathogen development synchronized to that of the host; this ultimately leads to complete panicle destruction and total yield loss at heading. Field incidence typically ranges from 5% to 10% but can exceed 40% under severe epidemics [
6,
7,
8]. Smut also causes extensive damage in related gramineous crops such as maize and sorghum [
9]. Given the absence of early diagnostic symptoms and the limited efficacy of chemical control against systemically colonizing hyphae, breeding resistant cultivars remains the most economically viable and environmentally sustainable management strategy [
10,
11,
12].
In recent years, significant progress has been made in elucidating the pathogenic mechanisms and genetic basis of smut resistance in maize and sorghum. For instance, it has been established that the maize smut pathogen invades seedlings via appressoria and systemically colonizes the shoot apical meristem [
13], and the key resistance gene ZmWAK, encoding a receptor-like kinase, was cloned through genome-wide association studies and QTL mapping [
14]. In sorghum, major QTLs conferring smut resistance have also been mapped using molecular markers [
15,
16]. Furthermore,
Ustilago maydis has been shown to manipulate host photosynthesis and senescence to facilitate its own colonization [
17], revealing the molecular mechanisms by which pathogens reprogram host metabolism to promote infection [
18]. In contrast, research on smut resistance in proso millet remains at a relatively early stage. Although some resistant germplasms have been identified through genetic resource screening [
19,
20,
21], cultivars combining high resistance with stable agronomic performance are still scarce. Early studies primarily focused on field resistance evaluation, fungicide screening, and macroscopic descriptions of the pathogen infection process [
22,
23,
24]. While existing transcriptomic analyses have implicated pathways such as phenylpropanoid biosynthesis, plant–pathogen interactions, calcium signaling, jasmonic acid signaling, and antioxidant systems in the proso millet response to smut [
25,
26,
27,
28,
29,
30], these findings were all derived from single-time-point sampling and thus fail to capture the temporal dynamics of host defense responses during systemic pathogen colonization.
Our previous untargeted metabolomic analysis systematically revealed stage-specific metabolic reprogramming underlying smut resistance in proso millet, identifying two critical defense phases: energy metabolism regulation at jointing and phenylpropanoid pathway activation at heading [
31]. However, these dynamic metabolic phenotypes represent only the downstream outcomes of defense responses; the upstream transcriptional regulatory mechanisms remain entirely unknown. The inherent limitations of metabolomics preclude capturing the temporal dynamics of gene expression, identifying key regulators driving metabolic transitions, distinguishing the relative contributions of transcriptional versus post-translational regulation, or establishing causal links between gene expression and metabolite accumulation. Therefore, time-series transcriptomic profiling within the same biological system is urgently needed to bridge this critical knowledge gap.
As a complementary extension of our previous metabolomic study, this work provides a systematic characterization of the temporal transcriptional regulatory network underlying proso millet response to smut infection across the entire disease progression. Unlike prior comparative multi-omics analyses limited to single developmental stages [
30], the present study leverages matched transcriptomic and metabolomic samples across four time-points to enable temporal network analysis and delineate stage-specific defense dynamics. Using an identical experimental design and biological samples as in the prior metabolomic analysis, we performed RNA-seq on leaf tissues from inoculated asymptomatic (IA) and inoculated symptomatic (IS) plants at four critical developmental stages: seedling, tillering, jointing, and heading. The key findings of this study are as follows: (1) We constructed the first time-resolved transcriptomic atlas of proso millet in response to smut, systematically delineating the dynamic evolution of transcriptional regulatory networks between resistant and susceptible plants across developmental stages. (2) We identified a series of hub genes and functional modules significantly associated with resistance, encompassing transcription factors, protein kinases, and key metabolic enzymes. (3) Through integrative analysis of transcriptomic and metabolomic data, we established gene–metabolite co-expression networks that elucidate the molecular regulatory mechanisms governing two pivotal defense phases: energy metabolism regulation at jointing and phenylpropanoid pathway activation at heading. (4) We identified multiple candidate master regulators, providing novel targets for dissecting the molecular basis of smut resistance in proso millet. By integrating the transcriptomic data generated here with our prior metabolomic results, we propose a comprehensive “transcription–metabolism” multi-omics regulatory framework. This framework not only uncovers the transcriptional underpinnings of metabolic reprogramming but also reveals the temporal regulatory logic of host defense responses during pathogen colonization, thereby offering both theoretical foundations and candidate gene resources for molecular breeding of smut-resistant cultivars.
2. Materials and Methods
2.1. Plant Materials, Pathogen Inoculation, and Sampling Strategy
The proso millet cultivar ‘Chishu 13’ was used as the experimental material in this study. The experimental design, pathogen inoculation protocol, and sampling strategy were identical to those described in our previous metabolomic study [
31]. Briefly, seeds were artificially inoculated with teliospores of
A. destruens via dry seed coating at a mass ratio of 1:350 (teliospores:seeds) and sown in a controlled-environment chamber maintained at 28 °C, 80% relative humidity, and a 16-h photoperiod. After uniform seedling emergence, plants were transplanted to an experimental field and managed under standard agronomic practices.
A total of 200 individual plants were cultivated, and functional leaf samples were collected at four key developmental stages: seedling, tillering, jointing, and heading. At the heading stage, plants were retrospectively classified into two groups based on symptom expression: the inoculated asymptomatic (IA) group, comprising plants that remained symptom-free after inoculation, and the inoculated symptomatic (IS) group, comprising plants that developed visible smut symptoms. Six phenotypically stable and representative individuals were randomly selected from each group, yielding a total of 48 samples (6 individuals × 2 phenotypic groups × 4 time-points) for subsequent transcriptomic analysis. The biological samples used in this study were identical to those employed in the previous metabolomic analysis, ensuring direct comparability between transcriptomic and metabolomic datasets. The metabolomic data presented in
Figure 1C,D were generated and published in our previous work [
31].
2.2. Transcriptome Sequencing and Data Preprocessing
Total RNA was extracted using the EASYspin Plant Total RNA Rapid Extraction Kit (Biomed Company, Beijing, China) according to the manufacturer’s instructions. RNA quality and quantity were assessed using a NanoDrop 2000 spectrophotometer (Thermo Fisher Scientific, Waltham, MA, USA) and an Agilent 2100 Bioanalyzer (Agilent Technologies, Santa Clara, CA, USA). Samples meeting predefined quality criteria were selected for library construction.
RNA sequencing was performed on the Illumina HiSeq 4000 platform (Illumina, San Diego, CA, USA) at Shanghai Majorbio Bio-Pharm Technology Co., Ltd. (Shanghai, China), following standard library preparation and sequencing protocols. Raw sequencing reads were processed using Trimmomatic v0.39 to remove adapter sequences and low-quality bases, and short reads were discarded. The resulting clean reads were aligned to the proso millet reference genome (GCA_003046395.2) using HISAT2 v2.2.1, and gene expression levels were quantified as FPKM values using StringTie v2.2.1 [
32]. Data reliability among biological replicates was evaluated by Pearson correlation analysis.
2.3. Transcriptomic Data Analysis
Differential expression analysis was performed using DESeq2 (v1.36.0) to identify differentially expressed genes (DEGs). PCA was conducted to evaluate sample clustering, and volcano plots and heatmaps were generated using ggplot2 (v3.5.1) and pheatmap (v1.0.13) to visualize DEGs. Functional enrichment analysis of DEGs was carried out using clusterProfiler (v4.4.0) for GO terms and the KOBAS (v3.0) server for KEGG pathways, with significance defined as FDR < 0.05. To further dissect the temporal dynamics of gene expression, soft clustering of DEGs was performed using the Mfuzz package (v2.56.0); the optimal number of clusters was determined via the silhouette coefficient method, followed by functional enrichment analysis for each cluster to identify stage-specific biological processes. Additionally, WGCNA was performed using the WGCNA package (v1.71). Genes were filtered prior to network construction, and module–trait correlations and hub genes were identified based on predefined statistical criteria.
2.4. RT-qPCR Validation
To validate the RNA-seq results, RT-qPCR was performed using the SYBR Green I Master Kit (Tiangen Biotech Co., Ltd., Beijing, China) according to the manufacturer’s instructions. Gene-specific primers were designed using Primer Express v3.0 (
Table S2). The proso millet Actin gene was used as an internal reference, and relative expression levels were calculated using the 2
−ΔΔCt method. RT-qPCR was conducted on a StepOnePlus Real-Time PCR System (Thermo Fisher Scientific, Waltham, MA, USA) in 96-well plates with the following thermal cycling protocol: initial denaturation at 95 °C for 10 min, followed by 40 cycles of 95 °C for 15 s and 60 °C for 32 s, and a final melt curve stage consisting of 95 °C for 15 s, 60 °C for 1 min, and 95 °C for 15 s.
2.5. Statistical Analysis
All statistical thresholds and quality control criteria applied in this study are defined as follows: For RNA-seq library construction, only samples with RNA integrity number (RIN) ≥ 8.0, A260/A280 ratio of 1.8–2.0, and A260/A230 ratio > 2.0 were retained. During read preprocessing, bases with Q < 20 were trimmed, and reads shorter than 50 bp were discarded. Data reliability was ensured by requiring Pearson correlation coefficients ≥ 0.9 among biological replicates. DEGs were identified using |log2(fold change)| ≥ 1 and false discovery rate (FDR) < 0.05. Functional enrichment results (GO and KEGG) were considered significant at FDR < 0.05. In WGCNA, genes with FPKM ≥ 1 in at least 80% of samples were retained; the soft-thresholding power was set to 12 to achieve a scale-free topology fit index (R2) of 0.9, and the minimum module size was 30 genes. Module–trait correlations were deemed statistically significant when |r| > 0.7 and p < 0.01. Hub genes were defined by module membership (kME > 0.95) and gene significance (GS > 0.2). ChatGPT-3.5 was used solely for language refinement and verification of this manuscript.
3. Results
3.1. Transcriptional Reprogramming During A. destruens Infection in Proso Millet
Our previous metabolomic study established a two-stage defense model against A. destruens in the proso millet cultivar ‘Chishu 13’. To elucidate the underlying transcriptional regulatory mechanisms, we performed RNA-seq on samples from an identical experimental design. Leaf tissues were collected from IA and IS plants at four key developmental stages: seedling, tillering, jointing, and heading. These time-points were selected based on our prior finding that metabolic divergence initiates at jointing and peaks at heading. The use of matched biological samples enabled direct integration of transcriptomic and metabolomic datasets to comprehensively characterize the molecular defense responses.
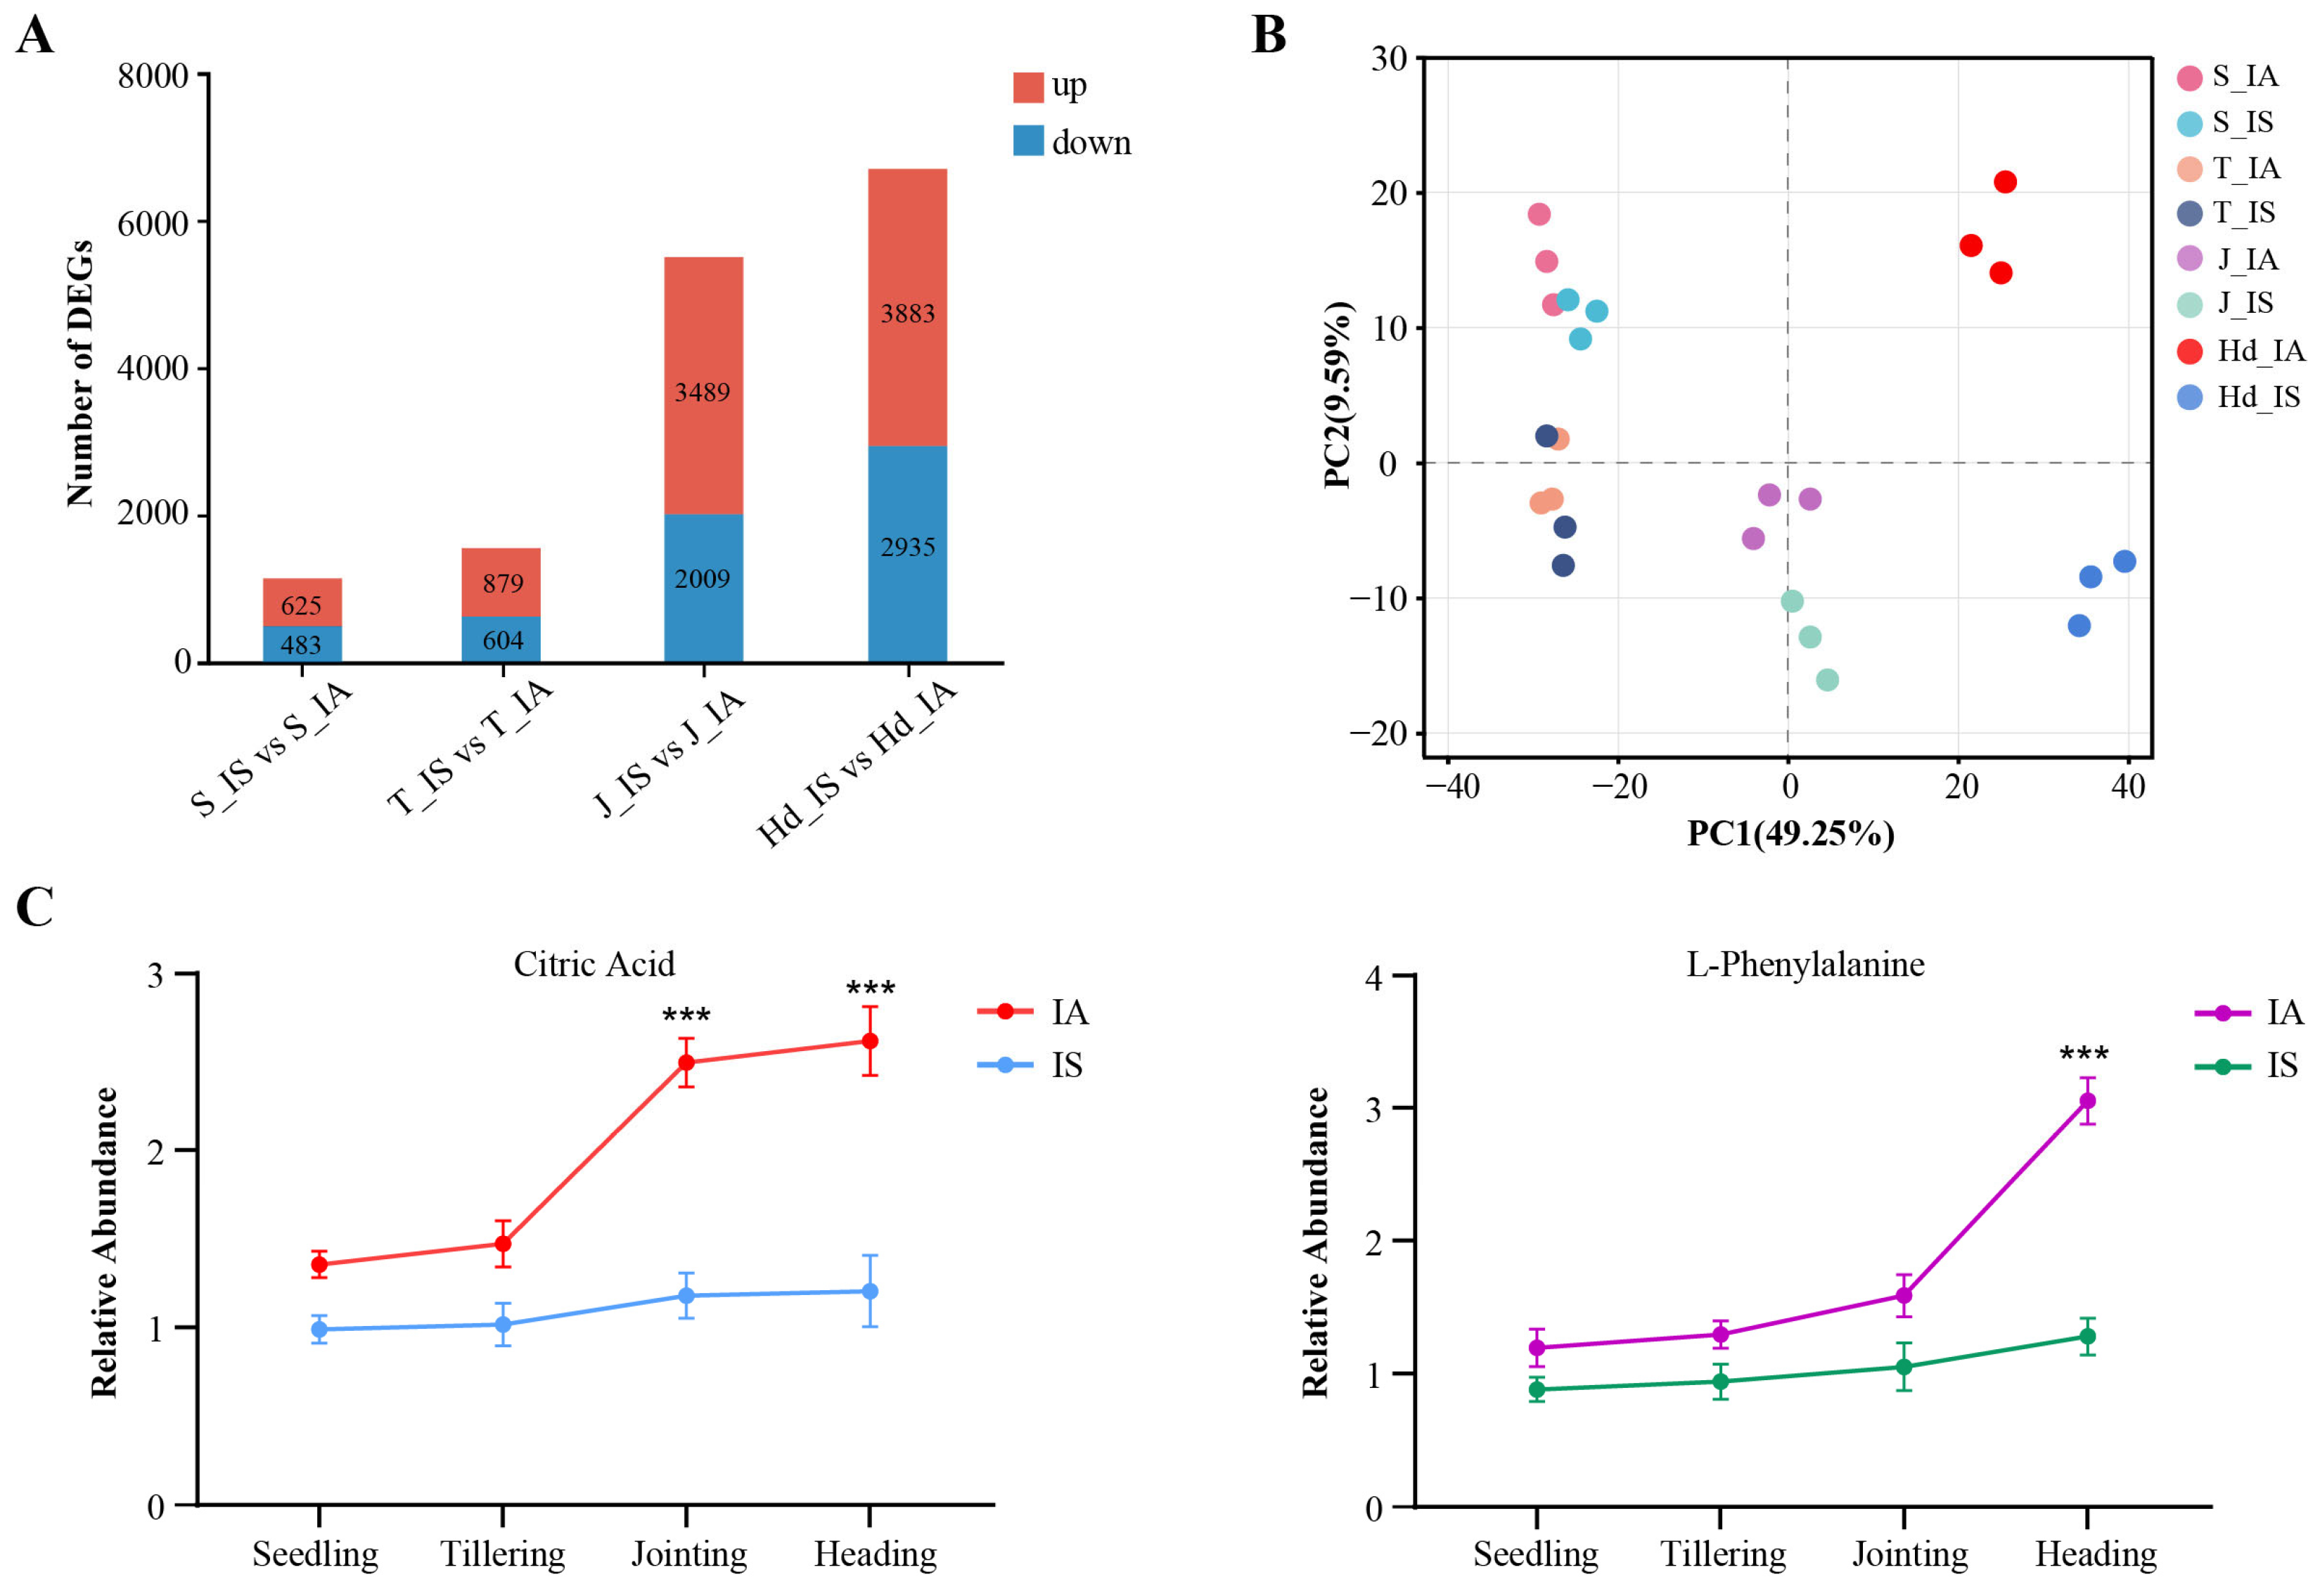
Comparative analysis revealed limited transcriptomic divergence at early developmental stages, with 1108 and 1483 differentially expressed genes (DEGs) identified at seedling and tillering, respectively (
Figure 1A). In contrast, jointing and heading exhibited substantial transcriptional reprogramming, with 5498 and 6818 DEGs, respectively. This sharp increase in DEG abundance at later stages indicates that the transcriptional response of proso millet to
A. destruens is developmentally regulated. Although IA and IS samples clustered together at seedling and tillering, they separated distinctly along PC1 at jointing, with further divergence at heading (
Figure 1B). As previously reported in our metabolomics study [
31], the proso millet cultivar ‘Chishu 13’ exhibits a two-stage metabolic defense strategy against
A. destruens, characterized by TCA cycle intermediate accumulation at jointing and phenylpropanoid pathway activation at heading. These established metabolic phenotypes provide the essential biological context and validation foundation for the present transcriptomic analysis. Integration with these previously published metabolite profiling data revealed coordinated multi-omics changes: at jointing, elevated citrate levels in IA plants coincided with transcriptional activation of tricarboxylic acid (TCA) cycle genes, while peak phenylalanine accumulation at heading corresponded to upregulation of phenylpropanoid biosynthesis genes (
Figure 1C). These temporally aligned transcriptomic and metabolomic shifts support a sequential defense strategy in which smut resistance in proso millet involves the ordered activation of energy metabolism followed by secondary metabolite biosynthesis.
3.2. Temporal Dynamics of Differentially Expressed Genes
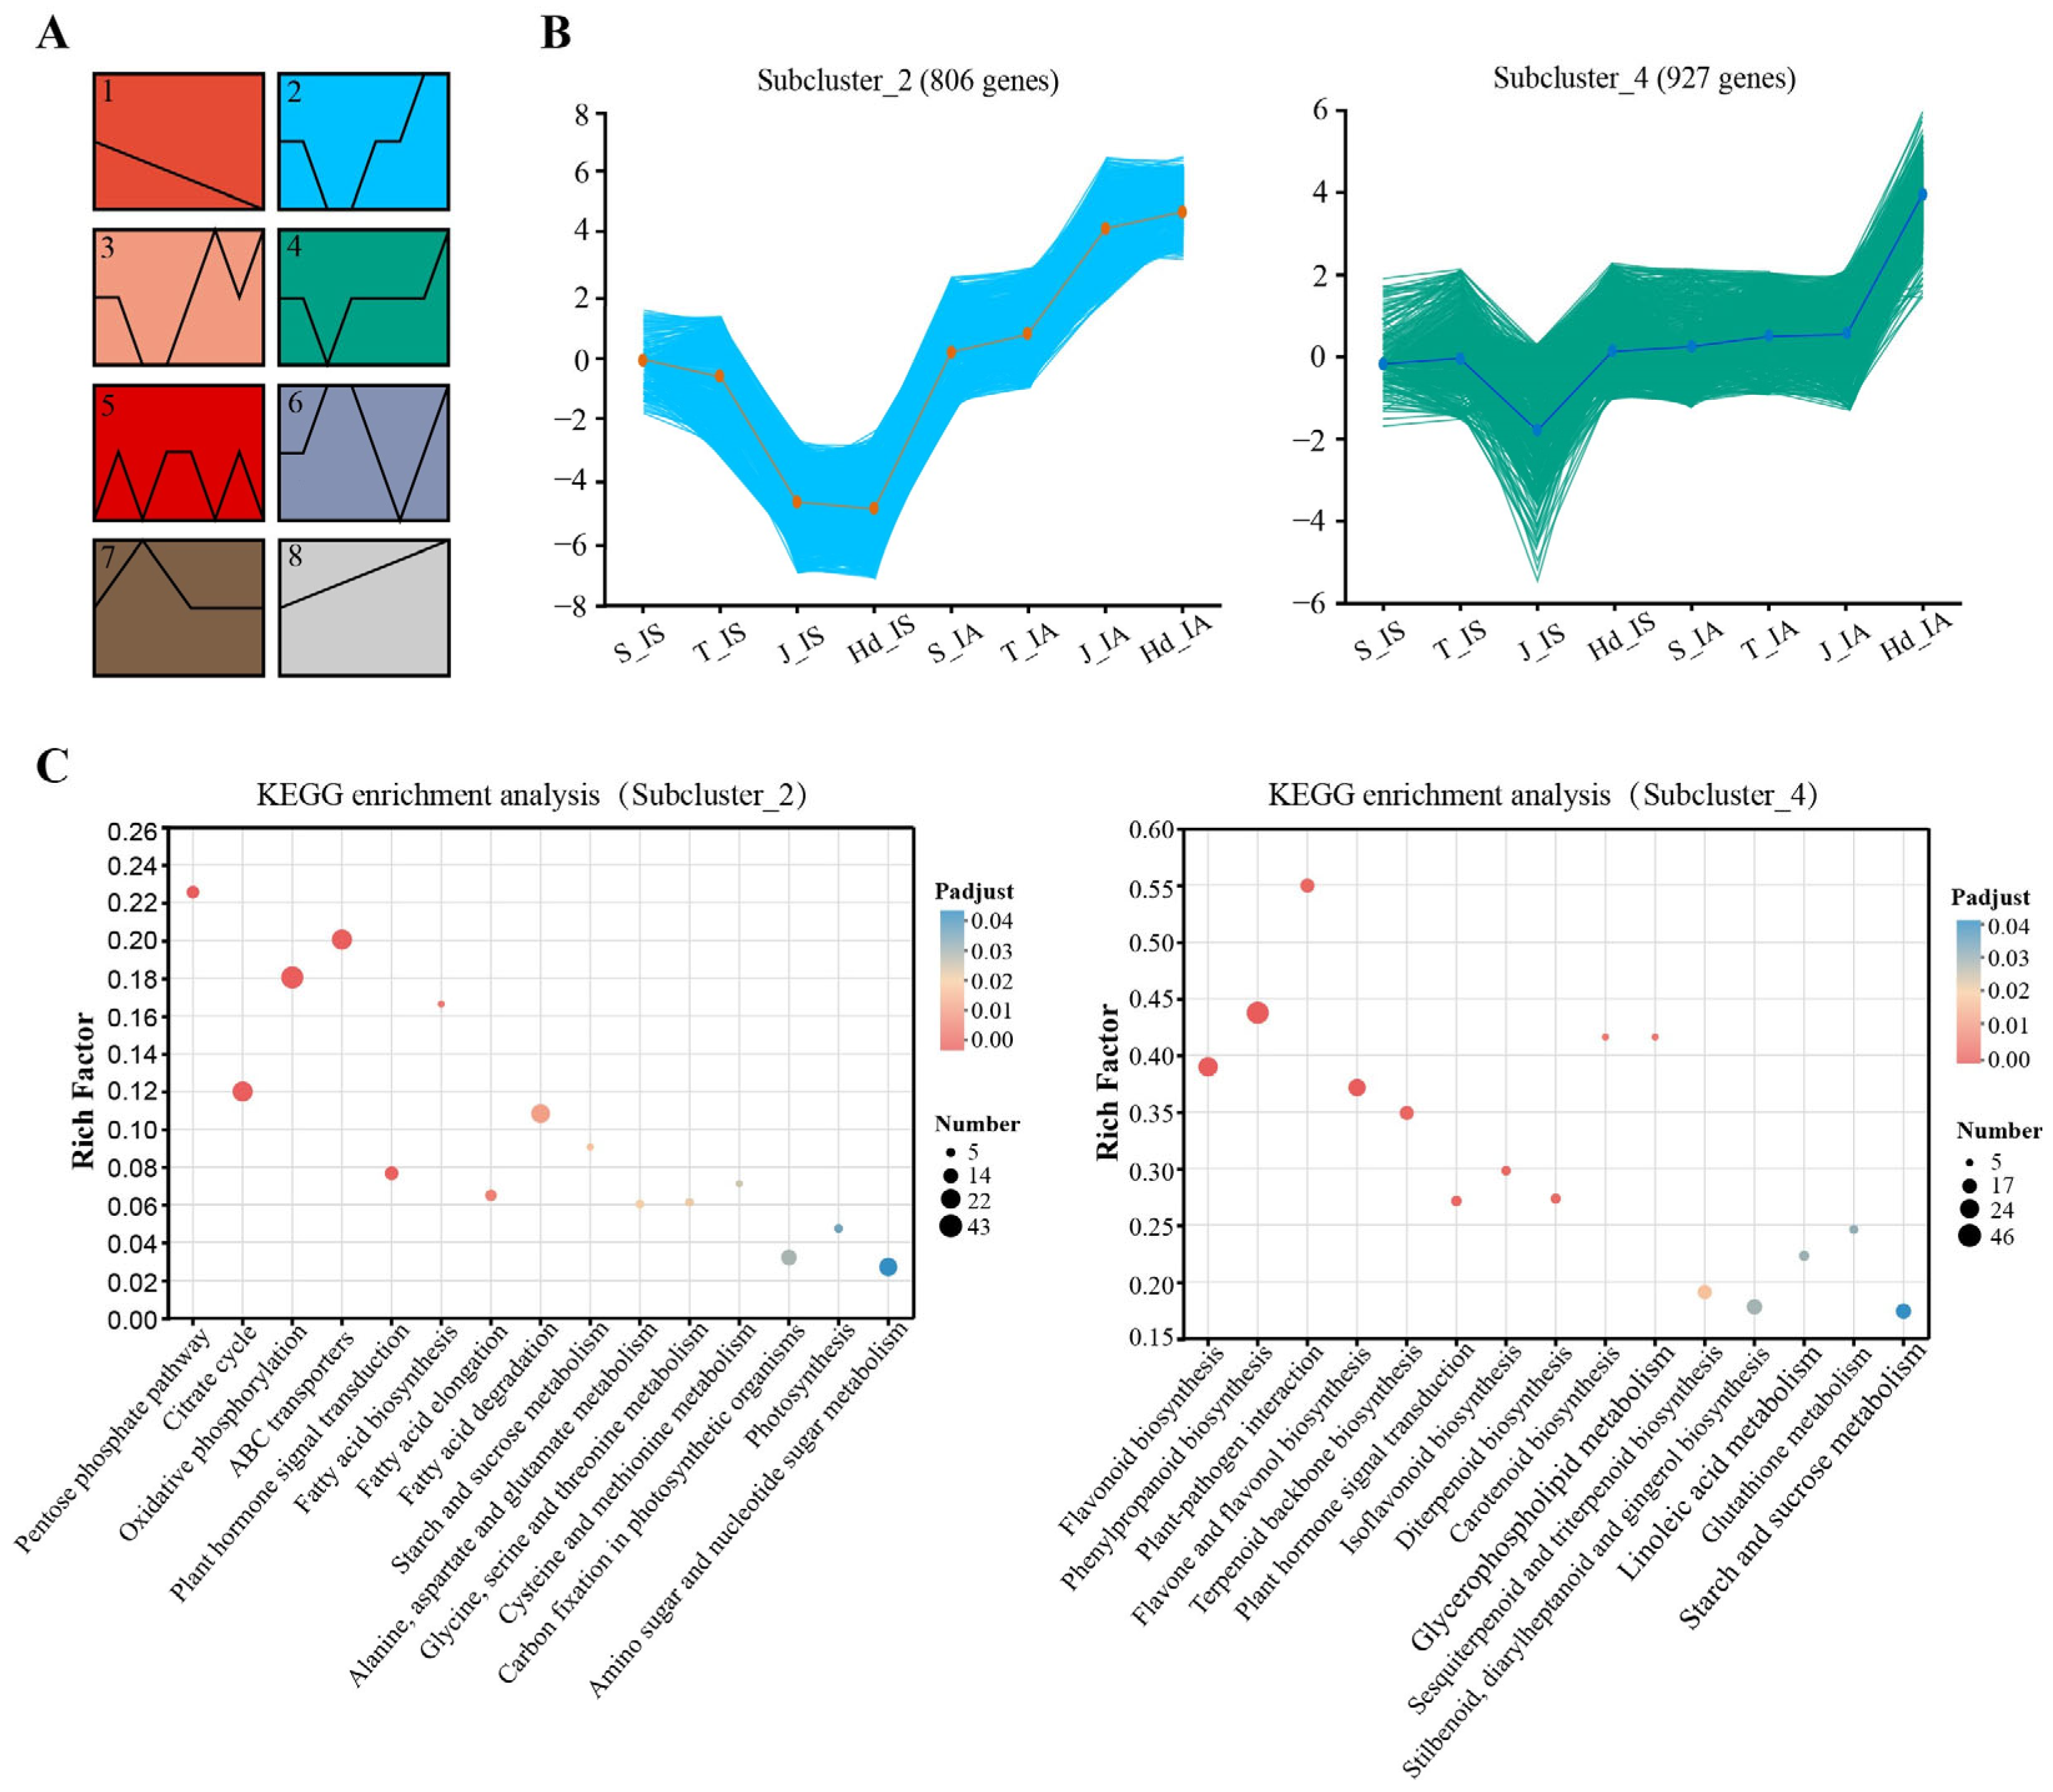
K-means clustering based on time-series expression patterns partitioned the DEGs into eight distinct subclusters (
Figure 2A). Among these, Subcluster 2 (806 genes) exhibited jointing-specific upregulation exclusively in IA plants, while Subcluster 4 showed heading-specific induction predominantly in the IA group with concurrent suppression in IS plants. These two subclusters were selected for detailed characterization (
Figure 2B) because their opposing expression trends between IA and IS plants—upregulation in resistant versus downregulation in susceptible individuals—closely mirrored the stage-specific accumulation patterns of TCA cycle intermediates and phenylpropanoid metabolites observed in our prior metabolomic profiling [
31], providing direct transcriptomic evidence supporting the two-stage defense model. The remaining six subclusters lacked such consistent multi-omics concordance and were therefore not pursued further.
To elucidate the functional relevance of these stage-specific DEGs, we performed KEGG pathway enrichment analysis. Genes in Subcluster 2 were significantly enriched in central metabolic pathways, including the TCA cycle, oxidative phosphorylation, ABC transporters, and the pentose phosphate pathway (
Figure 2C). In contrast, genes in Subcluster 4 were predominantly enriched in secondary metabolism and defense-related pathways, including flavonoid biosynthesis, phenylpropanoid biosynthesis, plant–pathogen interaction, and flavone and flavonol biosynthesis (
Figure 2C).
3.3. WGCNA Identifies Stage-Specific Regulatory Modules Associated with Resistance in IA Plants
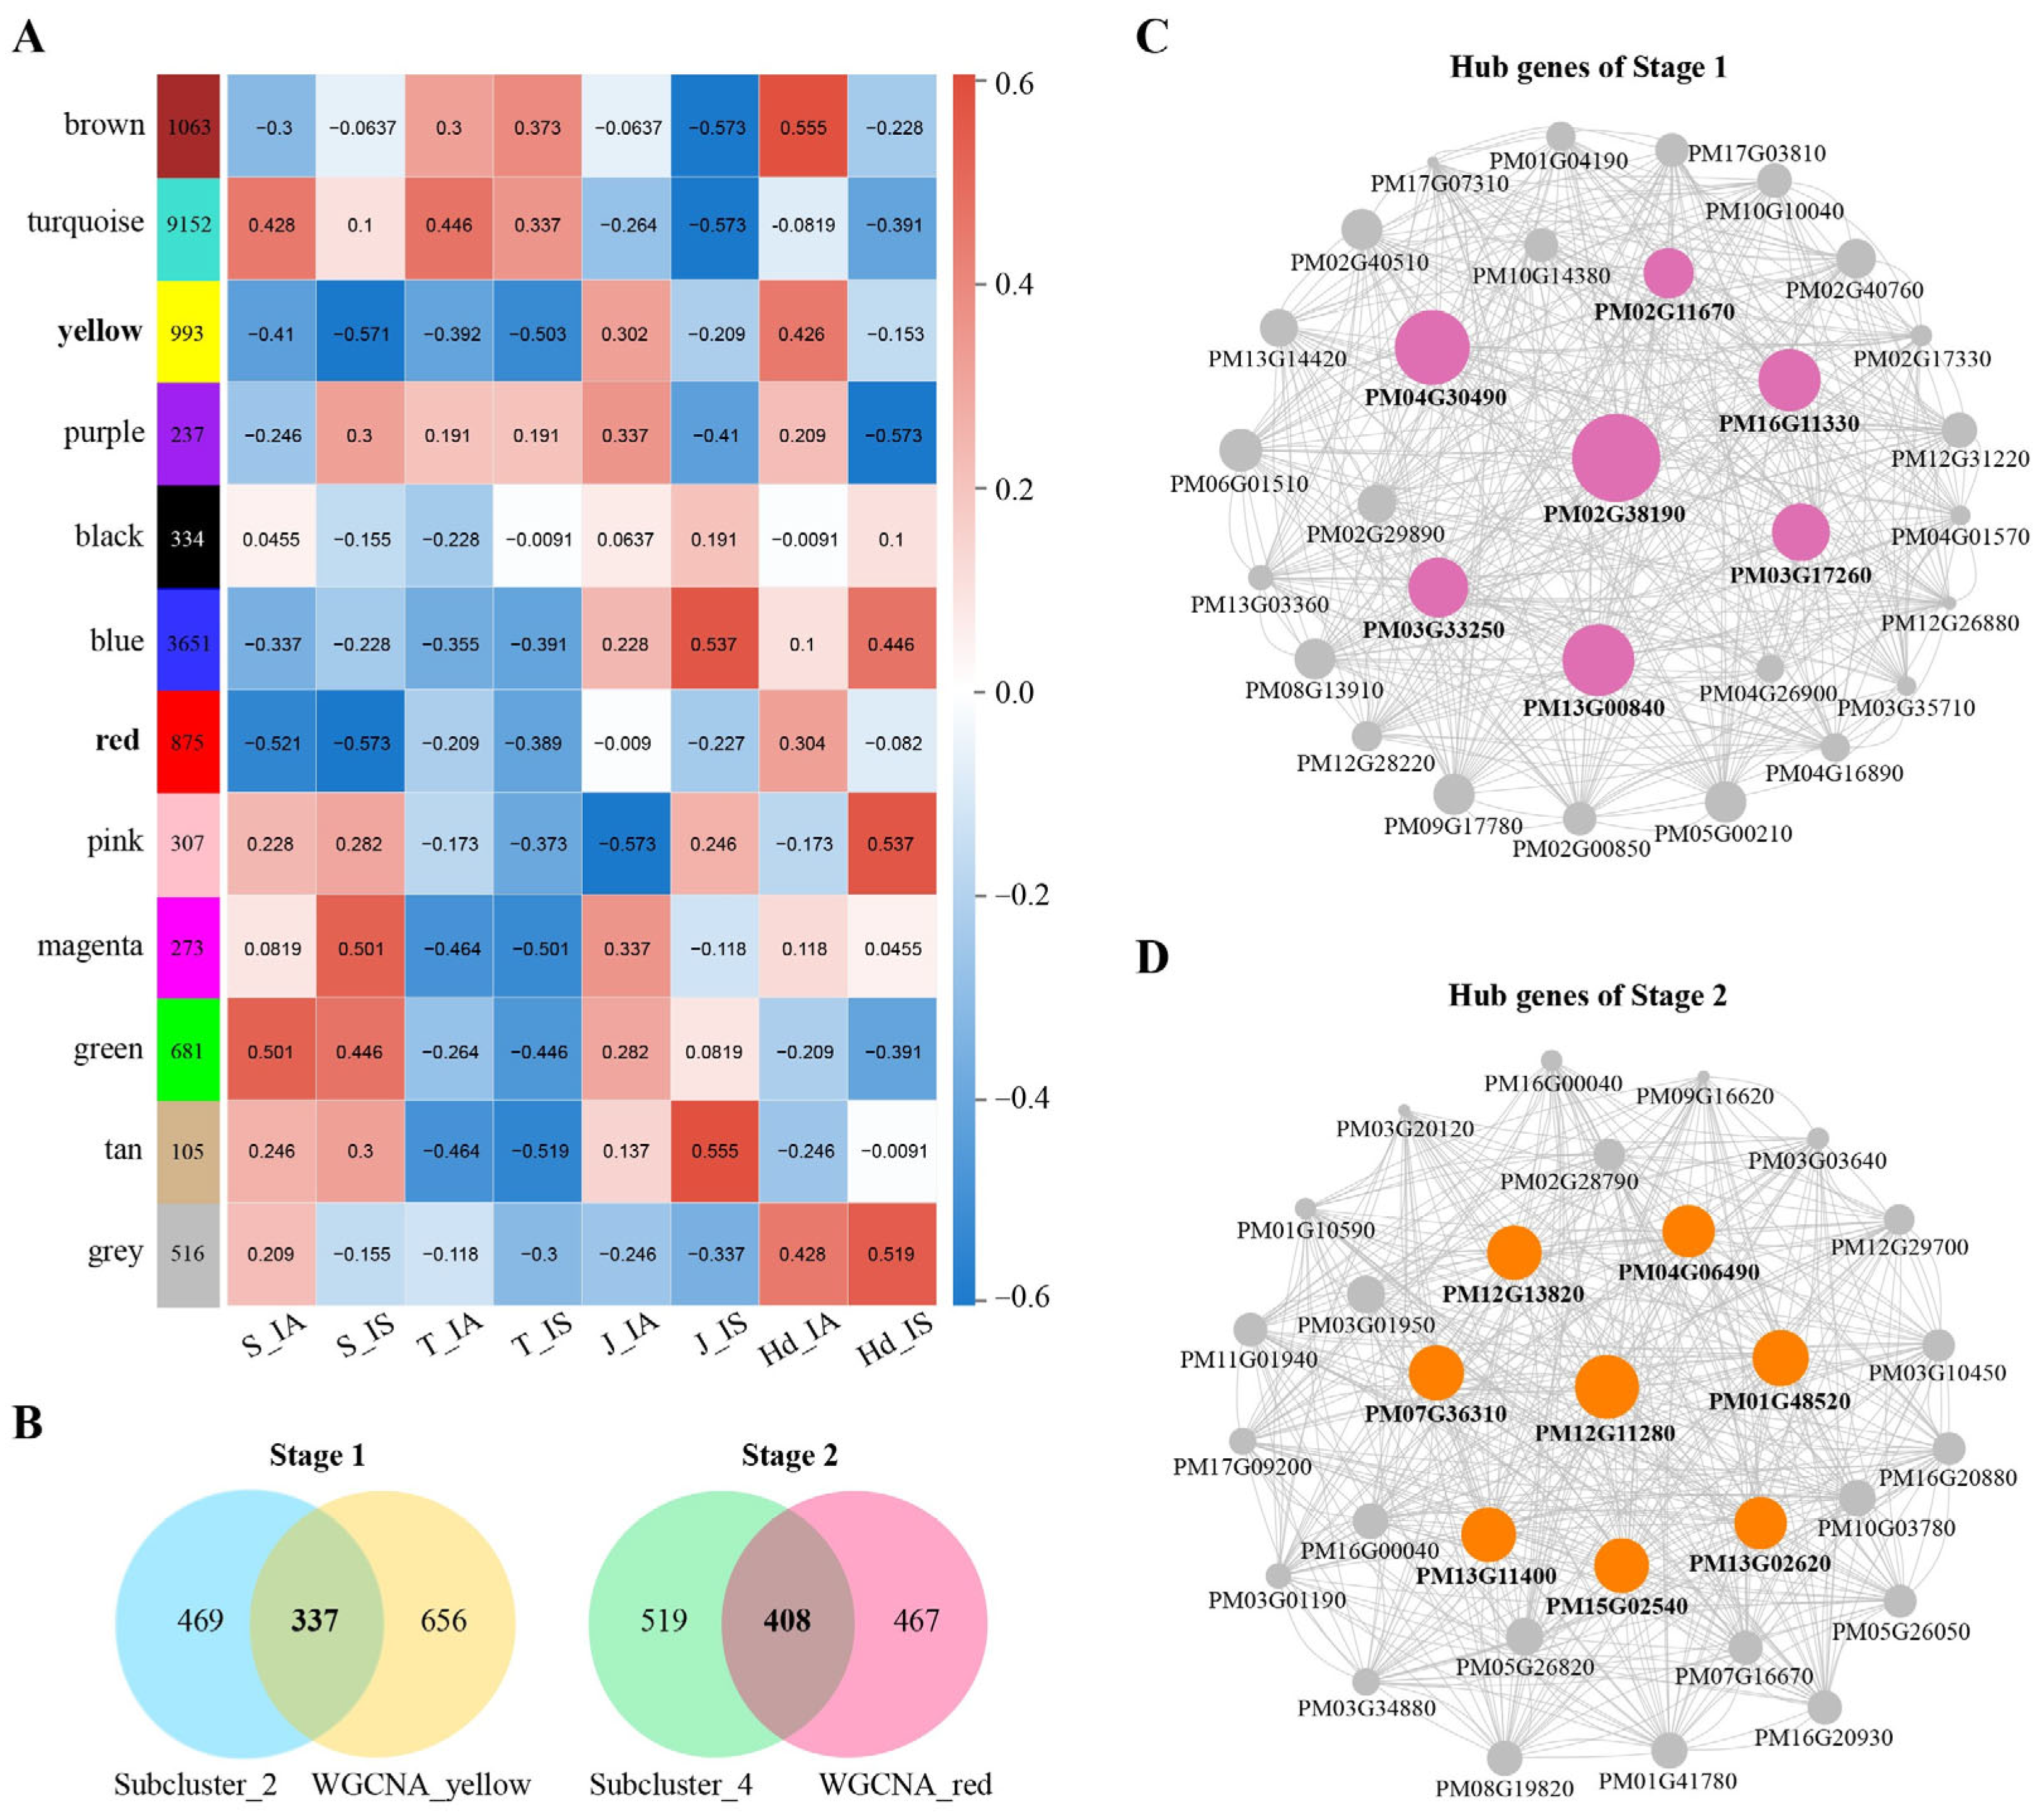
To systematically identify genome-wide regulatory modules associated with disease resistance, we performed weighted gene co-expression network analysis (WGCNA) on all DEGs, which yielded 12 distinct co-expression modules (
Figure 3A). The yellow module was positively correlated with IA plants at jointing, while the red module showed a positive correlation with IA plants at heading.
To obtain high-confidence candidate genes, we intersected the subclusters identified by TSTA with the modules defined by WGCNA. Specifically, the intersection of Subcluster 2 (jointing-specific) and the yellow module yielded 337 candidates specific to the jointing stage (Stage 1), while the intersection of Subcluster 4 (heading-specific) and the red module yielded 408 candidates specific to the heading stage (Stage 2) (
Figure 3B). These genes exhibit both temporal specificity and strong co-expression patterns. Topological analysis of the top 30 hub genes within each stage revealed highly interconnected co-expression network structures in both Stage 1 (jointing) (
Figure 3C) and Stage 2 (heading) (
Figure 3D). Notably, seven hub genes in Stage 1 and eight in Stage 2 displayed module eigengene connectivity (kME) values exceeding 0.95, indicating their central positions within their respective regulatory networks.
3.4. Population-Specific Association Between Stage 1 Hub Genes and TCA Cycle Metabolites
Our previous metabolomic analysis revealed that TCA cycle metabolites, including citrate, succinate, and fumarate, are significantly enriched during Stage 1 (jointing) of the defense response, representing key metabolic features of this stage. To investigate the relationship between gene expression and metabolite abundance, we performed correlation analysis between the top 30 hub genes identified in Stage 1 and these three TCA cycle metabolites.
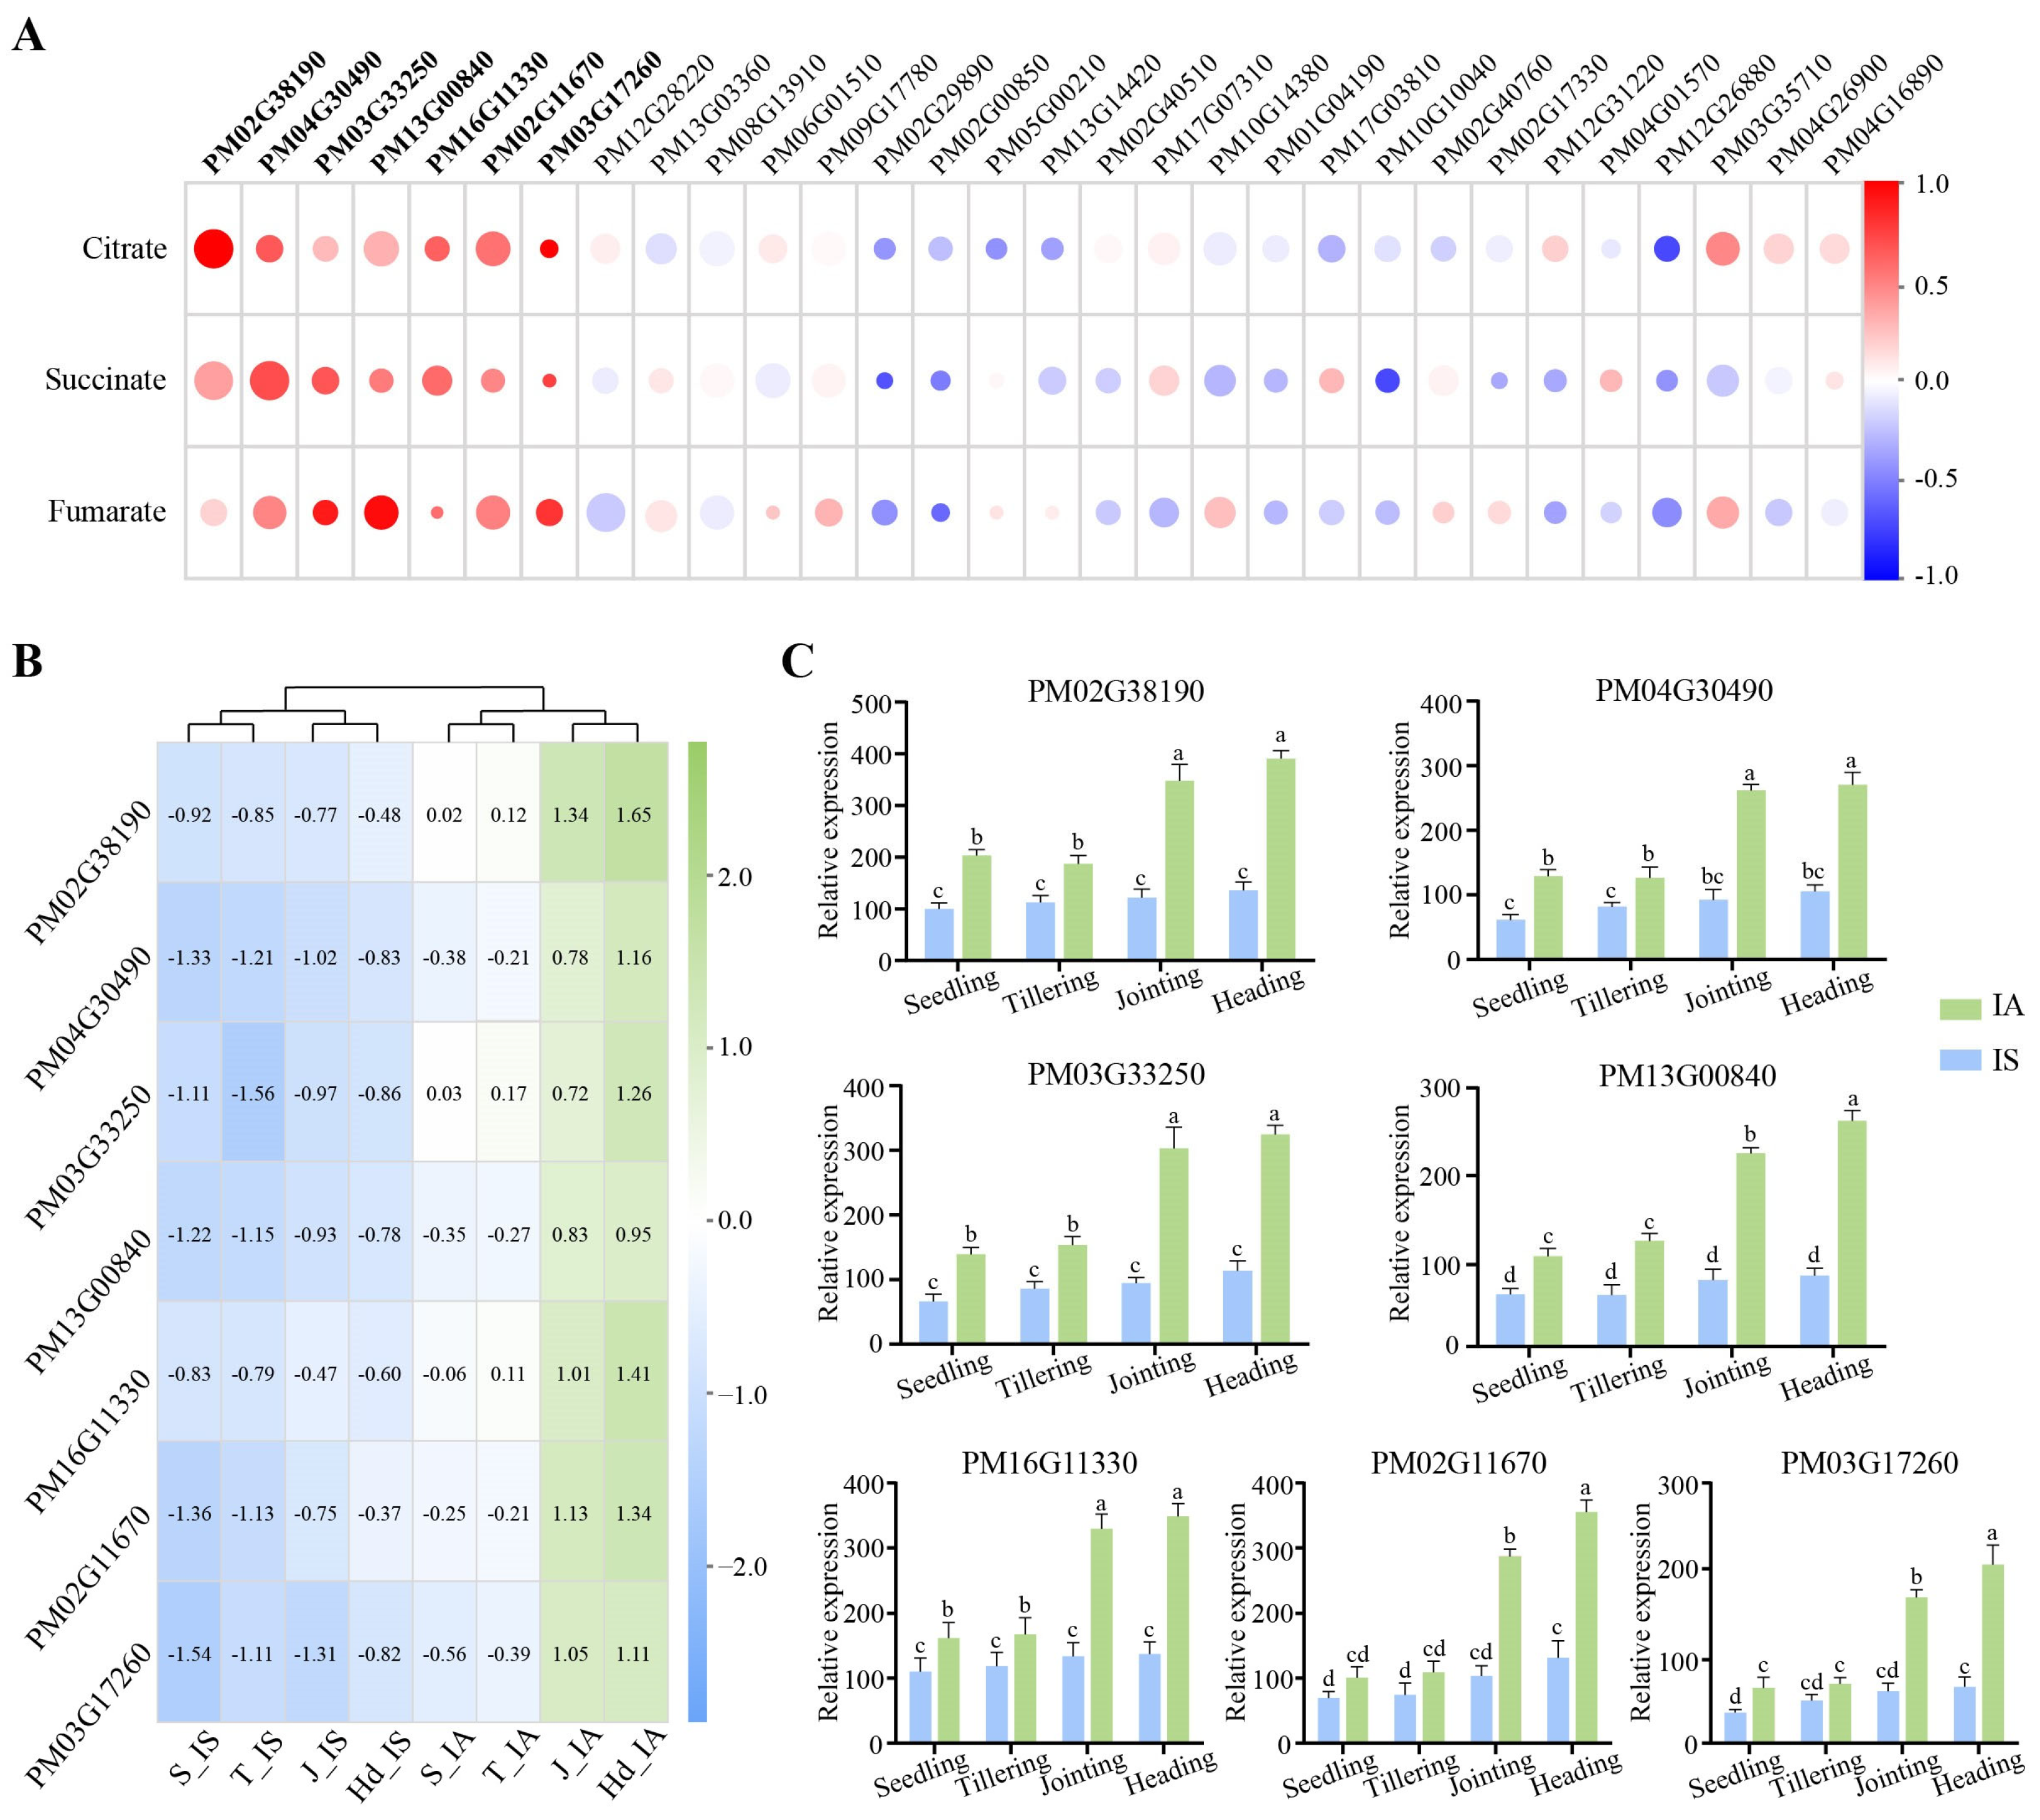
In the IA population, expression levels of seven hub genes (PM02G38190, PM04G30490, PM03G33250, PM13G00840, PM16G11330, PM02G11670, and PM03G17260) were positively correlated with TCA cycle metabolite abundance (
Figure 4A), indicating a coordinated transcriptional–metabolic regulatory network in IA plants at jointing. Temporal expression heatmaps further showed that these seven hub genes exhibited highly synchronized upregulation in the IA population at jointing, whereas their expression was markedly reduced in the IS population at the same stage (
Figure 4B). qPCR validation results were highly consistent with RNA-seq data, confirming significant differential expression of these seven hub genes between IA and IS populations (
Figure 4C). Collectively, these findings suggest that the seven Stage 1 hub genes may provide the metabolic foundation for early-stage defense in resistant plants by modulating TCA cycle flux.
3.5. Stage 2-Specific Transcriptional Regulation of the Phenylpropanoid Pathway
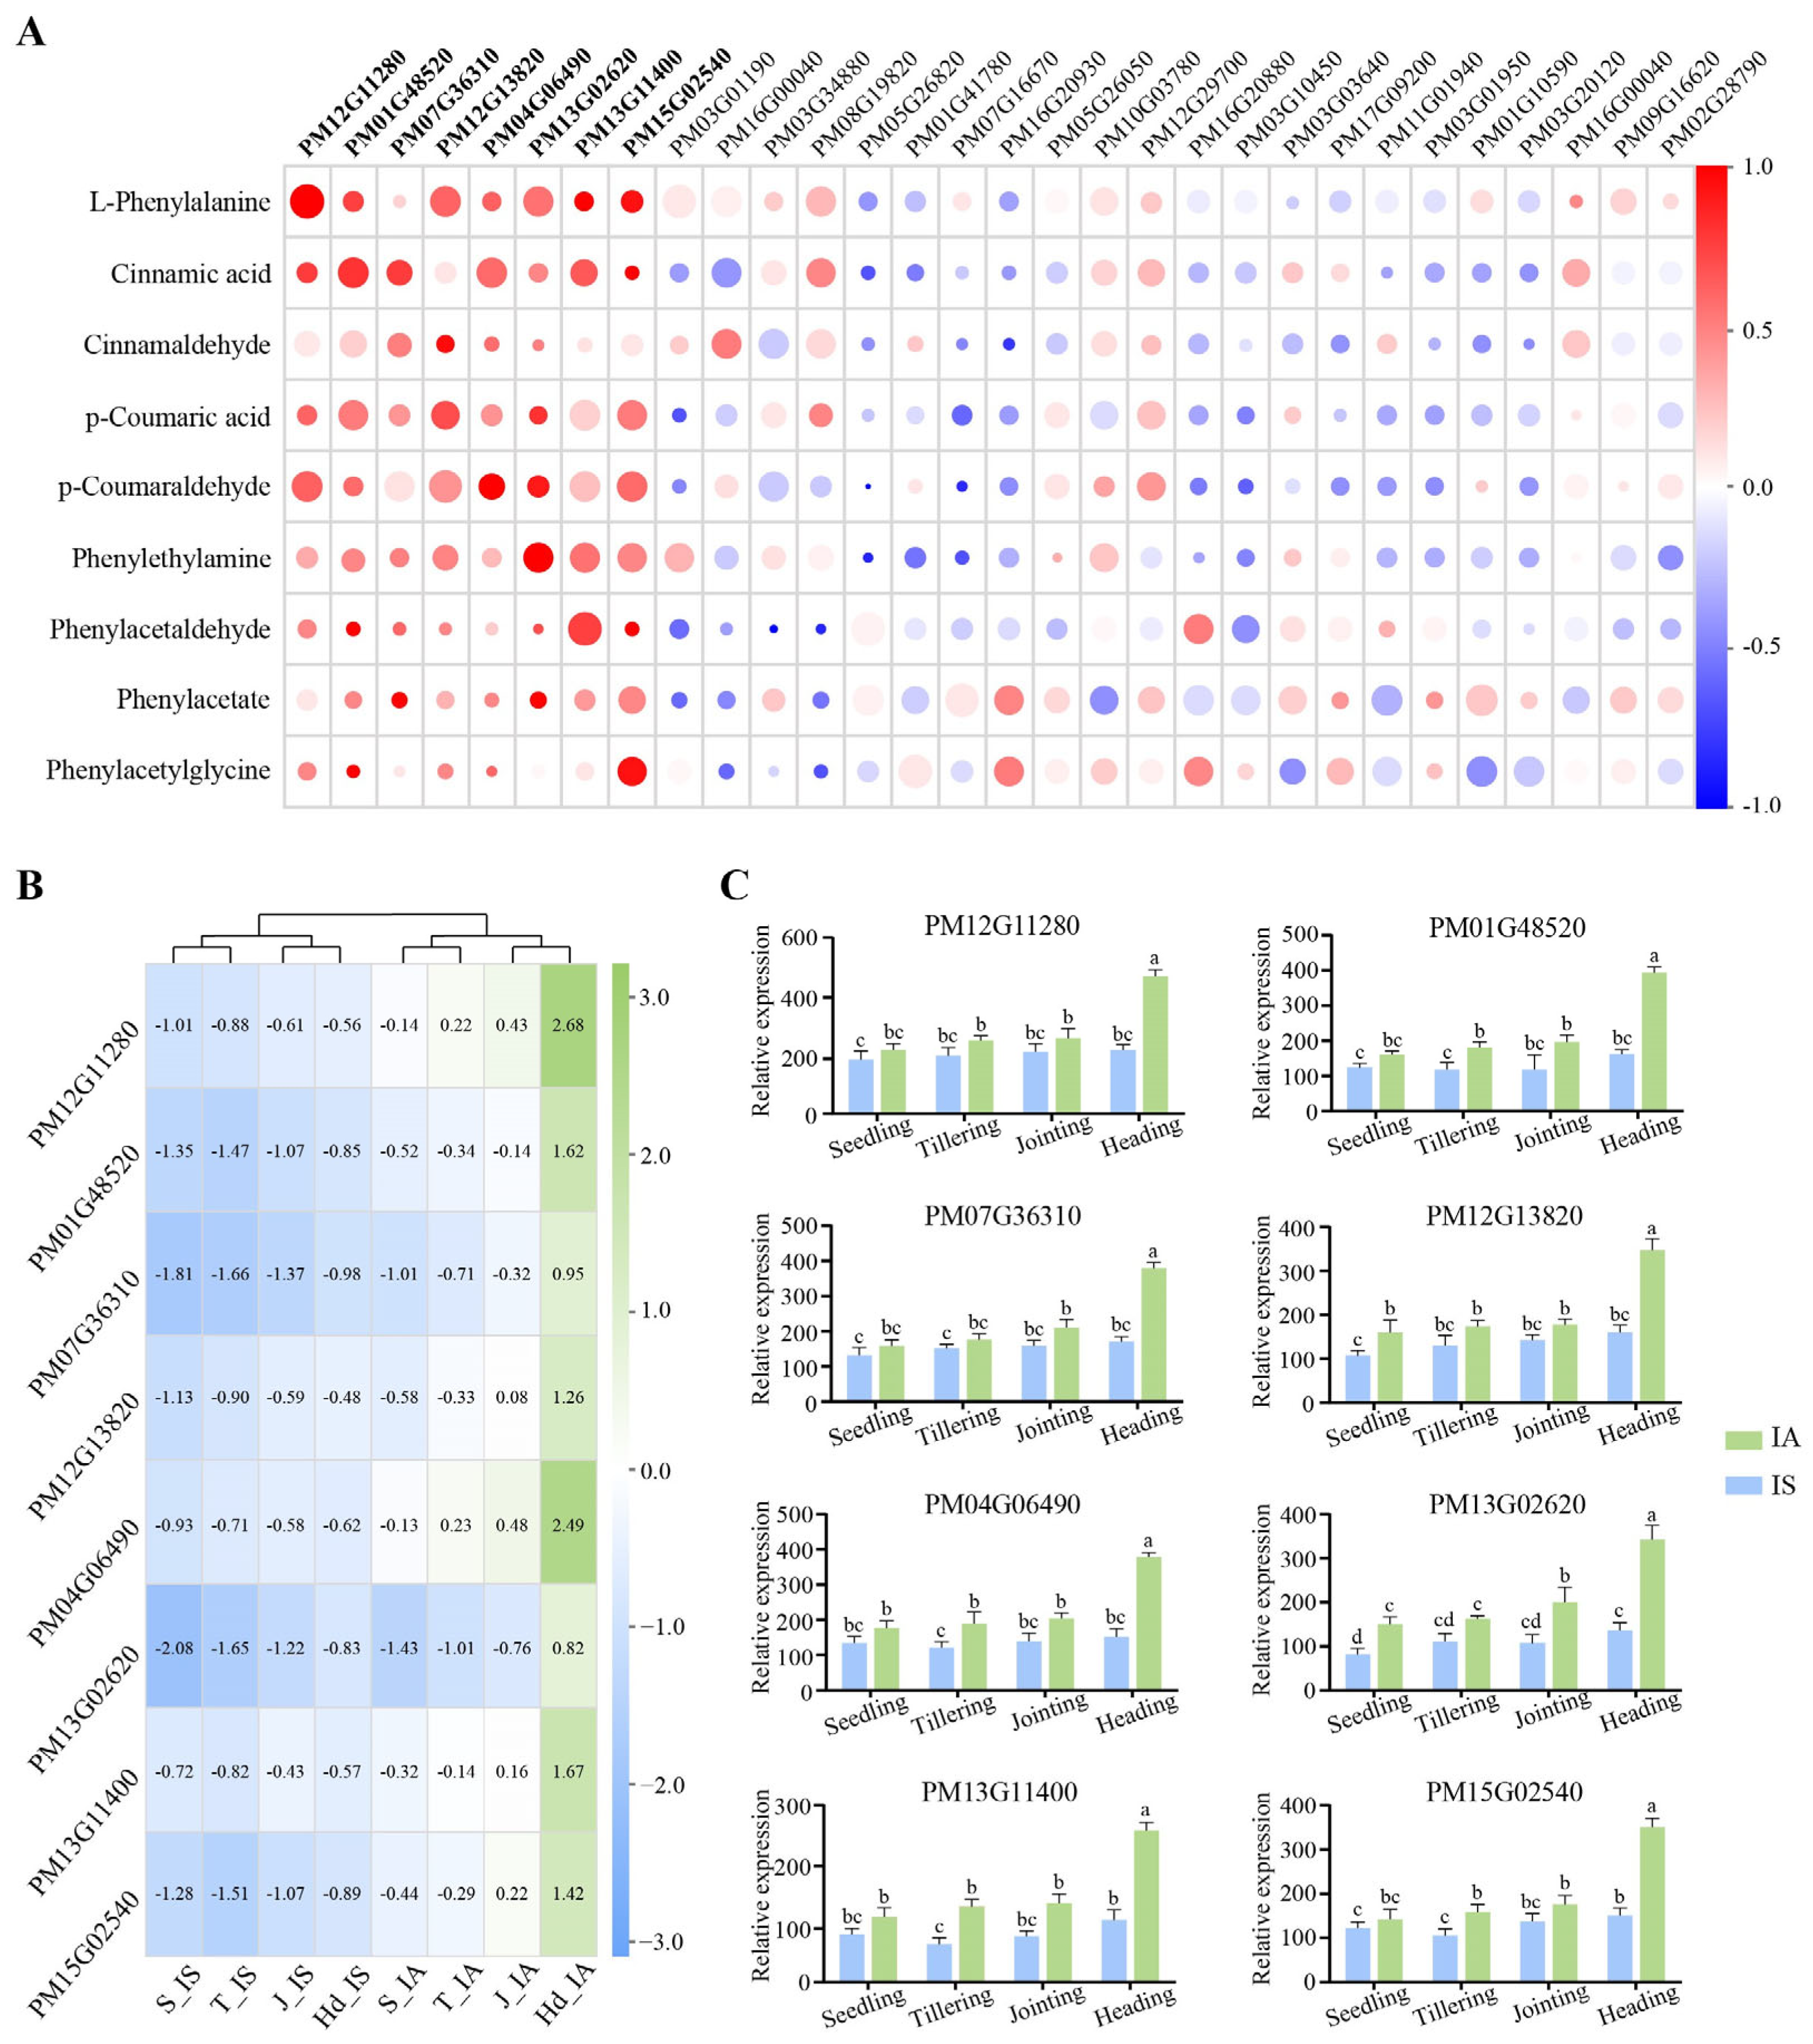
Metabolomic profiling identified nine phenylpropanoid pathway intermediates—L-phenylalanine, cinnamic acid, cinnamaldehyde, p-coumaric acid, p-coumaraldehyde, phenethylamine, phenylacetaldehyde, phenylacetate, and phenylacetylglycine—that were significantly enriched during Stage 2 of the defense response. To elucidate the transcriptional regulatory mechanisms underlying this metabolic shift, we performed correlation analysis between the top 30 hub genes identified in Stage 2 and the abundance of these nine phenylpropanoid metabolites.
Pearson correlation analysis revealed that, in IA plants, expression levels of eight hub genes (PM12G11280, PM01G48520, PM07G36310, PM12G13820, PM04G06490, PM13G02620, PM13G11400, and PM15G02540) were positively correlated with phenylpropanoid metabolite accumulation, indicating coordinated transcriptional regulation of this pathway in the resistant phenotypic group (
Figure 5A). Temporal expression profiling further demonstrated that these eight hub genes formed a tightly co-regulated transcriptional module in IA plants at heading, with all genes exhibiting synchronous upregulation. In contrast, this transcriptional module was largely suppressed in IS plants at the same developmental stage, displaying heterogeneous and reduced expression patterns (
Figure 5B). Quantitative real-time PCR validation confirmed the RNA-seq results, showing high consistency between the two platforms and corroborating phenotypic-group-specific transcriptional reprogramming of phenylpropanoid pathway genes during the Stage 2 defense response (
Figure 5C).
3.6. Coordinated Transcriptional–Metabolic Regulation Underlying Two-Stage Metabolic Reprogramming
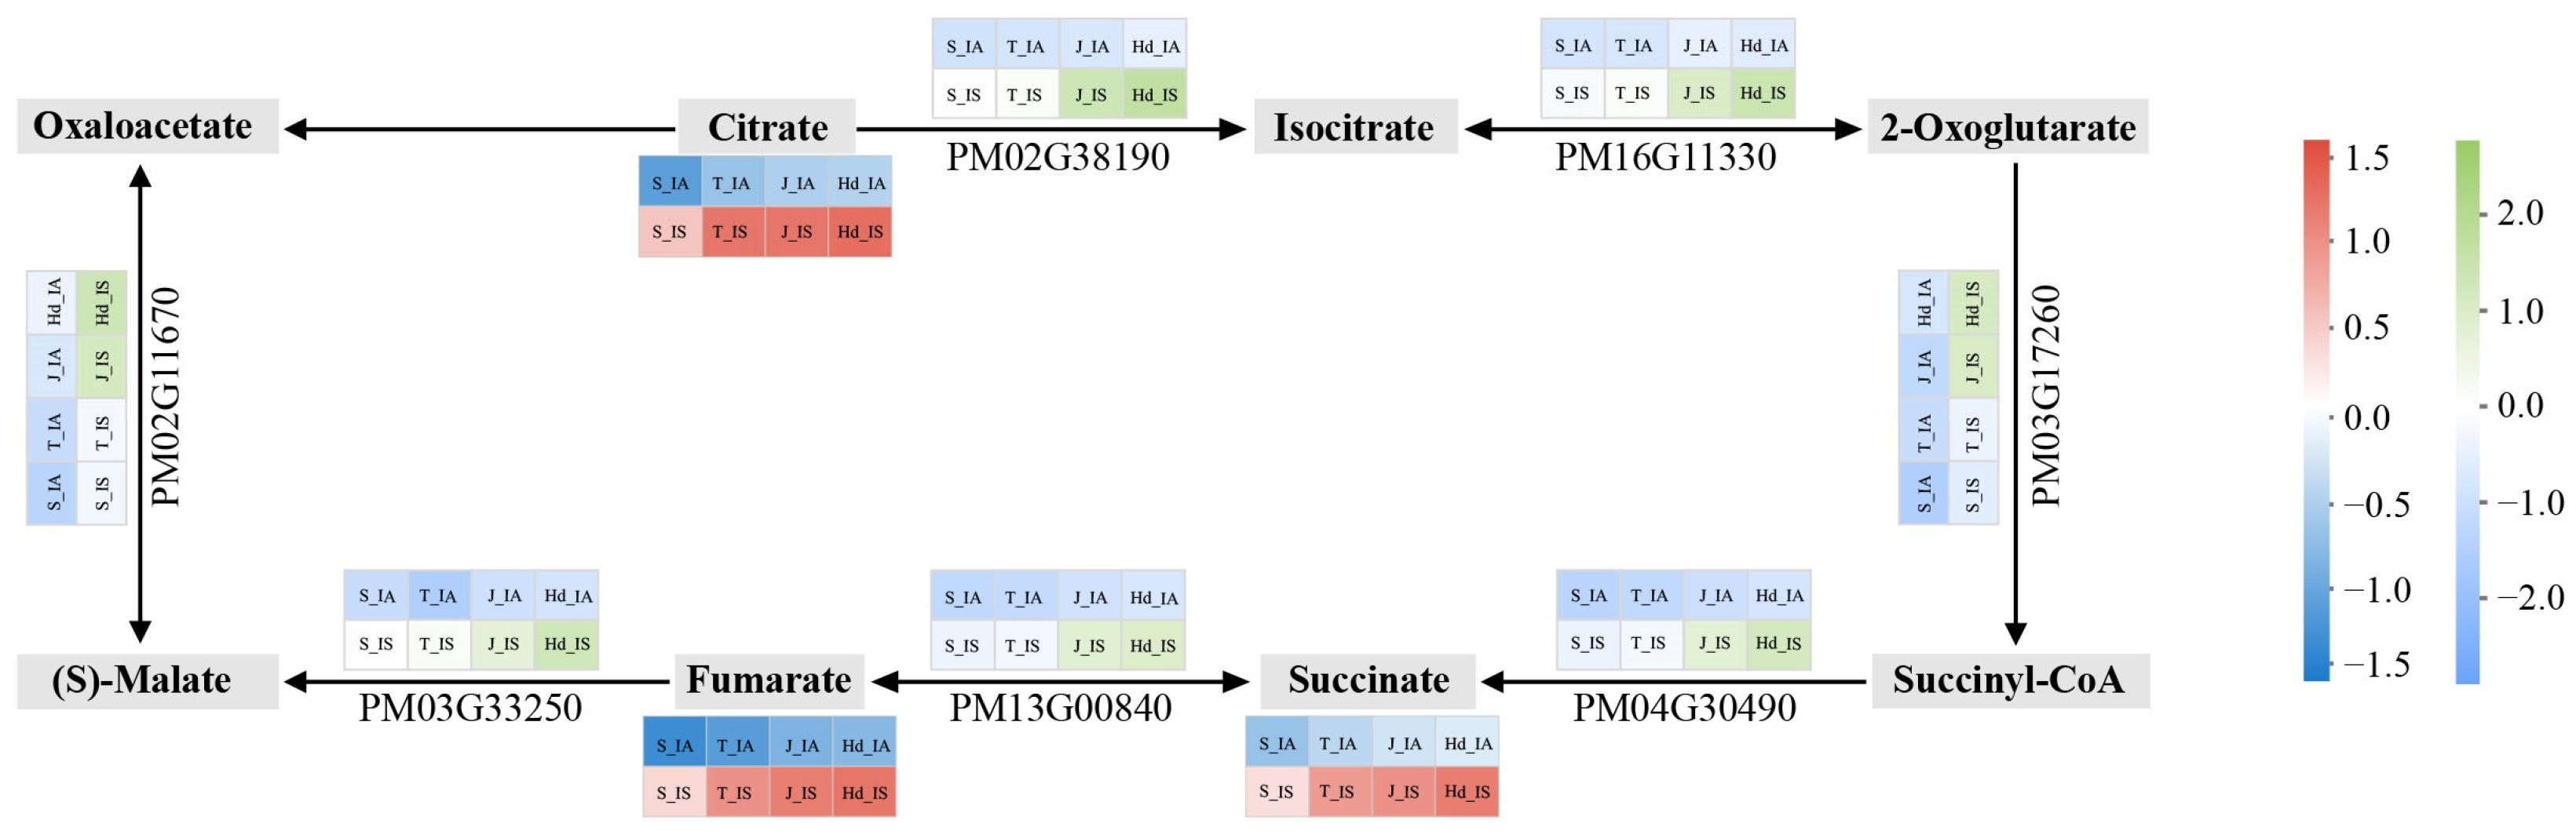
Transcriptome–metabolome association network analysis identified seven candidate genes significantly correlated with TCA cycle metabolites; these genes encode key enzymes including ACO, IDH1, and LSC1 that catalyze rate-limiting reactions in the TCA cycle (
Table S1). Transcript levels of these genes showed coordinated variation with the accumulation of their corresponding metabolites. At jointing, these genes exhibited elevated expression in the IA population but were suppressed in the IS population (
Figure 6). This phenotypic-group-specific expression pattern establishes an efficient primary metabolic regulatory module that accelerates carbon skeleton turnover and provides sufficient metabolic precursors and energy reserves for the subsequent activation of secondary metabolic networks.
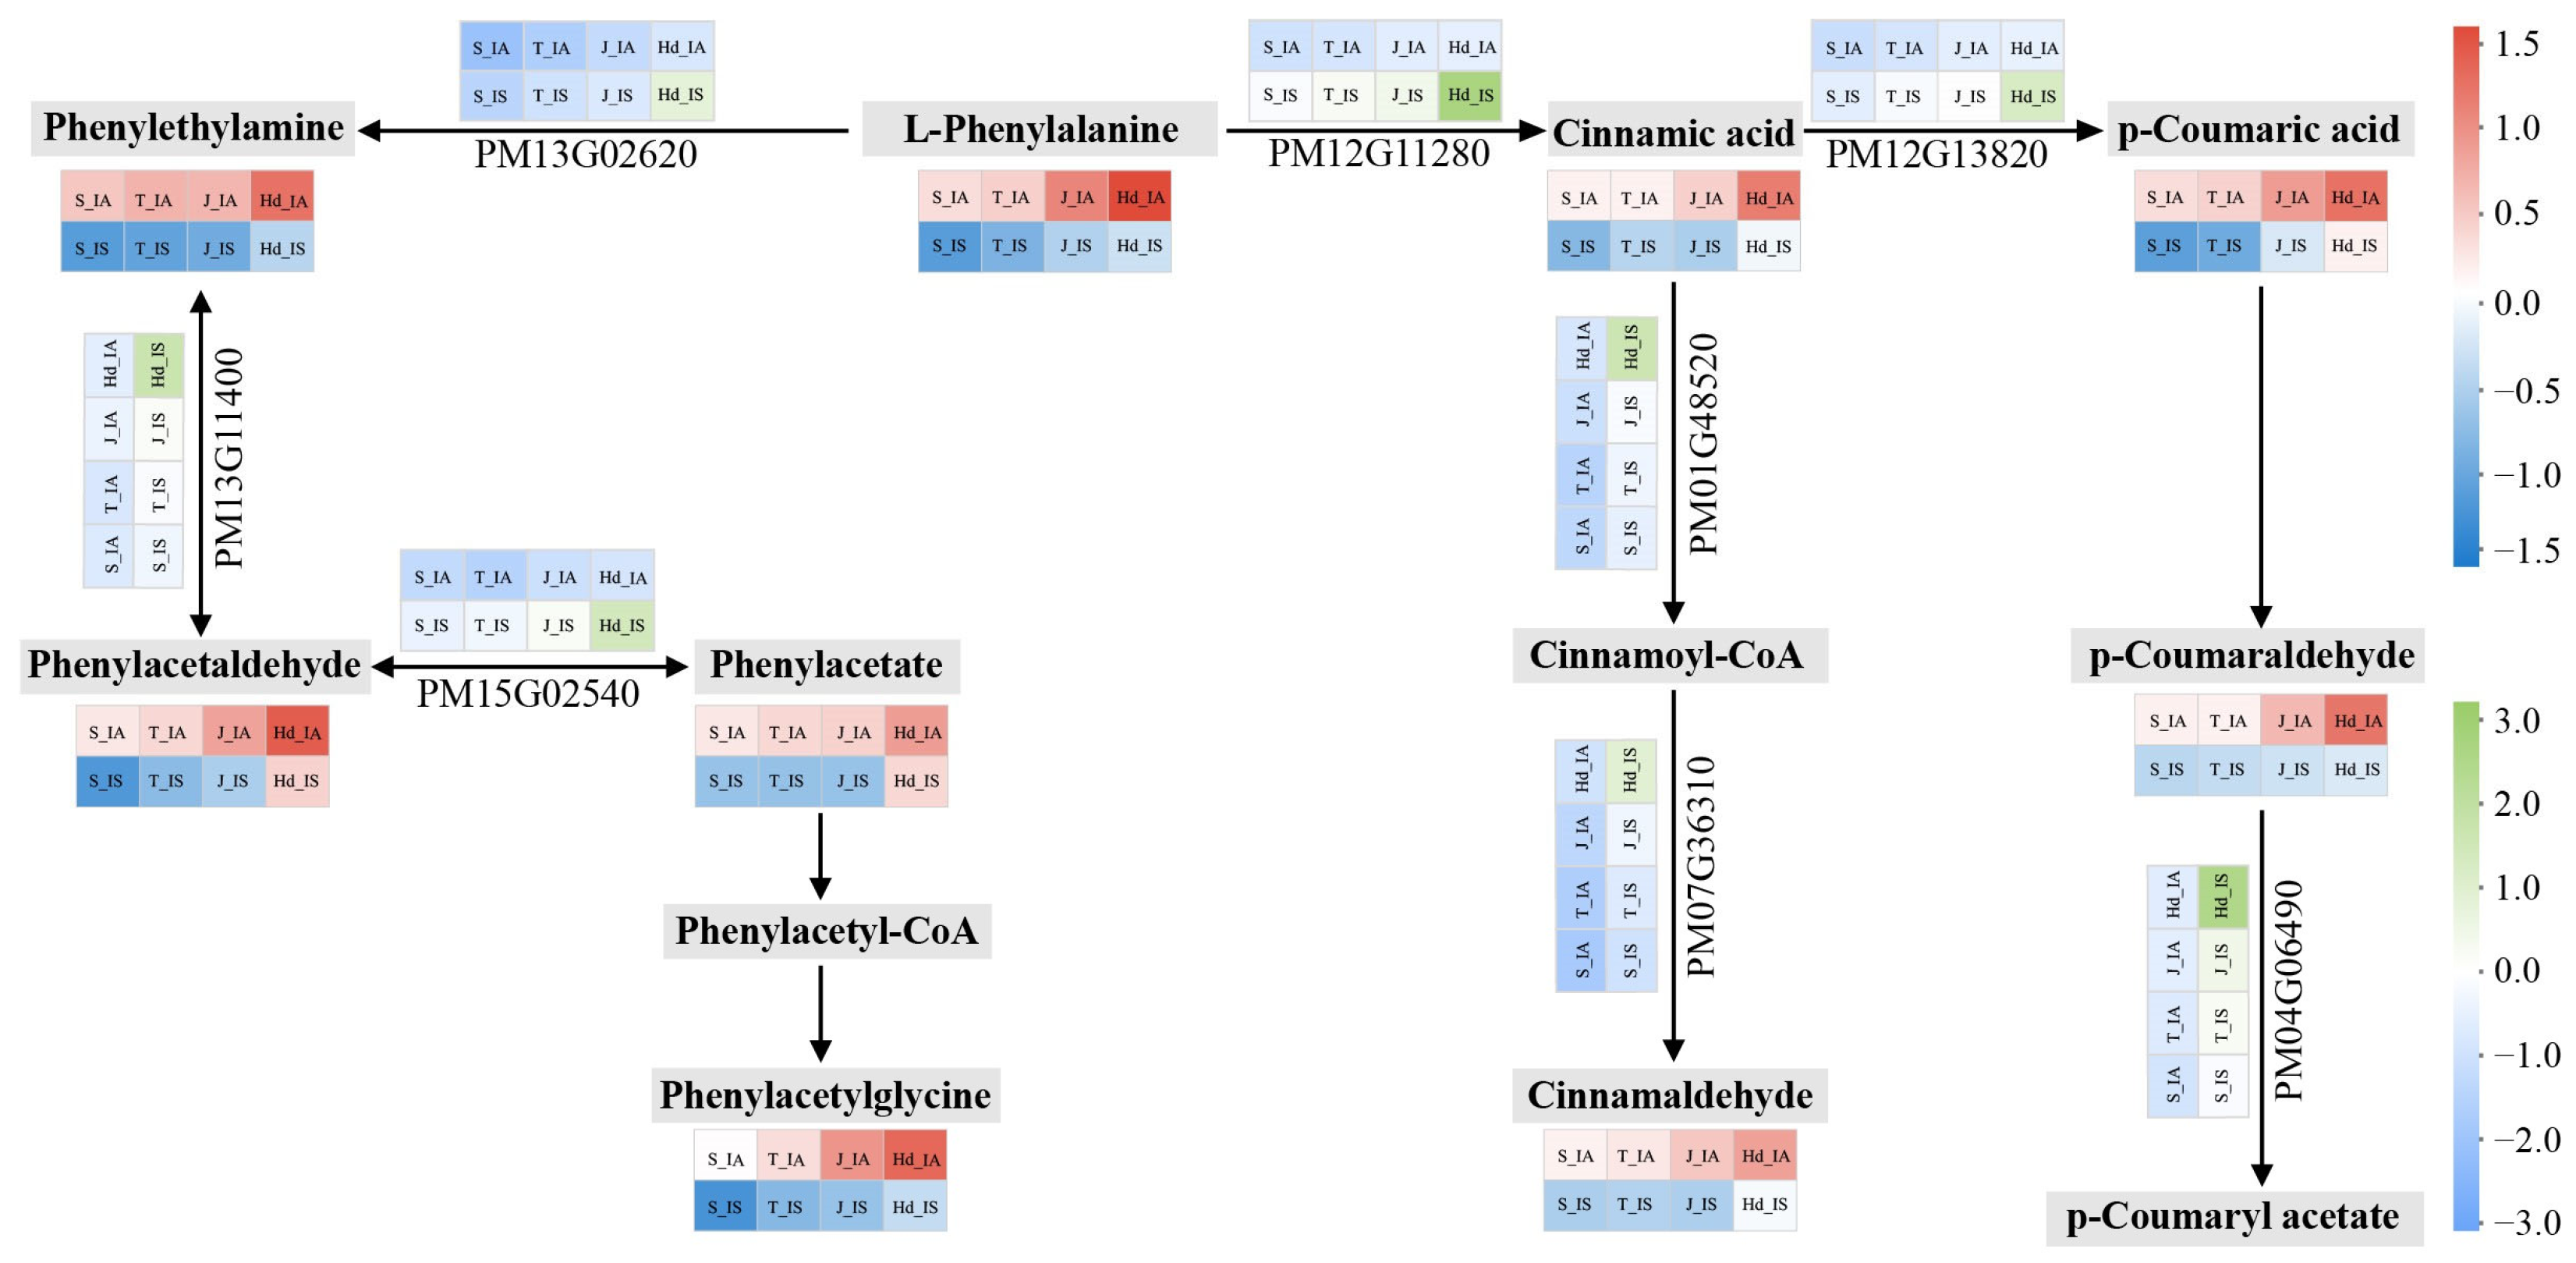
In Stage 2, eight candidate key genes involved in phenylpropanoid pathway regulation encode rate-limiting enzymes including PCL, 4CL, and CAD, which catalyze the conversion from phenylalanine to downstream metabolites (
Table S1). At heading, expression levels of these genes were markedly higher in the IA population than in the IS population, showing clear phenotypic-group-specific differentiation (
Figure 7). This differential expression pattern indicates that the phenylpropanoid pathway forms a functionally complete secondary metabolic regulatory unit in the resistant phenotypic group, providing the molecular basis for efficient synthesis of plant defense compounds.
4. Discussion
PCA revealed that the transcriptomes of IA and IS plants were highly overlapping during seedling and tillering stages, with divergence emerging only at jointing (
Figure 1). This pattern aligns closely with the latent–explosive infection strategy of
A. destruens as a systemic pathogen. During vegetative growth, the pathogen persists at minimal biomass within vascular tissues, insufficient to trigger basal immunity mediated by host pattern recognition receptors; phenotypic-group-specific transcriptional reprogramming in the resistant line is activated only when the host transitions to reproductive growth and the pathogen synchronously initiates rapid proliferation. Although IS plants also generated substantial numbers of DEGs at jointing and heading (
Figure 2), functional enrichment results exhibited high dispersion (
Figure 3) and lacked correspondence with metabolite fluctuations observed in metabolomic profiling [
31]. These findings indicate that transcriptional changes in susceptible plants more likely represent passive reflections of cellular homeostasis disruption driven by pathogen effector interference, rather than actively orchestrated defense programs. Thus, resistance hinges not on whether a transcriptional response is elicited, but on whether such responses are activated within the correct temporal window as coordinated regulatory modules. Importantly, this temporal resolution distinguishes our work from prior single-stage multi-omics studies [
30], which captured only static snapshots insufficient to reveal sequential coordination of defense reprogramming. By integrating matched time-series data across four stages, we uncover stage-specific regulatory hubs and dynamic network rewiring invisible to single-time-point designs, providing a mechanistically richer foundation for translating omics findings into breeding strategies.
The IA-specific co-expression module at jointing identified by WGCNA (
Figure 4A) is central to this study; its hub genes predominantly encode TCA cycle enzymes and oxidative phosphorylation complex subunits (
Figure 5A), which fully corresponds to the accumulation of intermediates including citrate and succinate in IA plants at the same stage observed in our previous metabolomic analysis [
31]. Jointing represents a critical source–sink transition point in proso millet and marks the onset of pathogen shift from latent to active colonization. The coordinated upregulation of respiratory metabolism genes at this stage likely serves three concurrent purposes: reserving ATP and NADPH for subsequent secondary metabolite biosynthesis, supplying carbon skeletons as precursors for the phenylpropanoid pathway, and maintaining mitochondrial electron transport efficiency to prevent self-damage caused by excessive ROS accumulation. IS plants failed to activate this module at the same stage (
Figure 4B); TCA cycle gene expression was even lower than that of controls, consistent with reduced energy metabolite levels in metabolomic profiling. This deficiency may impair effective initiation of downstream defense responses due to insufficient energy and precursor supply, constituting the first critical node in resistance–susceptibility differentiation.
Following the energy preparation phase at jointing, the IA-specific co-expression module for phenylpropanoid metabolism activated at heading (
Figure 4C) represents the execution stage of defense. Its hub genes encode key enzymes in phenylpropanoid/flavonoid biosynthesis, including PAL, C4H, 4CL, and CHS (
Figure 5B), and their expression dynamics are significantly positively correlated with the burst accumulation of phenolic acids and flavonoids observed in metabolomic profiling. This temporal concordance between transcript and metabolite levels suggests that regulation of this pathway occurs primarily at the transcriptional level. Phenylpropanoid derivatives may contribute to disease resistance through multiple mechanisms: lignin deposition reinforcing physical barriers in vascular tissues, phenolic compounds directly inhibiting pathogen growth, and flavonoids acting as signaling molecules to mediate systemic resistance. Although partial upregulation of pathway genes was detected in IS plants at heading (
Figure 3D), the magnitude of induction was markedly lower than that in IA plants and showed no quantitative association with metabolite accumulation (
Figure 7). These findings indicate that IS plants retain the potential for pathway activation but fail to achieve effective metabolic output due to upstream regulatory defects or pathogen interference.
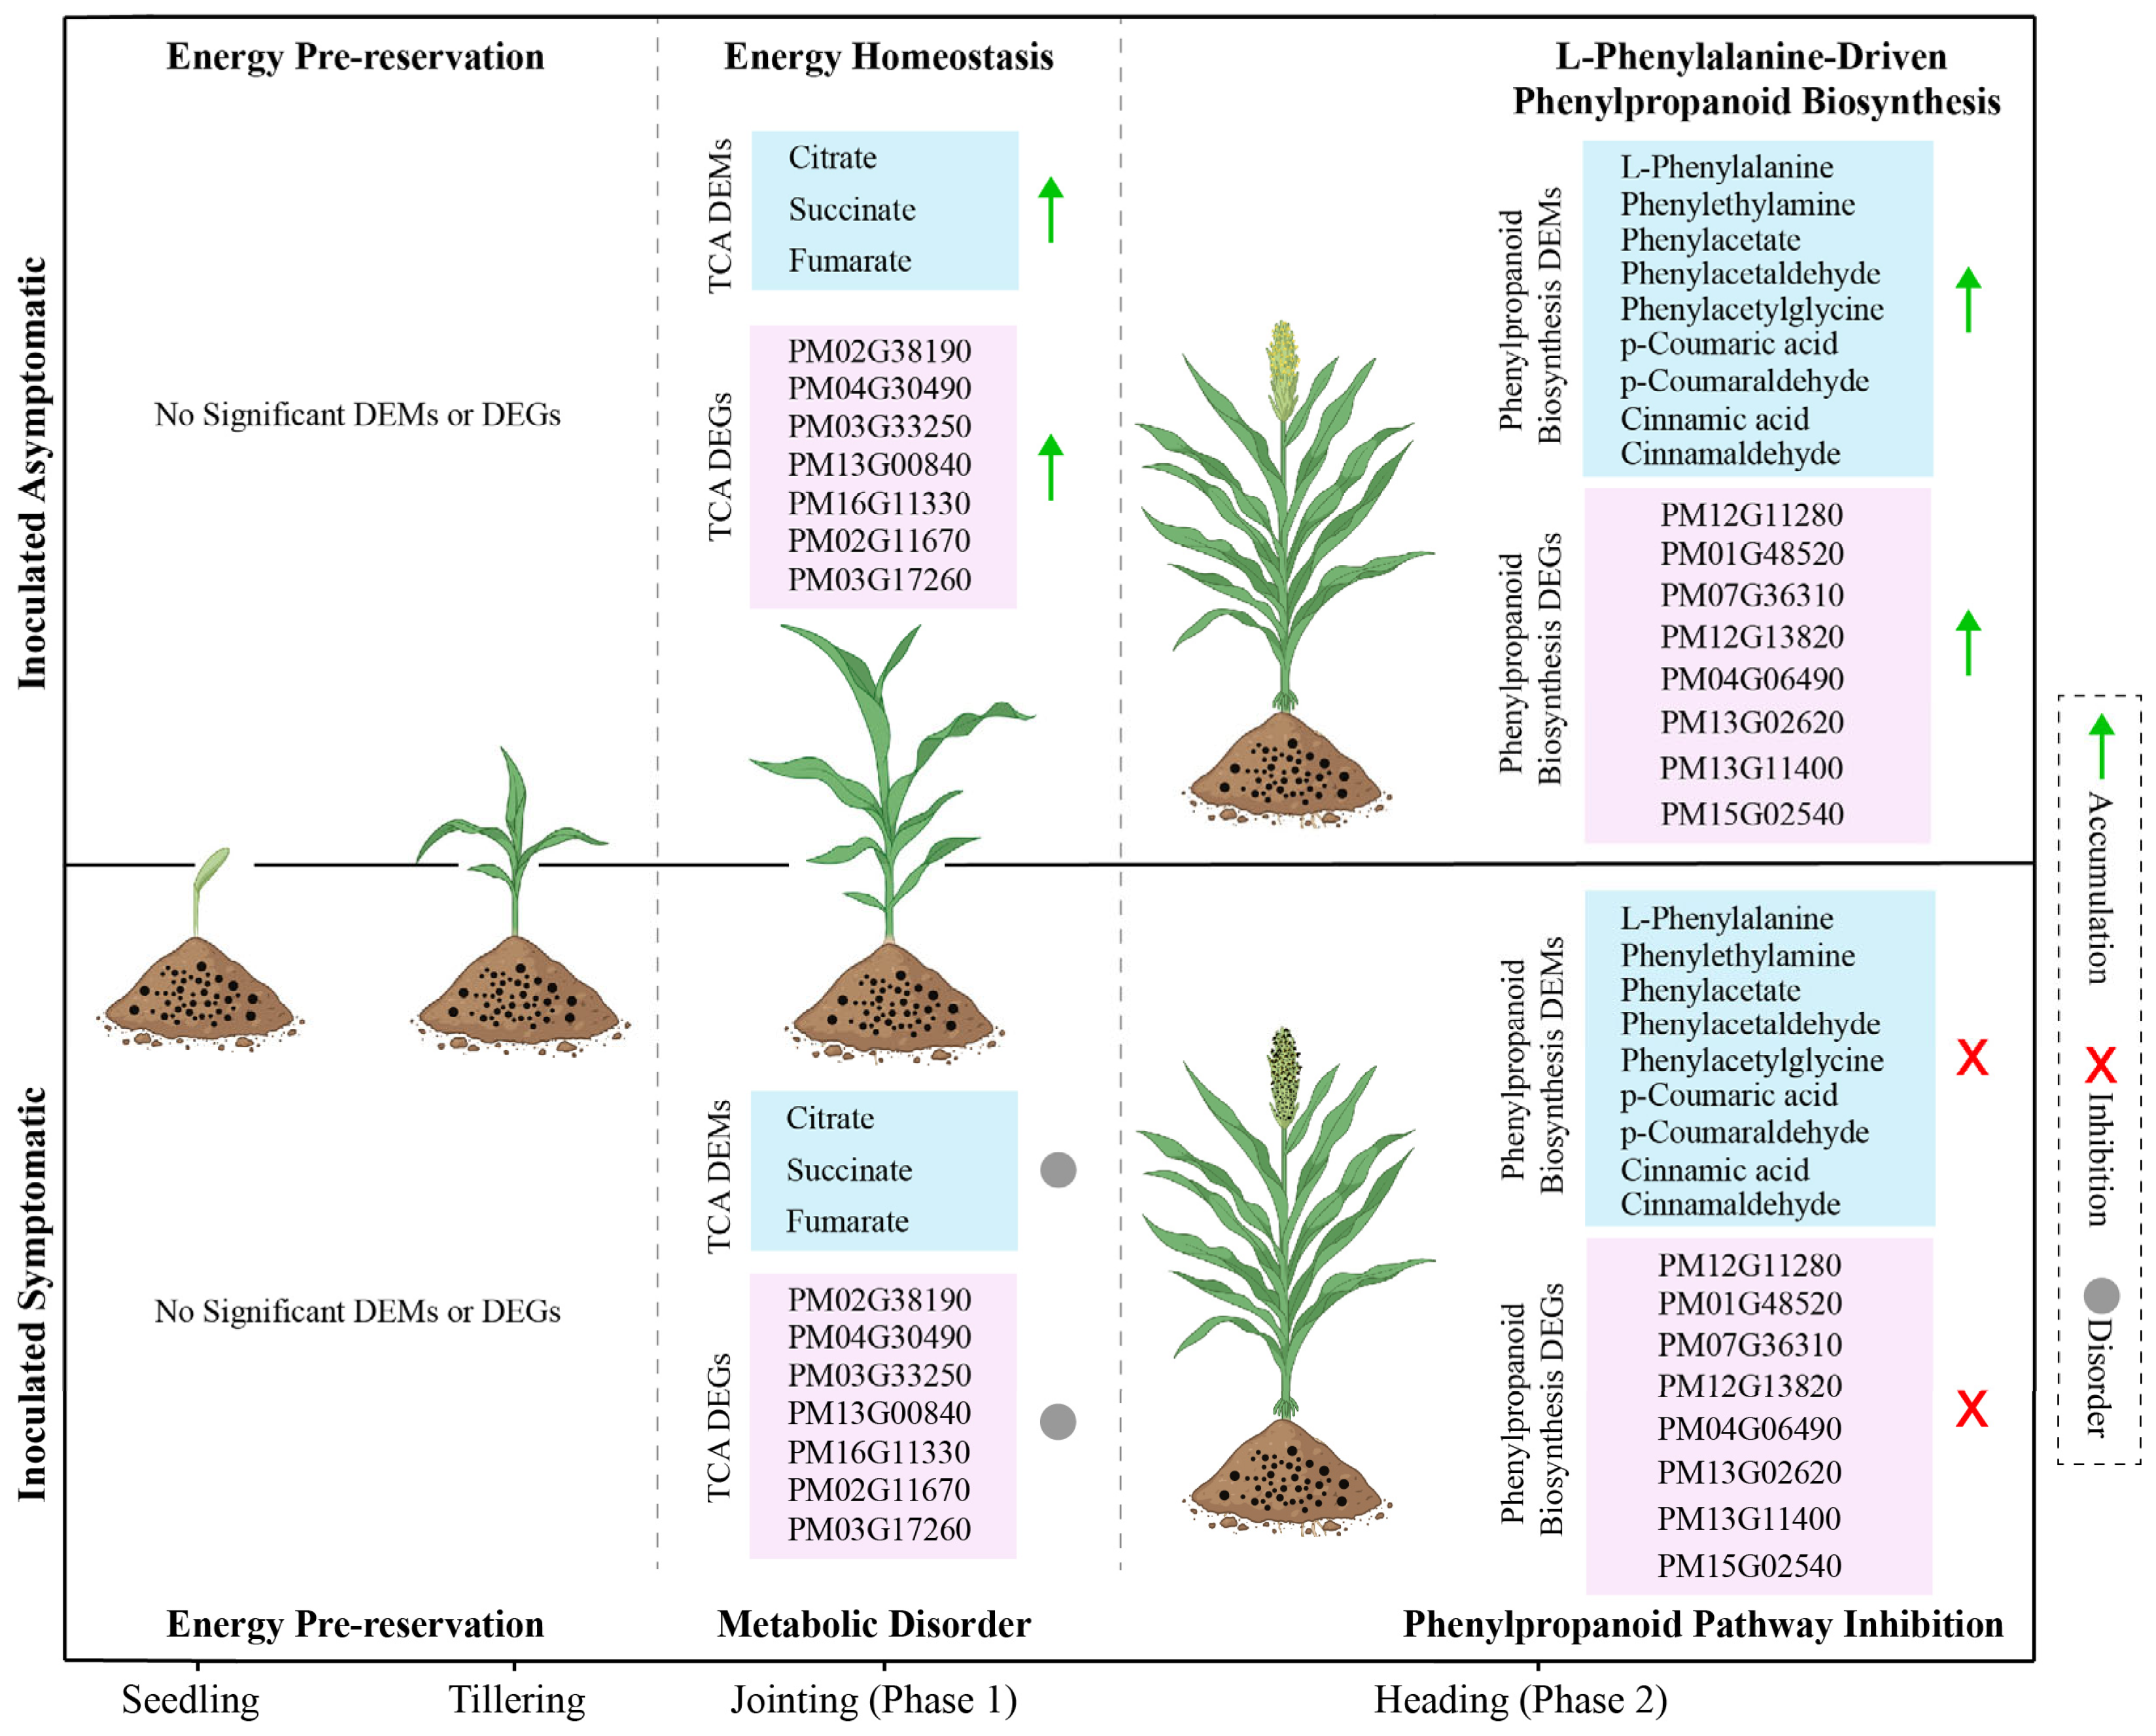
Cross-omics integration analysis (
Figure 8) supports a two-stage serial regulatory model: respiratory metabolic reprogramming at jointing provides the material and energetic foundation for phenylpropanoid-mediated defense at heading, with the two stages linked by metabolic–signaling feedback loops. Our previous metabolomic profiling confirmed significant accumulation of TCA cycle intermediates (citrate and succinate) in IA plants at jointing; these metabolites serve not only as central nodes in energy metabolism but also as carbon skeleton donors and reducing power suppliers, directly influencing flux partitioning in the downstream phenylpropanoid pathway. The strong co-expression between seven TCA hub genes and eight phenylpropanoid hub genes observed in IA plants (
Figure 6) was completely decoupled in IS plants (
Figure 7), further confirming that the integrity of this cascade is a prerequisite for the resistant phenotype. This model provides a testable hypothesis for understanding resistance to systemic fungal diseases in gramineous crops: resistance depends on the coordinated activation of multiple physiological modules within precise temporal windows, rather than the mere presence or absence of a single defense pathway.
Building on this mechanistic framework, translating this two-stage transcriptional–metabolic framework into sustainable smut-resistant breeding requires moving beyond sterile, single-organism models toward a holobiont perspective. A key priority is determining whether stress-induced respiratory reprogramming can be enhanced through targeted manipulation of TCA cycle enzymes (e.g., ACO, IDH) or mitochondrial uncoupling proteins, though such efforts must be validated under A. destruens challenge to account for potential metabolic suppression by pathogen effectors. Equally critical is the role of endophytes, which remain largely absent from current models; gnotobiotic and synthetic community assays could reveal whether specific taxa prime TCA flux at jointing or potentiate phenylpropanoid responses at heading and whether resistant phenotypic groups actively recruit beneficial microbiota as part of their defense strategy. Ultimately, biomarker discovery (e.g., hub genes PM02G38190, PM12G11280) should prioritize robustness across variable soil microbiomes and field conditions rather than performance in isolation, ensuring next-generation cultivars are resilient within the complex host–microbe–environment interactions that define sustainable agroecosystems.