Article

Dynamic Effects of Vibrio tubiashii Infection on Pathology, Transcriptome, and Immunology in the Hepatopancreas of Ivory Shell (Babylonia areolata)

1
Hainan Provincial Key Laboratory of Tropical Maricultural Technologies, Hainan Academy of Ocean and Fisheries Sciences, Haikou 571126, China
2
Key Laboratory of Utilization and Conservation for Tropical Marine Bioresources of Ministry of Education, Hainan Tropical Ocean University, Sanya 572022, China
3
College of Fisheries and Life Sciences, Dalian Ocean University, Dalian 201306, China
4
School of Marine Biology and Fisheries, Hainan University, Haikou 570228, China
5
Yazhou Bay Innovation Institute of Hainan Tropical Ocean University, Sanya 572022, China
*
Authors to whom correspondence should be addressed.
Biology 2026, 15(13), 992; https://doi.org/10.3390/biology15130992
Submission received: 21 May 2026 / Revised: 18 June 2026 / Accepted: 22 June 2026 / Published: 24 June 2026
(This article belongs to the Section Marine and Freshwater Biology)

Simple Summary

Vibrio tubiashii has caused frequent disease outbreaks in Babylonia areolata along China’s southeast coast, while the host immune mechanisms and pathogen–host interaction remain poorly understood. Here, we investigated the immune response of B. areolata to V. tubiashii infection using pathological observation, transcriptomic analysis, enzyme activity detection, and inflammatory cytokine measurement. Post-infection hepatopancreatic cells exhibited obvious vacuolar degeneration with extensive cytoplasmic vacuolization. Transcriptome profiling of hepatopancreas revealed that differentially expressed genes were mainly enriched in metabolic regulation, lysosome, and multiple immune pathways. Enzymatic activity and inflammatory cytokines were induced during early infection and may accelerate the onset of host immune defense. These results provide important insight into the anti-bacterial responses of shellfish and the network of immune-related signaling pathways that are activated during infection.

Abstract

Vibrio tubiashii infection has led to several Babylonia areolata pandemics on the southeast coast of China, yet the immune response of the ivory shell against V. tubiashii and the specific pathogen–host interaction remain unclear. This dynamic study aimed to characterize the response of B. areolata to V. tubiashii infection with the use of pathology, transcriptomics, an enzymatic assay, and inflammatory cytokines. Hepatopancreatic cells showed marked vacuolar degeneration with intact cell membrane and extensive cytoplasmic vacuolization after infection. The dynamic transcriptome of the hepatopancreatic tissue was analyzed by RNA-seq after V. tubiashii infection, and a total of 2733 (3 h), 5610 (24 h), 3323 (48 h), and 418 (72 h) differentially expressed genes (DEGs) were identified during infection. The GO and KEGG analyses showed that the DEGs were enriched in metabolic regulation, lysosome, and multiple immune-related pathways such as the MAPK signaling pathway. The immune response of B. areolata was distinct, where the early stage of immune response (3 h) showed binding, focal adhesion, and apoptosis, as well as an activated antioxidant system. Here, expression of TNF-α, IL-1, and IL-8 was significantly increased in the hepatopancreas, whereas expression of IL-6 and IL-17 increased afterward. During the middle stage (24 h and 48 h), a large number of DEGs were suppressed, especially those associated with metabolism and lysosomes, although their expression returned to normal during prolonged infection (72 h). The PPI network showed that ppp2, atp6, and sos1 were the top immune-related DEGs during infection. Key infection-related and time-course-related genes were analyzed by WGCNA. This study illustrates that oxidative stress, inflammation, and apoptosis are strategies of the hepatopancreatic immune response in B. areolata against V. tubiashii infection and enlightens conservation and production by furthering our understanding of gastropod immunity.

1. Introduction

The ivory shell (Babylonia areolata) is a carnivorous gastropod mollusk and one of the most cultured species in the southeastern coastal provinces of China. In recent years, frequent incidents of mass mortality have threatened the development of the B. areolata industry, resulting in huge economic losses [1,2,3]. Although almost no obvious clinical signs were present at the onset of the “acute death” of B. areolata populations, after 2~3 days, a large number of snails became lethargic on the sand surface, did not drill into the sand, and died shortly afterwards [4]. Epidemiological investigations revealed complicated environmental stressors and pathogens, where bacterial coinfection (Vibrio spp.) was one of the most common and severe threats, resulting in multiple tissue disorders and necrosis [4,5,6,7]. Vibrio species are ubiquitous common bacteria in marine environments, where V. tubiashii is known to cause mortality in B. areolata in the south of China [1,2,8,9]. Thus, exploring how B. areolata responds to vibriosis is of the essence to mitigate losses in aquaculture.
Previously, the innate immune system, including hemocytes [10,11] and hemolymph [3], was thought to play important roles in the ivory shell’s response to vibriosis infection. Granulocytes exhibit higher phagocytic activity than hyalinocytes. Both hemocyte phagocytosis and respiratory burst activity rise over time and peak at the early stage of infection [11]. During infection with Vibrio harveyi, the total hemocyte count in B. areolata initially decreased and then gradually increased, while the hemocyte mortality rate decreased and induced a respiratory burst in B. areolata [3]. Although some progress has been made on the immune response of ivory shells to Vibrio infection, the mechanisms of B. areolata resistance to vibriosis are still unclear. In addition to the role of hemocytes in the immune response, researchers have suggested that the hepatopancreas, which is part of the oxidative energy metabolic system, may influence B. areolata’s resistance to vibriosis and environmental stimuli. In ivory shells, the hepatopancreas is a multifunctional organ for both metabolic and immune functions [12,13], which means it could be one of the main target tissues during a Vibrio infection. Astaxanthin feeding (100 mg/kg) could enhance host immunity by regulating immune-related enzyme activities and gene expression, and by increasing resistance to ammonia stress in the hepatopancreas of B. areolata. The general antioxidant capacity (T-AOC) and acid phosphatase (ACP) of the hepatopancreas were significantly increased alongside alkaline phosphatase (AKP), superoxide dismutase (SOD), and catalase (CAT) activity, whilst the malondialdehyde (MDA) content decreased [14]. Similar results were also observed in prebiotic and taurine-supplemented experiments [15,16]. Hepatopancreatic enzyme activities also play a vital role in the resistance of Babylonia areolata to environmental stressors such as salinity, pH, and ammonia nitrogen [12,17,18,19]. With prolonged exposure to stress, vacuoles appeared in the hepatopancreas, while cell volume and intercellular space increased. The activities of SOD and CAT decreased significantly under high concentrations of ammonia-induced stress, while MDA levels increased significantly [13]. Furthermore, the CAT, POD, and ACP activity varied in pathogenesis during an outbreak of vibriosis, implying the joint participation of the immune and digestive systems [20].
In recent years, transcriptomics has been widely introduced to study gene expression and molecular pathways related to external stimulation in aquatic invertebrates. The response of ivory shells to ammonia stress was defined as a dynamic process accompanied by energy redistribution. Differentially expressed genes (DEGs) were engaged in maintaining cellular homeostasis, counteracting oxidative stress, and suppressing metabolic activity [13]. Here, TRAF6, GLUT1, and CPT1 may serve as key hub genes, supported by varied hepatopancreatic energy consumption in B. areolata when adapted to different substrates [21]. Transcriptomic single-nucleotide polymorphism analyses (SNPs) showed that 5866 SNP-unigenes related to 298 KEGG subset pathways were enriched, where “Endocytosis” contained the most SNP-unigenes under LPS stress conditions [22]. Transcriptomic studies have identified several immune-related genes and signaling pathways when challenged by V. alginolyticus, V. parahaemolyticus, and V. splendidus, particularly in Litopenaeus vannamei [23,24], Mytilus galloprovincialis [25], and Crassostrea gigas [26].
The hepatopancreas is the key multifunctional organ in gastropod mollusks, integrating digestive metabolism, nutrition, detoxification, and immune response simultaneously. For B. areolata, besides heamolymphocytes, the hepatopancreas is the primary tissue targeted by invading pathogenic V. tubiashii and defense bacterial infection [27]. A temporal sampling strategy enables continuous monitoring of dynamic molecular and physiological changes throughout the infection process. Therefore, to systematically investigate B. areolata responses against V. tubiashii infection, hepatopancreas were collected at 3 h, 24 h, 48 h, and 72 h post bacterial challenge, arranged to cover the early acute response immediately after pathogen invasion, continuous infection stress, and the late infection stage. Additionally, DEGs affected during immune and metabolic stress were identified as candidate genes. Results will guide understanding of the hepatopancreas-related immune responses of B. areolata, contribute to research on mollusk immune systems, and advise on novel strategies for vibriosis therapy.

2. Materials and Methods

2.1. Ethics Statement

Babylonia areolata were obtained from the Qukou aquaculture breeding farm in Hainan Province, China. All research was conducted in accordance with the protocols of the Ethics Committee of the Hainan Academy of Ocean and Fisheries Sciences and was approved by the Laboratory Animal Ethics Committee of Hainan Academy of Ocean and Fisheries Sciences (EAEC-HAOFS-No. 2025002).

2.2. Animals, Bacterial Infection, and Sampling

Healthy ivory shells were randomly collected from the Qukou breeding farm in Hainan and acclimatized in filtered, aerated seawater tanks (80 × 80 × 60 cm) at a constant temperature of 28.8 ± 1.3 °C, pH of 7.89 ± 0.36, dissolved oxygen above 5 mg/L, and salinity of 26 ± 2 for one week before the experiment. A total of 150 ivory shells (shell length of 2.64 ± 0.27 cm and weight of 3.62 ± 0.22 g) were randomly assigned to five experimental groups (30 snails per group). The groups were labeled as follows: the control or PBS group, and four experimental groups infected with V. tubiashii for 3 h, 24 h, 48 h, and 72 h.
The V. tubiashii FP17 from our previous study [2] was cultured overnight at 30 °C on Luria Bertani (LB) medium (HB0128, Qingdao Hope Bio-Technology Co., Ltd., Qingdao, China) supplemented with 2% NaCl. The bacterial pellet was centrifuged at 3000 rpm for 10 min, washed with PBS, and resuspended in 1× PBS. The infection dose of V. tubiashii was screened according to previous results [2,27]. The ivory shells of the experimental V. tubiashii groups were each intramuscularly injected with 100 μL of V. tubiashii FP17 suspension at a final concentration of 1.2 × 10⁷ CFU/mL. Animals in the control group were injected with an equal volume of PBS. The ivory shells were fasted for 24 h before and after the trial. Three hepatopancreas samples from each group were fixed in 4% formaldehyde at room temperature at the start of the experiment, and the remainder of the ivory shells in each group were sampled at 3 h, 24 h, 48 h, and 72 h after V. tubiashii FP17 injection. Specifically, nine snails from each group were randomly selected for hepatopancreatic tissue collection and RNA extraction. Any three of the nine individuals were pooled into one replicate to produce three independent biological replicates, which were independently processed and sequenced, as well as for subsequent qRT-PCR verification. The same sampling protocol was used for the enzyme activity and ELISA tests. All hepatopancreas samples were snap frozen in liquid nitrogen after collection and stored at −80°C.

2.3. Histopathology

Hepatopancreatic tissue of B. areolata was fixed with 4% formaldehyde for more than 24 h and then dehydrated in incremental dilutions of alcohol and wax leaching. The wax-soaked tissues were embedded in paraffin and cut into 4 μm thick slices, stained with hematoxylin-eosin, and viewed with an inverted phase contrast microscope (Olympus CKX53, Tokyo, Japan).

2.4. RNA Extraction and Illumina HiSeq Sequencing

Total RNA was extracted from hepatopancreatic samples using TRIzol® Reagent following the manufacturer’s instructions (Invitrogen, Carlsbad, CA, USA). The RNA quality and concentration were determined using a 2100 Bioanalyzer (Agilent Technologies, Santa Clara, CA, USA), agarose gel electrophoresis, and a NanoDrop (Thermo Fisher Scientific, Wilmington, DE, USA). High-quality RNA was used for library preparation. Sequencing libraries were constructed using the Hieff NGS® Ultima Dual-Mode mRNA Library Prep Kit (Yeasen, Shanghai Yeasen BioTechnologies Co., Ltd., Shanghai, China). Libraries were generated using the Illumina Novaseq6000 platform by Gene Denovo Biotechnology Co. (Guangzhou, China).

2.5. Bioinformatic Analysis

High-quality clean reads were obtained from raw reads filtered in fastp (version 0.18.0) [28]. Paired-end clean reads were mapped to the reference B. areolata genome (submitted GenBank assembly: GCA_041734735.1) using HISAT2 2.1.0 [29], and the mapped reads of each sample were assembled using StringTie v1.3.1. For each transcription region, a FPKM (fragment per kilobase of transcript per million mapped reads) value was calculated to quantify its expression abundance and variation using RSEM software (v1.3.3).
Differential expression analysis between the two different groups was performed in DESeq2 [30]. Multiple testing correction was carried out according to the Benjamini–Hochberg method. The genes/transcripts with a parameter of false discovery rate (FDR) below 0.05 and an absolute fold change ≥ 2 were considered DEGs. To understand the functions of DEGs, Gene Ontology (GO) and Kyoto Encyclopedia of Genes and Genomes (KEGG) enrichment analysis were carried out. The DEGs were considered significantly enriched in GO terms and pathways depending on their Benjamini–Hochberg corrected p-value < 0.05.
To examine the expression pattern of the DEGs, the expression data of each sample (in the order of treatment) were normalized to 0, log2 (v1/v0), log2 (v2/v0), and then clustered in the Short Time-series Expression Miner (STEM) v1.3.13 software program [31]. The parameters were set as follows: (1) the maximum unit change in model profiles between time points was 1; (2) maximum output profiles was 20 (similar profiles will be merged); and (3) minimum ratio of fold change of DEGs was no less than 2.0. The clustered profiles with a p-value ≤ 0.05 were considered significant profiles. Then, the DEGs in all or each profile were subjected to Gene Ontology (GO) and KEGG pathway enrichment analysis. Through p-value calculation and FDR correction, the GO terms or pathways with a Q-value ≤ 0.05 were defined as significantly enriched.
To further analyze the inter-cooperative relationship of the DEGs’ encoded proteins, the STRING [32] database (offline version deployed on the commercial sequencing cloud platform) was used to construct the protein–protein interaction (PPI) networks. Because B. areolata is a non-model species, protein interactions were inferred by homology using the available reference species Pomacea canaliculata as the background. Interactions satisfying combined score ≥ 300 were retained. The combined score represents the integrated confidence score ranging from 0 to 1000. Node degree calculation and gene ranking were performed on this final interaction set.

2.6. Weighted Gene Correlation Network Analysis (WGCNA)

WGCNA [33] was employed to construct a weighted gene co-expression network comprising all genes. The expression matrix of all genes was standardized by log2 (FPKM1), and the median absolute deviation (MAD) of each gene was calculated. The appropriate weighting coefficient β = 4 was calculated as the power value to satisfy the scale-free topology of the network. Modules were constructed with a minimum module size of 50, and modules with highly correlated eigengenes were merged using the default cut height of 0.25. The module eigengene (ME) of each module was then correlated with the measured phenotypic traits, and the correlation coefficients and corresponding p-values were visualized in a heatmap.

2.7. Validation of DEGs by qRT-PCR

To validate the Illumina sequencing data, the expression level of 15 DEGs was assessed using qRT-PCR on the CFX96TM real-time system C1000 touch thermal cycler (Bio-Rad, Hercules, CA, USA). The genes were selected mainly according to expression fold changes during V. tubiashii infection, and immune-related function was also considered. Beta-actin (β-actin) was used as an internal reference gene, and the primers are listed in Table 2. The RNA for RNA-seq was synthesized into cDNA using the HiScript III RT SuperMix for qRT-PCR (R323, Vazyme Biotech Col, Ltd., Nanjing, China). Each 20 μL reaction mixture consisted of 10 μL 2 × ChamQ Universal SYBR qPCR Master Mix, 0.4 μL of each primer (10 μM), 2 μL cDNA, and 7.2 μL ddH2O (Q712, Vazyme Biotech Col, Ltd., Nanjing, China). The PCR cycling parameters included an initial denaturation step at 95 °C for 30 s, followed by 40 cycles of denaturation at 95 °C for 10 s and annealing at 58 °C for 30 s. The relative expression levels of the DEGs were calculated using the 2−ΔΔCT method. All PCR reactions were conducted in triplicate.

2.8. Enzymatic Assays

The hepatopancreas samples were weighed and homogenized in precooled 0.9% saline according to the manufacturer’s instructions. The homogenates were centrifuged at 3000 rpm at 4 °C for 10 min, and the supernatant was collected for the enzymatic assays. The hepatopancreas superoxide dismutase (SOD) (A001–3), catalase (CAT) (A007-1-1), acid phosphatase (ACP), alkaline phosphatase (AKP) (A059–2), lysozyme (LZM) (A050-1-1), peroxidase (POD) (A084-1-1), glutathione peroxidase (GSH-PX) (A005-1), lipase (LPS) (A054-2-1), pepsin (A080-1-1), amylase (AMS) (C016-1-1), Na+K+ATPase (A070-2), and malondialdehyde (MDA) (A003-1) contents were measured following each kit’s instructions (Nanjing Jiancheng Bioengineering Institute, Nanjing, China). The protein concentration of each sample was determined using the Coomassie brilliant blue Protein Assay Kit (A045-2).

2.9. ELISA Test

The hepatopancreas samples were weighed and homogenized in 0.9% saline and centrifuged at 3000 rpm at 4 °C for 10 min. The supernatant was collected for the ELISA test. Shellfish interleukin 1 (IL-1) (MM-927944O1), IL-6 (MM-1040X1), IL-8 (MM-1046X1), IL-10 (MM-1050X1), and tumor necrosis factor alpha (TNF-α) (MM-928667O1) were measured following each kit’s instructions (Jiangsu Meimian Industrial Co., Ltd., Nanjing, China) using a microplate reader F50 (Tecan Sunrise Microplate Reader, Männedorf, Switzerland).

2.10. Statistical Analysis

Results were expressed as the mean ± standard error of the mean. For enzyme activity and cytokine assays, the normality of residuals was primarily assessed using the Shapiro–Wilk test. The homogeneity of variances was verified using the Brown–Forsythe test. For datasets meeting the assumptions of normality (Shapiro–Wilk p > 0.05) and equal variance (Brown–Forsythe p > 0.05), ordinary one-way ANOVA was performed, followed by Dunnett’s multiple comparison test to compare with the PBS control. Differences of p < 0.05, p < 0.01, or p < 0.001 were considered significant. All statistical analyses were performed in GraphPad PRISM 9.0 (San Diego, CA, USA).

3. Results

3.1. Histopathology of B. areolata Hepatopancreas During V. tubiashii Infection

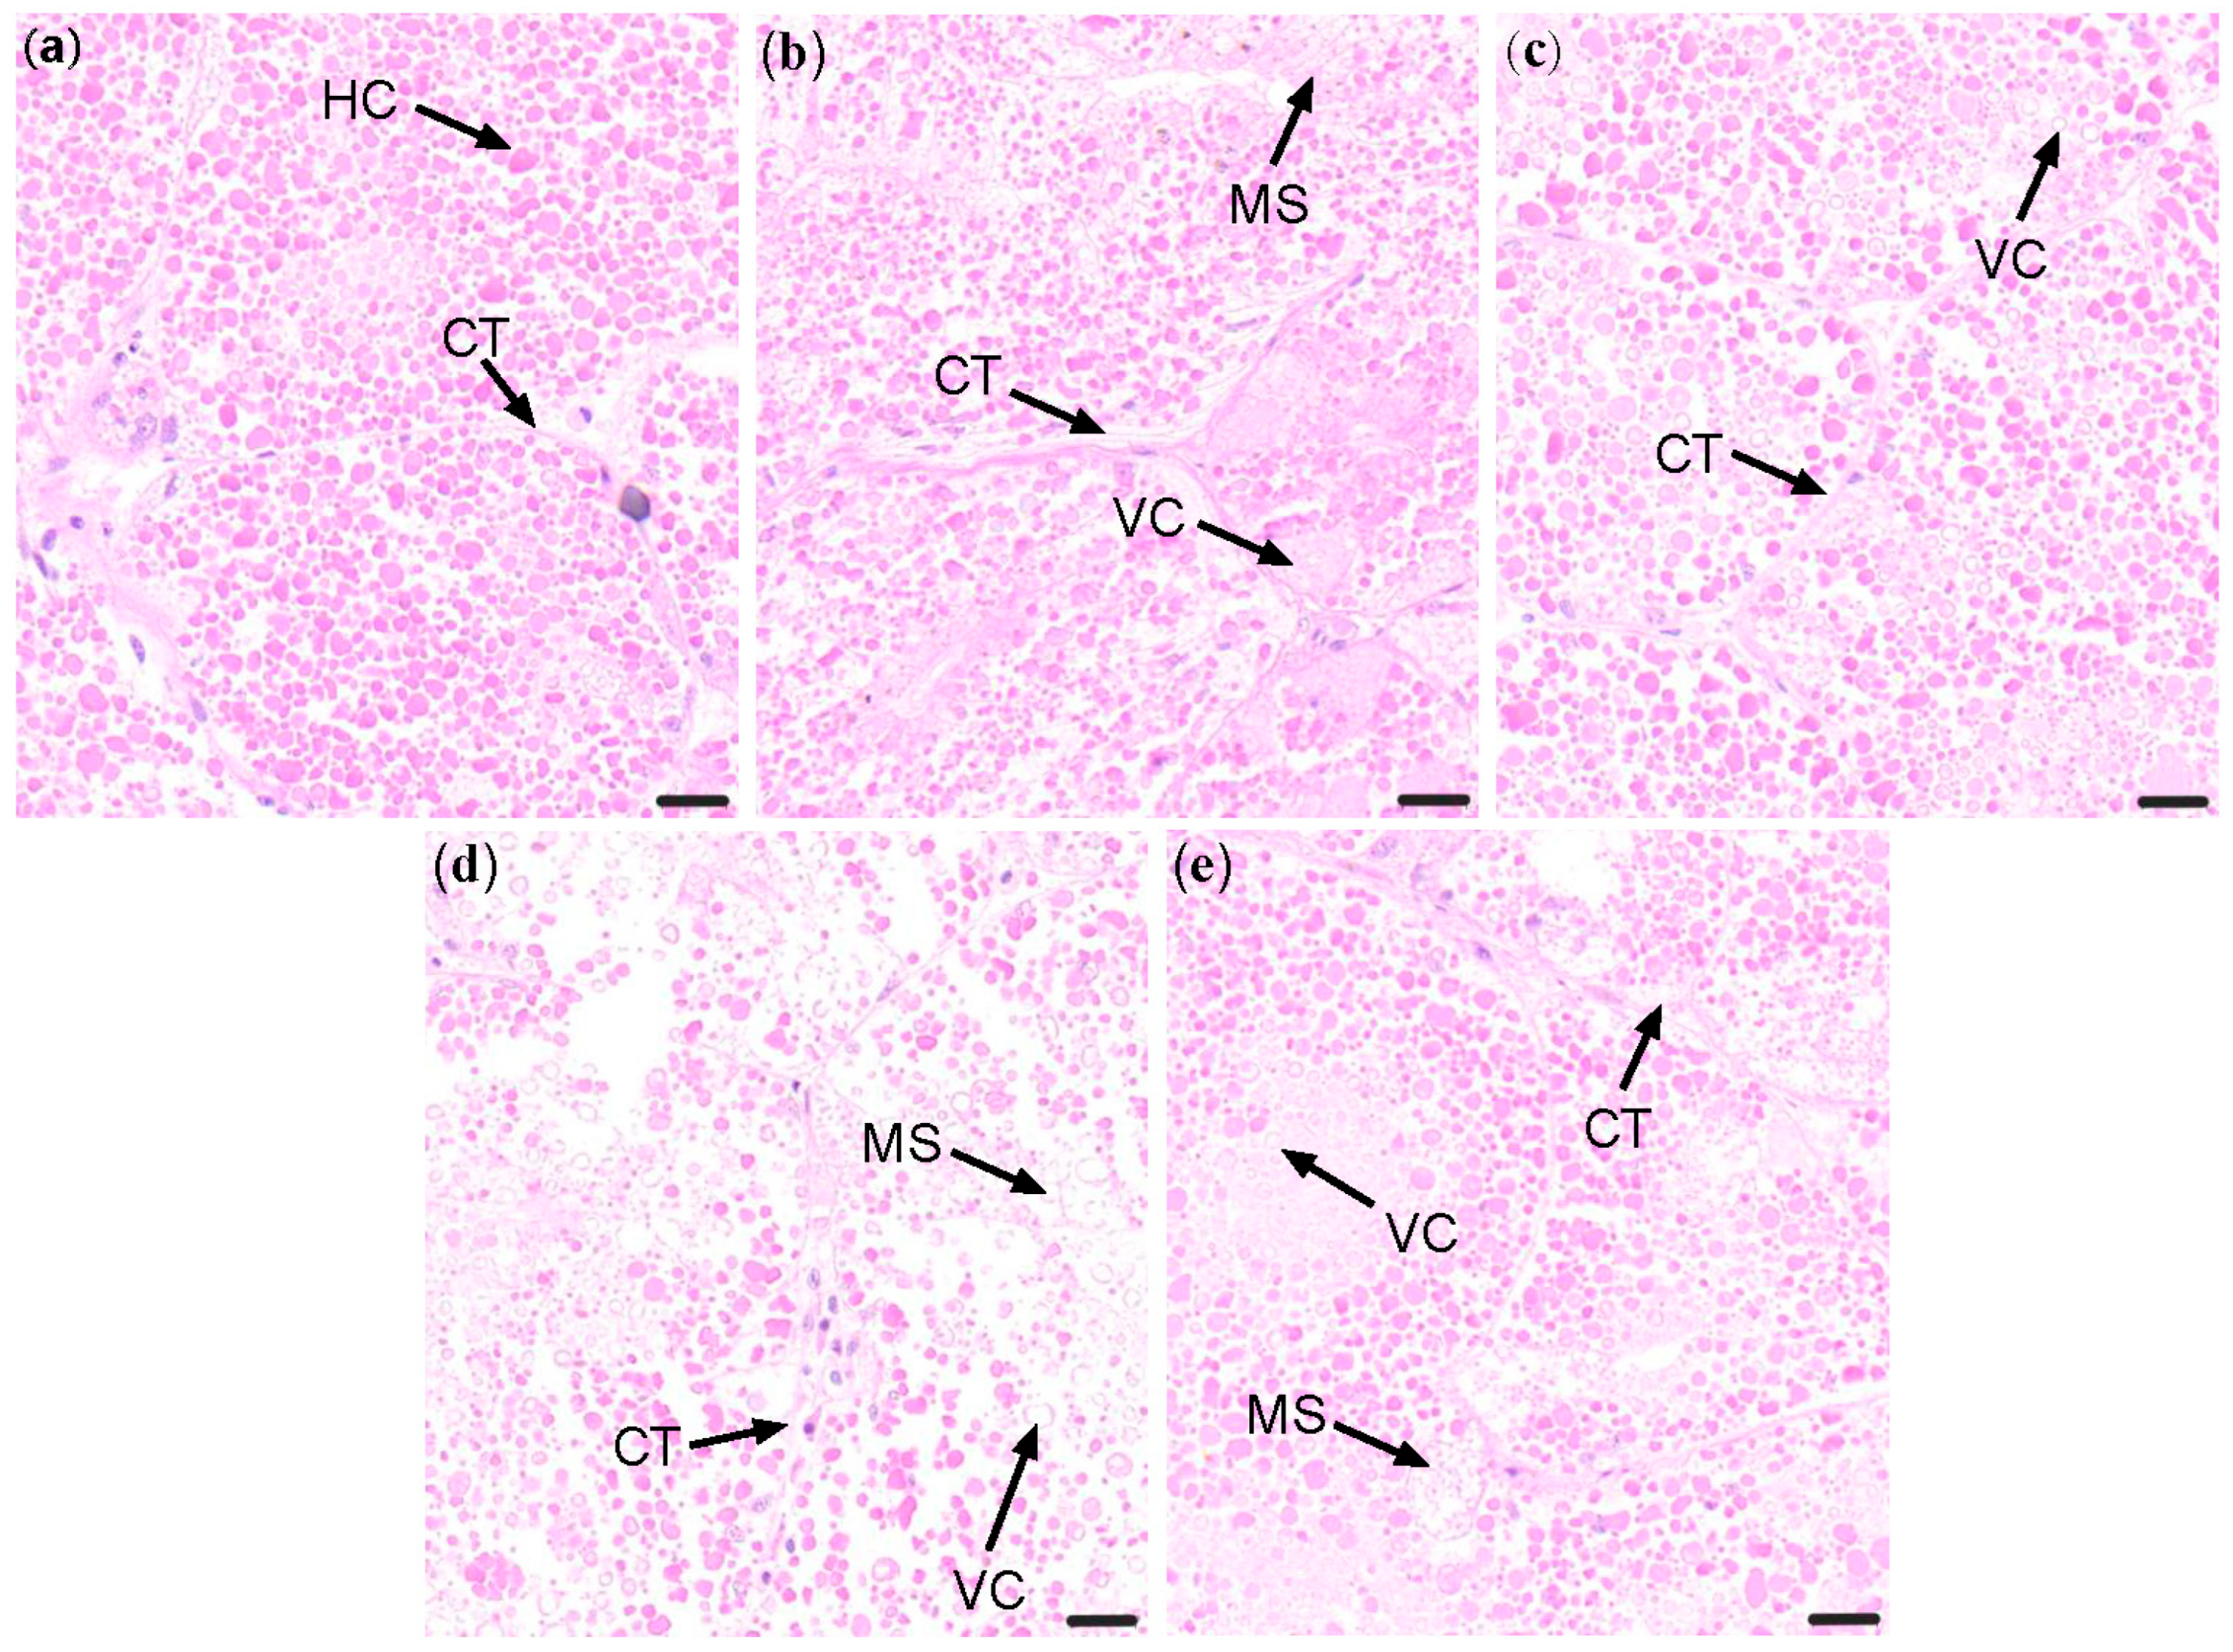
The hepatopancreas embeds multiple types of digestive gland tissues. To precisely observe the histopathological alterations of hepatopancreatic cells, the anterior portion of the hepatopancreas was selected for the preparation of pathological sections in this study. The hepatopancreas parenchyma of B. areolata consists of many round hepatic lobule-like structures that are separated by connective tissue (Figure 1a). In the control group, the boundaries of the lobules were distinct and compact with full red staining of the anucleate hepatopancreatic cells. In the infected group, widened gaps were visible between connective tissue and hepatopancreatic cells; the hepatic units retained clear outlines and exhibited a mesh-like arrangement. Hepatopancreatic cells displayed lighter staining, alongside local polygonal cell fusion or cellular atrophy. Vacuolar degeneration was observed in hepatopancreatic cells, with intact cell membranes and extensive cytoplasmic vacuolization detected (Figure 1b–e).

3.2. RNA-Seq Results, Quality Control, and qRT-PCR Validation

A total of 15 libraries (PBS, 3 h, 24 h, 48 h, and 72 h) were constructed to study the transcriptional response to V. tubiashii infection. Qualified clean reads were filtered by removing adaptor sequences, low-quality reads, and reads with N ratio > 10%. The Q30 values of the clean reads were greater than 93% in all libraries, indicating high data quality. The assembled B. areolata genome was used as a reference database for mapping the clean reads (submitted GenBank assembly: GCA_041734735.1). After quality control and the removal of mapped rRNA in Bowtie 2, unmapped reads were retained for further analysis. The total number of reads mapped to the reference genome reached a mapping rate of 77% to 83% (Table 1).
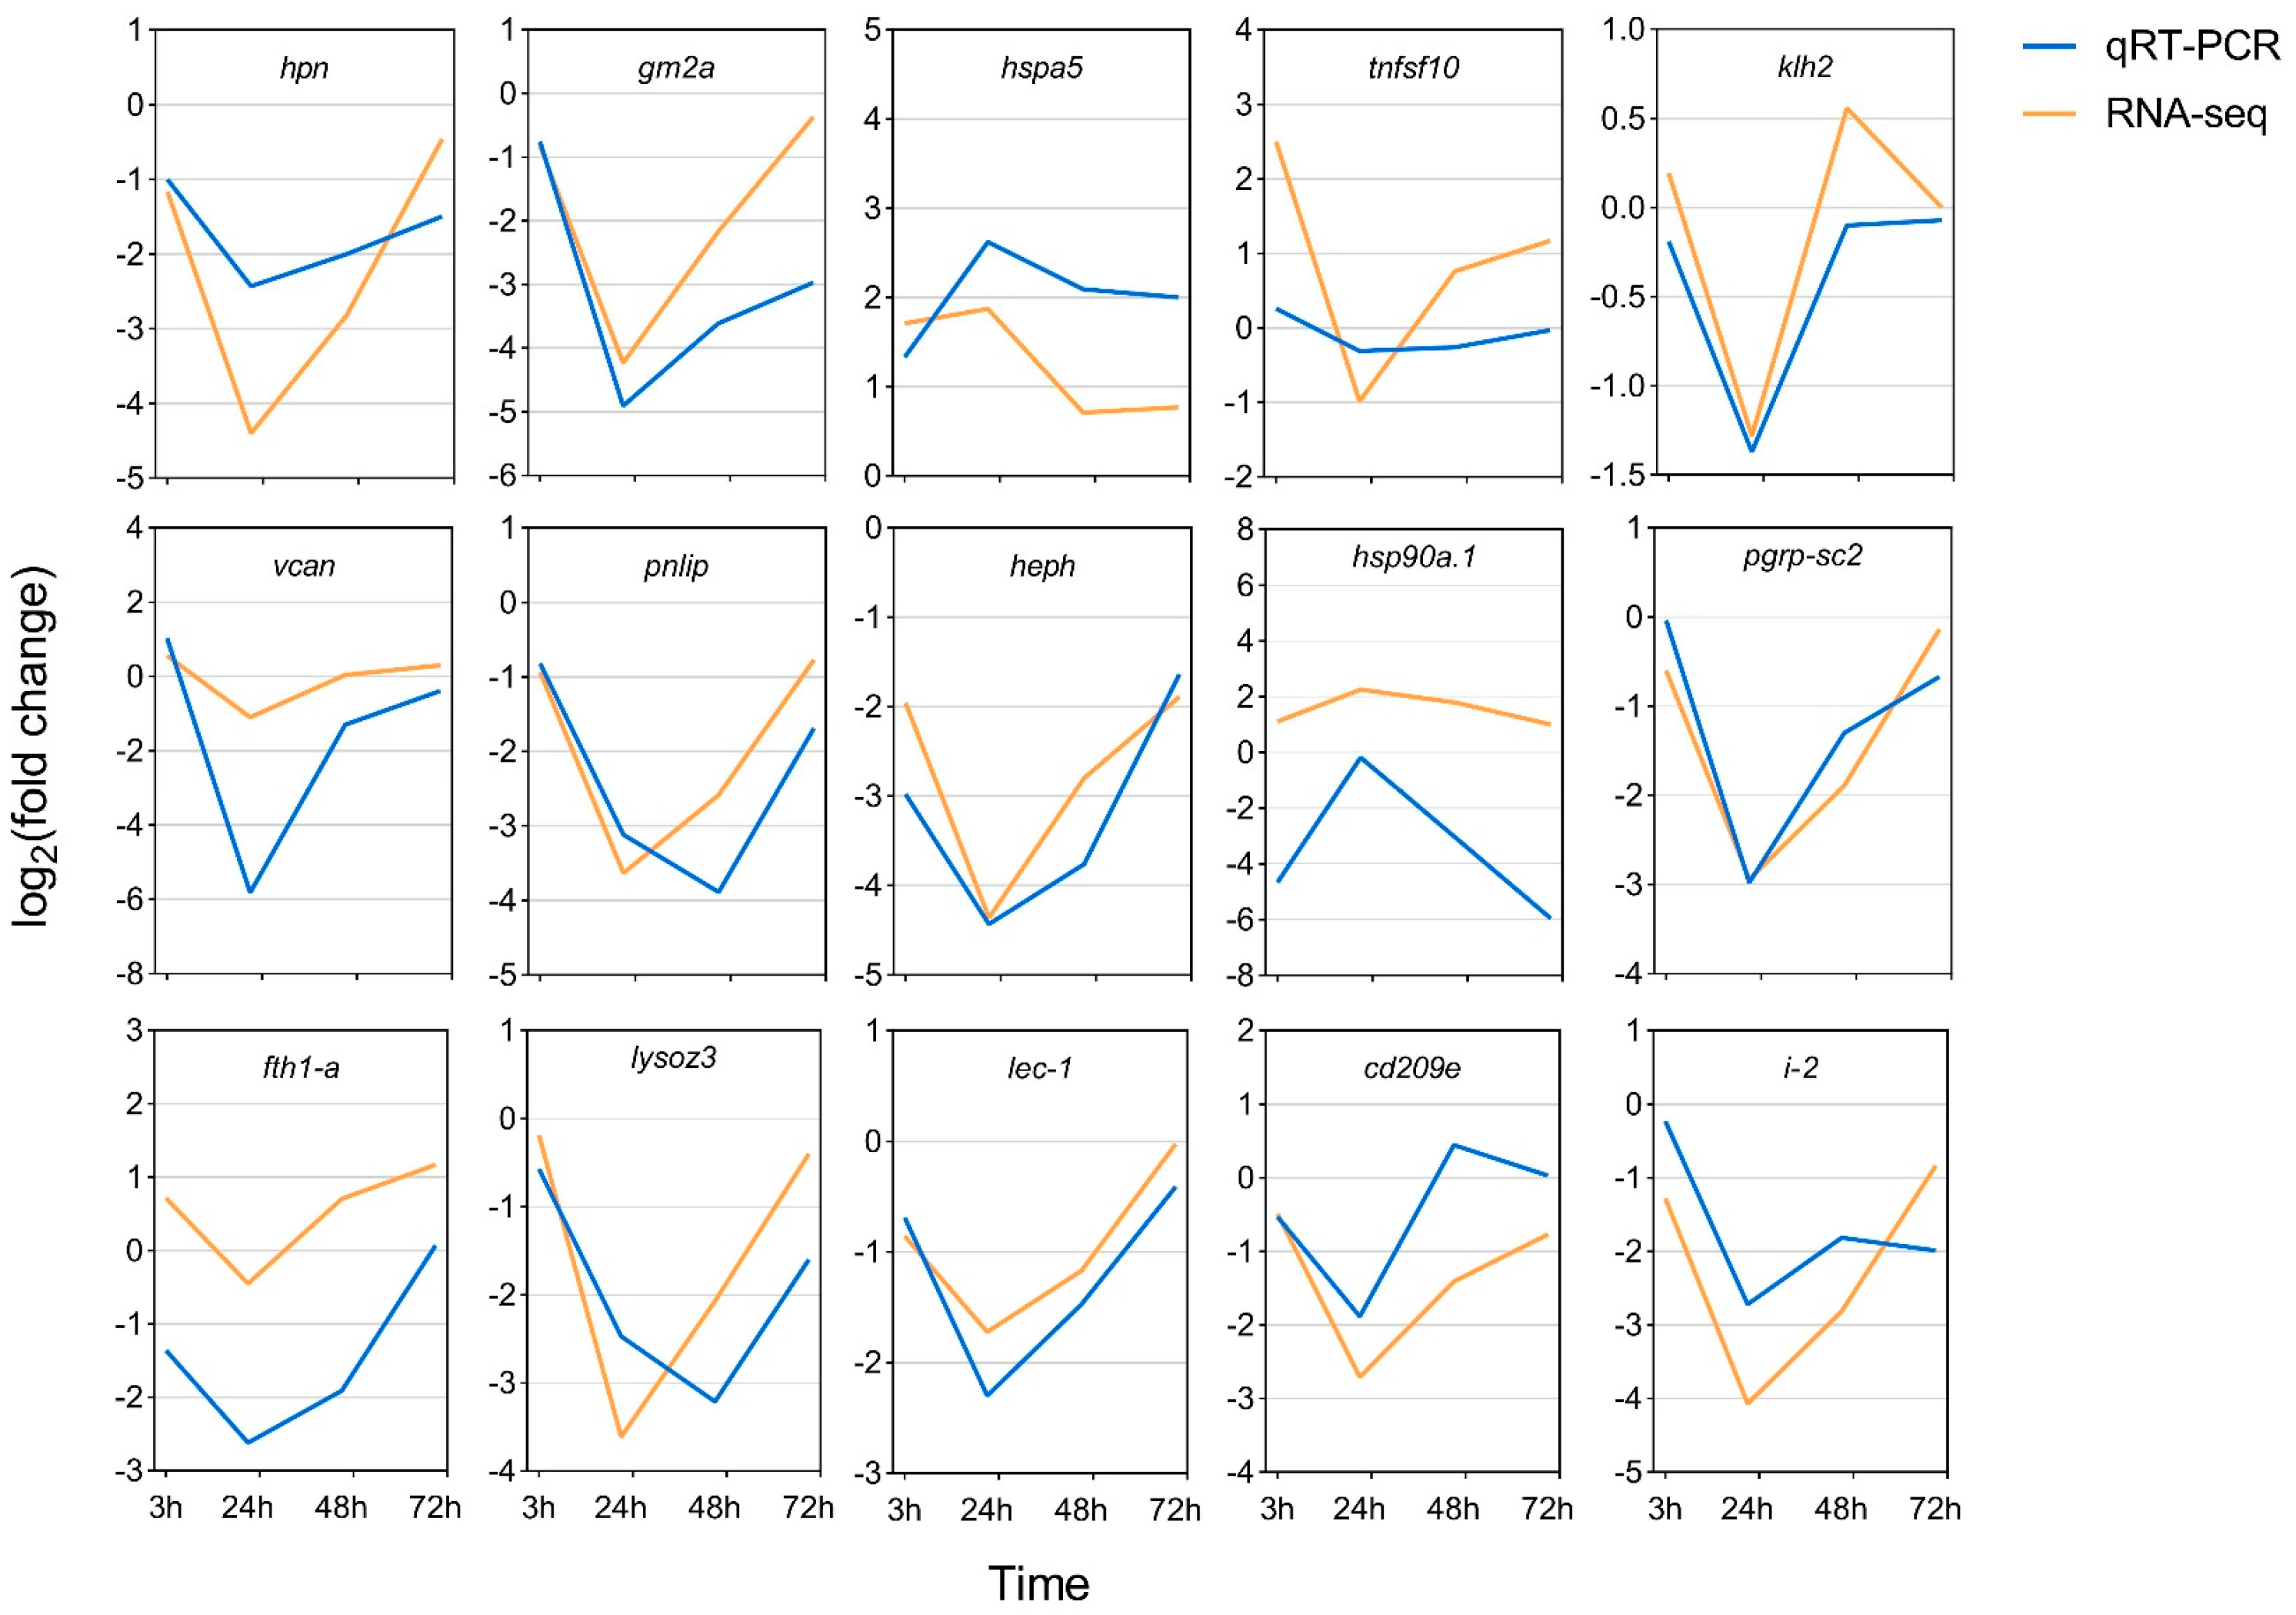
To verify the accuracy of the RNA-seq data, 15 genes were selected for validation by quantitative PCR. The selected genes and primers are listed in Table 2. The expression pattern of the tested DEGs was consistent with the RNA-seq data and showed the same pattern (Figure 2).

3.3. Differential Expression Analysis

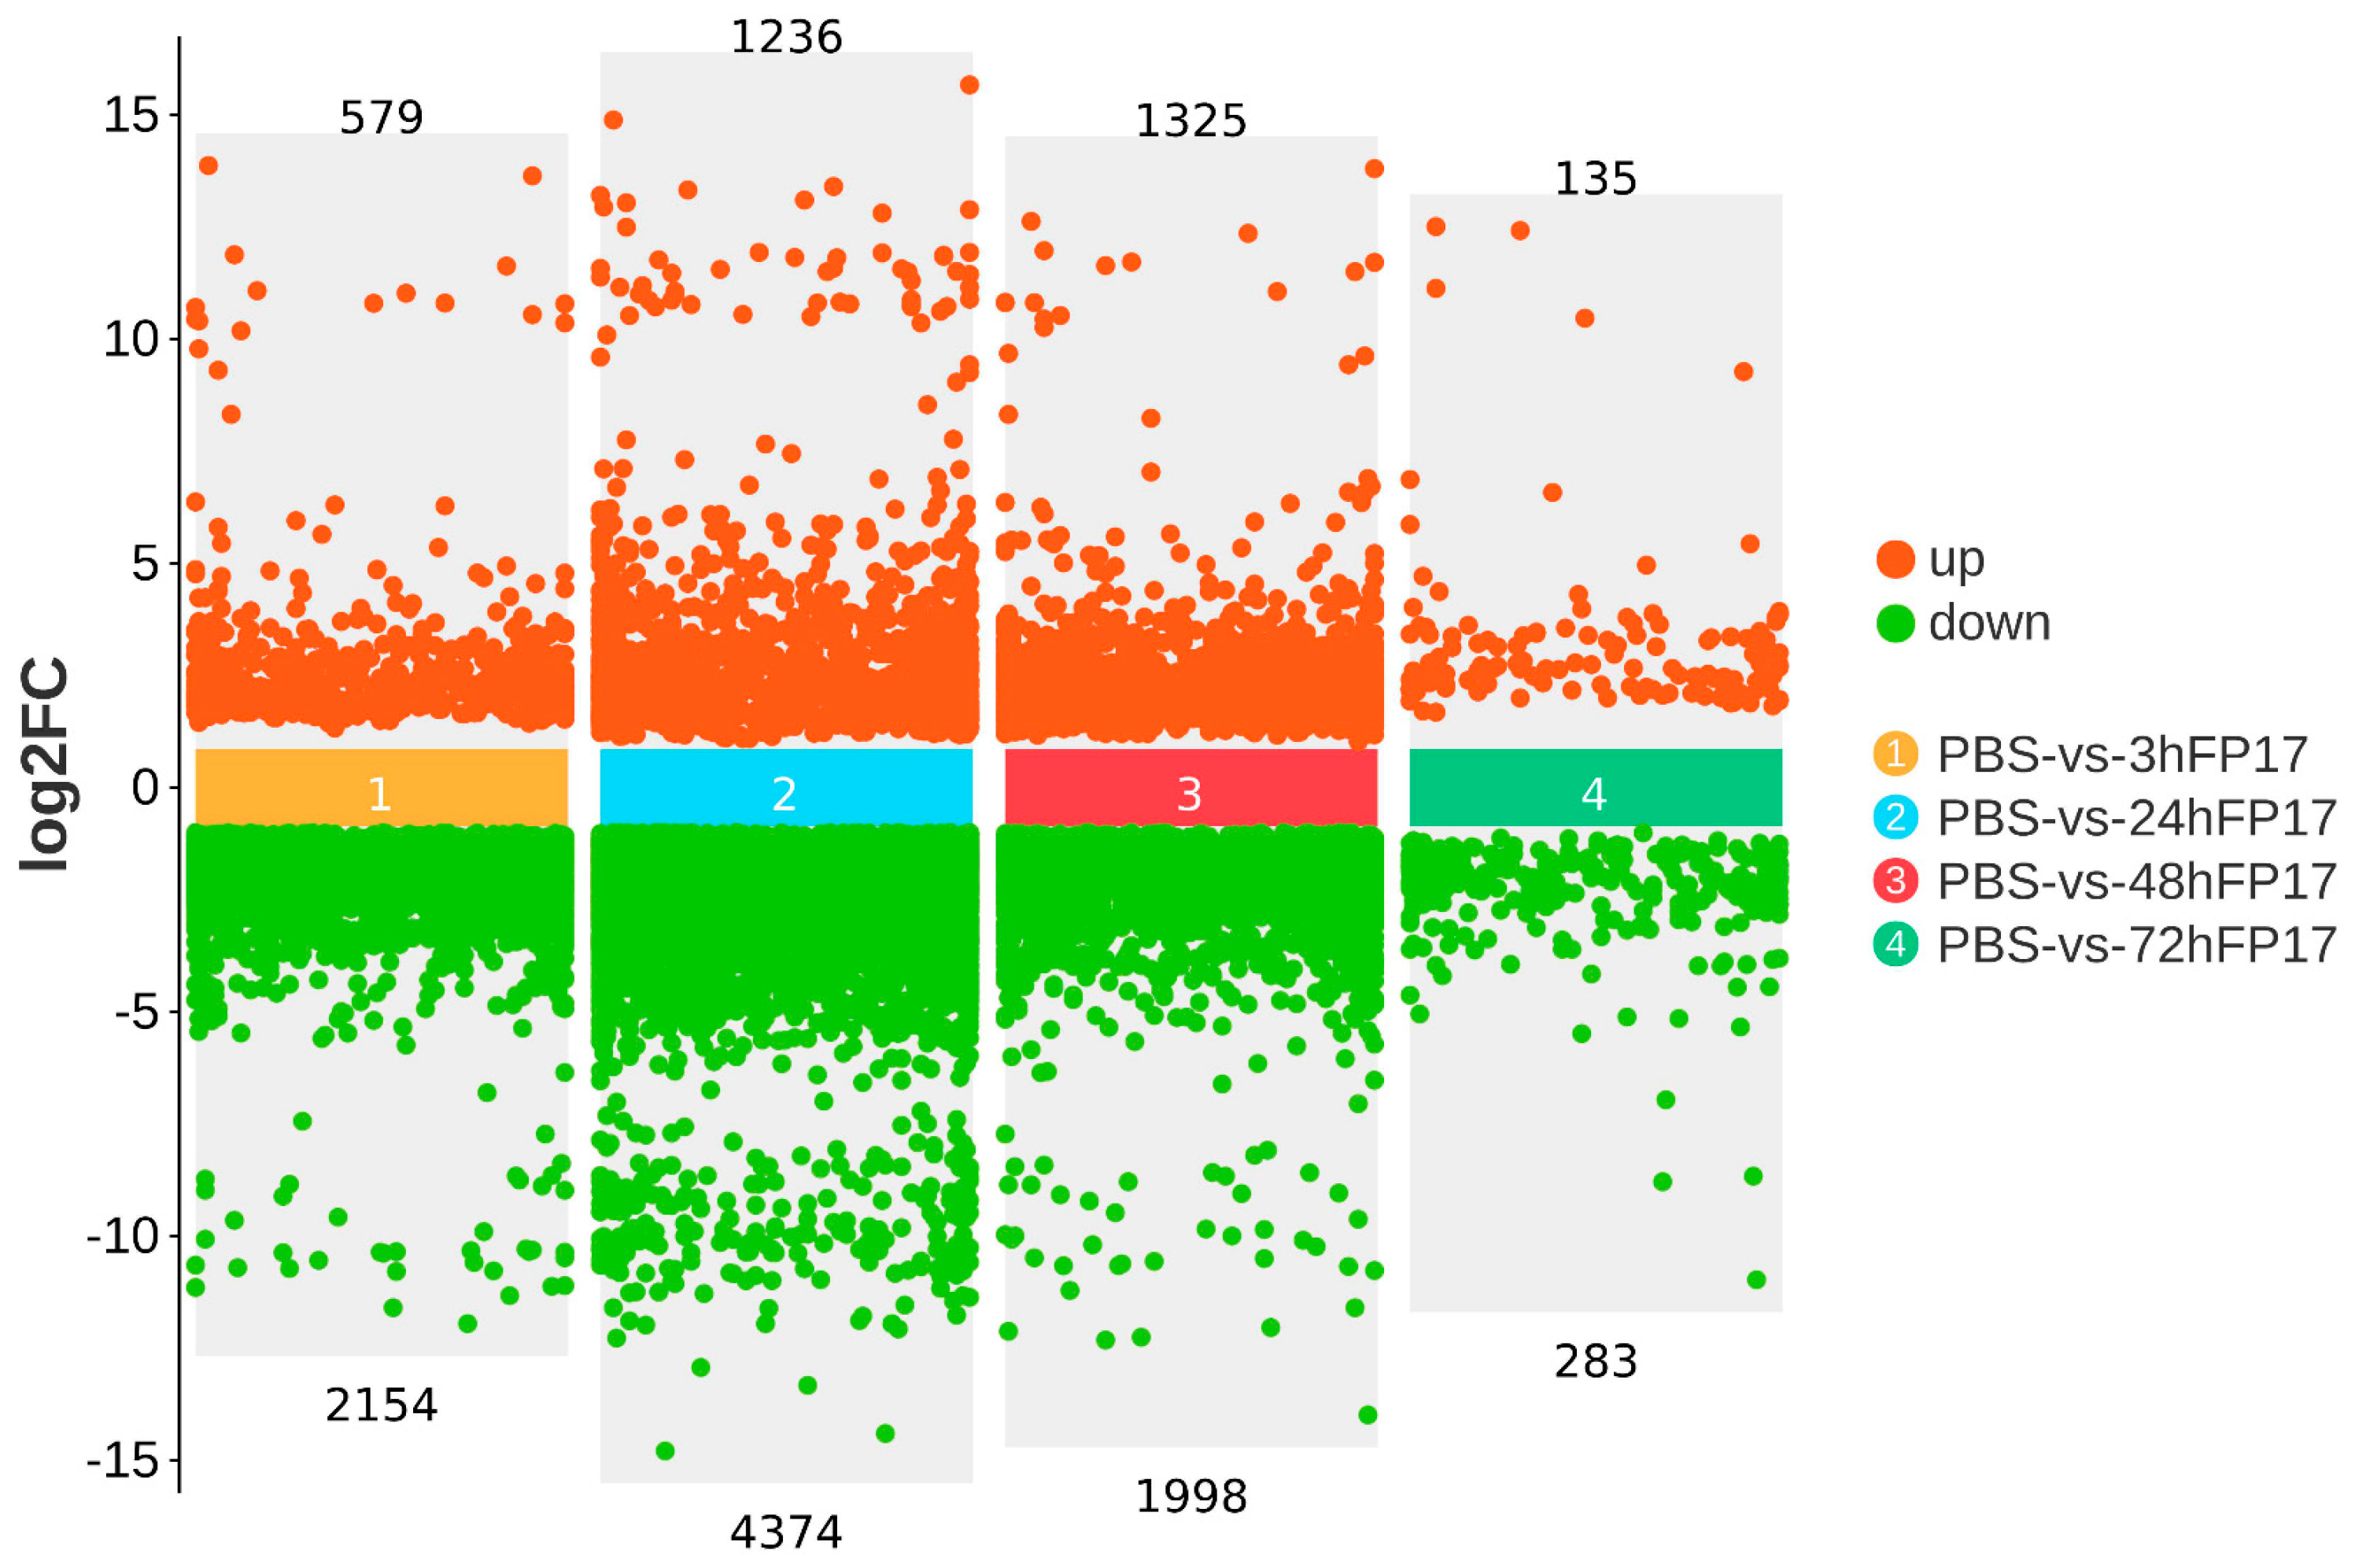
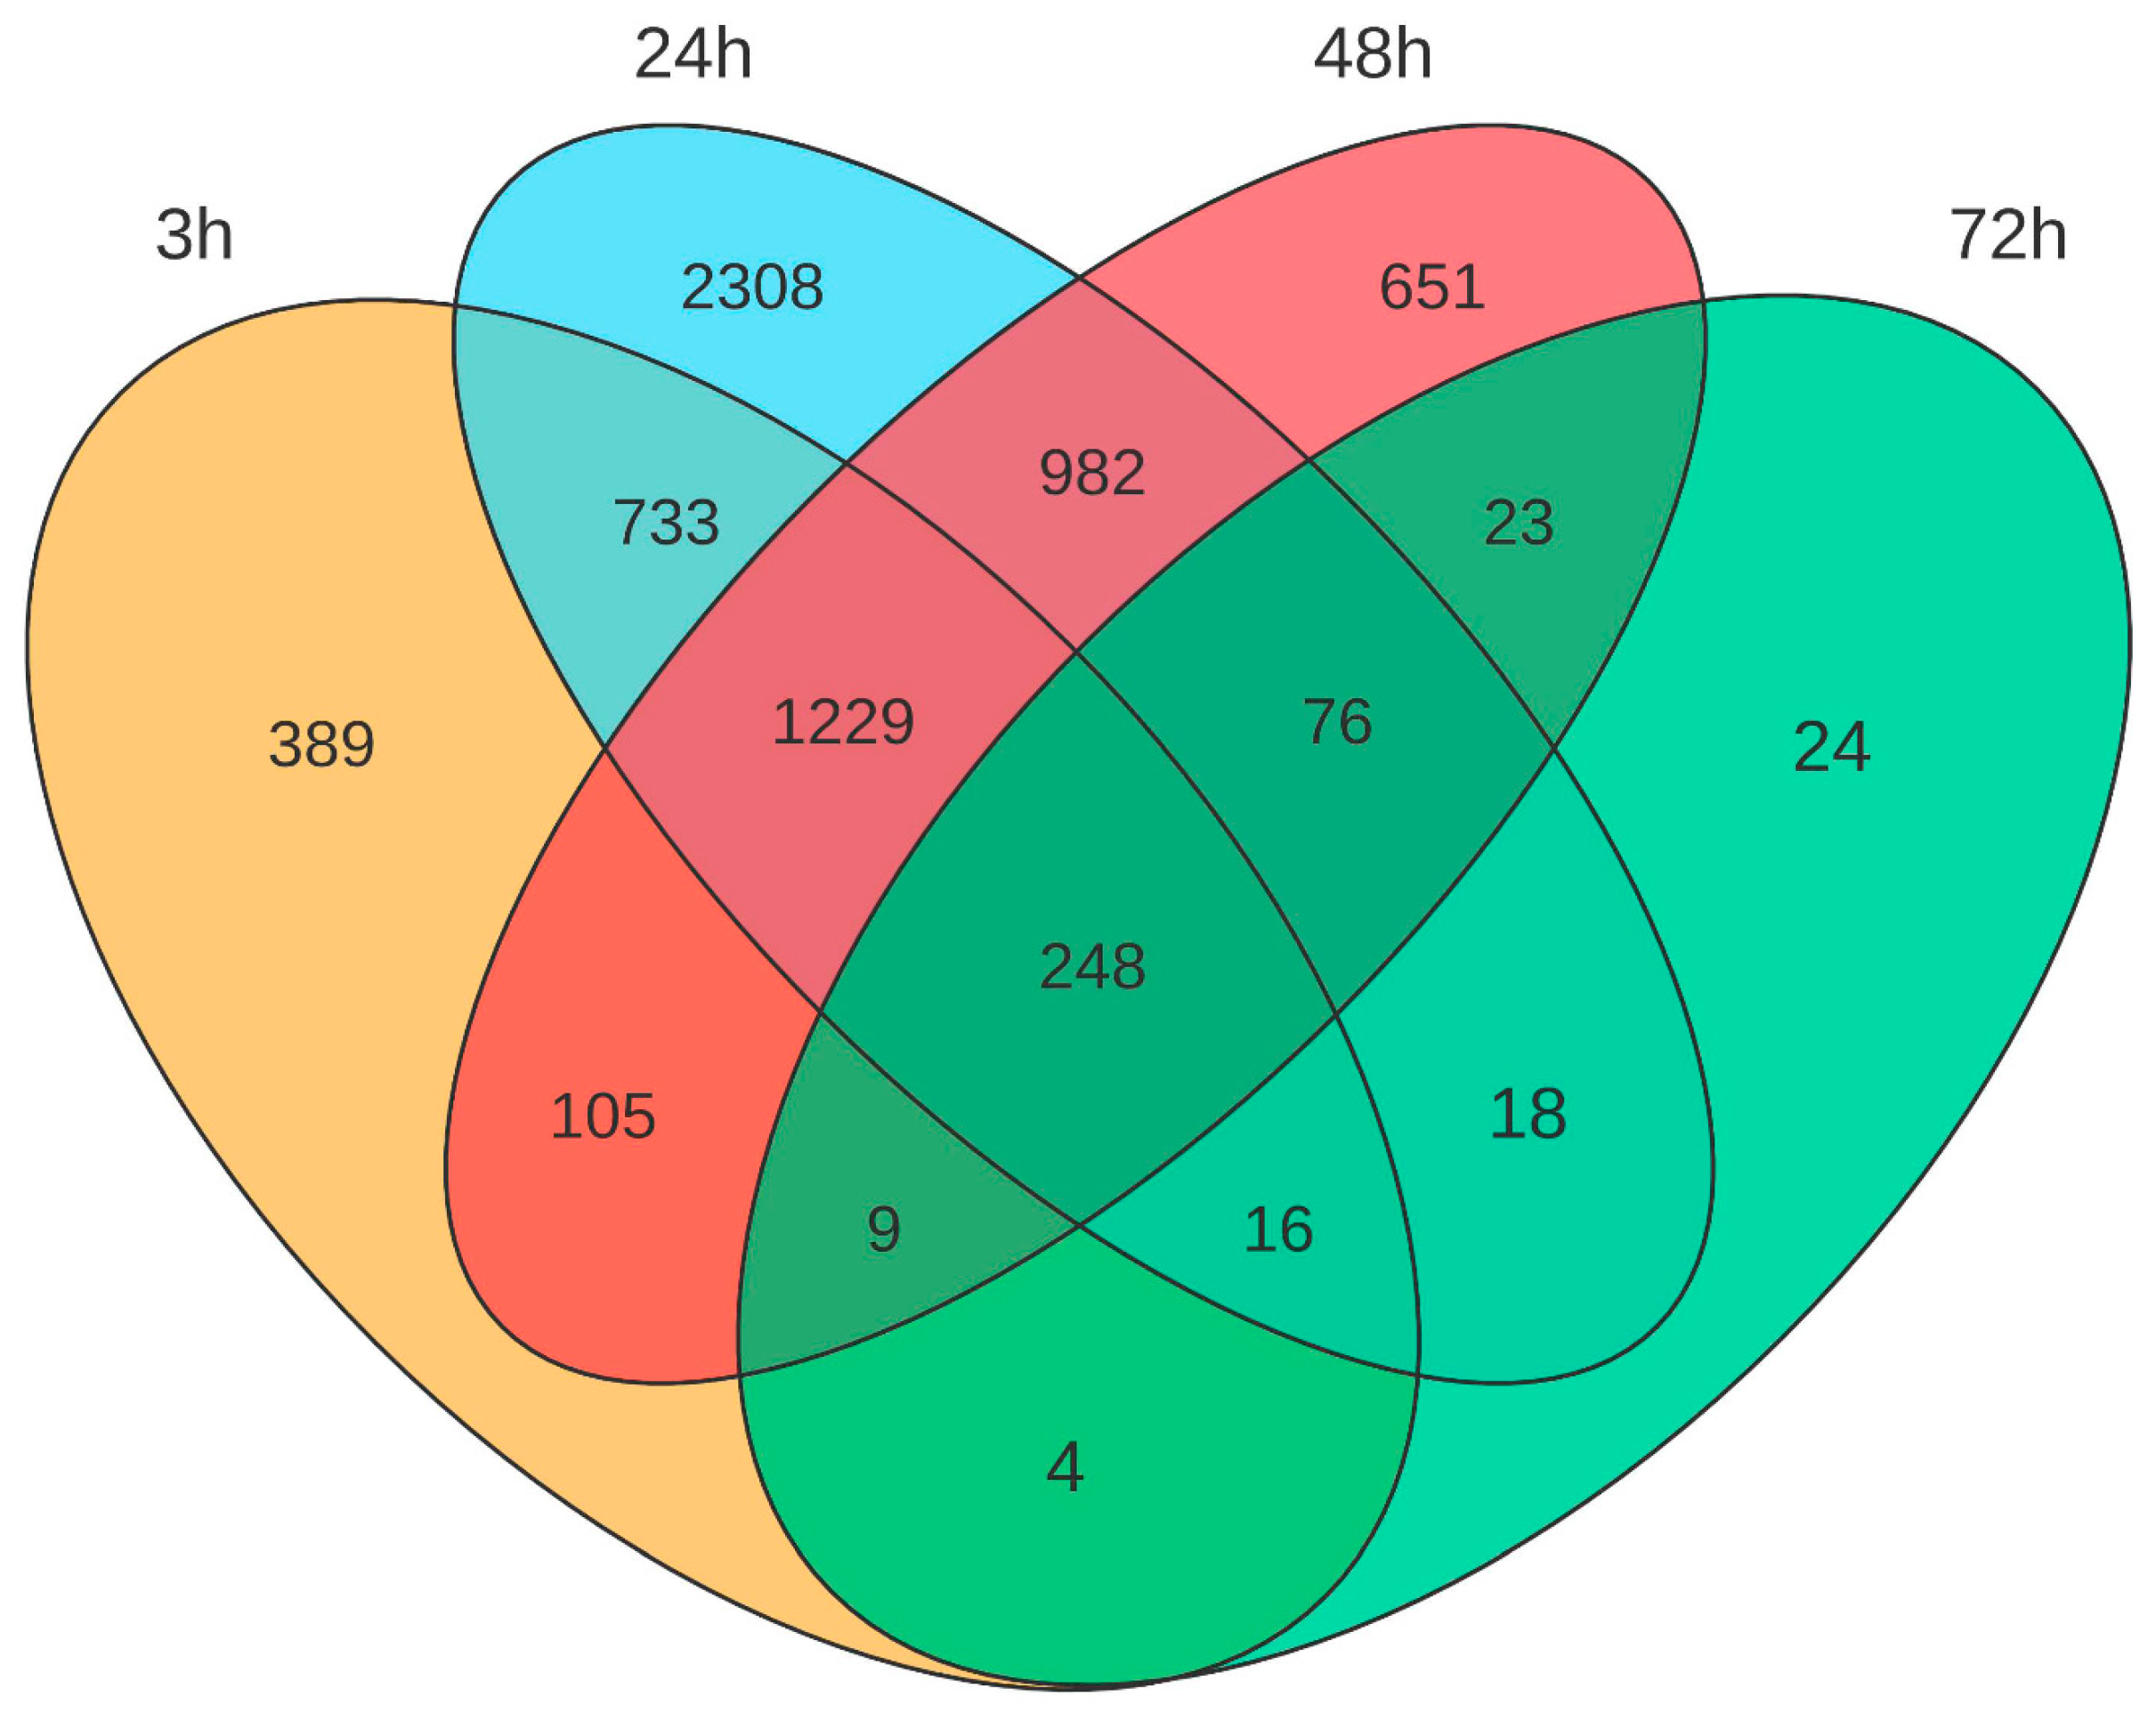
To define the dynamic ivory shell transcriptome profile after V. tubiashii FP17 infection, DEGs were detected at 3 h, 24 h, 48 h, and 72 h post infection and compared with the PBS control. A total of 2733 (3 h), 5610 (24 h), 3323 (48 h), and 418 (72 h) DEGs were identified, respectively. Among these, 579 DEGs were up-regulated and 2154 DEGs were down-regulated at 3 h after infection; 1236 DEGs were up-regulated and 4374 DEGs were down-regulated at 24 h after infection; 1325 were up-regulated and 1998 were down-regulated at 48 h after infection; and 135 were up-regulated and 283 were down-regulated at 72 h after infection (Figure 3). The abundant DEGs detected within 48 h correspond to the robust activation of acute innate immunity and stress response triggered by pathogen invasion. By 72 h post infection, the sharp decline in DEG number indicates that the acute immune activation is attenuated and tends to stabilize. This shift represents a transition from intense acute defensive response to steady-state adaptation in molluscan innate immunity. As shown in the Venn diagram, a total of 6815 DEGs from four time points in the experimental groups were selected for further analysis (Figure 4). Among these, 248 DEGs were expressed at all four different time points, most of which were down-regulated except asph, ilcr-2, and lrp4. These DEGs are related to immune system function and involve several receptors such as tnsf10/11, tgfbr1, and igf1r; proteoglycans: vcan and acan; metabolic factors: ada2a, gnpat, smpd1, and several cytochrome P450 family members; and others: nfat5, trim2, map3k2, npas4, and trp53inp1.
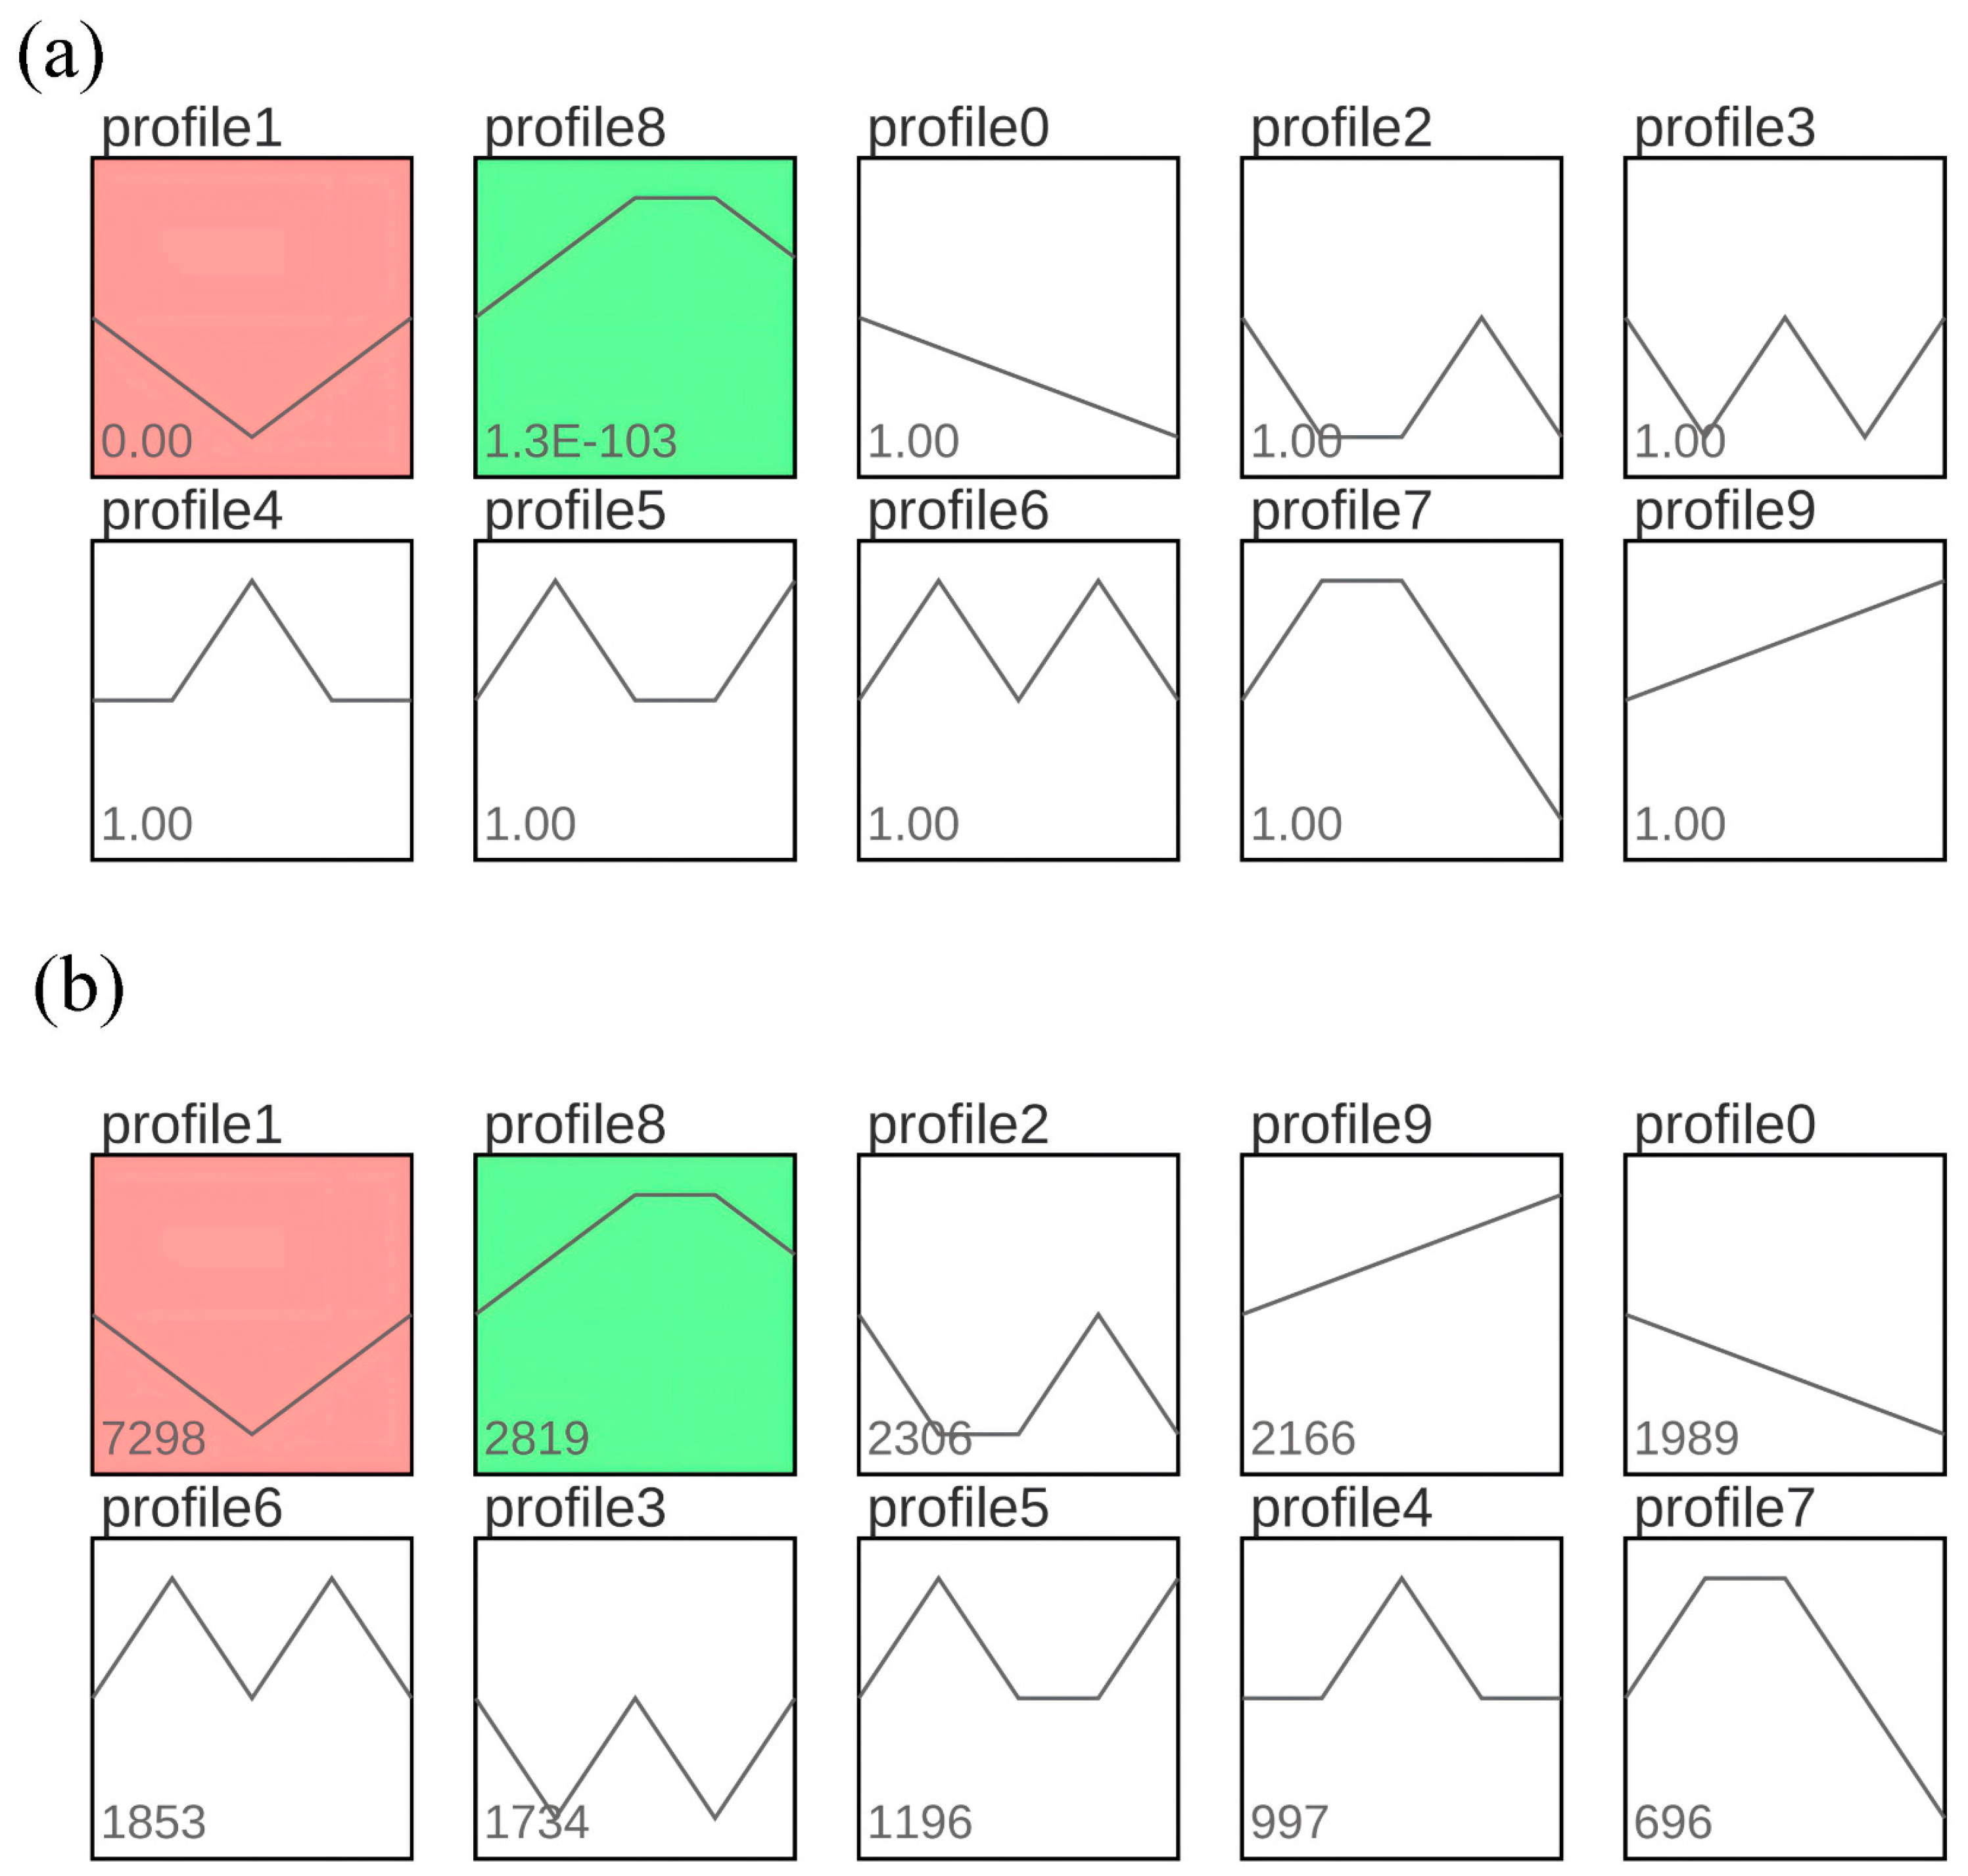
Next, 6815 DEGs were analyzed for expression trends using STEM. There were 10 different expression trends, with two significantly enriched profiles: profiles 1 and 8 (Figure 5). These two showed opposing expression trends, where profile 1 contained the most genes (3667) and varied most significantly, displaying an initial downregulation (3 h and 24 h) and then upregulation (48 h and 72 h), while profile 8 contained 1293 DEGs and was up-regulated initially and then down-regulated. These may represent the early and late immune defense waves. Profile 8 was analyzed further since the DEGs in this profile may be involved in early host defense. The significantly up-regulated genes sytl5, xiap, and tgm1 peaked at 3 h, while cryab, hpn, slc43a3, esco2, pgm1, cdca3, diap1, arf4, aoc3, and cav1 peaked at 24 h. The most significant DEGs at 48 h were gpx6, nxn, adam10, ywhab, ten-m, pgbd2, slc66a3, and stk38. Notably, xiap, diap1, cryab, and ywhab can inhibit apoptosis and regulate inflammation and immune cell survival. Moreover, gpx6, nxn, slc66a3, and stk38 are associated with antioxidant function that may protect cells from oxidative damage. The solute carrier (SLC) family members slc43a3 and slc66a3 were also up-regulated and may participate in cellular antioxidant defense and enhanced cell viability. Unexpectedly, most metabolic and energy-related genes were down-regulated in profile 1, including many genes associated with glycolysis and fatty acid oxidation, such as cpt1, a specific transporter required for the entry of fatty acids into the mitochondria for β-oxidation.

3.4. GO Enrichment of DEGs

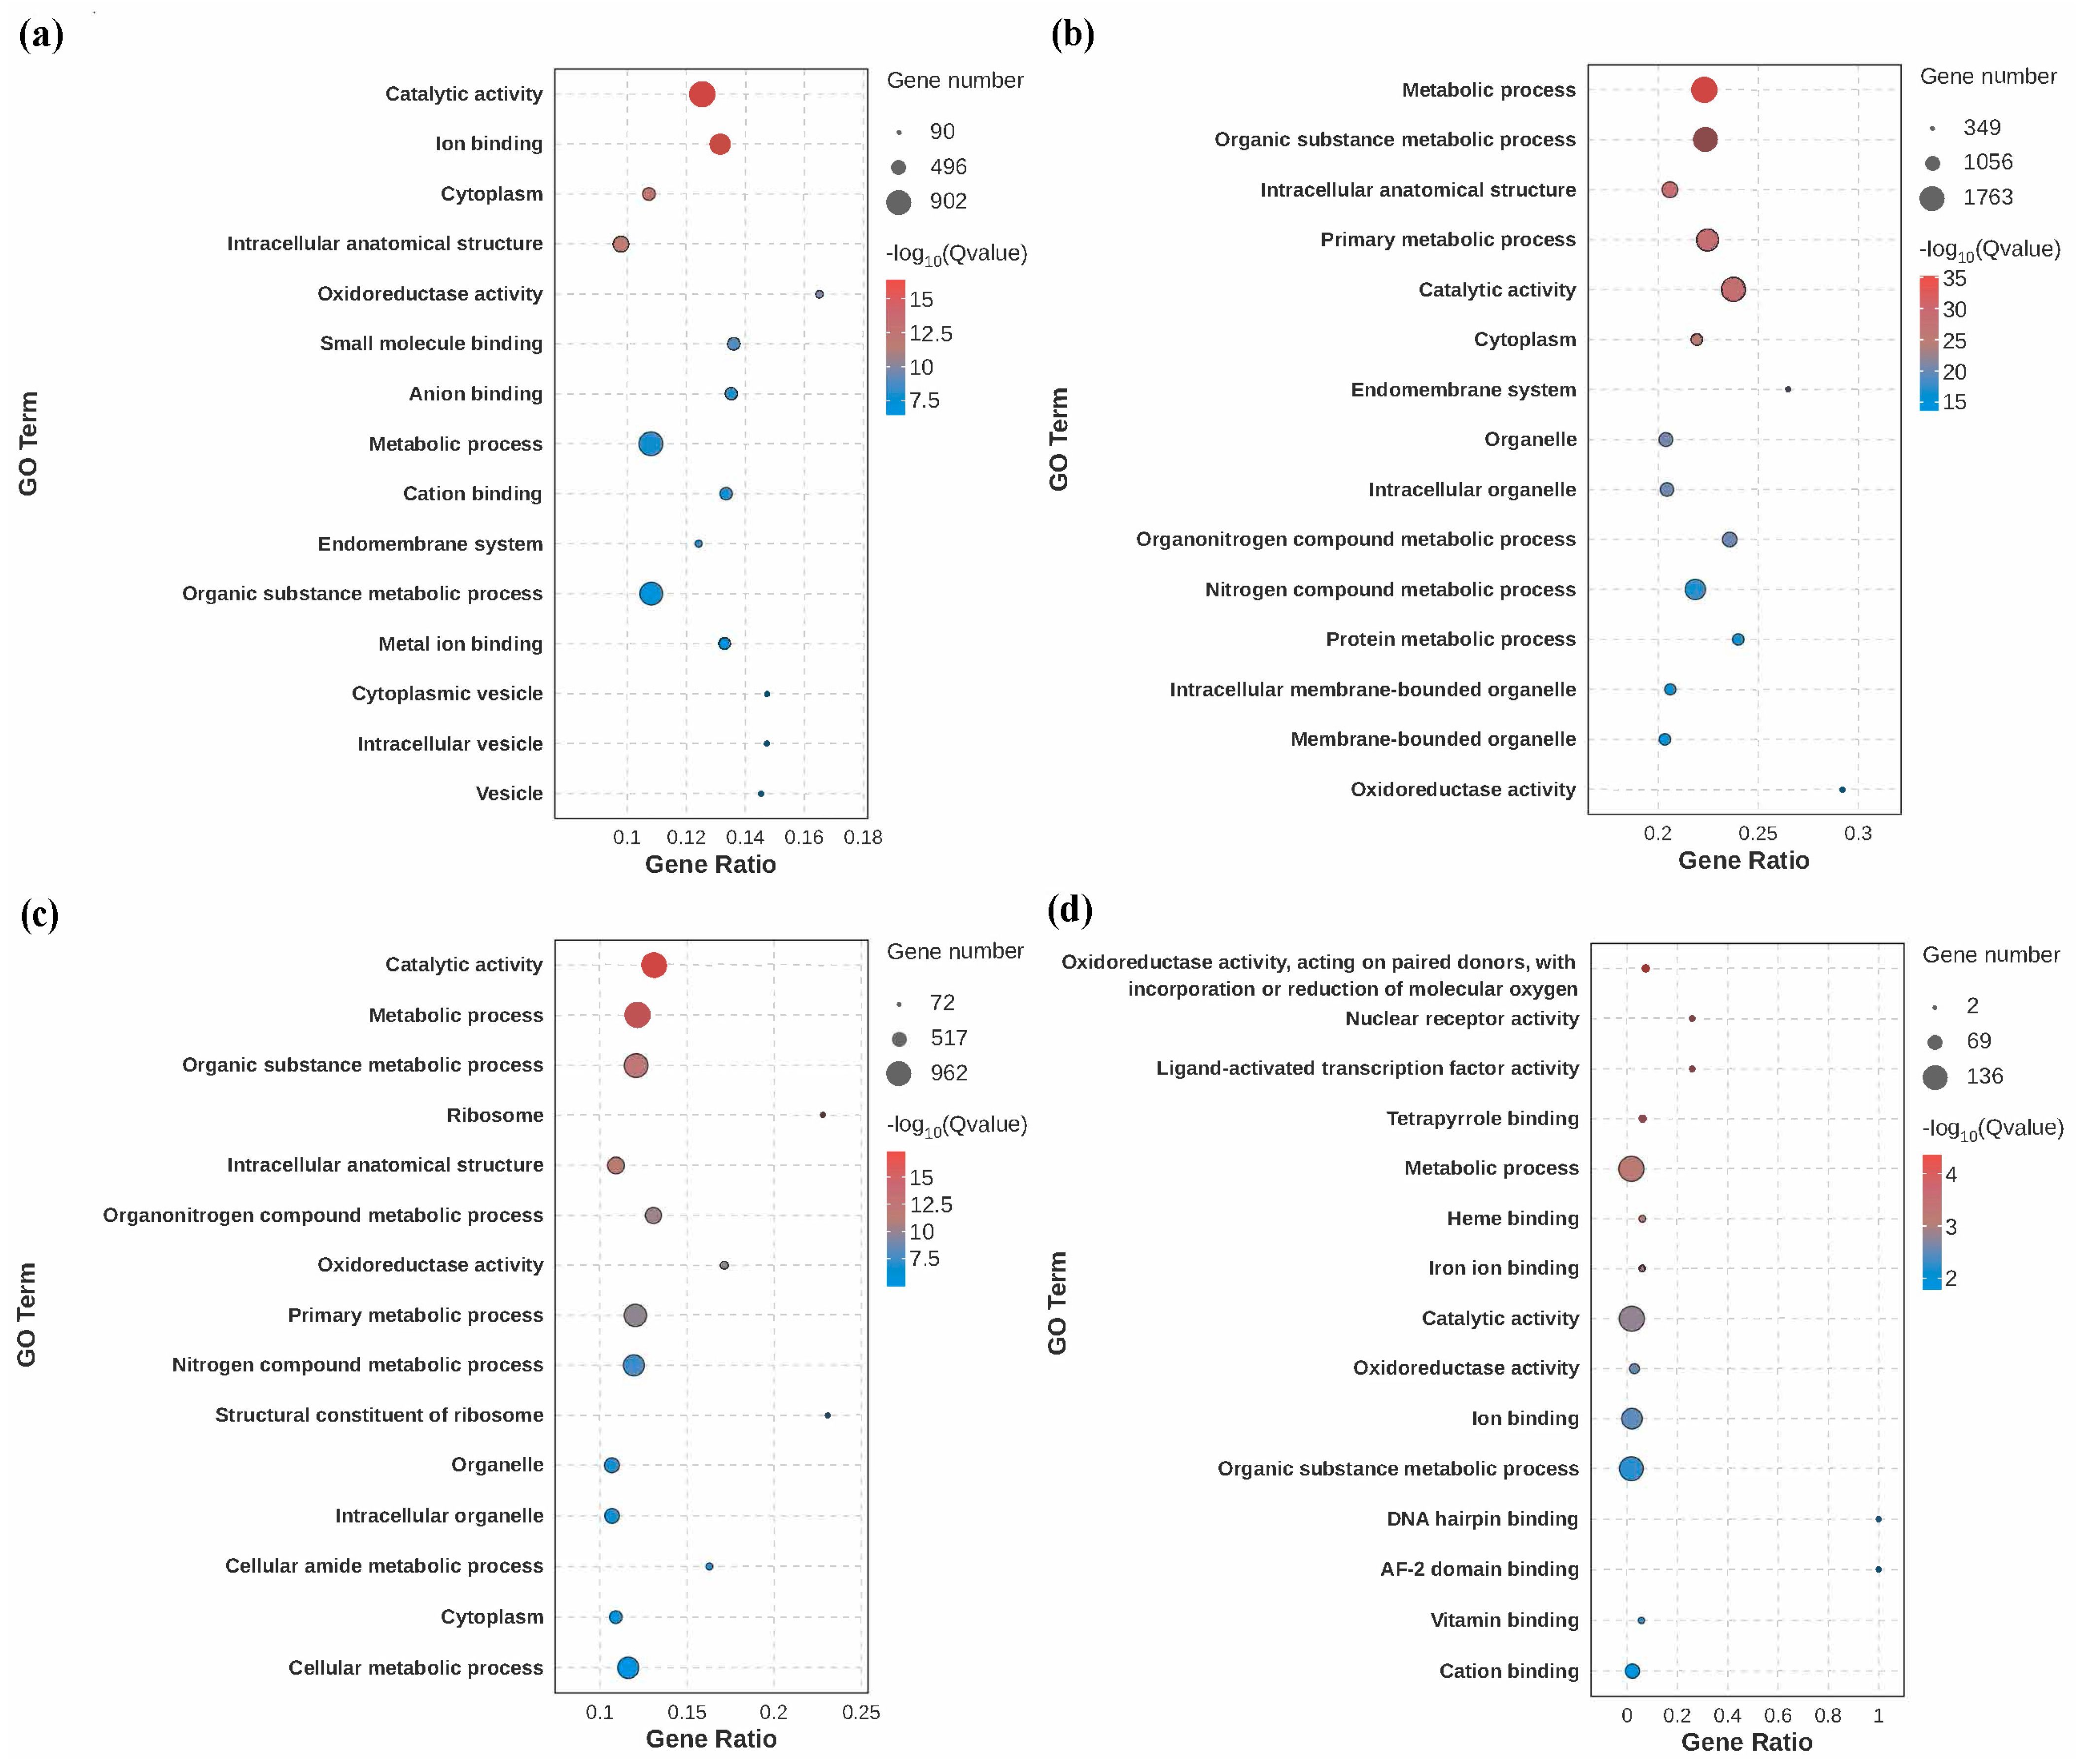
To identify the potential function of these DEGs, GO and KEGG enrichment analysis were performed on the clustered DEGs. A total of 6815 DEGs were grouped into Biological Process (BP), Cellular Component (CC), and Molecular Function (MF) (Figure 6). The top terms of the three categories were identified in binding, cellular process, metabolic process, catalytic activity, localization, and response to stimulus, which may relate to the bacterial infection. At the beginning of infection (3 h), the DEGs were significantly enriched in catalytic activity, ion binding, oxidoreductase activity, and intracellular anatomical structure besides cytoplasm and metabolic process (Figure 6a). At 24 h after infection, various metabolic processes were the most enriched, followed by catalytic activity, cytoplasm, organelle, proteolysis, and organelle and vesicle-mediated transport (Figure 6b). In the long-term (48 h and 72 h), lysosome, ribosome, and lytic vacuole were highly enriched. Signaling, transporter activity, and immune system processes were also highly enriched (Figure 6c,d).
The up- and down-regulated DEGs on the annotated GO were further analyzed and revealed distinct expression patterns among the groups. A large number of genes were down-regulated at 3 h, 24 h, and 48 h in most of the GO terms, including several types of binding, oxidoreductase activity, and the endomembrane system. Significantly up-regulated DEGs at 3 h included DNA polymerase and nucleotidyltransferase activity, mechanosensitive ion channel activity, and peptidase activity. In contrast, at 24 h and 48 h, DEGs were significantly up-regulated in peptide biosynthetic process, amide biosynthetic process, ribosome, and translation. Only a few genes were highly expressed at 72 h, while those in oxidoreductase activity, binding, and nuclear receptor activity were down-regulated.

3.5. KEGG Enrichment of DEGs

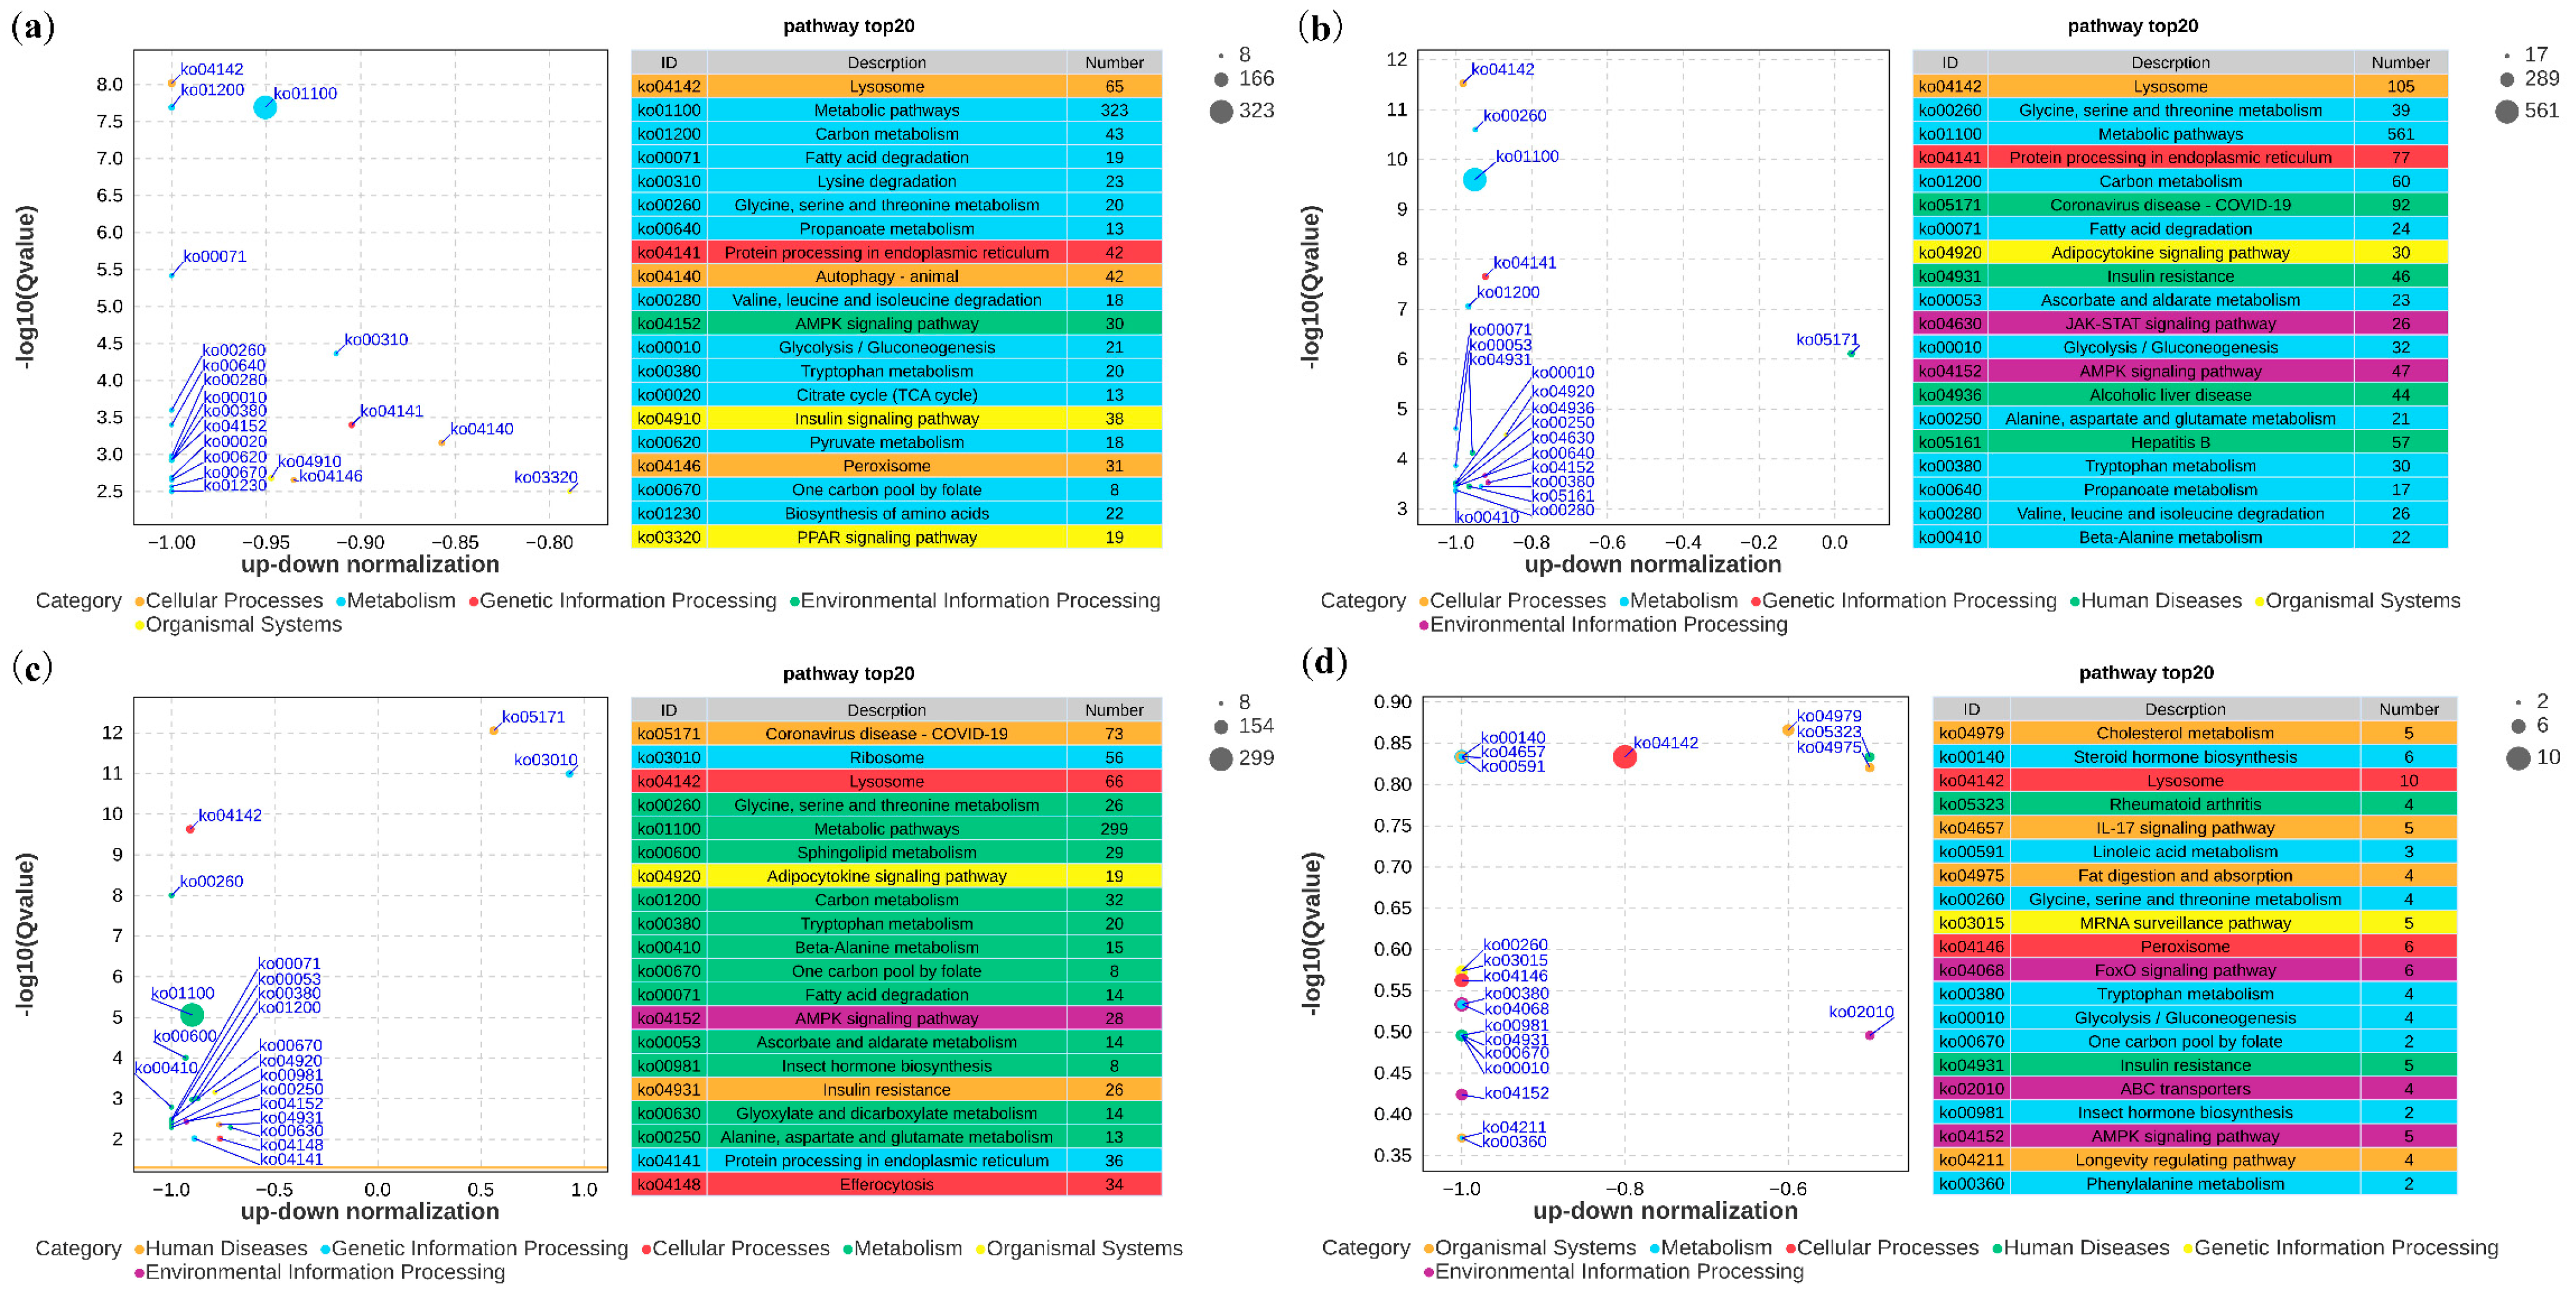
The top 20 enriched pathways are shown in Figure 7. Generally, a large number of genes were significantly down-regulated compared to up-regulated during infection, where the most enriched were lysosome and metabolic pathway. The up-regulated genes in the 3 h group were significantly enriched in lipid metabolism, NOD-like receptor signaling pathway, apoptosis, and focal adhension, while down-regulated genes were enriched in fatty acid degradation, autophagy, peroxisome, insulin signaling pathway, and adipocytokine signaling pathway, which were also enriched in the 24 h group (Figure 7a,b). The protein processing in endoplasmic reticulum, metabolism, including amino acid, carbon, fatty acid, and insulin pathways, was also enriched at 24 h (Figure 7b). Moreover, ribosome-related pathways showed the most prominent enrichment among upregulated genes at 24 h and 48 h, indicating that enhanced protein synthesis and signal transduction act as key responses during the middle stage of infection (Figure 7b,c). However, up-regulated genes were significantly enriched in phagosome and apoptosis in the 24 h group, while neutrophil extracellular trap formation, necroptosis, and toll-like receptor signaling pathway were enriched in the 48 h group, highlighting the distinct functions of the immune defense system after infection (Figure 7b,c). In contrast, at 72 h, down-regulated genes were significantly enriched in cholesterol metabolism, steroid hormone biosynthesis, and immune-related pathway (Figure 7d). Up-regulated genes were enriched in phagosome, fat digestion, and absorption. The pathways annotated as coronavirus disease in the database cover multiple functional modules conserved in invertebrates, including TNF signaling, FcγR-mediated phagocytosis, toll-like receptor signaling, as well as complement and coagulation cascades process. The other enriched KEGG pathways related to host metabolism and response to infection were also identified, including the AMPK signaling pathway, MyD88-dependent pathway, FoxO signaling, and PI3K-Akt signaling. The top 20 pathways related to immunity at different time points are summarized in Table 3. Notably, several vertebrate immune pathways and human-disease-associated pathways appeared in the top 20 enriched KEGG pathways (Table 3). The enrichment of vertebrate-specific pathways is an annotation bias inherent to KEGG, which conducts mapping based on sequence homology and is dominated by vertebrate reference data, rather than authentic functional pathways in mollusks.

3.6. Network Construction and Screening of Key Genes

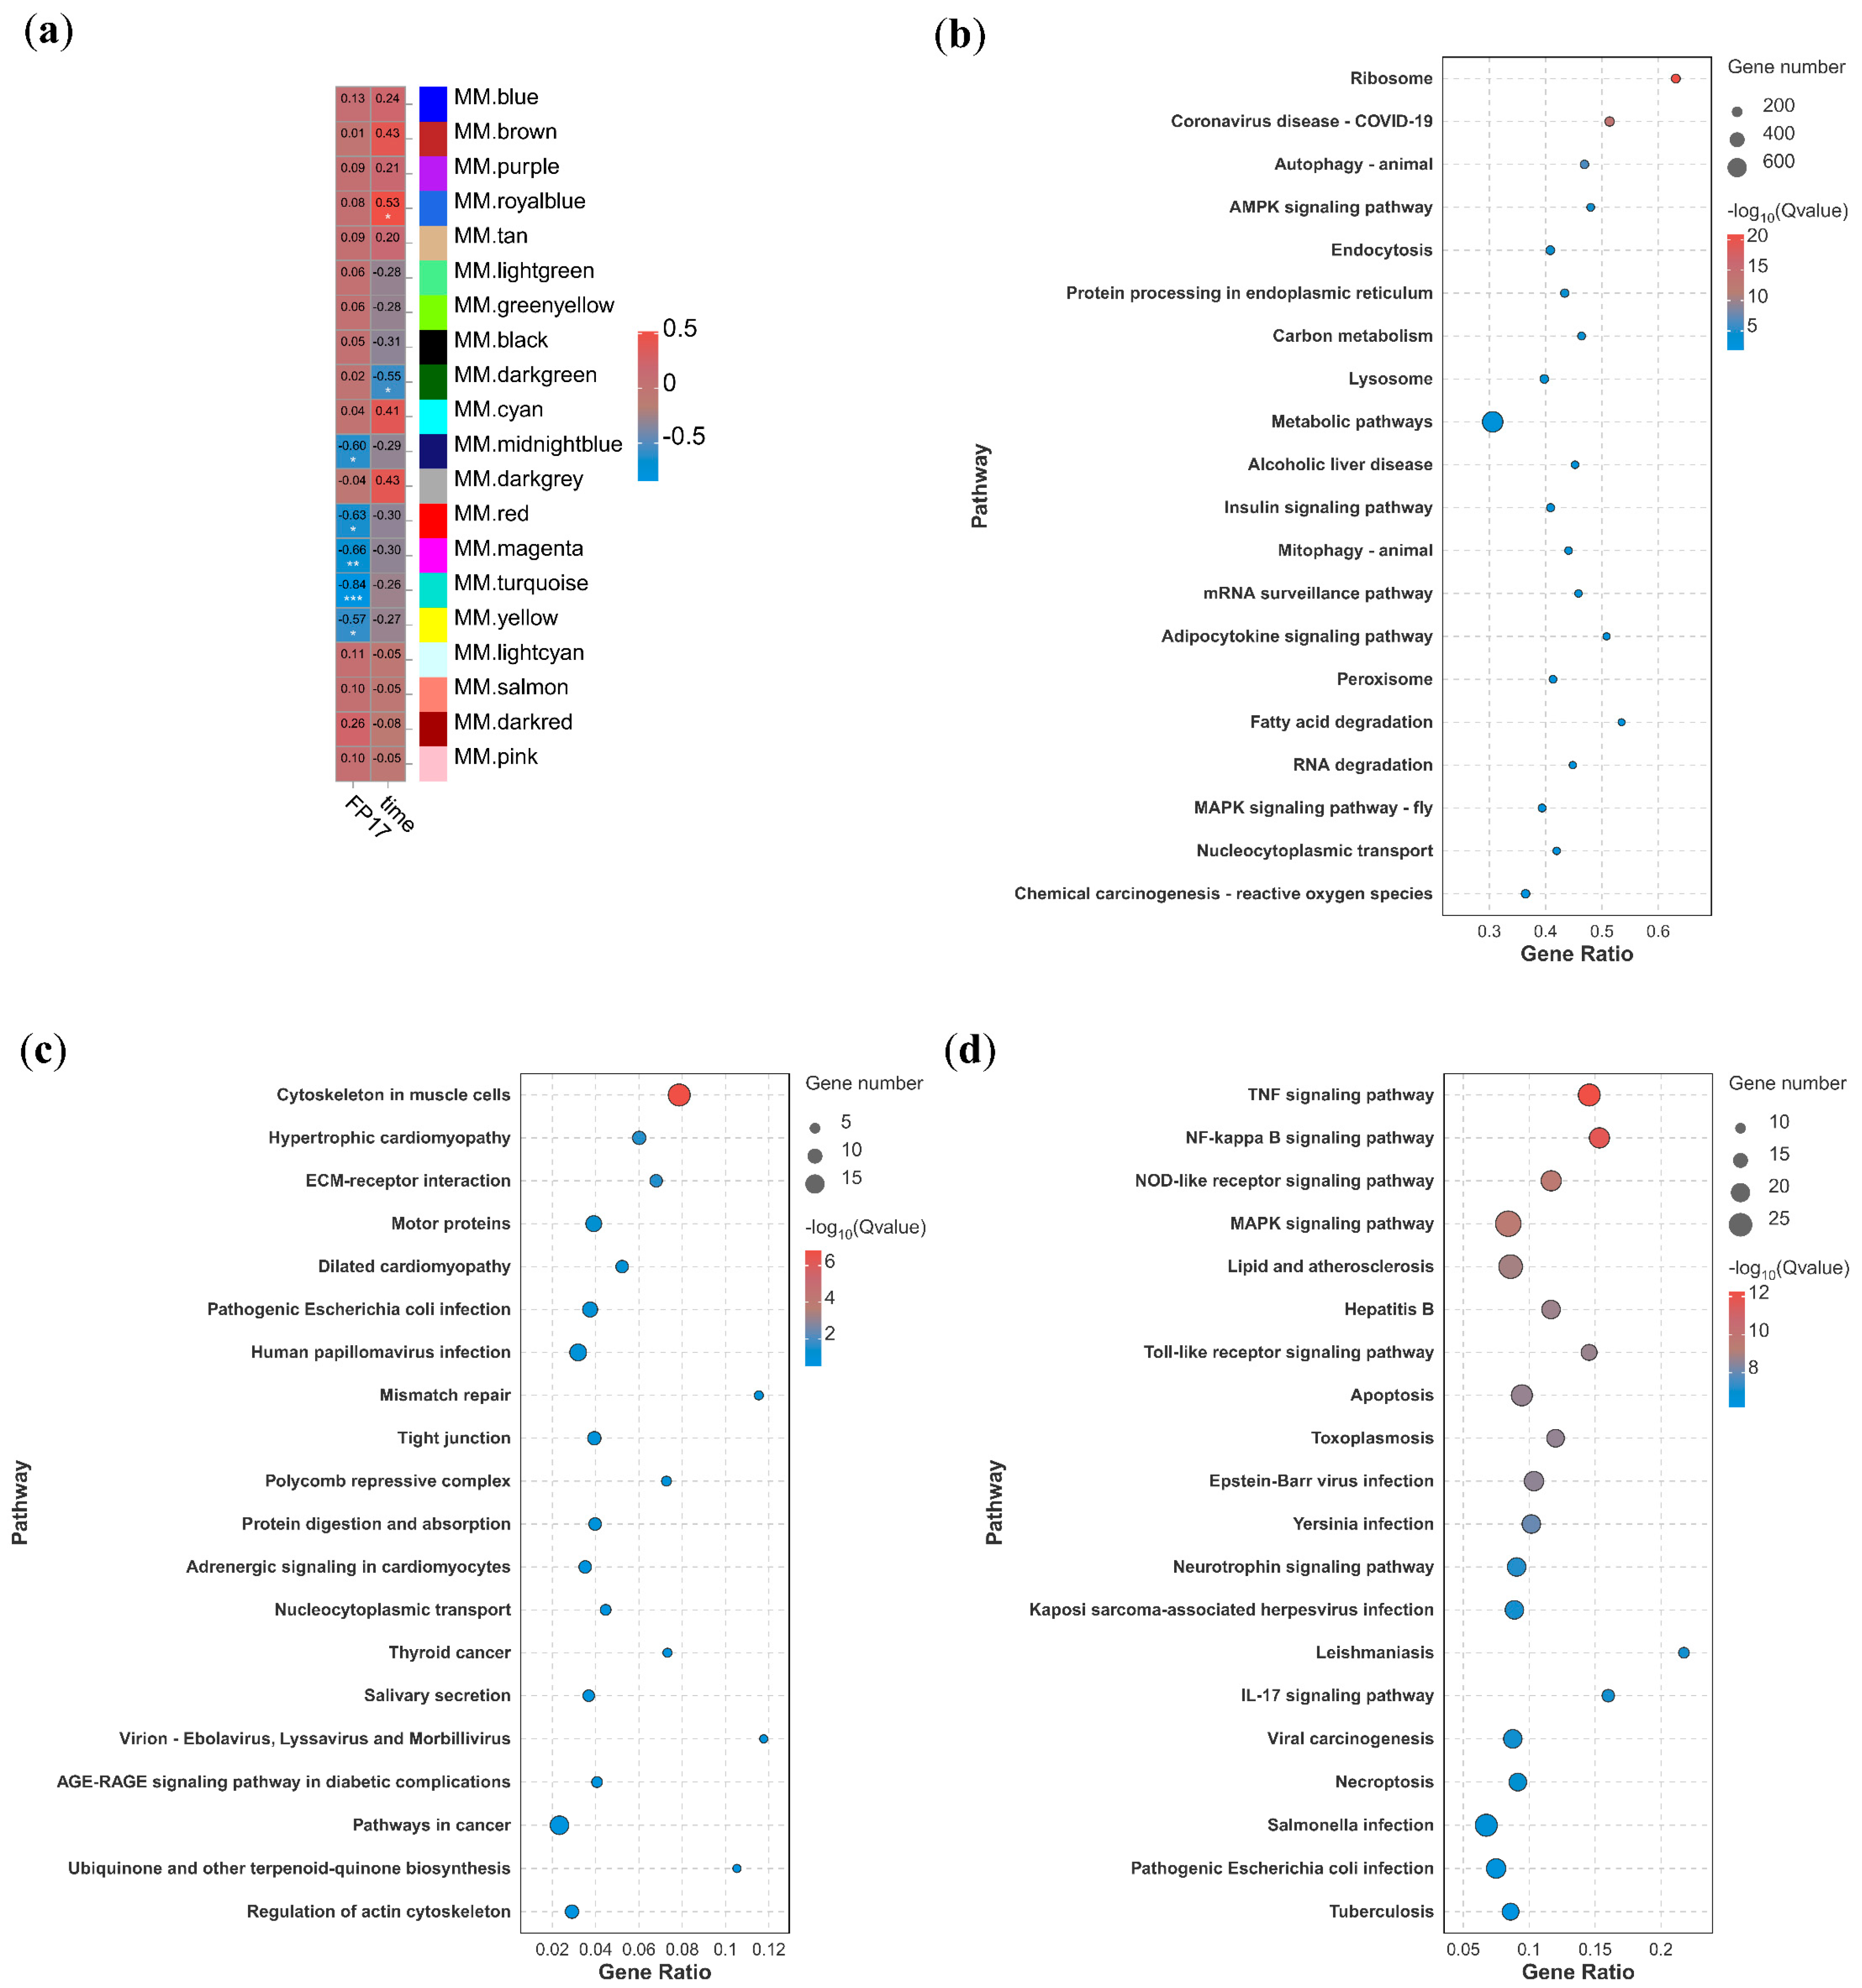
To elucidate specific co-expression modules associated with the progression of V. tubiashii infection, all the identified transcriptomes were analyzed by WGCNA (Figure 8a). The turquoise module showed the most significant negative correlation (r = −0.84) with V. tubiashii infection, where KEGG terms were enriched in ribosome, autophagy, AMPK signaling pathway, and endocytosis (Figure 8b). The royal blue module was the most significantly positively correlated module (r = 0.53), whereas the dark green module was the most significantly negatively correlated module (r = −0.55) with infection time. Here, cytoskeleton in muscle cells and ECM-receptor interaction were enriched and positively correlated, while TNF signaling pathway, NF-kappa B signaling pathway, and NOD-like receptor signaling pathway were enriched and negatively correlated with infection progression (Figure 8c,d). The top 1% of genes in the turquoise, royal blue, and dark green modules were considered key genes and were highly correlated with V. tubiashii infection (Table 4).

3.7. Construction of Immune-Related Protein Interaction Networks

In addition to WGCNA, a protein–protein interaction analysis was performed to identify proteins critical to the immune response. The 259 DEGs were selected from the significantly enriched immune-related KEGG pathways for the PPI network construction, and the top-ranked genes that were sorted by node degree value and immune-related role are summarized in Table 5. Protein phosphatase 2 (ppp2 encoded) shows the highest degree, followed by ATP synthase (atp6 encoded) and guanine nucleotide exchange factor (sos1 encoded). Meanwhile, drk (homolog to grb2), grb2, atf2, jun, and polr3 with higher degree were also confirmed. The above genes are reported functions in multiple biological processes linked to molluscan defense, including transcriptional regulation and stress response, energy metabolism and mitochondrial function, protein phosphorylation and signal regulation, RNA synthesis, as well as the Ras-MAPK signaling pathway. Therefore, these genes may serve as candidate genes for further functional characterization in future research.

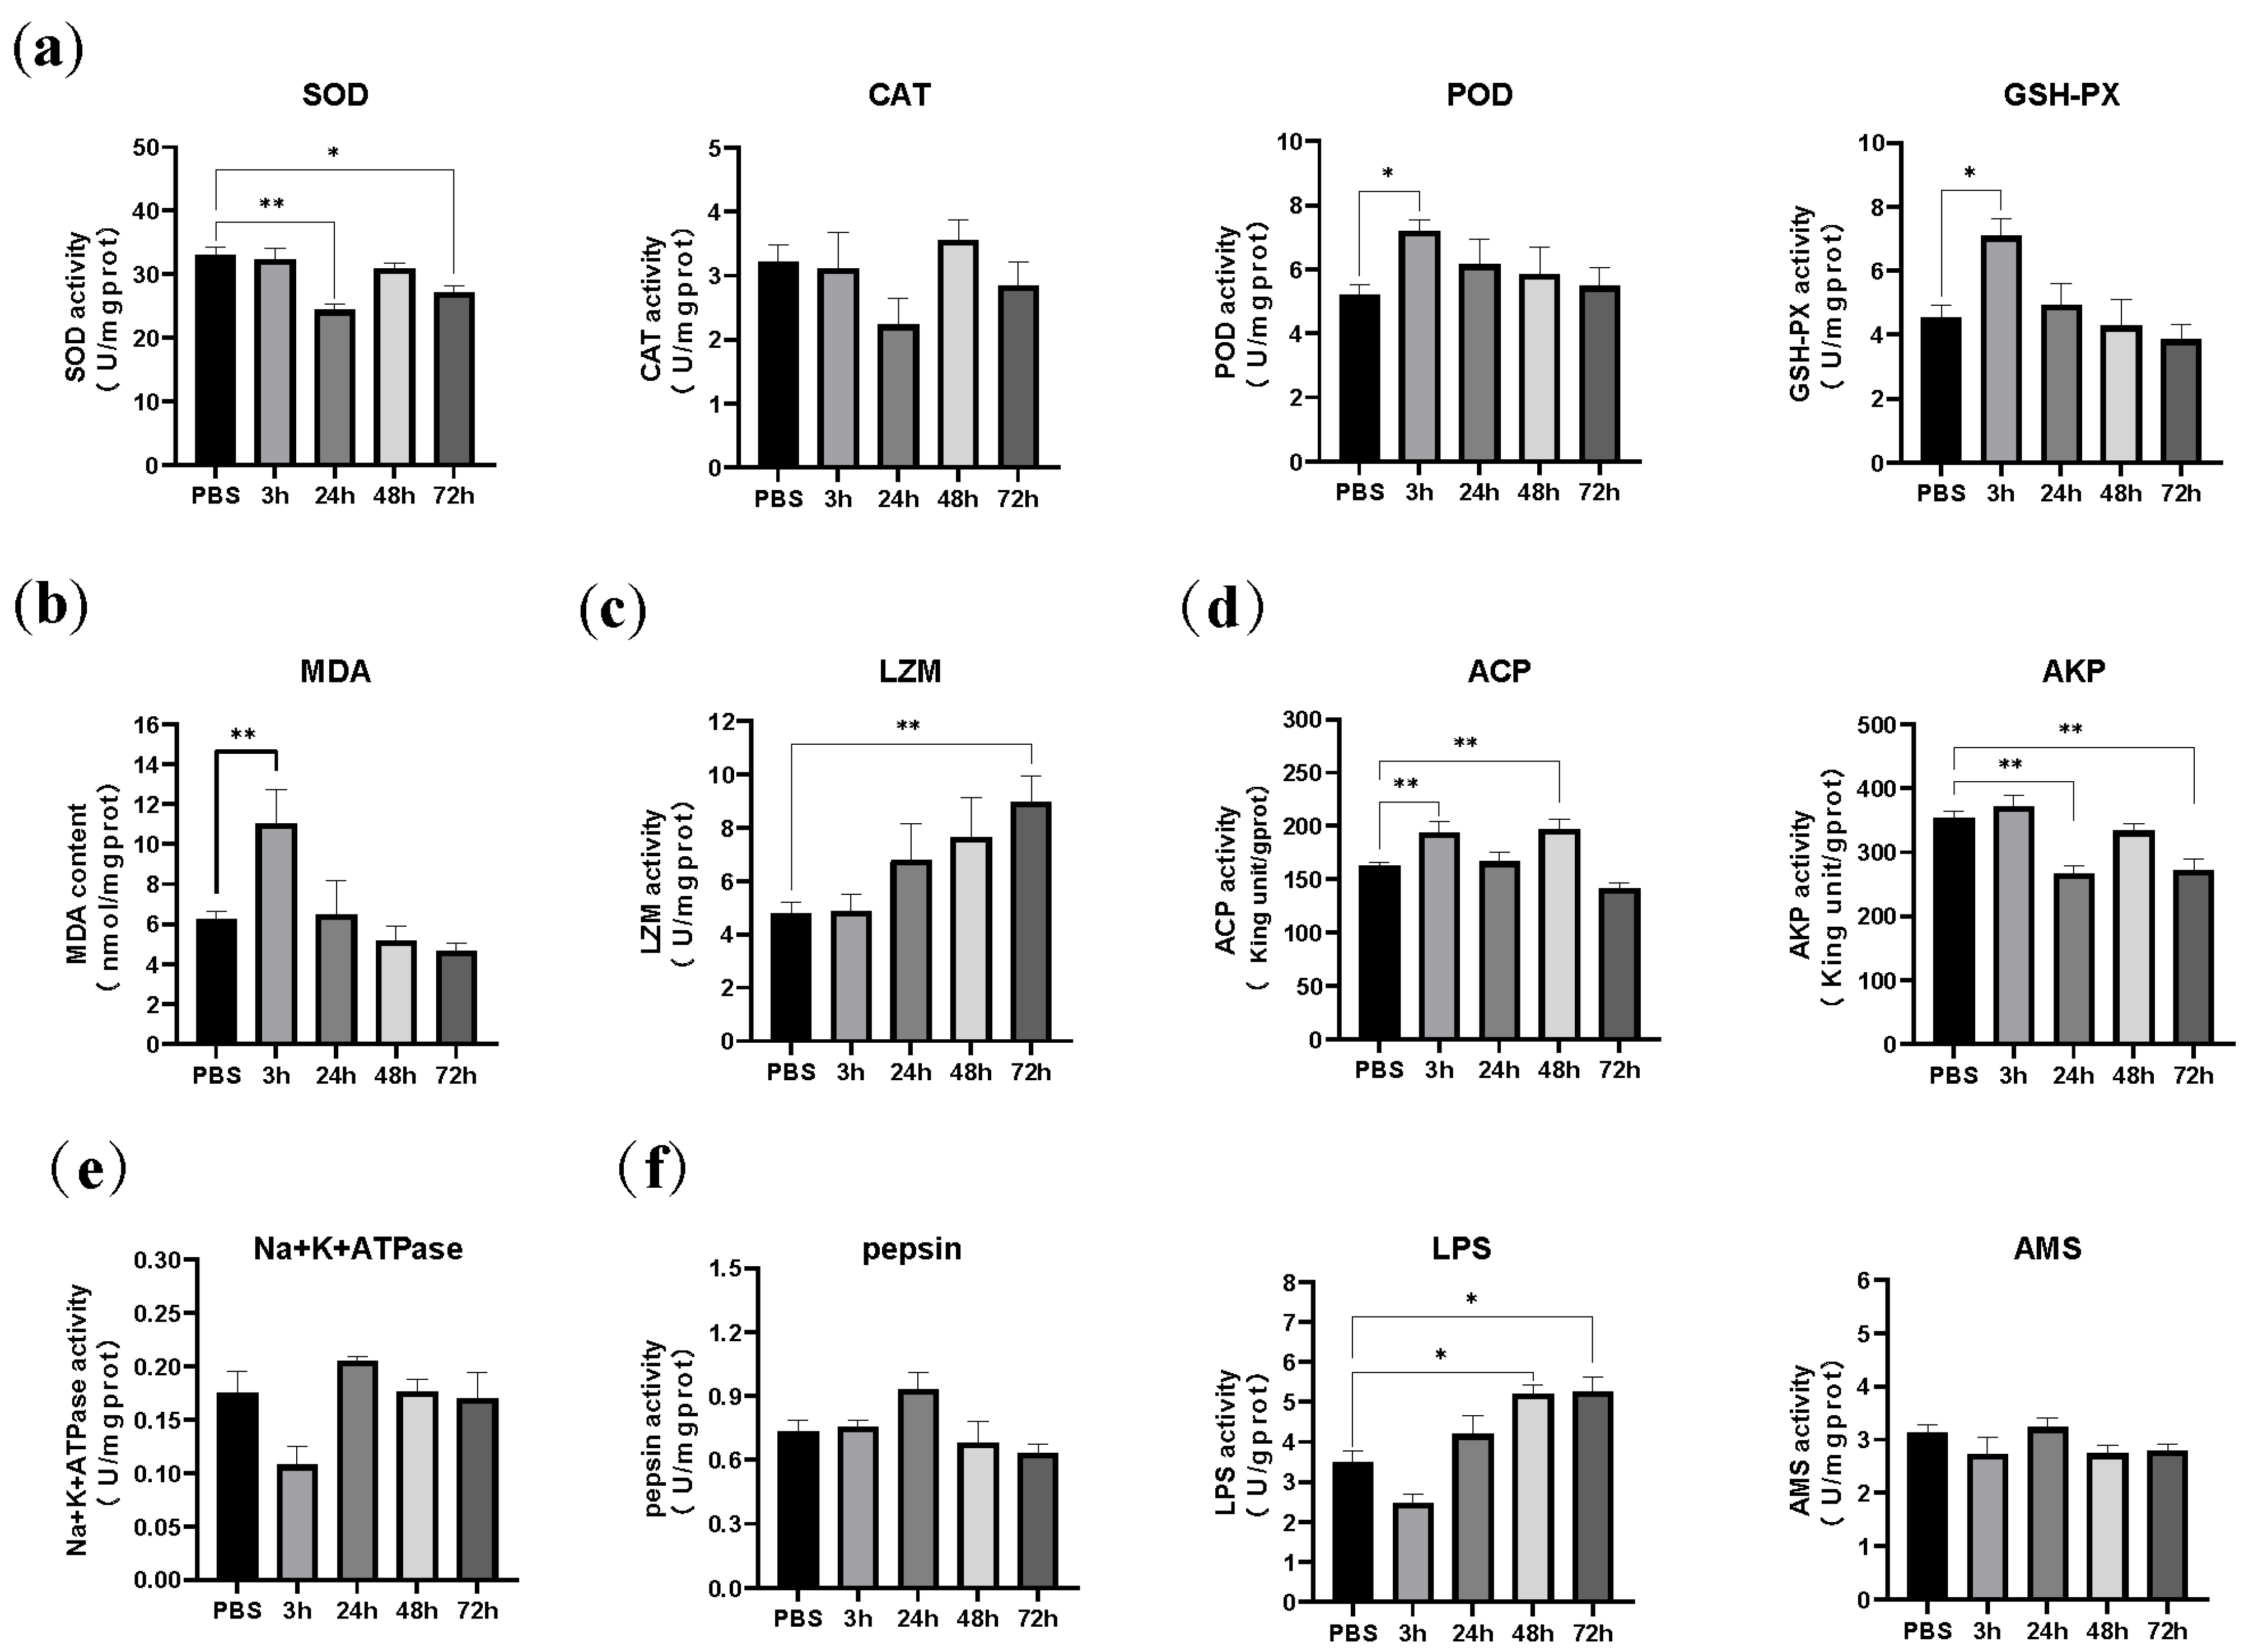
3.8. Changes in Enzyme Activity in the B. areolata Hepatopancreas

To visualize the effect of V. tubiashii infection on the snail’s antioxidant defense system, the SOD, CAT, POD, GSH-PX activities, and MDA content were tested (Figure 9a,b). The dynamics of SOD and CAT activity were quite similar as infection progressed. Both decreased initially, reaching their lowest levels at 24 h (24.340 ± 0.964 U/mgprot and 2.231 ± 0.420 U/mgprot, respectively) but returned to normal levels by 48 h and then decreased again at 72 h. At 24 h of infection, bacteria or toxic substances multiply and accumulate, resulting in a sustained release of ROS, which consumes large amounts of SOD and CAT. On the other hand, the increased cell damage might also inhibit enzyme synthesis, at which point antioxidant capacity was at its lowest.
Conversely, POD, GSH-PX, and MDA increased significantly at 3 h and gradually decreased to normal (Figure 9a,b). The enzymatic activities of POD and GSH-PX peaked at 7.200 ± 0.344 U/mgprot and 7.083 ± 0.549 U/mgprot, respectively. The results indicated that POD and GSH-PX, prior to SOD and CAT, remove ROS in the hepatopancreas of B. areolata during the V. tubishii infection. MDA content peaked (11.050 ± 1.679 U/mgprot) at 3 h, which echoes the early elevation of POD and GSH-PX, suggesting that ROS has triggered lipid oxidation in the cell membrane in the early stages of infection, and the elevation of antioxidant enzymes may be a compensatory response to this injury. Additionally, the activity of immune-defense-related enzyme LZM increased gradually with infection, reaching its highest value of 8.980 ± 0.970 U/mgprot at 72 h (Figure 9c). In the hepatopancreas, ACP increased initially, decreased by 24 h, and then increased again and subsequently recovered. The activity of ACP increased significantly at 3 h and 48 h to 193.80 ± 10.05 King unit/gprot and 197.20 ± 9.808 King unit/gprot, respectively (Figure 9d). On the contrary, AKP activity displayed a similar trend to SOD and CAT, reaching its lowest level at 24 h (266.00 ± 12.73 King unit/gprot) and 72 h (271.50 ± 17.03 King unit/gprot) (Figure 9d). The sensitive indicators of membrane function, Na+K+-ATPase, whose activity had only slightly decreased by 3 h post infection, were tested further (Figure 9e). Results showed that, in combination with previous MDA changes, lipid peroxidation could directly damage the Na+K+ATPase protein structure on the cell membrane.
Furthermore, as the hepatopancreas is a digestive gland, the activities of pepsin, lipase, and amylase were also tested on V. tubiashii infection (Figure 9f). Lipase activity decreased at 3 h but subsequently increased, possibly due to the metabolic reprogramming of energy metabolism in infection states driven by energetic demand. Unlike lipase, the activities of pepsin and amylase did not change much and were only slightly increased at 24 h, which may be because of the increased immune demand for proteins (pepsin) and carbohydrates (amylase).

3.9. Changes in Inflammatory Factors in the Hepatopancreas

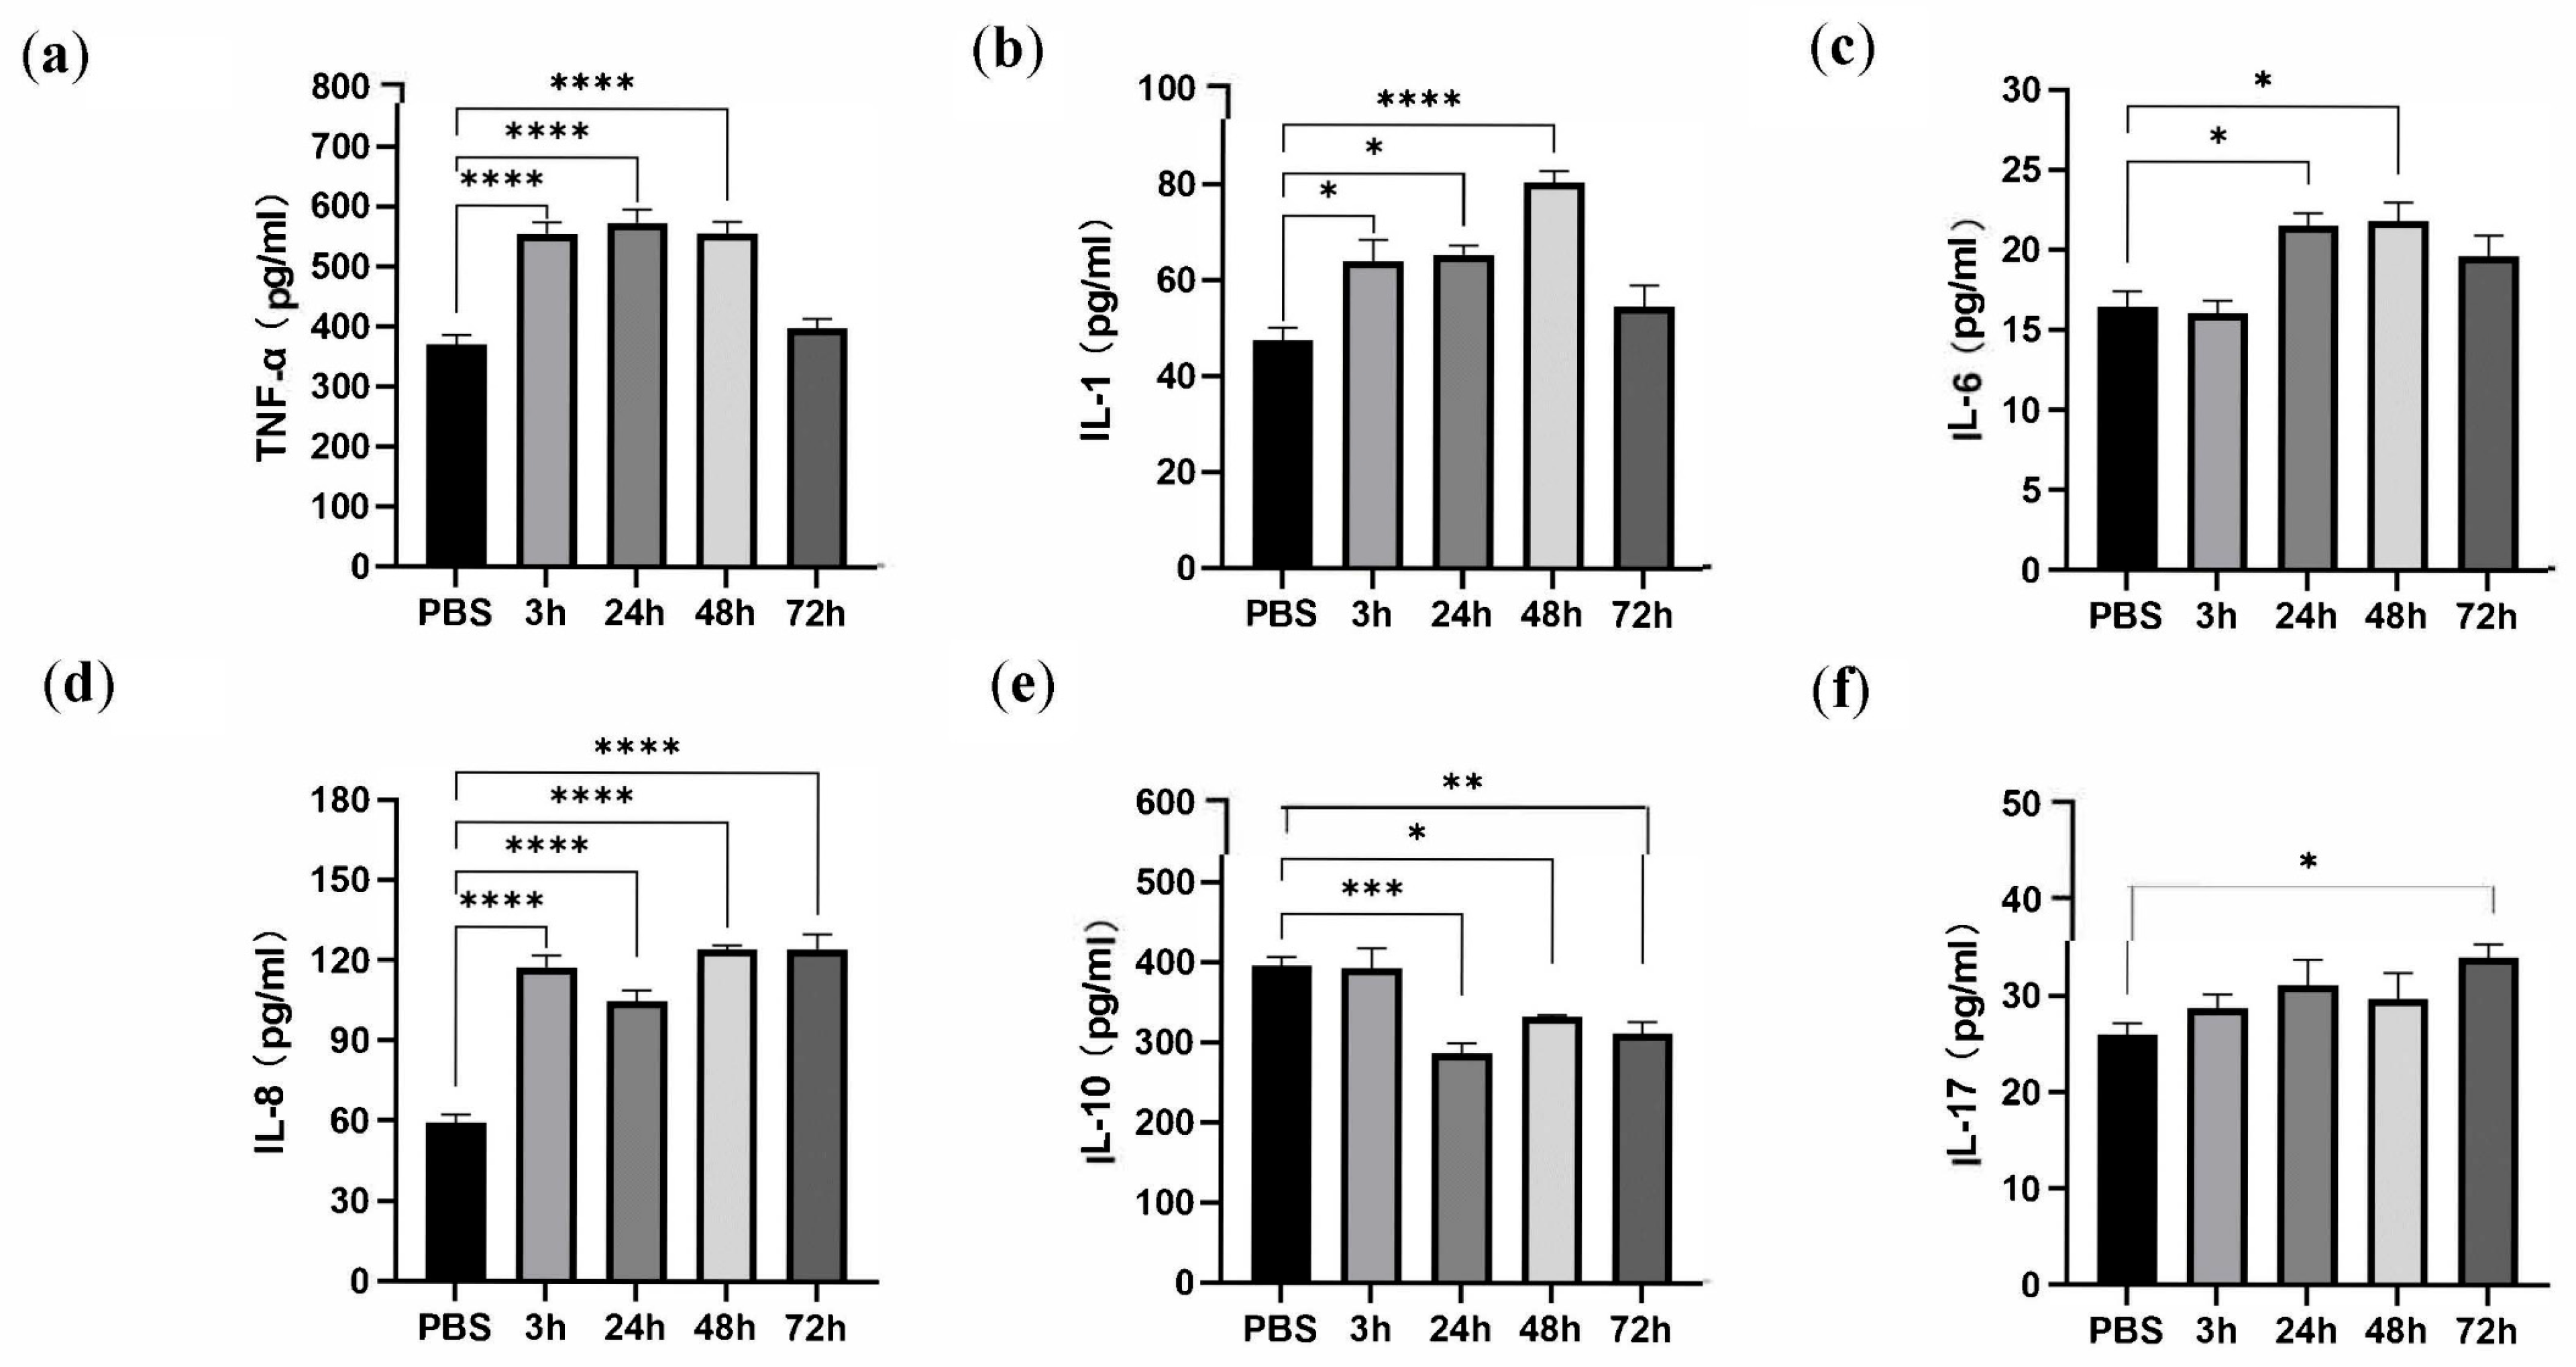
To define the variation in the inflammatory process, an ELISA was used to test the levels of different inflammation-related cytokines in the B. areolata hepatopancreas along the progression of the V. tubiashii infection (Figure 10). Similar to vertebrates, TNF-α and IL-1 were the fastest responding cytokines, increasing rapidly to a level of 555.30 ± 18.76 pg/mL and 64.06 ± 4.43 pg/mL, respectively, at 3 h (Figure 10a,b). Since the expression of IL-6 is induced by TNF-α and IL-1, its expression remained unchanged at 3 h and increased significantly to a peak of 21.53 ± 0.79 pg/mL at 24 h and 21.53 ± 0.79 pg/mL at 48 h (Figure 10a,b). With continuous stimulation through infection, TNF-α levels remained high, and IL-1 peaked a second time from 24 h to 48 h. At 72 h, TNF-α and IL-1 levels were significantly decreased, approaching normal, while IL-6 levels descended slowly, probably due to the participation of the tissue repair process (Figure 10c). Surprisingly, IL-8 continued to increase and peaked from 3 h (117.50 ± 4.32 pg/mL) to 72 h (124.40 ± 5.52 pg/mL) (Figure 10d). A persistent increase in IL-8, accompanied by a rapid decline in TNF-α and IL-1 at 72 h, could indicate a recovery phase in inflammation. On the contrary, IL-10 decreased significantly to its lowest level (approximately 286.60 ± 13.24 pg/mL) at 3 h and remained low until 72 h, while IL-17 was only elevated at 72 h, indicating it may be involved in tissue repair rather than inflammation (Figure 10e,f).

4. Discussion

Babylonia areolata, a major economic shellfish species, has an open circulatory system and a unique immune system, where the hepatopancreas acts as its digestive, metabolic, and immune organ [34]. In this study, DEGs of the B. areolata hepatopancreas transcriptome were identified during V. tubiashii stimulation. Critical time points post bacterial infection (3 h, 24 h, 48 h, and 72 h) were selected to elucidate the early, medium, and late host responses. The transcriptomic profile revealed a distinct and complex immune response strongly influenced by the progression of the V. tubiashii infection following a series of pathophysiological changes, including inflammation, cell damage, oxidative stress, and metabolic disorders.
At the early stage of V. tubiashii infection (3 h), transcriptome analysis revealed significant enrichment of NOD-like receptor signaling, apoptosis, and focal adhesion pathways, which are core modules of molluscan innate immunity. Consistent with the transcriptomic activation of immune cascades, pro-inflammatory cytokines were markedly upregulated at this time point. The synchronized elevation of inflammatory mediators and enrichment of immune signaling pathways collectively demonstrate that the host rapidly initiated acute immune and inflammatory responses upon pathogen invasion. The antioxidant system was rapidly and continuously involved. Meanwhile, the altered expression of metabolism-related pathways reflected immediate energy redistribution to support frontline defense. During the middle infection phase (24 h and 48 h), phagosome, Toll-like receptor signaling, necroptosis, and other defense pathways remained highly enriched in the transcriptome. Correspondingly, pro-inflammatory cytokines maintained high levels, indicating continuous activation of antibacterial defense and inflammatory reactions. Alongside persistent immune activation, the host suffered oxidative stress. Transcriptomic changes in peroxisome and fatty acid metabolism pathways reflect disrupted antioxidant balance. Histopathological observations further confirmed gradual aggravation of hepatopancreatic damage during this period. The decreased AKP activity, as a marker of hepatopancreatic function, was associated with ongoing tissue lesions. A sharp reduction in the total number of DEGs was observed at 72 h, indicating that large-scale transcriptional genes gradually tend to stabilize. Combined with the activities of enzymes, the cytokine pattern and the stabilized transcriptome collectively illustrate the status of adaptive regulation and incomplete tissue recovery in the late infection stage. The dynamic changes form a coherent chain from transcriptional alteration to physiological and morphological injury.
Typically, oxidative stress is the main reported response in ivory shells either to V. harveyi infection [35] or environmental stressors such as pH and ammonia [12,18]. Similar to previous research, the expression of CAT was significantly decreased with time at the transcriptome level (SOD1 only at 24 h), although V. harveyi induced an excessive production of ROS that led to the accumulation of MDA in the hepatopancreas over time [34]. The MDA, POD, and GSH-PX levels were only significantly elevated during the very early stages of infection (3 h) and returned to normal thereafter. Interestingly, even though LZM, ACP, and AKP are all involved in eliminating pathogens, they showed distinct activity patterns, including elevated activity of ACP at 3 h and 48 h and reduced activity of AKP at 24 and 72 h, while the activity of LZM continued to increase over time. This indicates that various enzymes perform correlative functions at different time points in the host’s immune response.
To our knowledge, this study is the first documentation of the levels of inflammatory cytokines in B. areolata during infection. We observed marked alterations in cytokine relative abundance and antioxidant enzyme activities at successive infection time points. At 3 h, elevated TNF-α coincided with signatures of oxidative stress. The concurrent sharp increases in POD and GSH-PX may facilitate ROS scavenging, while elevated LZM activity, together with increased IL-1 and IL-8 levels, potentially participates in antibacterial defense. The higher MDA value at this time point indicates lipid peroxidation occurred in hepatopancreatic cell membranes. At 24 h, simultaneous elevation of TNF-α and IL-6 coincided with aggravated oxidative damage and reduced SOD and CAT activity. At 48 h, inflammatory cytokines may trigger limited antioxidant compensation, where sustained damage leads to a renewed decline in enzyme activity at 72 h. The anti-inflammatory role of IL-10 has not been confirmed in shellfish. The observation of unaltered IL-10 levels may suggest suppressed IL-10 synthesis or compromised function. Mitogen-activated protein kinase (MAPK) cascades are crucial signaling pathways in the regulation of the host immune response to infection [36]. The up-regulation of map2K6 and down-regulation of mapk7 were evident at 3 h post V. vulnificus infection, which promotes an inflammatory response [37]. The same phenomenon was observed during infection of ivory shells with V. harveyi [35]. Similarly, several MAPK genes were significantly up-regulated at 3h, including map3K2, map2K6, mapk13, and mapkapk3; whereas map2K7, mapk1, and mapk15 were down-regulated. The MAPK signaling pathway also regulates response to salinity stress [38,39], one of several signaling pathways responding to osmotic stress in the Rachycentron canadum [40] and Lateolabrax maculatus [41]. Additionally, MAPK14a has been associated with oxidative damage in Ictalurus punctatus under extreme salinity stress, highlighting the role of MAPK pathways in managing both osmotic and oxidative stress [42]. In contrast to the rapid role of JNK in molluscan stress responses [43,44,45], the down-regulated genes in B. areolata were primarily annotated to the JNK subfamily (e.g., MAPK1), participating in apoptosis or in cell proliferation. These expression patterns may suggest that this signaling module may restrain excessive inflammation via negative feedback regulation. According to our current results, we hypothesized that map3K2 activation by bacterial infection leads to the phosphorylation of the downstream map2K6, and subsequent activating of mapk13, a molecule is involved in cellular stress responses (e.g., oxidative stress) and inflammation regulation. The MAP2K6-p38 MAPK might phosphorylate MAPKAPK3, which could potentially promote immune cell activation and the release of inflammatory cytokines (e.g., IL-1, TNF-α) to boost antimicrobial immunity stress responses. This proposed phosphorylation cascade is merely deduced from transcript profiles and requires further experimental validation.
In mammals, exposure to stress activates MAPK to regulate critical processes such as glycolysis, fatty acid oxidation, and energy metabolism, thereby maintaining cellular energy homeostasis [46]. Notably, the genes involved in carbon metabolism, lipid metabolism, and amino acid metabolism were widely down-regulated in B. areolata after infection. The activity of AMPK, depending on the down-regulation of prkag2 and prkaa2, was restricted. Besides the down-regulation of slc27a6 and fabp3, genes related to gluconeogenesis (fbp, pepck, and creb), transportation (slc2a1/3/5), and regulation of glycolysis (pfk-2) exhibited altered expression patterns, which may suggest suppressed gluconeogenesis and remodeled glycolytic flux. We speculate that these expression shifts may facilitate transport of glucose from hepatopancreatic cells toward immune effector cells, though this metabolic redistribution needs further verification. Meanwhile, down-regulation of eef2k and lkb1 may relieve translational inhibition and weaken anabolic restriction, together accelerating the production of cytokines. These genes were down-regulated at 3 h and 24 h, indicating that the hepatopancreas selectively down-regulated basal metabolism genes that could be temporarily paused during the early immune response. Likewise, genes critical to energy supply and defense, such as acnat2 and grhpr, were preferentially up-regulated in the early response. The liver is the primary organ for peroxisome fatty acid oxidation, where acyl-CoA N-Acyltransferase 2 (ACNAT2) is mainly involved in the amination reaction in peroxisomal lipid metabolism and plays a specific role in cellular lipid homeostasis [47]. Glyoxylate reductase/hydroxypyruvate reductase (GRHPR) is a key enzyme involved in glycolysis, glyoxylic acid metabolism, and detoxification [48]. Here, GLUT1 is encoded by slc2a1, a widely expressed glucose transporter, whose function is to mediate extracellular glucose transmembrane entry into cells, especially in the presence of high metabolic demand or stress [49]. In addition, OGT is a key enzyme that mediates the modification of protein O-linked β-N-acetylglucosamine, resulting in the modification of proteins such as inflammatory cytokines [50], HSP70 [51], and caspase-3 [52,53]. At 48 h, increased slc2a1 (GLUT1) and ogt (O-GlcNAc transferase) were observed. These expression changes tentatively point to a potential coordinated host strategy to enhance nutrient uptake, rearrange metabolic distribution, and modulate immune signaling during the mid-phase of infection.
Autophagy is a conserved process that degrades damaged components (such as abnormal proteins, senescent organelles) or pathogens [54,55]. As part of the innate immune system, it is rapidly activated upon pathogen invasion in aquatic species [54]. In Crassostrea hongkongensis [56] and Crassostrea gigas [57], autophagy serves as a crucial innate immune response against Vibrio infection. Interestingly, although most related genes were generally down-regulated until 48 h, tbk1, snap29, and rps27a were specifically up-regulated at 3 h. Specifically, TANK binding kinase 1 (TBK1) is a key activator of selective autophagy (xenophagy), recognizing and targeting specific pathogens [58], whereas synaptosome-associated protein 29 (snap 29) can directly promote autophagosome–lysosome membrane fusion and the efficient degradation of bacteria [59,60]. Ribosome protein S27A is reported to mediate bacterial modification via ubiquitination to facilitate TBK1 targeting. Autophagy lysosomes contain more than 50 hydrolytic enzymes, such as proteases, lipases, and nucleases, that are critical for autophagic degradation [61]. They can digest and decompose foreign substances, senescent or damaged organelles, and misfolded proteins in cells, to maintain the stability of the intracellular environment. The lysosome pathway was identified as a significantly enriched key pathway in response to acute ammonia toxicity [13] and V. harveyi infection [35]. Similarly, in the current study, the lysosome pathway was one of the most significantly enriched pathways from 3 h to 48 h, only reverting to normal levels at 72 h. Additionally, related genes such as clathrin (CLTA/B) for endocytosis, lysosomal proteases (cathepsins), and other acid hydrolases were widely down-regulated. However, psap (encodes prosaposin) and npc2 (Niemann–Pick disease type C) were dramatically up-regulated at 24 h and 48 h, respectively. Saposins assist with the degradation of pathogen lipids, while NPC2 is a key molecule in lysosomal cholesterol efflux, which prevents lipid overload toxicity in lysosomes [62]. Although these two genes target different lipid metabolism pathways (PSAP mediates sphingolipid degradation and NPC2 regulates cholesterol transport), up-regulation of their expression reflects the synergistic strategy of the host to enhance defense by remodeling the lysosomal lipid metabolism network [63]. This synergistic effect potentially reveals the critical role of lysosomes as lipid-immune hubs. Moreover, ctsl (encodes cathepsin L) was uniquely up-regulated at 72 h, possibly participating in the removal and reconstruction of damaged tissue as well as the regulation of inflammation regression. This may indicate that lysosomes, which are involved in stress response, endocytosis regulation, and protein and lipid degradation, act as functional effectors in the ivory shell’s response to V. tubiashii infection.
Inhibitors of apoptosis proteins (IAPs) are a family of homologous proteins with anti-apoptotic functions [64,65]. Members of the human IAP family include BIRC1-8, although the X-linked inhibitor of apoptosis protein (XIAP, BIRC4) is the most potent endogenous member of the family [66]. Drosophila inhibitor of apoptosis protein (DIAP) is homologous to XIAP in vertebrates and is mainly found in invertebrates such as drosophila [67]. Specifically, XIAP exerts its anti-apoptotic effects by directly binding to caspases (caspase-3, -7, and -9) and/or activating the nuclear factor kappa B (NF-κB) pathway, which promotes the release of cytokines (IL-1β and TNF-α) and enhances innate immunity [68]. Transcription factor AP-1 (JUN) and caspase 3 peaked at 3 h and were accompanied by the reduction of bcl-2, birc 2/3/7, and diap2 until 24 h or 48 h. A short increase of xiap and diap2 was observed at 3 h, followed by the continuous reduction of IAPs, substrates (PARP and Fodrin), and caspase 3/8 at 24 h and 48 h. This suggests that apoptosis was activated after V. tubishii infection, even with a compensatory increase of xiap during early infection that failed to prevent apoptotic initiation. The co-decline of APIs and caspases in the later stage of infection may indicate the end of the apoptotic process rather than the sustained inhibition of apoptosis.
Heat shock proteins (HSPs) are known to increase under different stressful conditions such as cold, osmotic, and oxidative stress, hypoxia, exposure to toxic substances, or infections [69,70]. As molecular chaperones, they protect proteins from denaturation and assist in the refolding or degradation of aberrant proteins, which are proposed to act as danger signals and immune-regulatory molecules [71]. Here, HSP70 and HSP90 are the most widely identified in mollusks under different stresses. Heat shock protein A5, also known as endoplasmic reticulum chaperone BiP (HSPA5), is a member of the heat shock protein 70 (HSP70) family and a core regulator of the endoplasmic reticulum stress response [72]. Protein disulfide isomerase A4 (Pdia4) is a member of the protein disulfide isomerase (PDI) family, also located in the endoplasmic reticulum (ER), and is involved in protein folding and regulation of redox homeostasis. The notable increase of hspa5 and pdia4 in early infection (3 h and/or 24 h) may enhance effective synthesis and secretion of immune-related proteins, prolong cell survival by inhibiting apoptotic signals, and promote the release of inflammatory cytokines through pathogen recognition. On the other hand, Hsp90 can be constitutive or inducible and is involved in protein maturation and degradation, signal transduction, and proteostasis under different stress conditions [73]. An increase in hsp90a.1 was identified during early V. tubiashii infection in B. areolata, and together with the upregulation of E3 ubiquitin ligase. It is proposed that HSP90A.1 may target misfolded proteins and promote their degradation by collaborating with molecules of the ubiquitin-proteasome system or the autophagy pathway. Besides, genes related to the cytoskeleton, such as actin, were generally up-regulated during pathogen infection, suggesting that the cytoskeleton plays an essential role in the innate immunity of the ivory snail. In contrast, genes related to the cytochrome P450 (CYP450) family were generally down-regulated, indicating the total dysregulation of liver detoxification and metabolic functions (e.g., fatty acids, cholesterol).
Finally, the variation of inflammatory cytokines in B. areolata at the protein level was elucidated. Notably, expression of TNF-α, IL-1, and IL-8 was instantaneously induced by V. tubiashii infection (3 h), while IL-6 was induced afterward (24 h). Except for IL-8, TNF-α, IL-1, and IL-6 were increasingly expressed during the middle stage of infection (24 h and 48 h), indicating their function in the initiation and activation of inflammation. Mammalian IL-17 plays a pro-inflammatory role in the adaptive immune system and regulates innate immunity, increasing the expression of chemokines and anti-microbial molecules [74]. Molluscan IL-17 was reported to regulate the expression and release of humoral factors in Biomphalaria glabrata [75], Crassostrea gigas [76], Mytilus coruscus [77], and Sepiella japonica [78]. Importantly, IL-17 was elevated only at 72 h in B. areolata, which may imply its inhibition of an excessive immune response, regulation of immune balance, and role in the repair of inflammatory damage. It should be noted that the shellfish ELISA kits were only verified via pre-experimental functional tests rather than full antibody specificity identification, so the inference remains tentative.

5. Conclusions

This study describes the correlative changes of histopathology, transcriptome, enzyme activity, and cytokines in B. areolata infected with V. tubiashii. Critical time points after bacterial infection (3 h, 24 h, 48 h, and 72 h) were selected to show early, medium, and late biological host responses. Infection of V. tubiashii triggered host responses: acute immune activation and oxidative stress occurred at the early stage; persistent immune activity and progressive tissue damage were observed in the middle stage; the late stage presented stabilized transcription, inflammatory imbalance, and residual oxidative injury. A large set of DEGs and enriched immune pathways were identified. Multiple key functional genes from the birc and hsp families may participate in B. areolata immune response. The key genes and pathways obtained in this study are recommended as candidate molecules for future functional validation and mechanistic investigation. Enzymatic activity and inflammatory cytokines were induced during early infection, which may accelerate the initiation of host immune defense at the molecular level. However, whether such a molecular response improves disease outcome and survival needs further experimental verification. Nevertheless, these results provide important insight into the anti-bacterial responses of shellfish and the network of immune-related signaling pathways during bacterial infection. This provides preliminary clues for the molecular basis of immune mechanisms during B. areolata infection.
It is also important to acknowledge several experimental limitations of the present study. Sample pooling obscures individual variation, and our artificial infection system and detection tools cannot fully mimic natural infection scenarios. The commercial ELISA kits have only undergone partial cross-species validation for B. areolata, and full species-specific verification is still lacking. Histopathological evaluation was limited to qualitative observation. Despite these restrictions, the integrated multi-index results effectively illustrate the staged immune and metabolic responses of B. areolata to bacterial infection. Follow-up work will be improved.

Author Contributions

Conceptualization, C.D.; methodology, C.D., D.L., S.Y., Z.F. and H.M.; software, S.Y. and Z.F.; validation, C.D.; formal analysis, C.D. and Q.L.; investigation, D.L., J.C., G.X. and Y.F.; resources, Y.F. and H.M.; data curation, C.D. and Q.L.; writing—original draft preparation, C.D.; writing—review and editing, C.D., Z.T. and M.S.; visualization, C.D. and Z.T.; supervision, M.S.; project administration, Z.T. and M.S.; funding acquisition, M.S. All authors have read and agreed to the published version of the manuscript.

Funding

This research was funded by the Innovational Fund for Scientific and Technological Personnel of Hainan Province, grant number KJRC2023C35; Hainan Province Science and Technology Special Fund, grant number ZDYF2025XDNY123 and ZDYF2022XDNY351; and Hainan Seed Industry Laboratory, grant number B25H10CA1 and B25Z10002P.

Institutional Review Board Statement

All research was conducted in accordance with the protocols of the Ethics Committee of the Hainan Academy of Ocean and Fisheries Sciences and was approved by the Laboratory Animal Ethics Committee of Hainan Academy of Ocean and Fisheries Sciences (EAEC-HAOFS-No. 2025002, 10 October 2025).

Data Availability Statement

The raw sequencing data generated in this study have been deposited in the NCBI BioProject database under accession number PRJNA1468929 and are publicly available via the NCBI Sequence Read Archive (SRA).

Acknowledgments

The authors have reviewed and processed all experimental and analytical data and take full responsibility for the content of this publication.

Conflicts of Interest

The authors declare no conflicts of interest.

Abbreviations

The following abbreviations are used in this manuscript:
DEGsdifferentially expressed genes
β-actinbeta-actin
SODsuperoxide dismutase
CATcatalase
ACPacid phosphatase
AKPalkaline phosphatase
LZMlysozyme
PODperoxidase
GSH-PXglutathione peroxidase
LPSlipase
AMSamylase
MDAmalondialdehyde
IL-1interleukin 1
TNF-αtumor necrosis factor alpha
WGCNAweighted gene co-expression network analysis
PPIprotein–protein interaction

References

  1. Liu, X.J.; Wang, R.X.; Ling, H.; Yao, T.; Wang, J.Y. Studies on the pathogenic bacteria and their virulence factors of “acute death syndrome” in Babylonia areolata. Mar. Environ. Res. 2019, 38, 7–15. [Google Scholar] [CrossRef]
  2. Dai, C.; Li, X.; Luo, D.; Liu, Q.; Sun, Y.; Tu, Z.; Shen, M. First report on genome analysis and pathogenicity of Vibrio tubiashii FP17 from farmed ivory shell (Babylonia areolata). Fishes 2022, 7, 396. [Google Scholar] [CrossRef] [Scilit]
  3. Fu, J.; Liang, Y.; Shen, M.; Lu, W.; Luo, X.; You, W.; Ke, C. Survival and immune responses of two populations of Babylonia areolata and their hybrids under pathogenic Vibrio challenge. Aquaculture 2022, 584, 740646. [Google Scholar] [CrossRef] [Scilit]
  4. Zhao, W.; Wu, K.; Wang, J.; Ling, H.; Yang, L.; Cen, X.; Ye, L. Pathogen and treatment of “Reverese back syndrome”of whelk Babylonia areolata. Fish. Sci. 2016, 35, 552–556. [Google Scholar] [CrossRef]
  5. Wang, J.; Wang, R.; Su, Y.; Wu, K.; Guo, Z.; Jiang, J.; Liu, G.; Zhao, W. Pathogen and pathology of "acute death syndrome" of Babylonia areolata. South China Fish. Sci. 2013, 9, 93–99. [Google Scholar] [CrossRef]
  6. Li, S.F.; Qiu, D.Q.; Zhang, J.D.; Yang, S.P.; Jia, C.H.; Qiu, M.S. Study of microflora of pathogenic and conditional pathogenic bacteria in Babylonia areolata attacked by shell-flesh separating disease and proboscis edema-disease. Adv. Mar. Sci. 2013, 31, 266–272. [Google Scholar] [CrossRef]
  7. Di, G.L.; Zhang, Z.X.; Kong, X.H.; Yu, J.J.; Chen, H.Y.; Ke, C.H. Pathogen and pathology of shell and flesh separating disease in ivory shell, Babylonia areolata. Fish. Sci. 2017, 36, 411–420. [Google Scholar] [CrossRef]
  8. Prado, S.; Dubert, J.; Barja, L. Characterization of pathogenic vibrios isolated from bivalve hatcheries in Galicia, NW Atlantic coast of Spain. Description of Vibrio tubiashii subsp. europaensis subsp. nov. Syst. Appl. Microbiol. 2015, 38, 26–29. [Google Scholar] [CrossRef] [Scilit] [PubMed]
  9. Wang, R.; Liu, X.; Wang, J.; Hui, Z.; Lin, X.; Sun, J.; Mou, H.; Zhang, T.; Ma, X. Proteomic differences between Vibrio tubiashii strains with high- or low-virulence levels isolated from diseased ivory snail Babylonia areolata. Aquac. Int. 2022, 30, 2579–2591. [Google Scholar] [CrossRef] [Scilit]
  10. Di, G.L.; Zhang, Z.X.; Ke, C.H.; Guo, J.R.; Xue, M.; Ni, J.B.; Wang, D.X. Morphological characterization of the haemocytes of the ivory snail, Babylonia areolata (Neogastropoda: Buccinidae). J. Mar. Biol. Assoc. UK 2011, 91, 1489–1497. [Google Scholar] [CrossRef] [Scilit]
  11. Di, G.; Zhang, Z.; Ke, C. Phagocytosis and respiratory burst activity of haemocytes from the ivory snail, Babylonia areolata. Fish Shellfish Immunol. 2013, 35, 366–374. [Google Scholar] [CrossRef] [Scilit] [PubMed]
  12. Zhou, J.; Liu, C.; Yang, Y.; Yang, Y.; Gu, Z.; Wang, A.; Liu, C. Effects of long-term exposure to ammonia on growth performance, immune response, and body biochemical composition of juvenile ivory shell, Babylonia areolata. Aquaculture 2023, 562, 738857. [Google Scholar] [CrossRef] [Scilit]
  13. Hong, X.; Qin, J.; Fu, D.; Yang, Y.; Wang, A.; Gu, Z.; Yu, F.; Liu, C. Transcriptomic analysis revealed the dynamic response mechanism to acute ammonia exposure in the ivory shell, Babylonia areolata. Fish Shellfish Immunol. 2023, 143, 109198. [Google Scholar] [CrossRef] [Scilit] [PubMed]
  14. Li, T.; Zheng, P.; Zhang, X.; Zhang, Z.; Li, J.; Li, J.; Xu, J.; Wang, D.; Xian, J.; Guo, H.; et al. Effects of dietary astaxanthin on growth performance, muscle composition, non-specific immunity, gene expression, and ammonia resistance of juvenile ivory shell (Babylonia areolata). Fish Shellfish Immunol. 2024, 145, 109363. [Google Scholar] [CrossRef] [Scilit] [PubMed]
  15. Sun, Y.; Du, X.; Yang, Y.; Wang, A.; Gu, Z.; Liu, C. Dietary Taurine Intake Affects the Growth Performance, Lipid Composition, and Antioxidant Defense of Juvenile Ivory Shell (Babylonia areolata). Animals 2023, 13, 2592. [Google Scholar] [CrossRef] [Scilit] [PubMed]
  16. Shang, C.; Shi, H.; Cai, Y.; Zhou, Y.; Jin, G.; Wang, S. Effects of prebiotics on growth and immune antioxidant of Babylonia areolata. Nat. Sci. Hainan Univ. 2022, 40, 344–353. [Google Scholar] [CrossRef]
  17. Zhao, W.; Tan, C.; Zhang, Y.; Wu, K.; Wen, W.; Chen, X.; Yu, G. Effect of salinity stress on the activities of actions and digestive enzymes of Babylonia areolata. Fish. Mod. 2019, 46, 41–45. [Google Scholar] [CrossRef]
  18. Ding, R.; Yang, R.; Fu, Z.; Zhao, W.; Li, M.; Yu, G.; Ma, Z.; Bai, Z. Response of antioxidation and immunity to combined influences of pH and ammonia nitrogen in the spotted babylon (Babylonia areolata). Heliyon 2024, 10, e29205. [Google Scholar] [CrossRef] [Scilit] [PubMed]
  19. Ding, R.; Yang, R.; Fu, Z.; Zhao, W.; Li, M.; Yu, G.; Ma, Z.; Zong, H. Changes in pH and nitrite nitrogen induces an imbalance in the oxidative defenses of the spotted babylon (Babylonia areolata). Antioxidants 2023, 12, 1659. [Google Scholar] [CrossRef] [Scilit] [PubMed]
  20. Zhao, W.; Yang, R.; Wu, K.; Yu, G.; Chen, M.; Zheng, Z.; Wen, W. Effects of “reverse back syndrome” on main digestive enzymes and immune-related enzymes in Babylonia areolata. J. Fish. China 2020, 44, 1502–1512. [Google Scholar] [CrossRef]
  21. Zhang, J.; Wang, J.; Gu, Z.; Liu, X. Transcriptome analysis of different aquaculture substrates on the immune response of Babylonia areolata. Mar. Biotechnol. 2024, 26, 609–622. [Google Scholar] [CrossRef] [Scilit] [PubMed]
  22. Wang, J.; Liu, F.; Xu, Y.; Huang, B.; Wang, Z. SNP site biological analysis of Babylonia areolata based on RNA-seq technology. J. Guandong Ocean Univ. 2021, 41, 111–118. [Google Scholar] [CrossRef]
  23. Yin, X.; Zhuang, X.; Liao, M.; Huang, L.; Cui, Q.; Liu, C.; Dong, W.; Wang, F.; Liu, Y.; Wang, W. Transcriptome analysis of Pacific white shrimp (Litopenaeus vannamei) hepatopancreas challenged by Vibrio alginolyticus reveals lipid metabolic disturbance. Fish Shellfish Immunol. 2022, 123, 238–247. [Google Scholar] [CrossRef] [Scilit] [PubMed]
  24. Qin, Z.; Babu, V.S.; Wan, Q.; Zhou, M.; Liang, R.; Muhammad, A.; Zhao, L.; Li, J.; Lan, J.; Lin, L. Transcriptome analysis of Pacific white shrimp (Litopenaeus vannamei) challenged by Vibrio parahaemolyticus reveals unique immune-related genes. Fish Shellfish Immunol. 2018, 77, 164–174. [Google Scholar] [CrossRef] [Scilit] [PubMed]
  25. Saco, A.; Rey-Campos, M.; Novoa, B.; Figueras, A. Transcriptomic response of mussel gills after a Vibrio splendidus infection demonstrates their role in the immune response. Front. Immunol. 2020, 11, 615580. [Google Scholar] [CrossRef] [Scilit] [PubMed]
  26. Wang, M.; Liu, M.; Wang, B.; Jiang, K.; Jia, Z.; Wang, L.; Wang, L. Transcriptomic analysis of exosomal shuttle mRNA in Pacific oyster Crassostrea gigas during bacterial stimulation. Fish Shellfish Immunol. 2018, 74, 540–550. [Google Scholar] [CrossRef] [Scilit] [PubMed]
  27. Dai, C.; Luo, D.; Liu, Q.; Cui, J.; Mi, H.; Zhang, Z.; Tu, Z.; Shen, M. Transcriptome analysis of multiple tissues in the Babylonia areolata reveals the distinct response to Vibrio tubiashii infection. Aquac. Rep. 2025, 43, 102974. [Google Scholar] [CrossRef] [Scilit]
  28. Chen, S.; Zhou, Y.; Chen, Y.; Gu, J. fastp: An ultra-fast all-in-one FASTQ preprocessor. Bioinformatics 2018, 34, i884–i890. [Google Scholar] [CrossRef] [Scilit] [PubMed]
  29. Zou, Y.; Fu, J.; Liang, Y.; Luo, X.; Shen, M.; Huang, M.; Chen, Y.; You, W.; Ke, C. Chromosome-level genome assembly of the ivory shell Babylonia areolata. Sci. Data 2024, 11, 1201. [Google Scholar] [CrossRef] [Scilit] [PubMed]
  30. Love, M.I.; Huber, W.; Anders, S. Moderated estimation of fold change and dispersion for RNA-seq data with DESeq2. Genome Biol. 2014, 15, 550. [Google Scholar] [CrossRef] [Scilit] [PubMed]
  31. Ernst, J.; Bar-Joseph, Z. STEM: A tool for the analysis of short time series gene expression data. BMC Bioinform. 2006, 7, 191. [Google Scholar] [CrossRef] [Scilit] [PubMed]
  32. Szklarczyk, D.; Franceschini, A.; Wyder, S.; Forslund, K.; Heller, D.; Huerta-Cepas, J.; Simonovic, M.; Roth, A.; Santos, A.; Tsafou, K.P.; et al. STRING v10: Protein-protein interaction networks, integrated over the tree of life. Nucleic Acids Res. 2015, 43, D447–D452. [Google Scholar] [CrossRef] [Scilit] [PubMed]
  33. Langfelder, P.; Horvath, S. WGCNA: An R package for weighted correlation network analysis. BMC Bioinform. 2008, 9, 559. [Google Scholar] [CrossRef] [Scilit] [PubMed]
  34. Pei, S.J. Effects of Extracts from Three Chinese Herbal Medicines on Groth, Immunityand Anti-Stress Ability of Babylonia areolata. Master’s Thesis, Huazhong Agricultural University, Wuhan, China, 2023. [Google Scholar] [CrossRef]
  35. Yu, J.; Lü, W.; Zhang, L.; Chen, X.; Xu, R.; Jiang, Q.; Zhu, X. Effects of Vibrio harveyi infection on the biochemistry, histology and transcriptome in the hepatopancreas of ivory shell (Babylonia areolata). Fish Shellfish Immunol. 2024, 153, 109856. [Google Scholar] [CrossRef] [Scilit] [PubMed]
  36. Kirk, S.G.; Samavati, L.; Liu, Y. MAP kinase phosphatase-1, a gatekeeper of the acute innate immune response. Life Sci. 2020, 241, 117157. [Google Scholar] [CrossRef] [Scilit] [PubMed]
  37. Hernández-Cabanyero, C.; Sanjuán, E.; Mercado, L.; Amaro, C. Evidence that fish death after Vibrio vulnificus infection is due to an acute inflammatory response triggered by a toxin of the MARTX family. Fish Shellfish Immunol. 2023, 142, 109131. [Google Scholar] [CrossRef] [Scilit] [PubMed]
  38. Luo, Z.; Huang, W.; Wang, G.; Sun, H.; Chen, X.; Luo, P.; Liu, J.; Hu, C.; Li, H.; Shu, H. Identification and characterization of p38MAPK in response to acute cold stress in the gill of Pacific white shrimp (Litopenaeus vannamei). Aquac. Rep. 2020, 17, 100365. [Google Scholar] [CrossRef] [Scilit]
  39. Zheng, W.; Xu, X.; E, Z.; Liu, Y.; Chen, S. Genome-wide identification of the MAPK gene family in turbot and its involvement in abiotic and biotic stress responses. Front. Mar. Sci. 2022, 9, 1005401. [Google Scholar] [CrossRef] [Scilit]
  40. Yang, Y.; Ma, Q.; Jin, S.; Huang, B.; Wang, Z.; Chen, G. Identification of mapk genes, and their expression profiles in response to low salinity stress, in cobia (Rachycentron canadum). Comp. Biochem. Physiol. B Biochem. Mol. Biol. 2024, 271, 110950. [Google Scholar] [CrossRef] [Scilit] [PubMed]
  41. Tian, Y.; Wen, H.; Qi, X.; Zhang, X.; Li, Y. Identification of mapk gene family in Lateolabrax maculatus and their expression profiles in response to hypoxia and salinity challenges. Gene 2019, 684, 20–29. [Google Scholar] [CrossRef] [Scilit] [PubMed]
  42. Duan, Y.; Zhang, W.; Chen, X.; Wang, M.; Zhong, L.; Liu, J.; Bian, W.; Zhang, S. Genome-wide identification and expression analysis of mitogen-activated protein kinase (MAPK) genes in response to salinity stress in channel catfish (Ictalurus punctatus). J. Fish. Biol. 2022, 101, 972–984. [Google Scholar] [CrossRef] [Scilit] [PubMed]
  43. Tao, S.; Li, X.; Wang, J.; Bai, Y.; Wang, J.; Yang, Y.; Zhao, Z. Examination of the relationship of carbonate alkalinity stress and ammonia metabolism disorder-mediated apoptosis in the Chinese mitten crab, Eriocheir sinensis: Potential involvement of the ROS/MAPK signaling pathway. Aquaculture 2024, 579, 740179. [Google Scholar] [CrossRef] [Scilit]
  44. Gao, G.; Liang, G.; Wei, H.; Li, X.; Chen, Y.; Wang, H.; Wang, C.; Mu, C.; Liu, S. Involvement of the JNK signaling pathway in regulating yolk accumulation in the swimming crab, Portunus trituberculatus. Aquaculture 2022, 551, 737890. [Google Scholar] [CrossRef] [Scilit]
  45. Liu, Z.; Huang, X.; Yang, Z.; Peng, C.; Yu, H.; Cui, C.; Hu, Y.; Wang, X.; Xing, Q.; Hu, J.; et al. Identification, characterization, and expression analysis reveal diverse regulated roles of three MAPK genes in Chlamys farreri under heat stress. Front. Physiol. 2021, 12, 688626. [Google Scholar] [CrossRef] [Scilit] [PubMed]
  46. Sarg, N.H.; Zaher, D.M.; Abu Jayab, N.N.; Mostafa, S.H.; Ismail, H.H.; Omar, H.A. The interplay of p38 MAPK signaling and mitochondrial metabolism, a dynamic target in cancer and pathological contexts. Biochem. Pharmacol. 2024, 225, 116307. [Google Scholar] [CrossRef] [Scilit] [PubMed]
  47. Hunt, M.C.; Tillander, V.; Alexson, S.E.H. Regulation of peroxisomal lipid metabolism: The role of acyl-CoA and coenzyme A metabolizing enzymes. Biochimie 2014, 98, 45–55. [Google Scholar] [CrossRef] [Scilit] [PubMed]
  48. Lassalle, L.; Engilberge, S.; Madern, D.; Vauclare, P.; Franzetti, B.; Girard, E. New insights into the mechanism of substrates trafficking in Glyoxylate/Hydroxypyruvate reductases. Sci. Rep. 2016, 6, 20629. [Google Scholar] [CrossRef] [Scilit] [PubMed]
  49. Song, W.; Li, D.; Tao, L.; Luo, Q.; Chen, L. Solute carrier transporters: The metabolic gatekeepers of immune cells. Acta Pharm. Sin. B 2020, 10, 61–78. [Google Scholar] [CrossRef] [Scilit] [PubMed]
  50. Qiang, A.; Slawson, C.; Fields, P.E. The role of O-GlcNAcylation in immune cell activation. Front. Endocrinol. 2021, 12, 596617. [Google Scholar] [CrossRef] [Scilit] [PubMed]
  51. Kim, M.J.; Ryu, I.H.; Do, S.I. Heat-shock triggers inverted induction of Hypo-S-Nitrosylation and Hyper-O-GlcNAcylation. Protein Pept. Lett. 2022, 29, 769–774. [Google Scholar] [CrossRef] [Scilit] [PubMed]
  52. Zhang, C.C.; Li, Y.; Jiang, C.; Le, Q.; Liu, X.; Ma, L.; Wang, F. O-GlcNAcylation mediates H2O2-induced apoptosis through regulation of STAT3 and FOXO1. Acta Pharmacol. Sin. 2024, 45, 714–727. [Google Scholar] [CrossRef] [Scilit] [PubMed]
  53. Liu, Y.; Dai, S.; Xing, L.; Xu, Y.; Chong, K. O-linked β-N-acetylglucosamine modification and its biological functions. Sci. Bull. 2015, 60, 1055–1061. [Google Scholar] [CrossRef] [Scilit]
  54. Yu, L.; Chen, Y.; Tooze, S.A. Autophagy pathway: Cellular and molecular mechanisms. Autophagy 2018, 14, 207–215. [Google Scholar] [CrossRef] [Scilit] [PubMed]
  55. Kawsar, M.A.; Adikari, D.; Zhang, Y. Autophagy in aquatic animals: Mechanisms, implications, and future directions. Front. Immunol. 2025, 16, 1612178. [Google Scholar] [CrossRef] [Scilit] [PubMed]
  56. Dang, X.; Wong, N.-K.; Xie, Y.; Thiyagarajan, V.; Mao, F.; Zhang, X.; Lin, Y.; Xiang, Z.; Li, J.; Xiao, S.; et al. Autophagy Dually Induced by AMP Surplus and Oxidative Stress Enhances Hemocyte Survival and Bactericidal Capacity via AMPK Pathway in Crassostrea hongkongensis. Front. Cell Dev. Biol. 2020, 8, 411. [Google Scholar] [CrossRef] [Scilit] [PubMed]
  57. Moreau, P.; Moreau, K.; Segarra, A.; Tourbiez, D.; Travers, M.-A.; Rubinsztein, D.C.; Renault, T. Autophagy plays an important role in protecting Pacific oysters from OsHV-1 and Vibrio aestuarianus infections. Autophagy 2015, 11, 516–526. [Google Scholar] [CrossRef] [Scilit] [PubMed]
  58. Herhaus, L. TBK1 (TANK-binding kinase 1)-mediated regulation of autophagy in health and disease. Matrix Biol. 2021, 100–101, 84–98. [Google Scholar] [CrossRef] [Scilit] [PubMed]
  59. Guo, B.; Liang, Q.; Li, L.; Hu, Z.; Wu, F.; Zhang, P.; Ma, Y.; Zhao, B.; Kovács, A.L.; Zhang, Z.; et al. O-GlcNAc-modification of SNAP-29 regulates autophagosome maturation. Nat. Cell Biol. 2014, 16, 1215–1226. [Google Scholar] [CrossRef] [Scilit] [PubMed]
  60. Lőrincz, P.; Juhász, G. Autophagosome-Lysosome Fusion. J. Mol. Biol. 2020, 432, 2462–2482. [Google Scholar] [CrossRef] [Scilit] [PubMed]
  61. Kaminskyy, V.; Zhivotovsky, B. Proteases in autophagy. Biochim. Biophys. Acta 2012, 1824, 44–50. [Google Scholar] [CrossRef] [Scilit] [PubMed]
  62. Barreda, D.; Grinstein, S.; Freeman, S.A. Target lysis by cholesterol extraction is a rate limiting step in the resolution of phagolysosomes. Eur. J. Cell Biol. 2024, 103, 151382. [Google Scholar] [CrossRef] [Scilit] [PubMed]
  63. Schwake, M.; Schröder, B.; Saftig, P. Lysosomal membrane proteins and their central role in physiology. Traffic 2013, 14, 739–748. [Google Scholar] [CrossRef] [Scilit] [PubMed]
  64. Deveraux, Q.L.; Reed, J.C. Inhibitor of apoptosis proteins (IAPS). Adv. Cell Aging Gerontol. 2001, 5, 297–321. [Google Scholar] [CrossRef] [Scilit]
  65. Cetraro, P.; Plaza-Diaz, J.; MacKenzie, A.; Abadía-Molina, F. A review of the current impact of inhibitors of apoptosis proteins and their repression in cancer. Cancers 2022, 14, 1671. [Google Scholar] [CrossRef] [Scilit] [PubMed]
  66. Fan, H.; Liu, J.; Hu, X.; Cai, J.; Su, B.; Jiang, J. The critical role of X-linked inhibitor of apoptosis protein (XIAP) in tumor development. Apoptosis 2025, 30, 1202–1215. [Google Scholar] [CrossRef] [Scilit] [PubMed]
  67. Kaiser, W.J.; Vucic, D.; Miller, L.K. The Drosophila inhibitor of apoptosis D-IAP1 suppresses cell death induced by the caspase drICE. FEBS Lett. 1998, 440, 243–248. [Google Scholar] [CrossRef] [Scilit] [PubMed]
  68. Hanifeh, M.; Ataei, F. XIAP as a multifaceted molecule in Cellular Signaling. Apoptosis 2022, 27, 441–453. [Google Scholar] [CrossRef] [Scilit] [PubMed]
  69. Feder, M.E.; Hofmann, G.E. Heat-shock proteins, molecular chaperones, and the stress response: Evolutionary and ecological physiology. Annu. Rev. Physiol. 1999, 61, 243–282. [Google Scholar] [CrossRef] [Scilit] [PubMed]
  70. Jeyachandran, S.; Chellapandian, H.; Park, K.; Kwak, I.S. A review on the involvement of heat shock proteins (Extrinsic Chaperones) in Response to Stress Conditions in Aquatic Organisms. Antioxidants 2023, 12, 1444. [Google Scholar] [CrossRef] [Scilit] [PubMed]
  71. Pockley, A.G.; Henderson, B. Extracellular cell stress (heat shock) proteins-immune responses and disease: An overview. Philos. Trans. R. Soc. Lond. B Biol. Sci. 2018, 373, 20160522. [Google Scholar] [CrossRef] [Scilit] [PubMed]
  72. Hu, C.; Yang, J.; Qi, Z.; Wu, H.; Wang, B.; Zou, F.; Mei, H.; Liu, J.; Wang, W.; Liu, Q. Heat shock proteins: Biological functions, pathological roles, and therapeutic opportunities. MedComm 2022, 3, e161. [Google Scholar] [CrossRef] [Scilit] [PubMed]
  73. Taipale, M.; Jarosz, D.F.; Lindquist, S. HSP90 at the hub of protein homeostasis: Emerging mechanistic insights. Nat. Rev. Mol. Cell Biol. 2010, 11, 515–528. [Google Scholar] [CrossRef] [Scilit] [PubMed]
  74. Gaffen, S.L. An overview of IL-17 function and signaling. Cytokine 2008, 43, 402–407. [Google Scholar] [CrossRef] [Scilit] [PubMed]
  75. Castillo, M.G.; Humphries, J.E.; Mourão, M.D.; Marquez, J.; Gonzalez, A.; Montelongo, C.E. Biomphalaria glabrata immunity: Post-genome advances. Dev. Comp. Immunol. 2020, 104, 103557. [Google Scholar] [CrossRef] [Scilit] [PubMed]
  76. Lian, X.; Li, Y.; Wang, W.; Zuo, J.; Yu, T.; Wang, L.; Song, L. The modification of H3K4me3 enhanced the expression of CgTLR3 in hemocytes to increase CgIL17-1 production in the immune priming of Crassostrea gigas. Int. J. Mol. Sci. 2024, 25, 1036. [Google Scholar] [CrossRef] [Scilit] [PubMed]
  77. Sun, B.; Lan, X.; Bock, C.; Shang, Y.; Hu, M.; Wang, Y. Effects of ocean acidification and warming on apoptosis and immune response in the mussel Mytilus coruscus. Fish Shellfish Immunol. 2025, 158, 110134. [Google Scholar] [CrossRef] [Scilit] [PubMed]
  78. Zhou, X.; Fang, P.; Cao, H.; Xie, J.; Li, S.; Chi, C. Molecular characterization and expression of twenty interleukin-17 transcripts in the common Chinese cuttlefish (Sepiella japonica) in response to Vibrio harveyi infection. Fish Shellfish Immunol. 2023, 140, 108903. [Google Scholar] [CrossRef] [Scilit] [PubMed]
Figure 1. Histopathology of the B. areolata hepatopancreas in control group (a) and V. tubiashii infected groups at 3 h (b), 24 h (c), 48 h (d), and 72 h (e). Figures are 400× field of views with 20 μm scale bar. HC: hepatopancreatic cell, CT: connective tissue, MS: meshed structure, VC: vacuolated cells.
Biology 15 00992 g001
Figure 2. Comparison of relative expression levels determined by RNA-seq and qRT-PCR. β-actin was used as internal control.
Biology 15 00992 g002
Figure 3. Different expression genes (DEGs) at 3 h, 24 h, 48 h, and 72 h. Groups compared with PBS control group in hepatopancreas of B. areolata.
Biology 15 00992 g003
Figure 4. The Venn diagram of the DEGs at 3 h, 24 h, 48 h, and 72 h infected groups.
Biology 15 00992 g004
Figure 5. Trend analysis of the DEGs expression trend changes. (a) Trend analysis results sorted by p-value. (b) Trend analysis results sorted by the numbers of DEGs. Boxes filled with red or green denote statistically significantly enriched gene profiles (p < 0.05).
Biology 15 00992 g005
Figure 6. GO enriched circle plot of the top 15 pathways at 3 h vs PBS (a), 24 h vs PBS (b), 48 h vs PBS (c), and 72 h vs. PBS (d) after V. tubiashii infection.
Biology 15 00992 g006
Figure 7. KEGG enriched bubble chart of the top 20 pathways at 3 h (a), 24 h (b), 48 h (c), and 72 h (d) after infection.
Biology 15 00992 g007
Figure 8. Weighted gene co-expression network analysis (WGCNA) of V. tubiashii infection in a time-course. (a) Heatmap of correlation coefficient in different modules that related to FP17 infection and duration. Asterisks within cells denote statistical significance of correlation: * p < 0.05, ** p < 0.01, *** p < 0.001. KEGG enrichment pathway of turquoise (b), royalblue (c), and darkgreen (d) modules.
Biology 15 00992 g008
Figure 9. The time-course alteration of different enzyme activity in hepatopancreas upon V. tubiashii infection. (a) Oxidative-stress-related enzyme (SOD, CAT, POD, and GSH-PX) activity; (b) malondialdehyde (MDA); (c) lysozyme (LZM); (d) acid phosphatase (ACP) and alkaline phosphatase (AKP); (e) Na+/K+-ATPase; (f) pepsin, lipase (LPS), and amylase (AMS). Data are presented as mean ± standard error of the mean (SEM). Each group has n ≥ 3 independent biological replicates. Ordinary one-way ANOVA combined with Dunnett’s multiple comparisons test was used for statistical analysis. * p < 0.05 and ** p < 0.01 indicate significant differences compared with the PBS control group.
Biology 15 00992 g009
Figure 10. Inflammatory cytokine contents in hepatopancreas were measured by ELISA in a time course after V. tubiashii infection. Concentration of TNF-α (a), IL-1 (b), IL-6 (c), IL-8 (d), IL-10 (e), and IL-17 (f), respectively. Data are presented as mean ± standard error of the mean (SEM). Each group has n ≥ 3 independent biological replicates. Ordinary one-way ANOVA combined with Dunnett’s multiple comparisons test was used for statistical analysis. * p < 0.05, ** p < 0.01, *** p < 0.001, **** p ≤ 0.0001. indicate significant differences compared with the PBS control group.
Biology 15 00992 g010
Table 1. Summary of sequencing results.
SampleRaw Reads (bp)Clean Reads (bp)Q20 (%)Q30 (%)GC (%)Mapped (%)
PBS-16,071,805,3005,918,095,39797.8294.3249.0682.56
PBS-28,354,126,1008,030,860,22397.4893.4650.0083.75
PBS-36,246,167,7006,110,452,83497.5993.6648.9482.55
3 h-17,299,052,8007,128,949,21897.4193.3946.4479.56
3 h-25,483,865,3005,383,604,03597.4993.5646.9580.26
3 h-36,277,087,8006,142,031,73997.3593.1445.0080.32
24 h-16,053,256,6005,944,760,54197.8394.2043.9277.33
24 h-25,868,210,0005,728,036,94897.8694.4242.1180.59
24 h-35,409,107,4005,305,175,00297.5693.6641.8979.77
48 h-15,645,967,9005,529,360,57797.4593.3844.0280.50
48 h-26,962,169,0006,813,070,31697.5293.6245.2480.72
48 h-37,926,644,7007,755,411,98497.8994.4844.2080.32
72 h-15,555,948,4005,438,994,26097.3993.3744.7178.04
72 h-26,080,933,7005,920,664,59597.5993.7546.8280.77
72 h-37,223,701,8006,963,421,77797.6193.8647.6081.42
Table 2. Primer list for quantitative RT-PCR verification.
Gene NameForward Primer (5′-3′)Reverse Primer (5′-3′)Amplicon Length (bp)
hpnGGCAGGCAGTTCCAGTCTATGCAGTCAAGCCCTCTGTCCAA159
hsp90a.1TGTGGGTGATGTGATGTGGGATTCCTGCTGGTCCTCCTTC146
lysoz3TTTCTGACAATCGTTCGTCCTTCTGGTCCGAAAGTGGCGTAT179
pgrp-sc2AGCCCTTTGTCTGCGGTAATCACTCCGTTTGGCACTCATC159
gm2aCTGCTGCCACTGCTTCTTCTATGCTGGTATAGCCGCGTAA225
hspa5TCCATAACCCACCGAACGCCCTGCTAGTGCCTGAACCC102
hephTCGGGTCCACTCTGTTTACGCAGGGAAGGGAGGCTATTTT184
vcanTAGCGCCTATGCTCGGTAGATTCGGTGCGTTATGGAAACA218
cd209eGTCGGTCGTCTTATGGTCGTAGTCGGTTTGTGGTGGATTTG261
klh2GCCAATGACGAGACCTACGAAATCCCGAATCCCACCTACA217
pnlipAGACCACGAGTTCGCAGCATCGCCGATAGAAAGTCATCCC107
i-2CAGTCTGATTTACGCTGGGATACATGCTCTGTGGGCTAGGTG233
lec-1TCACCTATCAGTTAGCGAGCATTAAGGGCCGAAACACTTGAC286
tnfsf10CGAACCTGTGCGGGAAGATCAGTGACGCCTCCTTGAGC109
fth1-aGAAGAGCGTCAACCAGTCCCGACCGACCGACCTGCTAACT115
actinTTTCGCACCAGTCATTCACACTTCCTCTTTCGCTTCGTCA155
Table 3. The top 20 significant immune-related pathways at different time points after infection.
TimePathwaysNumber of DEGs
3 hNOD-like receptor signaling pathway29
T cell receptor signaling pathway19
Natural-killer-cell-mediated cytotoxicity13
Leukocyte transendothelial migration19
Rheumatoid arthritis8
Th1 and Th2 cell differentiation10
Platelet activation22
Th17 cell differentiation9
Toll-like receptor signaling pathway15
Inflammatory bowel disease3
IL-17 signaling pathway10
B cell receptor signaling pathway11
Fc epsilon RI signaling pathway9
Autoimmune thyroid disease1
C-type lectin receptor signaling pathway15
Primary immunodeficiency2
Toll and Imd signaling pathway7
Chemokine signaling pathway16
RIG-I-like receptor signaling pathway6
Fc gamma R-mediated phagocytosis13
24 h Th17 cell differentiation21
T cell receptor signaling pathway36
IL-17 signaling pathway25
Toll-like receptor signaling pathway33
B cell receptor signaling pathway27
RIG-I-like receptor signaling pathway19
NOD-like receptor signaling pathway48
Toll and Imd signaling pathway19
Intestinal immune network for IgA production4
Th1 and Th2 cell differentiation17
Natural-killer-cell-mediated cytotoxicity21
Leukocyte transendothelial migration31
Chemokine signaling pathway36
Cytosolic DNA-sensing pathway17
Rheumatoid arthritis12
Fc epsilon RI signaling pathway18
C-type lectin receptor signaling pathway31
Fc gamma R-mediated phagocytosis29
Complement and coagulation cascades9
Autoimmune thyroid disease2
48 h NOD-like receptor signaling pathway31
Th17 cell differentiation12
B cell receptor signaling pathway15
IL-17 signaling pathway13
Th1 and Th2 cell differentiation11
Natural-killer-cell-mediated cytotoxicity13
Toll-like receptor signaling pathway17
Inflammatory bowel disease4
Toll and Imd signaling pathway10
T cell receptor signaling pathway16
Intestinal immune network for IgA production2
Fc epsilon RI signaling pathway10
RIG-I-like receptor signaling pathway8
Complement and coagulation cascades5
Rheumatoid arthritis6
Chemokine signaling pathway17
Cytosolic DNA-sensing pathway7
C-type lectin receptor signaling pathway13
Antigen processing and presentation4
Leukocyte transendothelial migration12
72 h Rheumatoid arthritis4
IL-17 signaling pathway5
Th17 cell differentiation3
Toll and Imd signaling pathway3
B cell receptor signaling pathway3
Antigen processing and presentation2
Toll-like receptor signaling pathway3
Primary immunodeficiency1
T cell receptor signaling pathway3
Inflammatory bowel disease1
NOD-like receptor signaling pathway4
C-type lectin receptor signaling pathway2
Th1 and Th2 cell differentiation1
Natural-killer-cell-mediated cytotoxicity1
Systemic lupus erythematosus1
Note: Pathways were ranked automatically by enrichment score without manual filtering. KEGG pathway nomenclature is based on vertebrate data. All functional interpretations are limited to conserved innate immune signaling components of mollusks.
Table 4. Key genes in most significant correlated modules analyzed by WGCNA.
Gene IDModulekTotalkWithinSymbolDescription
BABareV306129turquoise18461594adam12disintegrin and metalloproteinase domain-containing protein 12
BABareV310784turquoise17971563prrc2aPRRC2A
BABareV305867turquoise18061548rrbp1ribosome-binding protein 1
BABareV309951turquoise18171551clstn1calsyntenin-1
BABareV322707turquoise17591522aco1cytoplasmic aconitate hydratase
BABareV304105turquoise17951536igf2rcation-independent mannose-6-phosphate receptor
BABareV301913turquoise17411499add1Adducin 1
BABareV325031turquoise17241483bsgI-type lectin
BABareV303418turquoise17401511cdh23cadherin-23
BABareV301786turquoise17081476nrgneuroglian
BABareV319683turquoise17441493pat-3integrin beta 3
BABareV303009turquoise17041487reep5receptor expression-enhancing protein 5
BABareV317442royal blue19957pzpalpha-2-macroglobulin
BABareV302540royal blue14759csrp2cysteine and glycine-rich protein
BABareV303394royal blue17754zipmyosin heavy chain, non-muscle
BABareV304414dark green21160acp7acid phosphatase 7
BABareV308816dark green22448pim1serine/threonine-protein kinase pim-1
BABareV313062dark green16458tbk1TANK-binding kinase 1
Table 5. Summary of top immune-related DEGs in PPI by node degree value.
SymbolGene NameFunctionDegree
hsp90a.1Heat Shock Protein 90 Alpha Family Class A Member 1Chaperones to assist in the folding and activation of client proteins 95
mapk15Mitogen-Activated Protein Kinase 15Cell proliferation, differentiation, apoptosis, and stress responses (such as oxidative stress, DNA damage)92
pik-1Phosphoinositide Kinase 1Cytoskeletal reorganization, membrane trafficking, cell polarity establishment, and signal transduction91
rac1Ras-Related C3 Botulinum Toxin Substrate 1Cytoskeletal reorganization of actin, cell migration, invasion and morphogenesis, phagocytosis, and immune cell activation87
ced-10Cell Death Abnormality 10Small GTPases in Rho family, which are homologous genes of RAC1 in invertebrates, involving in Cell migration and phagocytosis87
RhobRas Homolog Gene Family Member BCytoskeleton and cell adhesion, cell cycle regulation, apoptosis, and angiogenesis86
btkBruton Tyrosine KinaseA key kinase in the B-cell receptor signaling pathway84
Disclaimer/Publisher’s Note: The statements, opinions and data contained in all publications are solely those of the individual author(s) and contributor(s) and not of MDPI and/or the editor(s). MDPI and/or the editor(s) disclaim responsibility for any injury to people or property resulting from any ideas, methods, instructions or products referred to in the content.