Quantification of Genes and Proteins Associated with Endothelial Cell Function After Different Exercise-Induced Shear Stress Intensities In Vitro
Simple Summary
Abstract
1. Introduction
2. Materials and Methods
- Cycle ergometer;
- Scale with a stadiometer;
- Sphygmomanometer or automated blood pressure monitor;
- Capillary tubes;
- Capillary tube sealing compound;
- Ultrasound with a 12 to 18 Hz transducer;
- Pulsed-Wave Doppler;
- T-75 flasks;
- Biosafety cabinet;
- 70% ethanol;
- Water bath at 37 °C;
- Serological pipette;
- 10 mL serological pipette tips;
- Inverted microscope;
- Incubator (37 °C and 5% CO2);
- Hank’s balanced salt solution (HBSS);
- Dulbecco’s phosphate-buffered saline (DPBS);
- Trypsin ethylenediaminetetraacetic acid (EDTA);
- Trypsin neutralizing solution (TNS);
- 50 mL conical tubes;
- Centrifuge for 50 mL tubes;
- Hemocytometer or cell counter;
- Plastic hose clips;
- Syringe coupler;
- Paraformaldehyde;
- Triton X-100;
- Bovine serum albumin (BSA);
- 4′,6-diamino-2-phenylindole (DAPI);
- Confocal microscope;
- 1 mL syringe;
- 20-gauge syringe;
- 1.5 microcentrifuge tubes;
- Countertop centrifuge with temperature regulation;
- Nanodrop spectrophotometer;
- PCR plate;
- Thermocycler;
- Phenylmethylsulphonyl fluoride (PMSF);
- 25-gauge syringe;
- Bicinchoninic acid assay;
- Dithiothreitol (DTT);
- Tris glycine sodium dodecyl sulfate (Tris, glycine, SDS) buffer;
- Western blot incubation boxes;
- Plate shaker;
- Tris buffered saline (TBS);
- Micropipettes with corresponding pipette tips.
2.1. Determination of Exercise Intensities for Exercise-Induced Endothelial Shear Stress In Vivo
- Measure the participants’ height and weight using a standard weighing scale and stadiometer.
- Adjust the height of the seat to allow knee flexion between 5° and 15°.
- Have the participant sit quietly on the cycle ergometer for 10 min to ensure sympathetic activity does not affect the blood pressure readings.
- Measure the participant’s blood pressure twice at the end of the 10 min and repeat the measurement three times.
- Average blood pressure measurements to establish a baseline.
- Perform a VO2 max test following the American Heart Association (AHA) and the American College of Sports Medicine (ACSM) guidelines [17,18].
- Participants must complete 2-min stages until volitional exhaustion.
- Increase the workload by 25 Watts after each stage.
- Measure VO2, heart rate (HR), and La at the end of each 2-min stage.
- VO2 is measured from the inspired and expired air of the participant connected to the metabolic cart.
- HR is measured with an H10 heart rate sensor placed on the chest.
- La is measured using a micro-sample from the earlobe with the Lactate Plus Meter.
- At the end of the test, determine three exercise intensities by determining 3 La curves as follows:
- Low-intensity—0–2 mmol/L.
- Moderate-intensity—2–4 mmol/L.
- High-intensity—>4 mmol/L.
2.2. Determination of Exercise-Induced Shear Stress
- Determine the participant’s hematocrit from two earlobe capillary blood samples.
- Collect the blood using hematocrit capillary tubes and seal them.
- Centrifuge and determine hematocrit using a semi-automated hematocrit measuring device.
- Have the participant exercise for 5 min at each predetermined intensity.
- Monitor VO2 and HR throughout the exercise session.
- Assess La at min 2 and 4 of each exercise intensity to confirm that the exercise intensity corresponds to the La expected at each intensity.
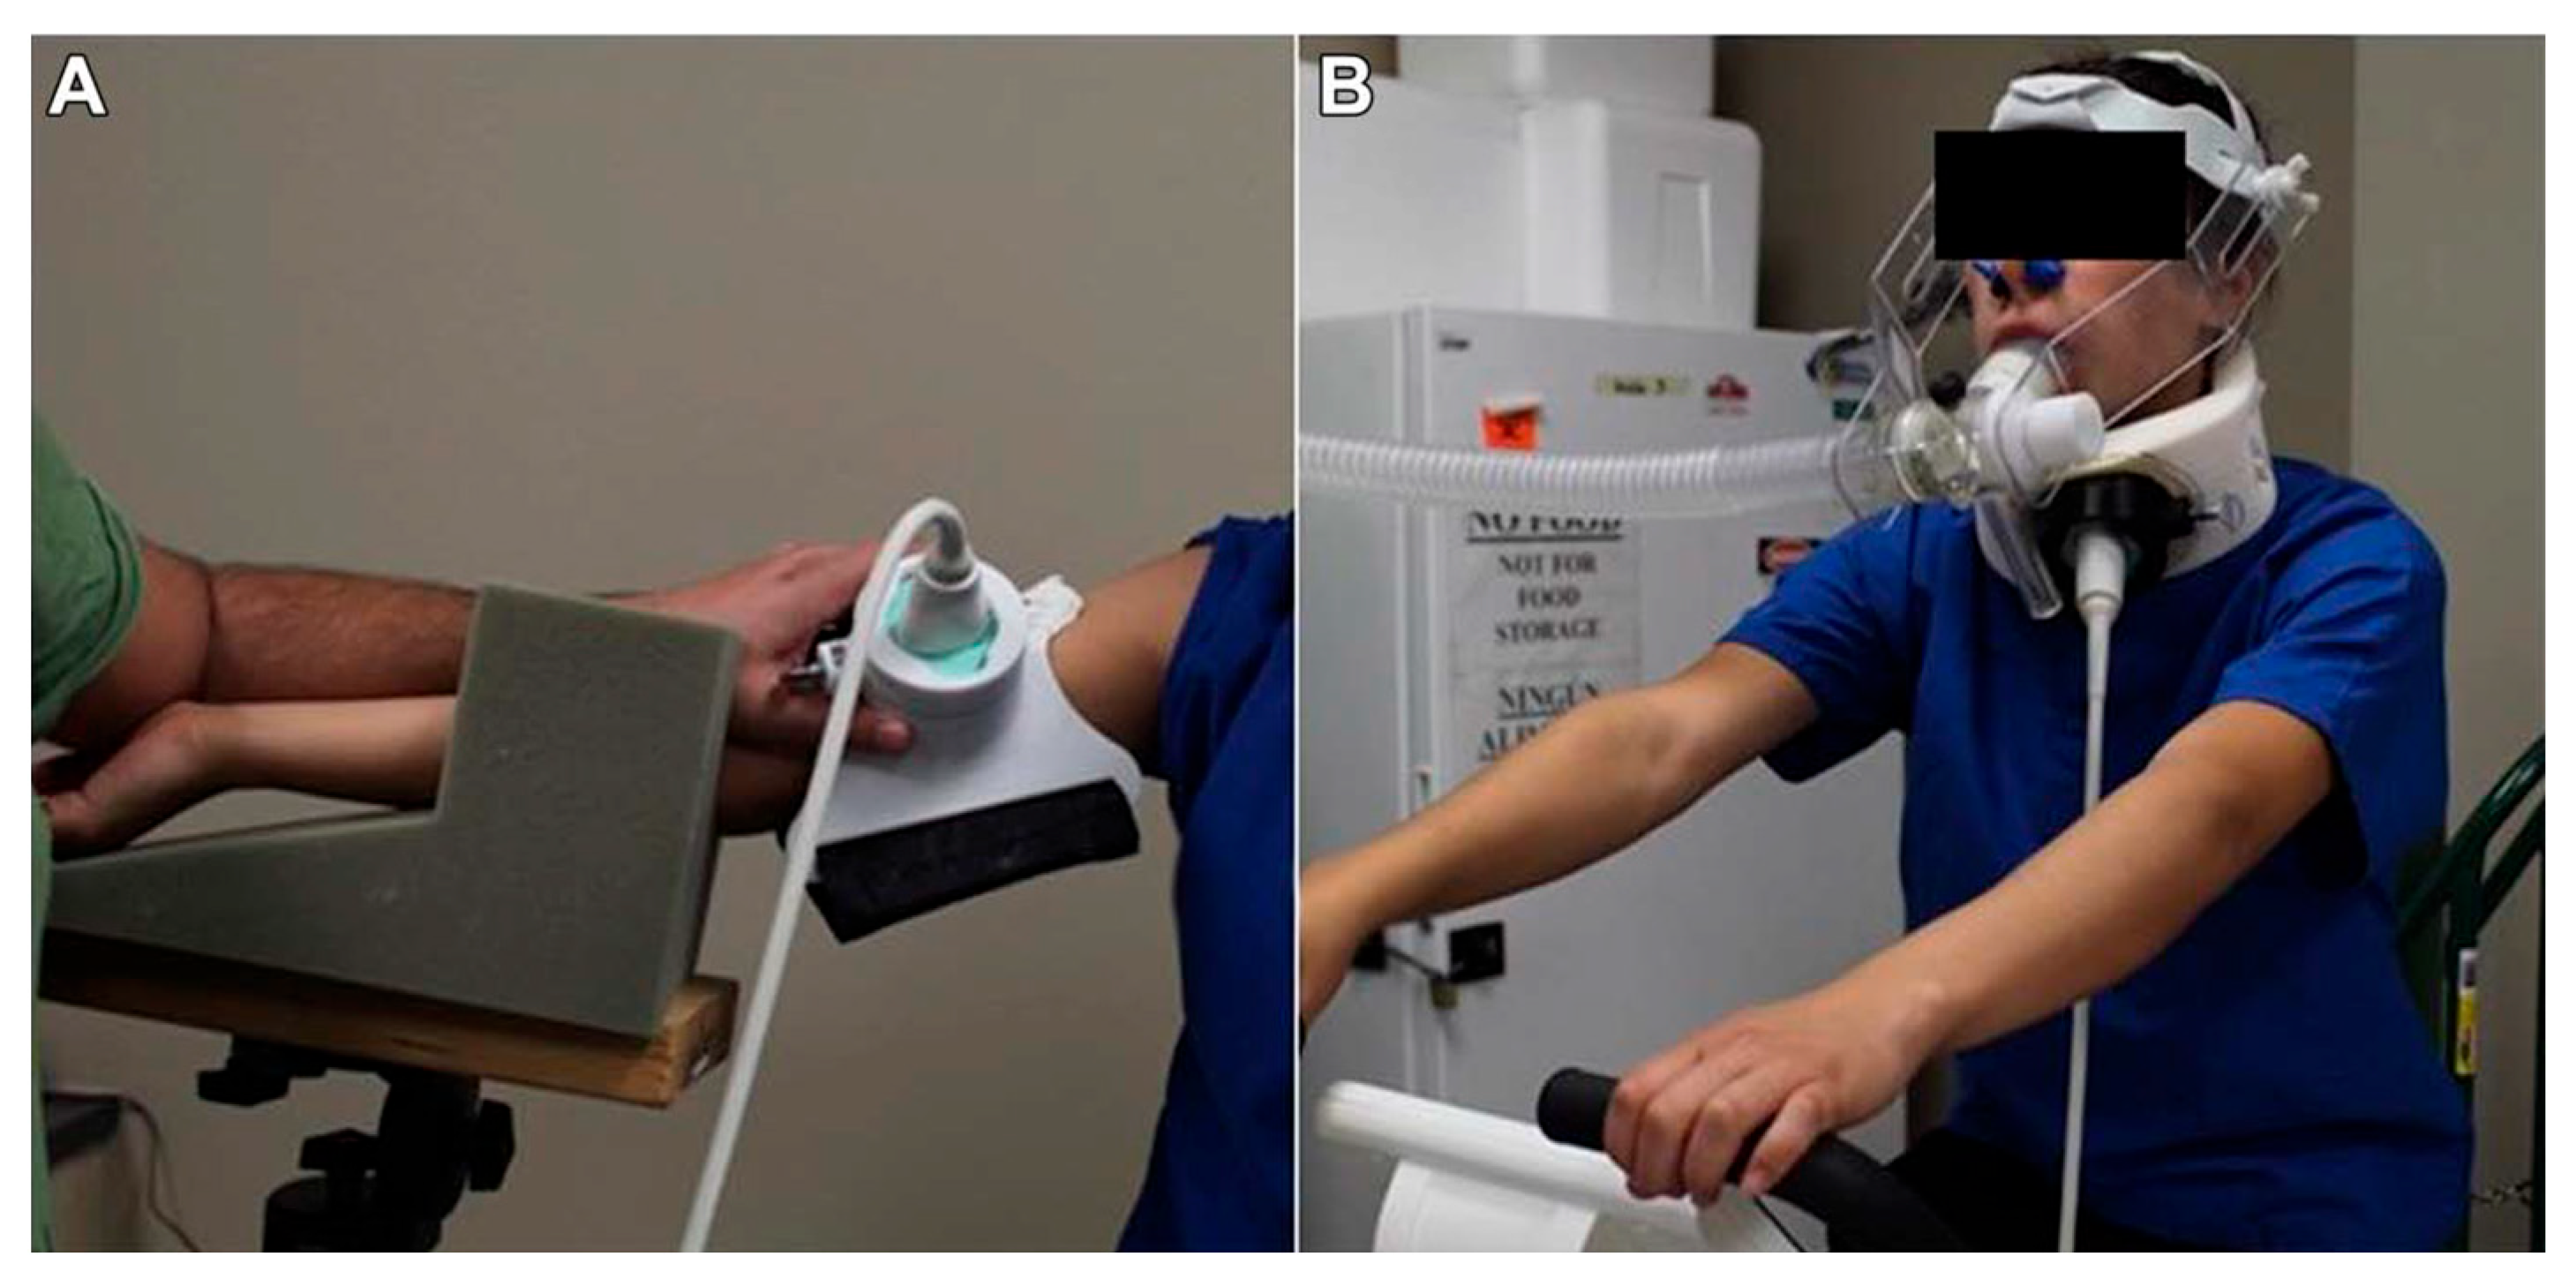
- Measure blood flow patterns in the carotid artery and/or brachial artery using the 12 to 18 Hz ultrasound transducer.
- Adjust the ultrasound settings to a frequency of 12 Hz and 3 cm depth for the brachial artery and 18 Hz and 3–5 cm depth for the common carotid artery.
- Identify a transverse section of the artery and center it.
- Rotate the transducer 90° to obtain a longitudinal view of the artery and use a Pulsed-Wave Doppler to record blood flow velocity.
- Ensure an insonation angle < 60°.
- For the carotid artery, place the Doppler 5 to 10 mm distal to the bifurcation.
- For the internal and external carotid arteries, move the Doppler 5 to 12 mm proximal to the bifurcation.
- The ESS calculation follows the Womersley approximation, where the shear rate (SR) is determined from the measured artery diameter and peak systolic velocity obtained via Doppler ultrasound, and blood viscosity is estimated from measured hematocrit values. All parameters are recorded at each exercise intensity to ensure accuracy in replicating the corresponding shear stress in vitro. The ESS is then calculated as follows:
- ESS = μ · SR.SR = 2K · V/D.
- μ is blood viscosity.
- SR is the shear rate.
- V is the peak systolic velocity.
- D is the artery diameter.
- K is the complex factor dependent on the Womersley parameter α.
- A = (D/2) · (ω/[μ/ρ])1/2.
- D is the artery diameter.
- ω is the angular frequency of flow pulsation (ω = freq · 2π).
- ρ is blood density.
- μ is blood viscosity.
2.3. HUVEC Seeding
- Place the MesoEndo cell growth medium and the frozen vial of HUVEC in the water bath and monitor the cells closely.
- Pipette 20 mL of media into a T-75 flask.
- Resuspend the cells inside the vial by slowly pipetting up and down five times and transfer the cells to the T-75 flask containing the growth media.
- Gently rock the flask for 10 s to distribute the cells evenly in the flask.
- Check cell viability and distribution with an inverted microscope.
- Place the cells in the incubator overnight.
- After overnight incubation, check for cell adhesion and growth, and change the media to remove traces of dimethyl sulfoxide used during cryopreservation.
- Change cell media every other day until cells reach 80% confluence.
- Confluence is evaluated visually using the inverted microscope, estimating the proportion of growth surface covered by cells, consistent with standard cell culture guidelines [20].
- Overconfluent cells become senescent.
2.4. HUVEC Subculture into Ibidi μ-Slide I Luer
- Place the perfusion set, μ-slides, and media inside the incubator overnight to avoid bubble formation inside the slides.
- Remove the media from the T-75 containing the HUVEC inside the biosafety cabinet and wash them twice with HBSS or DPBS (Cell Applications, San Diego, CA, USA).
- After the second wash, add 5 mL of trypsin EDTA (Cell Applications, San Diego, CA, USA), rock the flask to cover the cells completely, and immediately remove 4.5 mL of trypsin EDTA.
- Monitor trypsinization under the microscope.
- Once the cells become round, tap the flask lightly to detach them from the flask.
- Add 5 mL of TNS (Cell Applications, San Diego, CA, USA) and transfer the cell suspension to a 50 mL conical tube.
- Rinse the flask with 5 mL of TNS and transfer it to the 50 mL conical tube containing the cell suspension.
- Centrifuge the conical tube for 5 min at 220× g to pellet the cells.
- Place the 50 mL conical tube inside the biosafety cabinet and remove the supernatant without disturbing the pellet.
- Loosen the pellet by flicking the tip of the tube and add 2 mL of growth media.
- Resuspend the cells by slowly pipetting up and down.
- Count the cells and make a cell suspension with a density of 1 × 10⁶ cells/mL
- Dilute the cells with growth media if necessary.
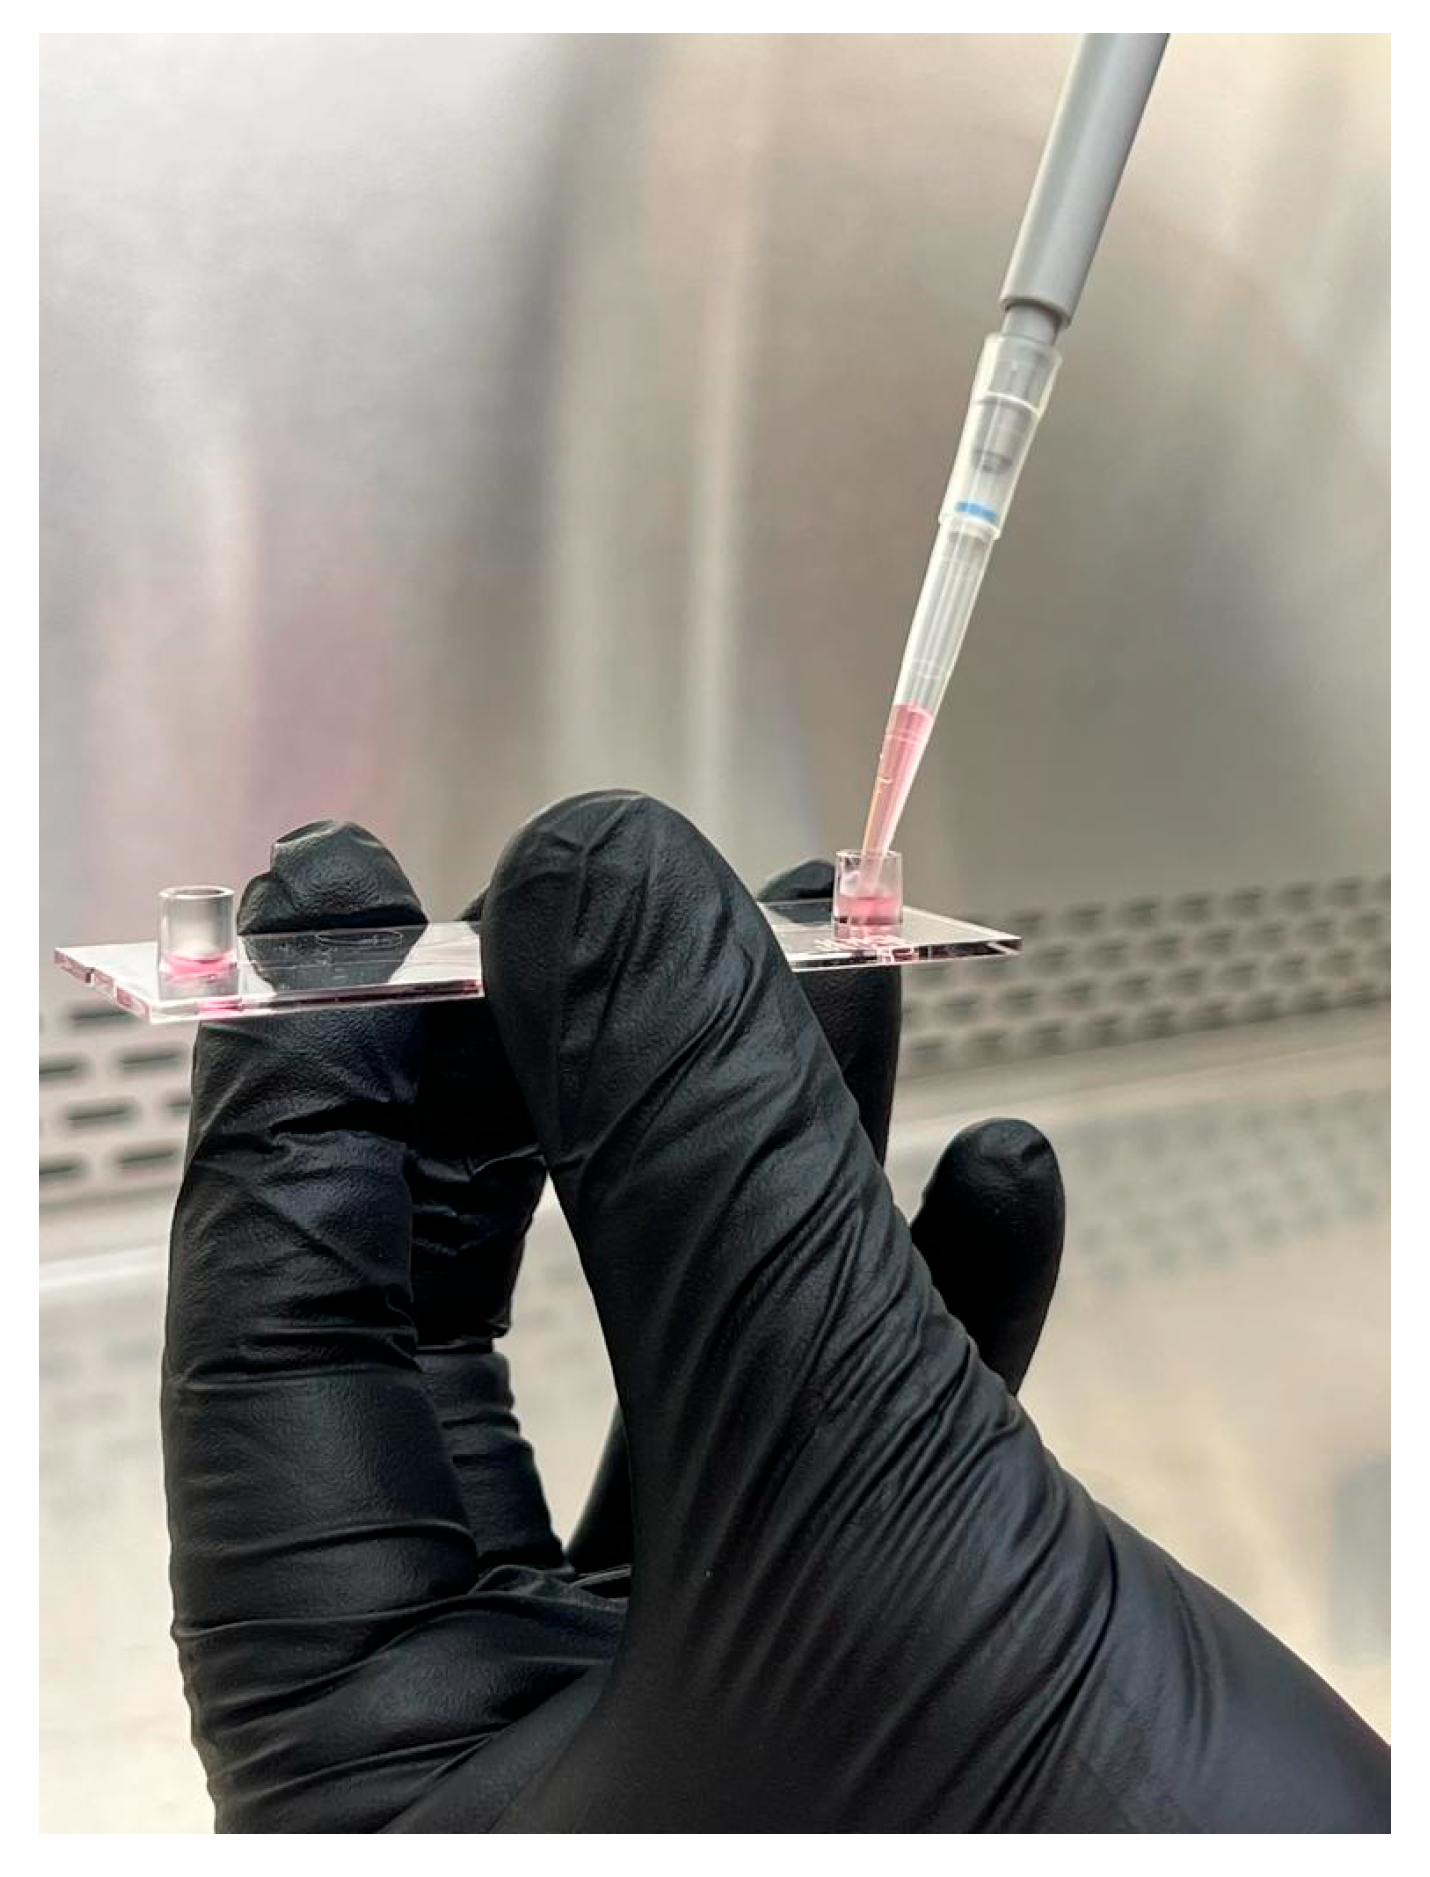
- Add 150 μL of cell suspension into the channel inlet of the Ibidi μ-slide (Figure 2).
- Add the cell suspension slowly to avoid bubble formation inside the slide.
- Incubate the cells until they reach 80% confluence
- Change the media every other day.
2.5. Exercise-Induced ESS Experiments Using the Ibidi Pump System
- Place two fluidic units inside the incubator and attach the perfusion set as shown in Figure 3A,B.
- Pinch the line with a plastic hose clip, add 5 mL of media to each syringe, and connect the two ends of the perfusion set with the syringe coupler.
- Once the two ends are connected, remove the hose clip.
- Using the Ibidi Pump Flow Control Software version 1.6.2, set the following parameters to remove any bubbles in the line.
- Under the fluidic unit set up tab, select the yellow/green perfusion set without any slide.
- Click Apply New Settings.
- Under the flow parameters tab, set the shear stress to 80 dyn/cm2.
- Click the “play” button and watch the bubbles in the line. Once the line is free of bubbles, click on the stop button.
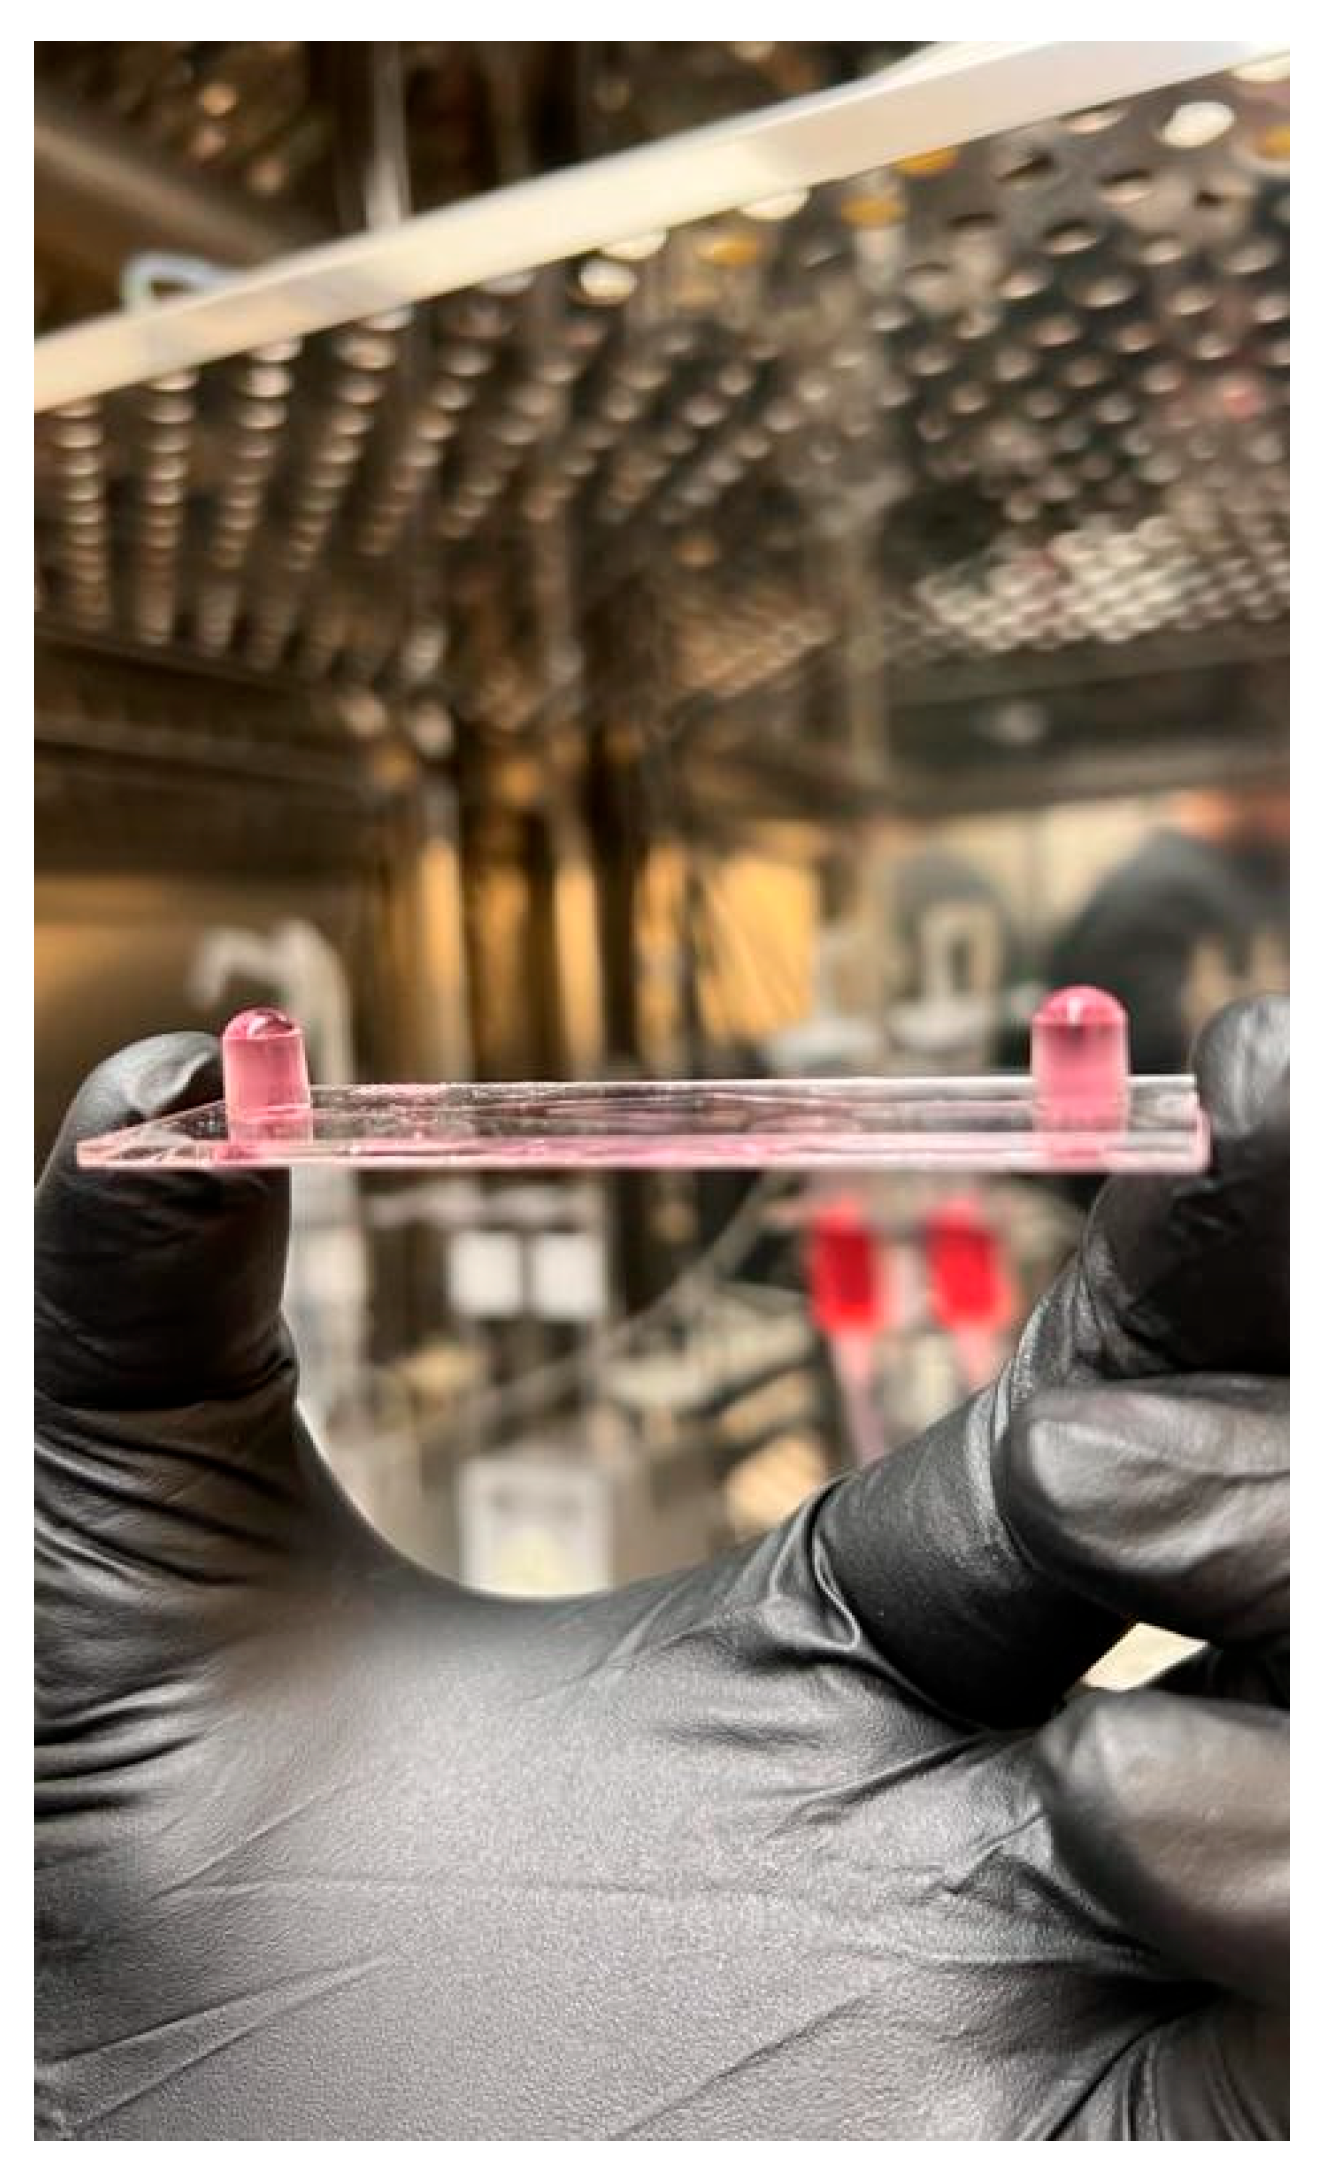
- With the line free of bubbles, pinch the line, remove the plastic connector, add approximately 50 μL of media to one of the slide’s channel inlets, and connect to the perfusion set (Figure 4).
- Set the shear stress to the appropriate value calculated from the in vivo measurements.
- Set the fluidic unit 1 (P1) as unidirectional and the fluidic unit 2 (P2) as oscillatory.
- Dynamic shear stress settings are programmed to match the pulsatile nature of in vivo blood flow.
- For this example, a frequency of 60 pulses per minute (PPM) was set with an oscillatory interval of 0.5 s (1 Hz).
- Higher or lower PPM values can be calculated using the following formula:Oscillatory interval (s) = 60/PPM.
- The cycle duration is set to match the total planned exposure time. For example, 6 h for the presented experiments.
- The system will automatically stop at the end of the cycle.
- If two slides run simultaneously, set P3 as unidirectional and P4 as oscillatory.
2.6. Protein Detection Using Immunocytochemistry (ICC)
- Remove the cell media from the slide and wash it with 150 μL of DPBS three times.
- Remove the DPBS and fix the cells by adding 150 μL of 2% paraformaldehyde (Fisher Scientific, Hampton, NH, USA), and incubating at room temperature for 10 min.
- Remove the paraformaldehyde and wash the cells three times with DPBS.
- After the last wash, add 150 μL of 0.1% Triton X-100 (Fisher Scientific, Hampton, NH, USA) and incubate at room temperature for 10 min.
- Remove the Triton X-100 and wash the cells twice with DPBS.
- Remove the DPBS and add 150 μL of 1% BSA (Sigma-Aldrich, St Louis, MO, USA) and incubate overnight at 4 °C
- After incubation, perform the following steps in a dark room.
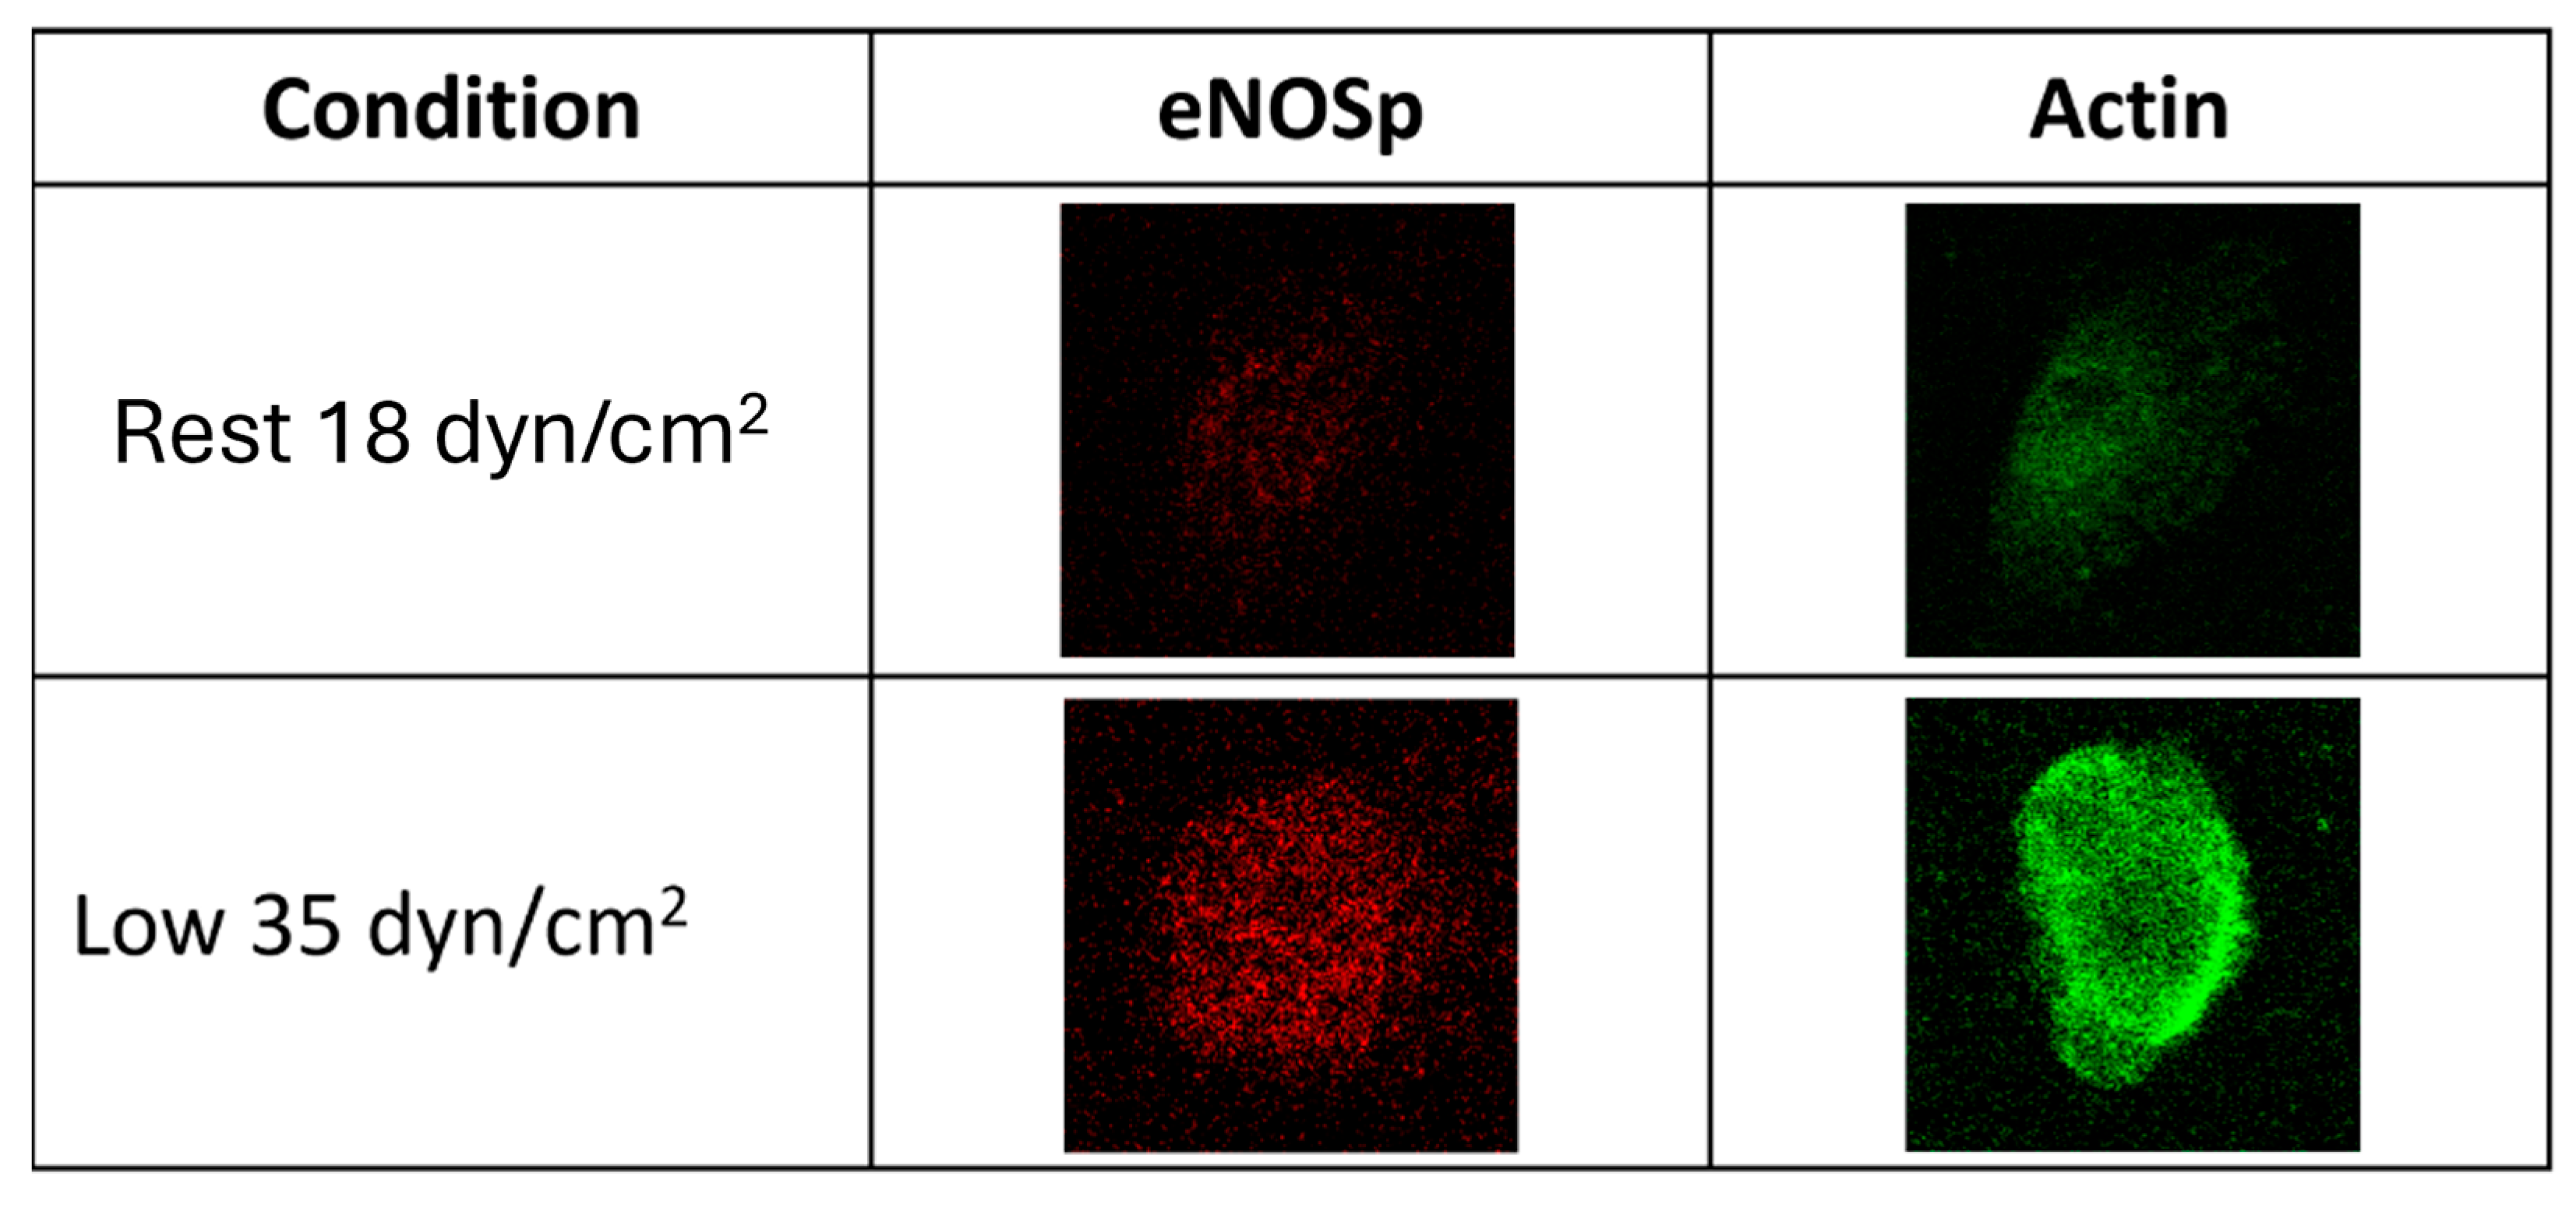
- Add 150 μL of primary antibody (eNOSp; Abcam, Waltham, MA, USA) diluted 1:100 in 1% BSA and incubate for 60 min at 37 °C.
- Remove the primary antibody and wash the cells three times with DPBS.
- Add 150 μL of secondary antibody (Alexa Fluor 488; Invitrogen, Waltham, MA, USA) diluted 1:1000 in 1% BSA and incubate for 60 min.
- Remove the secondary antibody and wash the cells three times with DPBS.
- Add 150 μL of DAPI (Fisher Scientific, Hampton, NH, USA) diluted 1:1000 in DPBS and incubate for 5 min.
- Remove the DAPI and wash the cells three times with DPBS.
- Add 150 μL of fresh DPBS and visualize the cells using a confocal microscope (LSM 700, Carl Zeiss Microscopy GmbH, Jena, Germany) or store at 4 °C protected from light.
- Visualize within a week to prevent degradation of the dyes.
2.7. mRNA Extraction and qRT-PCR
- Remove the cell media, wash the cells five times with DPBS.
- Add 100 μL of RNA lysis buffer (buffer RLT) from the Qiagen RNeasy Micro Kit to lyse the cells.
- Attach a 1 mL syringe to one of the channel inlets and move the plunger quickly up and down several times to shear out the lysed cells.
- Place the cell lysate in a 1.5 mL microcentrifuge tube.
- Add another 100 μL of buffer RLT from the Qiagen RNeasy Micro Kit to the slide and shear out any remaining cells.
- Place the cell lysate in the same 1.5 mL microcentrifuge tube.
- Mix the cell lysate with an additional 150 μL of buffer RLT to have a total volume of 350 μL.
- Attach a 20-gauge needle to the syringe and pass the entire cell lysate 15 times.
- At this point, the cell lysate can be stored at −20 °C for up to one week.
- Add 350 μL of 70% ethanol (Fisher Scientific, Hampton, NH, USA), mix by pipetting up and down, and transfer it to a MinElute spin column.
- Centrifuge the column at 8000× g for 15 s and discard the flow-through in the collection tube.
- Repeat this step for any remaining lysate.
- Add 350 μL of buffer RW1 from the Qiagen RNeasy Micro Kit to the column, centrifuge at 8000× g for 15 s, and discard the flow-through and collection tube.
- Insert the column into a new collection tube and add 500 μL of buffer RPE from the Qiagen RNeasy Micro kit, centrifuge at 8000× g for 15 s, and discard the flow through.
- Repeat this step once.
- Add 500 μL of 80% ethanol (Fisher Scientific, Hampton, NH, USA), centrifuge at 8000× g for 2 min, and discard the flow-through.
- Completely dry the column by centrifuging the column at >12,000× g for 5 min.
- Discard the flow-through and collection tube.
- Place the column in a 1.5 mL microcentrifuge tube, elute the RNA by adding 14 μL of RNase-free water from the Qiagen RNeasy Micro Kit, incubate for 3 min, and centrifuge at >12,000× g for one min.
- The eluted RNA can be stored at −20 °C for up to a month.
- Measure the RNA concentration using a nanodrop spectrophotometer (Nanodrop One, Fisher Scientific, Hampton, NH, USA) at 260 nm.
- The 260/280 ratio provides the purity of the eluted RNA.
- ≥1.8 and ≤2.0 indicate a pure RNA sample.
- Prepare a reverse transcription master mix for up to 2 μg of mRNA using the high-capacity cDNA reverse transcription kit (Thermo Scientific, Waltham, MA, USA), following the volumes in Table 3.
- Load 10 μL of the reverse transcription master mix in a PCR plate and 10 μL of the eluted mRNA and load the plates/tubes in a thermocycler following the settings of Table 4.
- Take the samples from the thermocycler (GeneAmp PCR system 9700, Applied Biosystems, Waltham, MA, USA) and prepare a PCR master mix following the volumes in Table 5.
- Load 18 μL of the PCR master mix in a PCR plate and 2 μL of cDNA, seal the plate using adhesive PCR plate seals.
- Determine gene expression using the StepOne Plus PCR system (or similar instrument) using TaqMan fast settings in Table 6.
- Determine gene expression using a relative standard curve, comparative threshold cycle, or other methods [21].
2.8. Protein Extraction and Western Blot Analysis
- Place 10 mL DPBS, 1 mL cell lysis buffer with 1 mM PMSF (Thermo Scientific, Waltham, MA, USA), two 1.5 mL microcentrifuge tube, 1 mL syringe, 25-gauge syringe, and microcentrifuge tube on ice.
- Remove four Ibidi slides and place them on ice.
- All the extraction steps must be performed on ice to prevent protein degradation.
- Wash the slides three times with 100 μL of DPBS.
- After the third wash, do not remove the DPBS until ready to lyse the cells.
- Remove the DPBS from the slide, add 200 μL of cold Cell Signaling’s cell lysis buffer with PMSF, and incubate for 5 min.
- Use the syringe to remove any bubbles that may form inside the slide.
- Connect the syringe to one of the slide’s columns and shear out the cells.
- Remove the DPBS from the next slide, add the lysed cells inside the syringe, and repeat steps 4 and 5.
- Once the contents from all four slides are collected, place the lysed cells in the 1.5 mL microcentrifuge tube.
- Attach the 20-gauge needle to the syringe and pass the entire cell lysate 10 times.
- Pass the lysate slowly to avoid excessive bubble formation.
- Centrifuge the lysate at 14,000× g, 4 °C for 10 min to pellet the cells.
- Collect the supernatant in the remaining microcentrifuge tube and proceed to assess the protein concentration or freeze the sample.
- Use a BCA assay or other protein concentration assay.
- The sample can be stored at −20 °C for up to one week.
- Prepare the Mini-PROTEAN electrophoresis (Biorad, Hercules, CA, USA) system.
- Place the precast gel into the cassette.
- Add tris, glycine, SDS buffer (Fisher Scientific, Hampton, NH, USA) accordingly.
- Dilute the protein sample to load 30 μg in each gel well.
- Use Licor’s 4X protein sample loading buffer with 1M DTT.
- Run the electrophoresis system at 150 V for 5 min to clean the precast gel from impurities.
- Load 2 μL of Biorad’s precision plus protein dual color standard in the first well and 30 μL of protein sample in the remaining wells.
- Run the electrophoresis system at 50 V for about 2.5 h, until the proteins separate and reach the bottom of the gel.
- Stop the current, remove and disassemble the cassette, rinse the gel, and place it in the transfer pack.
- Place the transfer pack in the trans-blot turbo system and transfer the proteins to the PVDF membrane.
- Use the presets “turbo” and “1 mini TGX”
- Block the membrane in a black incubation box, using the Licor’s intercept (TBS) blocking buffer, at room temperature for 2 h on a shaker set at 130 revolutions per minute (RPM).
- The membrane must be completely covered by blocking buffer and free of bubbles.
- After blocking, remove the blocking buffer and incubate the membrane in primary antibody overnight at 4 °C on a shaker (Pro 30 Reciprocal Laboratory Shaker, Labnet, Edison, NJ, USA) set at 130 RPM.
- eNOS recommended dilution is 1:1000 for Western blot.
- The primary antibody is prepared with blocking buffer.
- After incubation with primary antibody, wash the membrane three times using TBS (Fisher Scientific, Hampton, NH, USA).
- After washing, incubate the membrane in Licor’s IRDye 800 fluorescent secondary antibody at room temperature for 2 h, protected from light.
- The recommended dilution for IRDye 800 is 1:15,000.
- After incubation with secondary antibody, wash the membrane three times with TBS and scan the membrane using a near-infrared fluorescent scanner (Odyssey DLx, Licor, Lincon, LE, USA).
- The membrane can be stored in TBS at 4 °C for two weeks or dried for long-term storage.
- Repeat steps 19–22 for incubation with loading control antibody.
3. Results
3.1. Protein Detection Using ICC
3.2. Gene Expression Analysis
3.3. Protein Expression
4. Discussion
5. Conclusions
Supplementary Materials
Author Contributions
Funding
Institutional Review Board Statement
Informed Consent Statement
Data Availability Statement
Acknowledgments
Conflicts of Interest
References
- Cahill, P.A.; Redmond, E.M. Vascular endothelium–gatekeeper of vessel health. Atherosclerosis 2016, 248, 97–109. [Google Scholar] [CrossRef]
- Radomski, M.W.; Moncada, S. Regulation of vascular homeostasis by nitric oxide. Thromb. Haemost. 1993, 70, 36–41. [Google Scholar] [CrossRef] [PubMed]
- Sandoo, A.; van Zanten, J.J.; Metsios, G.S.; Carroll, D.; Kitas, G.D. The endothelium and its role in regulating vascular tone. Open Cardiovasc. Med. J. 2010, 4, 302. [Google Scholar] [CrossRef]
- Zhang, W.; Huang, Q.; Zeng, Z.; Wu, J.; Zhang, Y.; Chen, Z. Sirt1 inhibits oxidative stress in vascular endothelial cells. Oxidative Med. Cell. Longev. 2017, 2017, 7543973. [Google Scholar] [CrossRef] [PubMed]
- Sessa, W.C. eNOS at a glance. J. Cell Sci. 2004, 117, 2427–2429. [Google Scholar] [CrossRef]
- Böhm, F.; Pernow, J. The importance of endothelin-1 for vascular dysfunction in cardiovascular disease. Cardiovasc. Res. 2007, 76, 8–18. [Google Scholar] [CrossRef]
- Mussbacher, M.; Schossleitner, K.; Kral-Pointner, J.B.; Salzmann, M.; Schrammel, A.; Schmid, J.A. More than just a monolayer: The multifaceted role of endothelial cells in the pathophysiology of atherosclerosis. Curr. Atheroscler. Rep. 2022, 24, 483–492. [Google Scholar] [CrossRef]
- Medina-Leyte, D.J.; Domínguez-Pérez, M.; Mercado, I.; Villarreal-Molina, M.T.; Jacobo-Albavera, L. Use of human umbilical vein endothelial cells (HUVEC) as a model to study cardiovascular disease: A review. Appl. Sci. 2020, 10, 938. [Google Scholar] [CrossRef]
- Li, Y.-S.J.; Haga, J.H.; Chien, S. Molecular basis of the effects of shear stress on vascular endothelial cells. J. Biomech. 2005, 38, 1949–1971. [Google Scholar] [CrossRef]
- Gurovich, A.N.; Rodriguez, L.; Gomez, M.; Caraveo, P. Imaging ultrasound assessment of exercise-induced endothelial shear stress of the brachial and carotid arteries. Cardiopulm. Phys. Ther. J. 2021, 32, 30–36. [Google Scholar] [CrossRef]
- Amador, M.; Huerta, J.A.; Garcia, M.A.; Conde, D.A.; Gurovich, A.N. In Vitro Exercise-Induced Endothelial Shear Stress Protects the Vascular Endothelium. Cardiopulm. Phys. Ther. J. 2023, 34, 81–86. [Google Scholar] [CrossRef]
- Conde, D.; Garcia, M.A.; Gomez, M.; Gurovich, A.N. Exercise-Induced Shear Stress Drives mRNA Translation In Vitro. Curr. Issues Mol. Biol. 2024, 46, 9895–9905. [Google Scholar] [CrossRef]
- Montalvo, S.; Gomez, M.; Lozano, A.; Arias, S.; Rodriguez, L.; Morales-Acuna, F.; Gurovich, A.N. Differences in blood flow patterns and endothelial shear stress at the carotid artery using different exercise modalities and intensities. Front. Physiol. 2022, 13, 857816. [Google Scholar] [CrossRef]
- Gurovich, A.N.; Rodriguez, L.; Morales-Acuna, F. There are no differences in brachial artery endothelial shear stress and blood flow patterns between males and females during exercise. Clin. Physiol. Funct. Imaging 2021, 41, 471–479. [Google Scholar] [CrossRef]
- Andrews, A.M.; Jaron, D.; Buerk, D.G.; Kirby, P.L.; Barbee, K.A. Direct, real-time measurement of shear stress-induced nitric oxide produced from endothelial cells in vitro. Nitric Oxide 2010, 23, 335–342. [Google Scholar] [CrossRef]
- Bodin, P.; Burnstock, G. Increased release of ATP from endothelial cells during acute inflammation. Inflamm. Res. 1998, 47, 351–354. [Google Scholar] [CrossRef] [PubMed]
- Balady, G.J.; Arena, R.; Sietsema, K.E.; Myers, J.; Coke, L.A.; Fletcher, G.F.; Forman, D.E.; Franklin, B.A.; Guazzi, M.; Gulati, M.; et al. Clinician’s guide to cardiopulmonary exercise testing in adults: A scientific statement from the American Heart Association. Circulation 2010, 122, 191–225. [Google Scholar] [CrossRef] [PubMed]
- Ozemek, C.; Bonikowske, A.; Christle, J.; Gallo, P. ACSM’s Guidelines for Exercise Testing and Prescription; Lippincott Williams Wilkins: Ambler, PA, USA, 2025. [Google Scholar]
- Scientific, T.F. Cell Culture Basics Handbook; Thermo Fisher Scientific Inc.: Waltham, MA, USA, 2016. [Google Scholar]
- ATCC. Primary Cell Culture Guide; ATCC: Manassas, WV, USA, 2014. [Google Scholar]
- Rao, X.; Huang, X.; Zhou, Z.; Lin, X. An improvement of the 2^(–delta delta CT) method for quantitative real-time polymerase chain reaction data analysis. Biostat. Bioinform. Biomath. 2013, 3, 71. [Google Scholar]
- Urbich, C.; Walter, D.H.; Zeiher, A.M.; Dimmeler, S. Laminar shear stress upregulates integrin expression: Role in endothelial cell adhesion and apoptosis. Circ. Res. 2000, 87, 683–689. [Google Scholar] [CrossRef]
- Dimmeler, S.; Assmus, B.; Hermann, C.; Haendeler, J.; Zeiher, A.M. Fluid shear stress stimulates phosphorylation of Akt in human endothelial cells: Involvement in suppression of apoptosis. Circ. Res. 1998, 83, 334–341. [Google Scholar] [CrossRef]
- Davis, M.J.; Earley, S.; Li, Y.S.; Chien, S. Vascular mechanotransduction. Physiol. Rev. 2023, 103, 1247–1421. [Google Scholar] [CrossRef] [PubMed]

| Reagent | Manufacturer | Catalog No. |
|---|---|---|
| MesoEndo Cell Growth Medium | Cell Applications (San Diego, CA, USA) | 211-500 |
| Human Umbilical Vein Endothelial Cell (HUVEC) | Cell Applications | 200-05n |
| Ibidi μ-Slide with IbiTreat | Ibidi (Fitchburg, WI, USA) | 80166 |
| Yellow-Green Perfusion Set | Ibidi | 10964 |
| eNOSp | Fisher Scientific (Hampton, NH, USA) | BP1600-100 |
| Alexa Fluor 488 | Invitrogen (Waltham, MA, USA) | A11094 |
| RNeasy Micro Kit | Qiagen (Germantown, MD, USA) | 74004 |
| High-Capacity cDNA Reverse Transcription Kit | Applied Biosystems (Waltham, MA, USA) | 43-688-14 |
| TaqMan Fast Advanced Master Mix | Applied Biosystems | 44-445-56 |
| Cell Lysis Buffer | Cell signaling (Danvers, MA, USA) | 9803 |
| 4X Protein sample loading buffer | Licor (Lincoln, NE, USA) | 928-40004 |
| 4–15% Mini-PROTEAN TGX Precast Protein Gels | Biorad (Hercules, CA, USA) | 4561083 |
| Precision Plus Protein Dual Color Standards | Biorad | 1610374 |
| Trans-Blot Turbo Mini PVDF Transfer Packs | Biorad | 1704156 |
| Intercept (TBS) Blocking Buffer | Licor | 927-60001 |
| eNOS Primary Antibody | Abcam (Waltham, MA, USA) | EPR23750-3 |
| IRDye 800 | Licor | 926-32210 |
| Equipment | Manufacturer |
|---|---|
| TrueOne 2400 | Parvo Medics (Salt Lake City, UT, USA) |
| H10 Heart Rate Sensor | Polar (Lake Success, NY, USA) |
| Lactate Plus Meter | Nova (Waltham, MA, USA) |
| StepOne Plus PCR Real-Time System | Applied Biosystems |
| Mini PROTEAN Tetra Cell Electrophoresis System | Biorad |
| Trans-Blot Turbo Transfer System | Biorad |
| Odyssey DLX Imager | Licor |
| Component | Volume (μL) |
|---|---|
| 10X RT Buffer | 2.0 |
| 25X dNTP Mix (100 mM) | 0.8 |
| 10X RT Random Primers | 2.0 |
| Multiscribe Reverse Transcriptase | 1.0 |
| Nuclease-free Water | 4.2 |
| Total for One Reaction | 10.0 |
| Segment Number | Number of Cycles | Temperature (°C) | Time |
|---|---|---|---|
| 1 | 1 | 25 | 10 min |
| 2 | 1 | 37 | 120 min |
| 3 | 1 | 85 | 5 min |
| 4 | 1 | 4 | ∞ |
| Component | Volume (μL) |
|---|---|
| 2X TaqMan Fast Advanced Master Mix | 10 |
| 20X TaqMan Assay | 1.0 |
| Nuclease-free Water | 7.0 |
| Total for One Reaction | 18.0 |
| Segment Number | Number of Cycles | Temperature (°C) | Time |
|---|---|---|---|
| 1 | 1 | 50 | 2 min |
| 2 | 1 | 90 | 20 s |
| 3 | 40 | 95 | 1 s |
| 60 | 20 s |
Disclaimer/Publisher’s Note: The statements, opinions and data contained in all publications are solely those of the individual author(s) and contributor(s) and not of MDPI and/or the editor(s). MDPI and/or the editor(s) disclaim responsibility for any injury to people or property resulting from any ideas, methods, instructions or products referred to in the content. |
© 2025 by the authors. Licensee MDPI, Basel, Switzerland. This article is an open access article distributed under the terms and conditions of the Creative Commons Attribution (CC BY) license (https://creativecommons.org/licenses/by/4.0/).
Share and Cite
Conde, D.; Gomez, M.; Gurovich, A.N. Quantification of Genes and Proteins Associated with Endothelial Cell Function After Different Exercise-Induced Shear Stress Intensities In Vitro. Biology 2025, 14, 1189. https://doi.org/10.3390/biology14091189
Conde D, Gomez M, Gurovich AN. Quantification of Genes and Proteins Associated with Endothelial Cell Function After Different Exercise-Induced Shear Stress Intensities In Vitro. Biology. 2025; 14(9):1189. https://doi.org/10.3390/biology14091189
Chicago/Turabian StyleConde, Daniel, Manuel Gomez, and Alvaro N. Gurovich. 2025. "Quantification of Genes and Proteins Associated with Endothelial Cell Function After Different Exercise-Induced Shear Stress Intensities In Vitro" Biology 14, no. 9: 1189. https://doi.org/10.3390/biology14091189
APA StyleConde, D., Gomez, M., & Gurovich, A. N. (2025). Quantification of Genes and Proteins Associated with Endothelial Cell Function After Different Exercise-Induced Shear Stress Intensities In Vitro. Biology, 14(9), 1189. https://doi.org/10.3390/biology14091189


