Article

Phylogenetic Reassessment of Murinae Inferred from the Mitogenome of the Monotypic Genus Dacnomys Endemic to Southeast Asia: New Insights into Genetic Diversity Erosion

Yunnan Provincial Key Laboratory for Zoonosis Control and Prevention, Institute of Pathogens and Vectors, Dali University, Dali 671000, China
*
Authors to whom correspondence should be addressed.
Biology 2025, 14(8), 948; https://doi.org/10.3390/biology14080948
Submission received: 5 June 2025 / Revised: 12 July 2025 / Accepted: 16 July 2025 / Published: 28 July 2025
(This article belongs to the Section Genetics and Genomics)

Simple Summary

Millard’s rat, a rare mountain forest rodent in Southeast Asia, faces endangerment due to unclear evolutionary features and genetic diversity loss. Using morphological traits and complete mitochondrial DNA decoding for the first time, we discovered the following: (1) its closest relative is Leopoldamys rats, splitting 4.8 million years ago; (2) populations show critically low genetic variation, driven by three influencing factors: evolutionary constraints limiting mutations, forest loss fragmenting habitats (>20,000 km2/year since 2000), and ecological specialization reducing adaptability; (3) this requires reclassifying Micromys rats in the Murinae phylogenetic relationships. Urgent conservation actions are proposed: protect core forest habitats to halt genetic decline and upgrade the species to “Near Threatened” on the IUCN Red List.

Abstract

The Millard’s rat (Dacnomys millardi), a threatened murid endemic to Southeast Asian montane rainforests and the sole member of its monotypic genus, faces escalating endangered risks as a Near Threatened species in China’s Biodiversity Red List. This ecologically specialized rodent exhibits diagnostic morphological adaptations—hypertrophied upper molars and cryptic pelage—that underpin niche differentiation in undisturbed tropical/subtropical forests. Despite its evolutionary distinctiveness, the conservation prioritization given to Dacnomys is hindered due to a deficiency of data and unresolved phylogenetic relationships. Here, we integrated morphological analyses with the first complete mitogenome (16,289 bp in size; no structural rearrangements) of D. millardi to validate its phylogenetic placement within the subfamily Murinae and provide novel insights into genetic diversity erosion. Bayesian and maximum likelihood phylogenies robustly supported Dacnomys as sister to Leopoldamys (PP = 1.0; BS = 100%), with an early Pliocene divergence (~4.8 Mya, 95% HPD: 3.65–5.47 Mya). Additionally, based on its basal phylogenetic position within Murinae, we propose reclassifying Micromys from Rattini to the tribe Micromyini. Codon usage bias analyses revealed pervasive purifying selection (Ka/Ks < 1), constraining mitogenome evolution. Genetic diversity analyses showed low genetic variation (CYTB: π = 0.0135 ± 0.0023; COX1: π = 0.0101 ± 0.0025) in fragmented populations. We propose three new insights into this genetic diversity erosion. (1) Evolutionary constraints: genome-wide evolutionary conservation and shallow evolutionary history (~4.8 Mya) limited mutation accumulation. (2) Anthropogenic pressures: deforestation-driven fragmentation of habitats (>20,000 km2/year loss since 2000) has reduced effective population size, exacerbating genetic drift. (3) Ecological specialization: long-term adaptation to stable niches favored genomic optimization over adaptive flexibility. These findings necessitate suitable conservation action by enforcing protection of core habitats to prevent deforestation-driven population collapses and advocating IUCN reclassification of D. millardi from Data Deficient to Near Threatened.

1. Introduction

The Millard’s rat (Dacnomys millardi Thomas, 1916), the sole extant species of the monotypic genus Dacnomys (Rodentia: Muridae), represents an evolutionarily distinct lineage within the Southeast Asia biodiversity hotspot. Its disjunct distribution spans from eastern Nepal and northeastern India (type locality: Darjeeling, West Bengal) to northern Laos and northwestern Vietnam [1], with isolated populations recently documented in southern Vietnam [2] and China’s Yunnan-Tibet border region [3]. This fragmented distribution range and rarity of D. millardi suggest it has specific ecological requirements that are met only in pristine habitats [1,4]. Its diet, consisting of plant seeds, roots, stems, and buds [4], indicates a role in seed dispersal and potentially in shaping plant community structure [5]. The species is restricted to undisturbed tropical/subtropical montane rainforests at 500–3500 m elevation [1,4]. This limited distribution range coincides with reduced effective population sizes and accelerating habitats loss—synergistic drivers of its Near Threatened status in China’s Biodiversity Red List [6], despite its IUCN Data Deficient classification [7]. The absence of this species in disturbed areas [1], combined with the threat of deforestation [8], underscores its dependency on a healthy ecosystem. Thus, this species is not only an indicator of ecosystem health but also plays a part in sustaining the ecological processes vital for a balanced environment. However, Southeast Asia’s tropical forests exhibit the world’s highest deforestation rates (annual loss exceeding 20,000 km2 since 2000) [8,9], a critical threat compounded by D. millardi’s absence in disturbed habitats [1], reflecting low ecological plasticity and heightened population vulnerability.
Persistent controversies in the subfamily Murinae systematics, particularly regarding the phylogenetic position of Micromys (Dehne, 1841), stem from two critical limitations: (1) the absence of genomic data for key lineages, hindering precise estimation of phylogeny and divergence times; (2) overreliance on short gene fragments [e.g., cytochrome b (CYTB), retinol binding protein 3 (RBP3), growth hormone receptor (GHR)] [10] or morphological traits in taxonomic studies [11]. In contrast, complete mitogenomes provide unequivocal evidence of a conserved order of homologous genes over hundreds of millions of years and enhanced resolution to resolve evolutionary relationships among closely related species [12,13]. Those with elevated substitution rates (~4.8 × 10⁻⁸ substitutions/site/year) [14], and reduced recombination—offer superior phylogenetic sensitivity for rodent clades [15,16]. Hence, the past decade has witnessed a paradigm shift in mammalian phylogenetics, with researchers increasingly prioritizing complete mitogenome sequencing over analyses of single nuclear loci or partial mitochondrial DNA fragments [17,18,19,20].
Notably, mitogenomic datasets have played a pivotal role in clarifying contentious branching patterns among placental mammal orders, contributing critical molecular evidence that solidified several previously debated clades [21,22]. Rodent recent studies exemplified this progression: İbiş et al. (2020) [23] addressed the unresolved phylogenetic position of Prometheomys schaposchnikowi (Satunin, 1901) by sequencing its complete mitogenome and integrating 58 Arvicolinae mitogenomic sequences. Yu et al. (2022) [24] reconstructed the Holocene dispersal dynamics of the invasive black rat (Rattus rattus Linnaeus, 1758) via ancient genomic approaches, combining a de novo reference genome with 103 mitogenomes and 39 nuclear genomes from 1st–17th centuries CE specimens across Europe and North Africa. These attributes position mitogenomes as robust phylogenetic markers for resolving relationships across taxonomic ranks. Additionally, Liu et al. (2025) [25] reconstructed phylogeny and evolutionary history of Murinae through integration of four newly sequenced Vernaya (Anthony, 1941) mitogenomes alongside 36 published Murinae mitogenomes and 17 CYTB sequences, thereby validating the new tribe Vernayaini (Liu, Zhao, Liu & Chen, tribe nov.). However, although the complete mitogenomes provided enhanced phylogenetic resolution through their comprehensive nucleotide data, enabling robust inferences of evolutionary relationships at both shallow and deep taxonomic scales [26,27,28], we note the limitations of mitogenomic analyses, particularly methodological constraints including in-complete lineage sorting, introgression artifacts, and hybridization signals [26,29], and its restricted representation of genome-wide evolutionary processes.
While early studies proposed the delineation of distinct subspecies (D. m. wroughtoni Thomas, 1922; D. m. ingens Osgood, 1932), which is inconsistent with the current taxonomic system of D. millardi as a monotypic species [1,3,4,6,30]. Research on the poorly studied genus Dacnomys has been severely limited due to its narrow distribution, small effective population size, and apparent absence from disturbed rainforests [1,6]. Prior to 2012, the phylogenetic position of Dacnomys remained unresolved, the earliest studies on the phylogenetic framework for Dacnomys primarily focused on limited genetic markers: Mitochondrial genes (CYTB, COX1) were investigated by Balakirev et al. (2012) [31]. Steppan et al. (2017) [10] first established its placement within the Rattini tribe using single genes (CYTB, RBP3, GHR), demonstrating a close evolutionary relationship between Dacnomys and Niviventer (Marshall, 1976). Subsequently, Abramov et al. (2017) [2] expanded the known distribution of the genus through new records in southern Vietnam and conducted a comprehensive morphological and genetic analysis of population-level variation using extensive museum specimens. Notably, no study has yet comprehensively employed complete mitogenome data to elucidate the phylogenetic relationships and refine divergence time estimation of D. millardi. This gap considerably impeded a comprehensive understanding of its taxonomic variation, evolutionary rate dynamics, and biodiversity patterns. Additionally, limited cranial differentiation and low genetic diversity (CYTB difference not exceeding 0.023) across populations suggested that synergistic effects of evolutionary constraints and anthropogenic pressures underpin its genetic homogeneity [2]. However, the factors driving this homogeneity warrant further elucidation. This study integrated morphological characterization with the first complete mitogenome of Dacnomys to validate its phylogenetic placement and reassess Murinae taxonomy. By analyzing mitogenome structural conservation, habitats fragmentation, and evolutionary histories, we explored potential influencing factors contributing to its genetic diversity erosion. Our findings underscored the urgent need for habitats conservation and genetic management of this threatened lineage while advancing understanding of evolutionary constraints shaping biodiversity in anthropogenically fragmented landscapes.

2. Materials and Methods

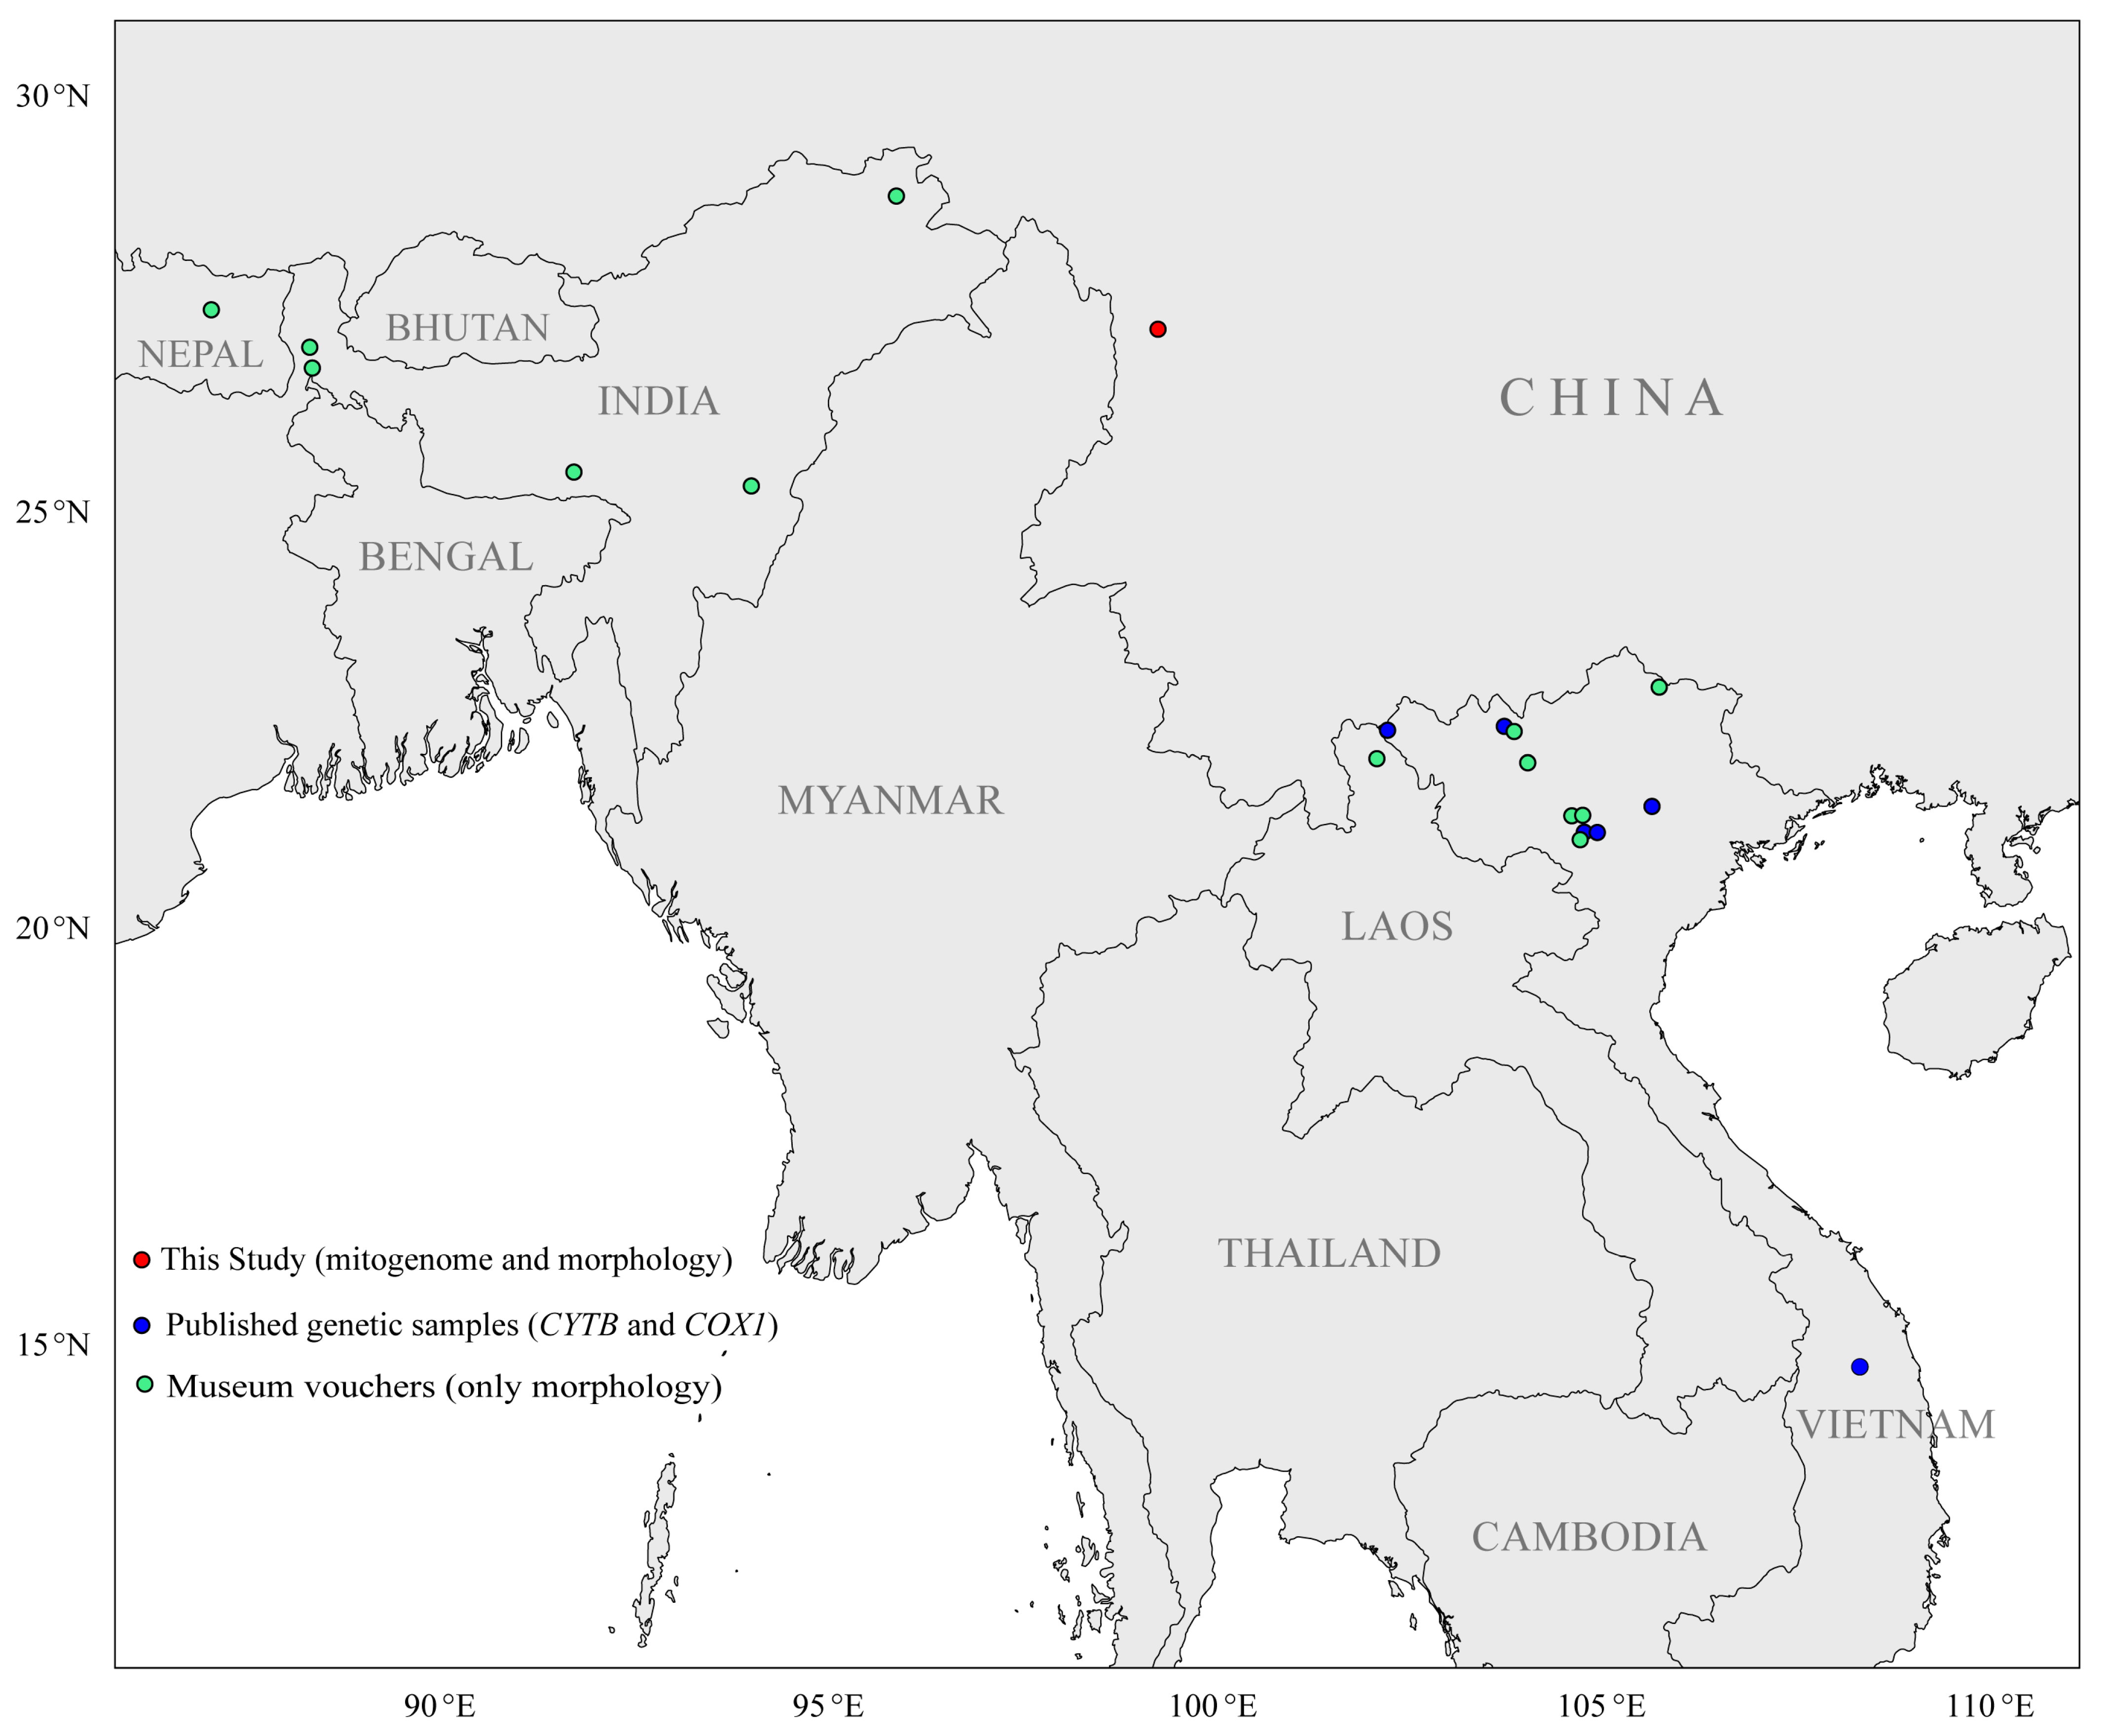
2.1. Specimen Collection and Identification, DNA Extraction and Sequencing

Two adult D. millardi individuals were collected from montane rainforests in Weixi Lisu Autonomous County, Yunnan Province, China (27.18° N, 99.28° E; 3000 m a.s.l.). Field coordinates, elevation, and vegetation type were georeferenced for each specimen. Standard morphometric parameters—body mass (g), head-body length (mm), tail length (mm), hindfoot length (mm), and ear length (mm)—were recorded in situ. The species distribution map integrated georeferenced occurrence records from Abramov et al. (2017) [2] with documented distribution ranges in Wei et al. (2022) [3] and Wilson et al. (2017) [1] (Location information: Table S1, Figure 1). Spatial visualization was performed in R v4.3.1 using the rnaturalearth v1.0.1 package with the World Geodetic System 1984 (WGS84) coordinate reference system. Specimens with intact craniodental features and undamaged pelage were preserved as vouchers following the Animal Ethics Committee guidelines. The specimens (voucher IDs: E420001, E420002) were deposited in the Institute of Pathogens and Vectors, Dali University (Dali, China). Tissue samples (muscle, liver, spleen) were excised under sterile conditions, preserved in 95% ethanol, and stored at –80 °C. Specimen identification was confirmed by cranial morphology and CYTB barcoding (primers L14725_hsw1: 5′-ATGACATGAAAAATCATCGTTGT-3′; H15915_hsw1: 5′-TCYCC ATTTCTGGTTTACAAGACC-3′) [32], with taxonomic references to Wei et al. (2022) [3] and Wilson et al. (2017) [1].
Total genomic DNA was extracted from ethanol-preserved muscle tissue using the DNeasy Blood and Tissue Kit (QIAGEN, Redwood City, CA, USA). Libraries with 300–500 bp inserts were prepared using the Illumina TruSeq Nano DNA Kit (Illumina, San Diego, CA, USA) and sequenced on an Illumina NovaSeq 6000 platform (2 × 150 bp PE; >100× coverage) [33] by Shanghai Winnerbio Technology Co., Ltd. (Shanghai, China).

2.2. Sequence Assembly and Annotation

Raw sequencing reads were quality-filtered using FastQC v0.20.1 [34] with Phred scores ≥ 36. De novo assembly of the D. millardi mitogenome was performed by a dual-pipeline approach: (1) MITOZ v2.3 [35] for seed-based iterative extension, and (2) Geneious Prime v11.1.5 [36] for reference-guided alignment (NCBI Murinae mitogenomes as templates). Assembly confidence was validated via BWA v0.7.17 [37] read mapping and SAMtools v0.1.20 [38] depth analysis, achieving ≥ 100× coverage to ensure single-base accuracy (error rate < 0.01%).
Gene annotation combined automated and manual curation. (1) Structural annotation: protein-coding genes (PCGs), ribosomal RNAs (rRNAs), transfer RNAs (tRNAs), and control regions (D-loop) were identified using MITOS2 with the vertebrate genetic code [39]. (2) tRNAs validation: tRNAs genes were predicted using tRNAscan-SE v2.0 [40], ARWEN v1.2 [41], and manual covariance models. (3) Manual refinement: annotations were cross-validated against NCBI Murinae homologs (BLASTn E-value < 1 × 10⁻¹⁰) and adjusted for conserved start/stop codons. The circular mitogenome map was visualized using OGDRAW v1.3.1 [42] with default parameters.

2.3. Sequence Analyses, Genetic Diversity and Morphological Visualization

The molecular analyses integrated novel and published data. We newly sequenced a complete mitogenome from one D. millardi specimen (voucher ID: E420001; GenBank accession: PQ359525), which was combined with 18 published mitochondrial DNA sequences from Abramov et al. (2017) [2] [nine CYTB and nine cytochrome oxidase subunit 1 (COX1); accessions: Table S2] to re-analyze intraspecific genetic diversity across the distribution range of Dacnomys.
Genetic divergence among populations from southwestern China (this study), northern and southern Vietnam was quantified using Tamura-3-parameter pairwise distances for the CYTB gene [43], selected for its evolutionary clock consistency in Murinae [44]. Intraspecific genetic diversity was quantified through haplotype diversity (Hd), nucleotide diversity (π), and Tajima’s D statistics in DnaSP v6.12.03 [45] for the mitochondrial genes CYTB and COX1. Statistical significance for Tajima’s D was defined as |D| > 2.0 [46], with neutrality tests conducted under an infinite-sites model [47].
Nucleotide composition and codon usage bias of the D. millardi mitogenome were analyzed in MEGA v11.0.13 [48] with default parameters. Selection pressure analysis employed DnaSP v6.12.03 [45] to calculate non-synonymous/synonymous substitution ratios (ω = Ka/Ks) of 13 PCGs in the D. millardi mitogenome. Strand asymmetry was reflected by AT- and GC-skew values: AT-skew = (A − T)/(A + T) and GC-skew = (G − C)/(G + C) [49].
Codon usage patterns of the D. millardi mitogenome were characterized by: (1) Relative synonymous codon usage (RSCU) [50], effective number of codons (ENC)-plot analysis [51] and correspondence analysis (COA) [52] of codon frequencies in CodonW [53] (excluding termination codons); (2) neutrality curve (GC12 vs. GC3s) [54] using Python v3.10.12 (with SciPy v1.11.1); (3) parity rule 2 (PR2) [55] plot of purine/pyrimidine bias with R v4.3.1 (via Biostrings 2.68.1 software package).
Morphological visualization of the specimen (voucher IDs: E420001) involved focus-stacked cranial and pelage images captured with a Canon EOS R6 camera system, post-processed in Adobe Photoshop 2023 (v24.7.0) for brightness/contrast normalization (≤5% adjustment) without structural modifications.

2.4. Phylogenetic Reconstruction

A dataset of 68 species and subspecies (16 genera, eight tribes, two subfamilies) in the family Muridae was created from GenBank (Species information: Table S3), supplemented with the newly sequenced D. millardi mitogenome. Two sciurid species (Ratufa bicolor Sparrman, 1778; Pteromys volans Linnaeus, 1758) served as outgroups. 13 PCGs and two rRNAs were extracted and concatenated using PhyloSuite v1.2.3 [56] to generate a protein-coding and ribosomal RNA gene sequence (PCGRNA) matrix. Gene sequences were aligned with MAFFT v7.313 [57] under the G-INS-i algorithm, followed by manual refinement in BioEdit v7.2.5 (https://bioedit.software.informer.com/ (accessed on 5 June 2025)). Ambiguous regions were pruned using Gblocks v0.91 [58] with relaxed parameters. The presence of phylogenetic signal was evaluated with a substitution saturation analysis using the Xia test [59] in the DAMBE v7.3.32 [60] for the whole alignment of the PCGRNA. The test confirmed the absence of significant substitution saturation in PCGRNA, supporting dataset’s reliability for phylogenetic inference (Table S4).
To ensure methodological rigor and topological robustness, we employed two complementary approaches: (1) Bayesian Inference (BI): The concatenated matrix was analyzed in MrBayes v3.2.6 [61] under the best-fit GTR + F + I + G4 model (partitioned by codon in PartitionFinder v2.1.1) [62]. Four independent MCMC runs (1 × 10⁷ generations, sampling every 1000) achieved convergence (average standard deviation of split frequencies < 0.01). The first 25% trees were discarded as burn-in, and a 50% majority consensus tree was generated. (2) Maximum Likelihood (ML): IQ-TREE v2.2.0 [63] implemented the GTR + F + R6 model (partitioned by codon in ModelFinder [64]) with 1000 ultrafast bootstrap replicates. Branch supports were validated via SH-aLRT (threshold: 80%) [65] and UFboot (threshold: 95%) [66]. Final trees were annotated in iTOL v6.8.1 [67] and formatted for publication using Adobe Illustrator 2023 (v27.9.1) without altering topological relationships.

2.5. Divergence Time Estimation

Divergence times were estimated using Bayesian molecular dating in BEAST v2.6.7 [68] under an uncorrelated lognormal relaxed clock model with a Yule speciation prior. Four fossil-calibrated nodes (Table S5) were constrained using lognormal prior following Murinae fossil records from Aghová et al., (2018) [69]. Two independent MCMC runs of 500 million generations each were conducted, sampling parameters and trees every 10,000 generations. Convergence was confirmed in Tracer v1.7.2 [70] through effective sample sizes (ESS > 200 for all parameters) and potential scale reduction factors (PSRF ≈ 1.0) [71]. Post-burnin trees (25% discarded) were combined in LogCombiner v2.6.7 [68] and a maximum clade credibility tree was estimated in TreeAnnotator v2.6.7 [72], retaining nodes with Bayesian posterior probabilities (PP) ≥ 0.95 and maximum likelihood bootstrap supports (BS) ≥ 70% from prior analyses [73,74]. Final chronograms were visualized in TVBOT v2.6.1 [75] with geological timescales standardized from International Commission on Stratigraphy (http://www.stratigraphy.org/ICSchart/ChronostratChart2024-12.pdf (accessed on 5 June 2025)).

3. Results

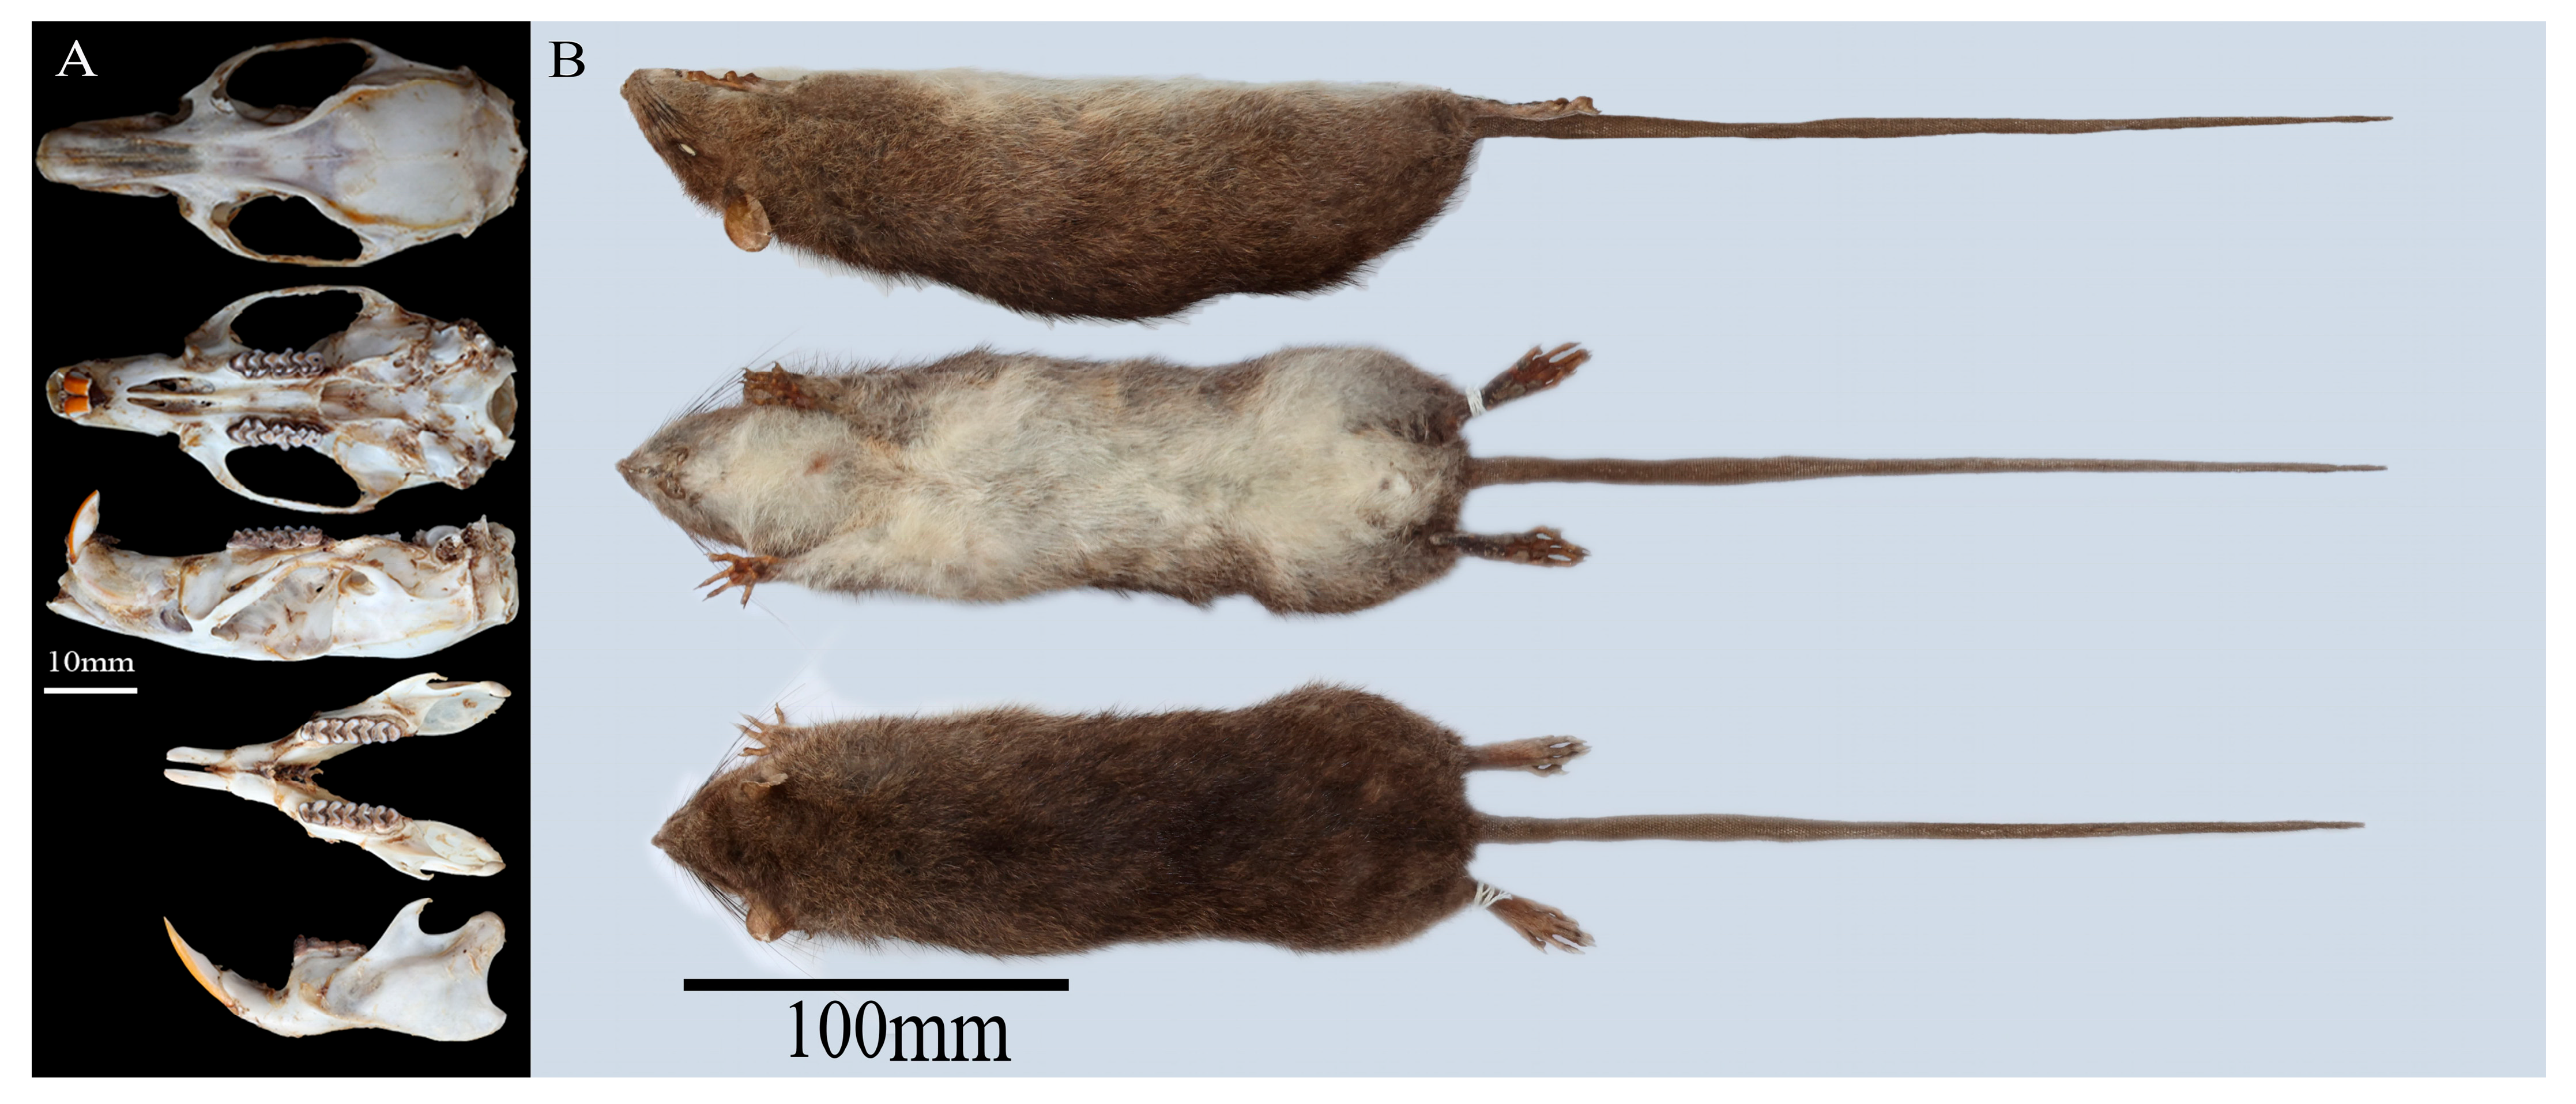
3.1. Morphological Characteristics of D. millardi

The adult female specimen (voucher ID: E420001; body mass: 475.00 g; head-body length: 270.00 mm; tail length: 305.00 mm; hindfoot length: 50.00 mm; ear length: 24.00 mm) exhibited diagnostic morphological traits distinguishing it from sympatric Leopoldamys species (Figure 2 and Table S6). External morphology was characterized by the following: (1) a proportionally elongated tail (112% of head-body length), uniformly pigmented without a terminal tuft; (2) dorsal pelage transitioning from short, grizzled hairs (grayish-brown variegated with subtle light-yellow spots) to ventrolateral white guard hairs; (3) ventral fur bicolored (grayish-brown basal third, dark cream distal two-thirds); (4) cream-colored throat, axillary, and inguinal regions; (5) white plantar surfaces with light-brown dorsal limb pigmentation; and (6) four pairs of mammae arranged in pectoral and inguinal pairs.
Craniodental features included the following: (1) a robust skull (greatest length: 51.63 mm; upper molar row: 11.29 mm) with flattened auditory bullae (10% of cranial length); (2) incisive foramina terminating anterior to the first upper molar; (3) palatal shelf extending posteriorly between the second and third upper molars; and (4) a molar formula of 1.0.0.3/1.0.0.3 = 16, consistent with Myomorpha dental archetype.

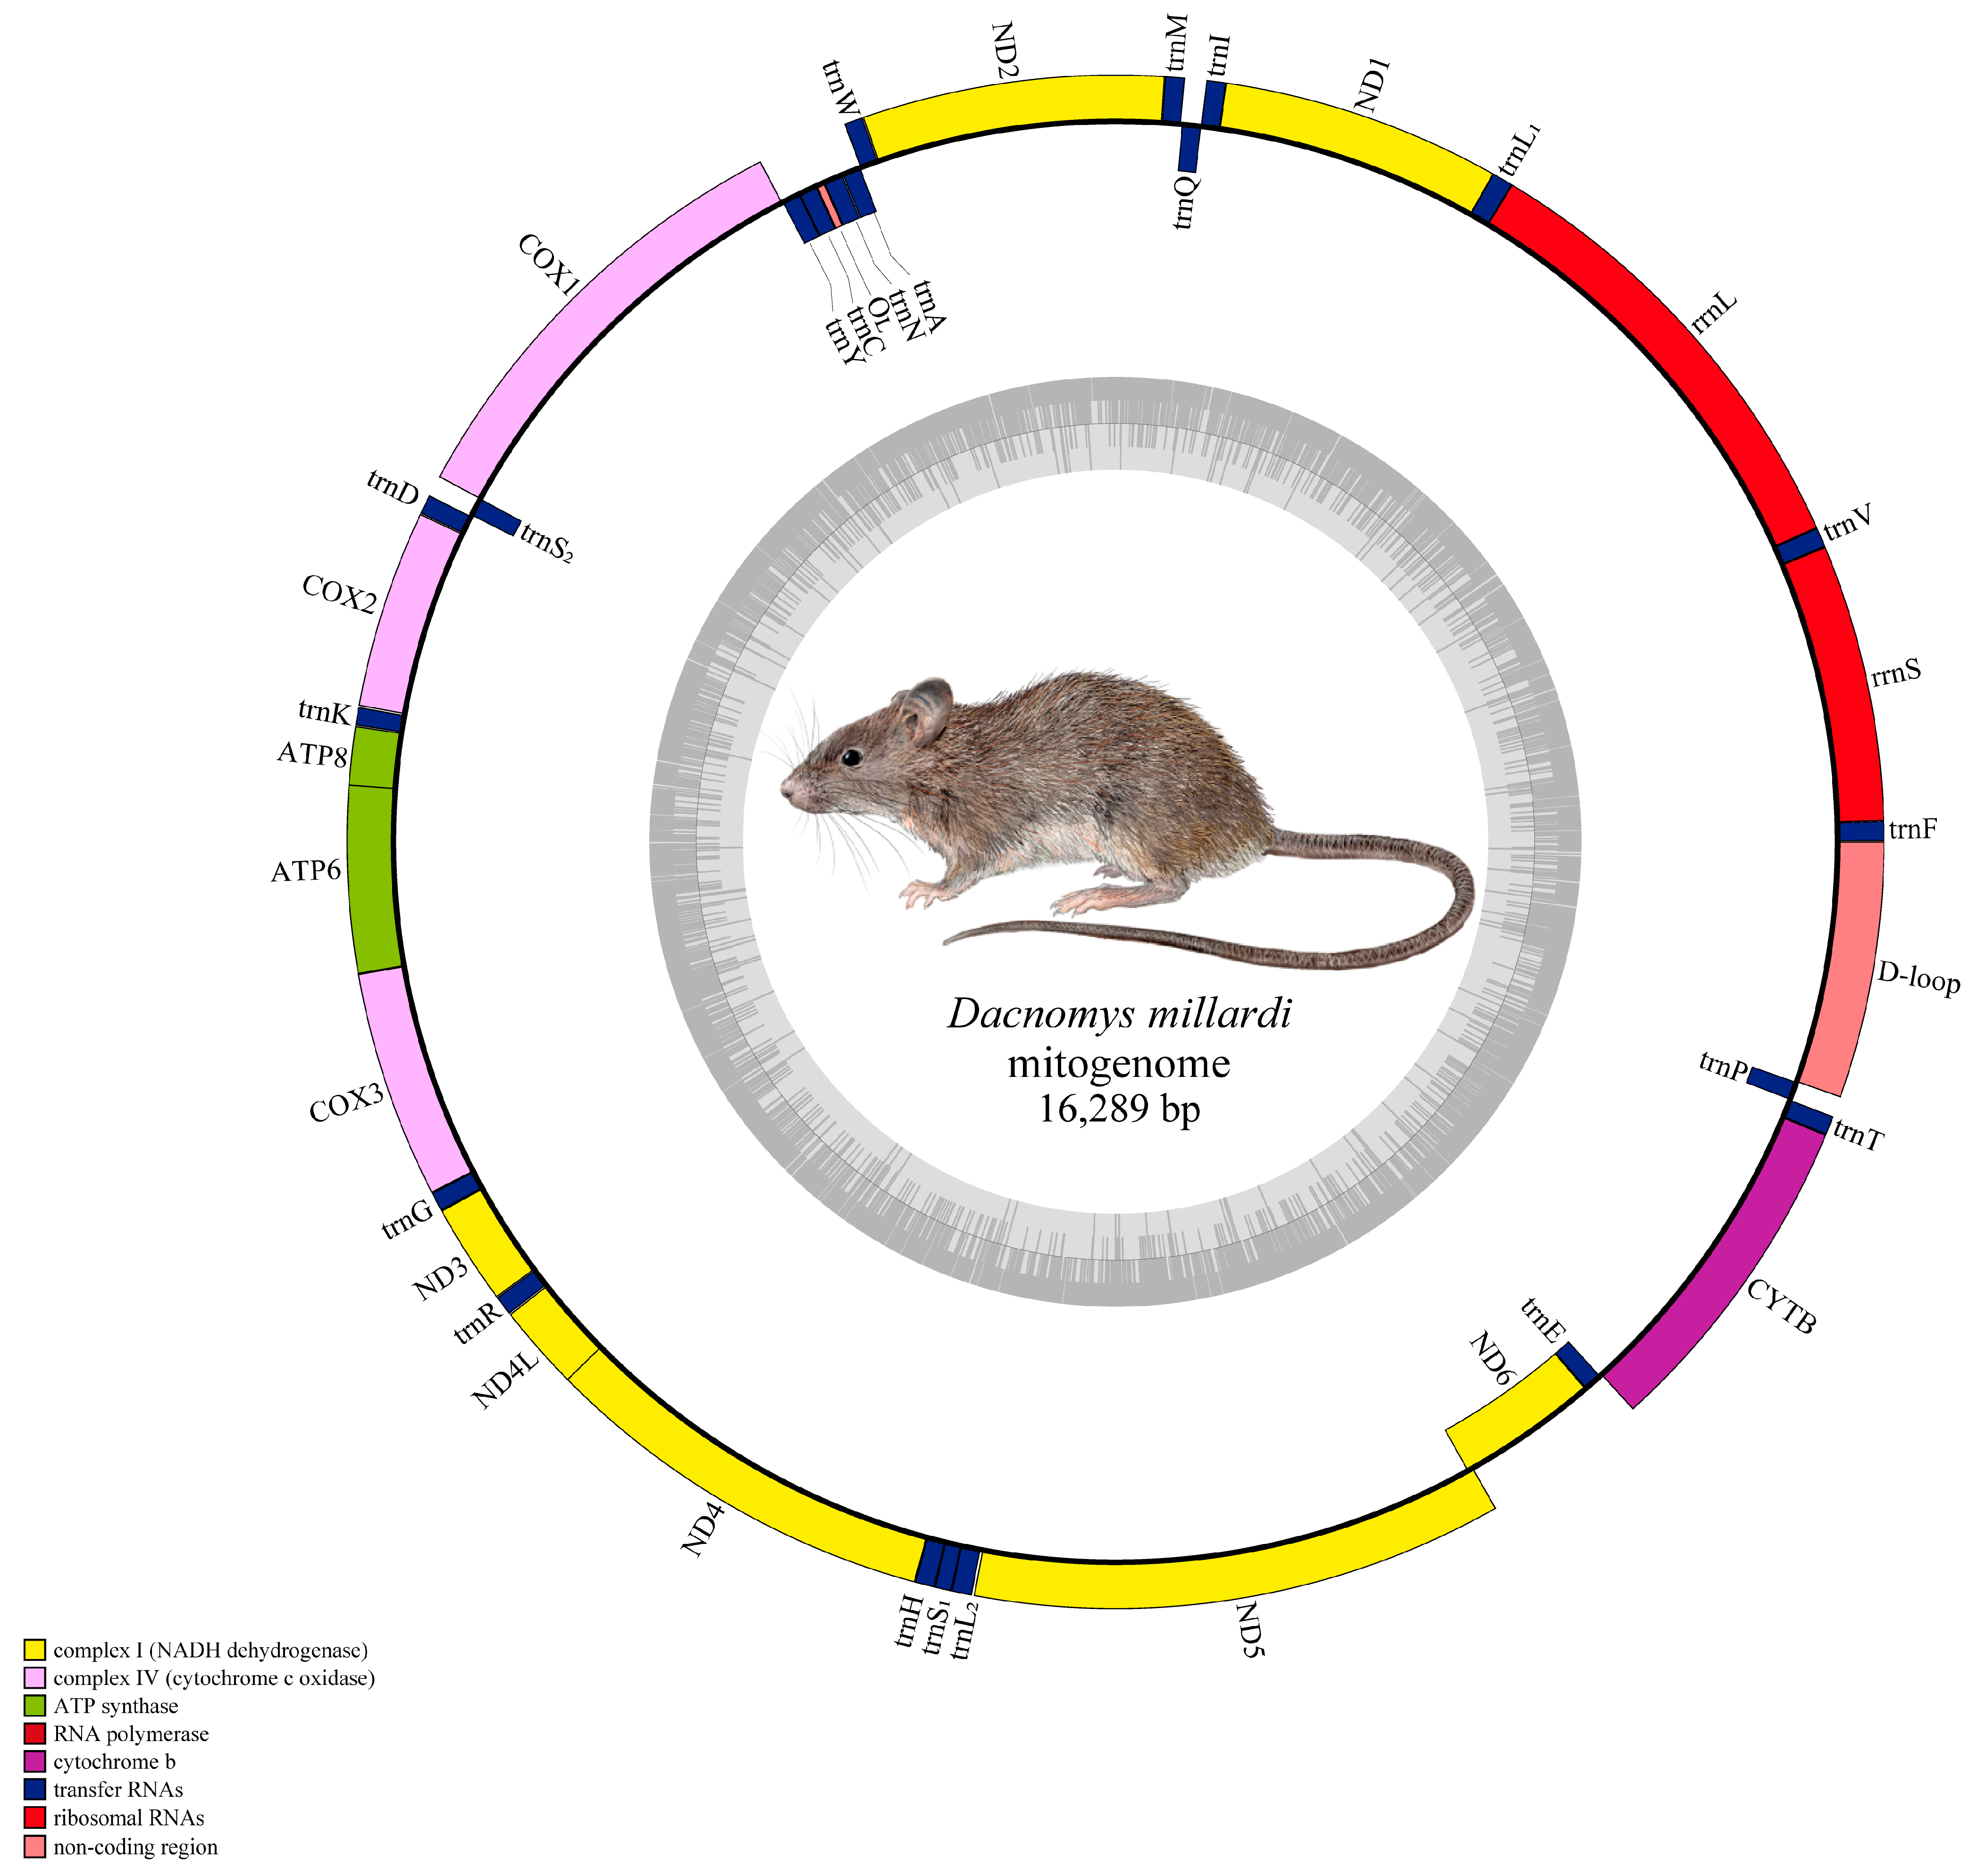
3.2. Mitogenome Architecture of D. millardi

The complete mitogenome of D. millardi (16,289 bp) exhibits typical metazoan organization, comprising 37 genes (13 PCGs, 22 tRNAs, two rRNAs), one non-coding region (D-loop), and a light-strand replication origin (OL) (Figure 3). Genes strand distribution followed the ancestral murid pattern: nine genes (ND6 and eight tRNAs: trnQ, trnA, trnN, trnC, trnY, trnS2, trnE, trnP) were encoded on the light strand, with the remainder on the heavy strand. The D. millardi mitogenome had 10 overlapping regions (1–43 bp), with the longest overlap (43 bp) between ATP8 and ATP6; and 13 intergenic spacers (1–6 bp), the largest (6 bp) located between trnL2 and ND5 (Table 1). Nucleotide composition was AT-biased (62.0% AT; 38.0% GC), with skew values of AT = 0.094 and GC = −0.363 (Table 2). The D-loop (881 bp) spanned trnP to trnF, containing conserved motifs associated with replication initiation. The OL (34 bp) was embedded within the WANCY tRNA cluster (trnW-trnY), forming a stem-loop structure critical for light-strand replication. The 22 tRNAs were interspersed between PCGs and rRNAs, with rrnS and rrnL flanked by trnF and trnL1, separated by trnV.

3.3. tRNAs and rRNAs Structural Features

The mitogenome of D. millardi encoded 22 tRNAs (eight light-strand, 14 heavy-strand) and two rRNAs (rrnS: 954 bp; rrnL: 1576 bp), with rrnS and rrnL positioned between trnF and trnL1 and separated by trnV (Table 1). The tRNA lengths ranged from 59 bp (trnS1) to 75 bp (trnL1) (mean ± SD: 68.32 ± 2.98 bp; Table 1), and all tRNAs were predicted to form canonical cloverleaf structures (Figure 4), except for trnS1 (lacking the dihydrouridine [DHU] arm) and trnK (retaining a 3 bp DHU stem but lacking the DHU loop). The tRNA anticodon usage pattern of D. millardi was identical to the ancestral mammalian lineage. Secondary structure analysis revealed 39 non-Watson–Crick pairings across 20 tRNAs (Figure 4), predominantly involving G-U wobble pairs (29 instances in 14 tRNAs) and mismatches (A-C, U-U, A-A, A-G, C-U; 10 total). Anomalous pairs were detected in amino acid acceptor arms (11 mismatches), DHU arms (nine), TΨC arms (five), and anticodon arms (eight), while trnI and trnL1 displayed perfect Watson–Crick pairings. Conserved DHU stems (2–4 bp) and TΨC stems (5 bp, except for trnW and trnL1 with 4 bp) reflected structural constraints critical for translational fidelity (Figure 4).

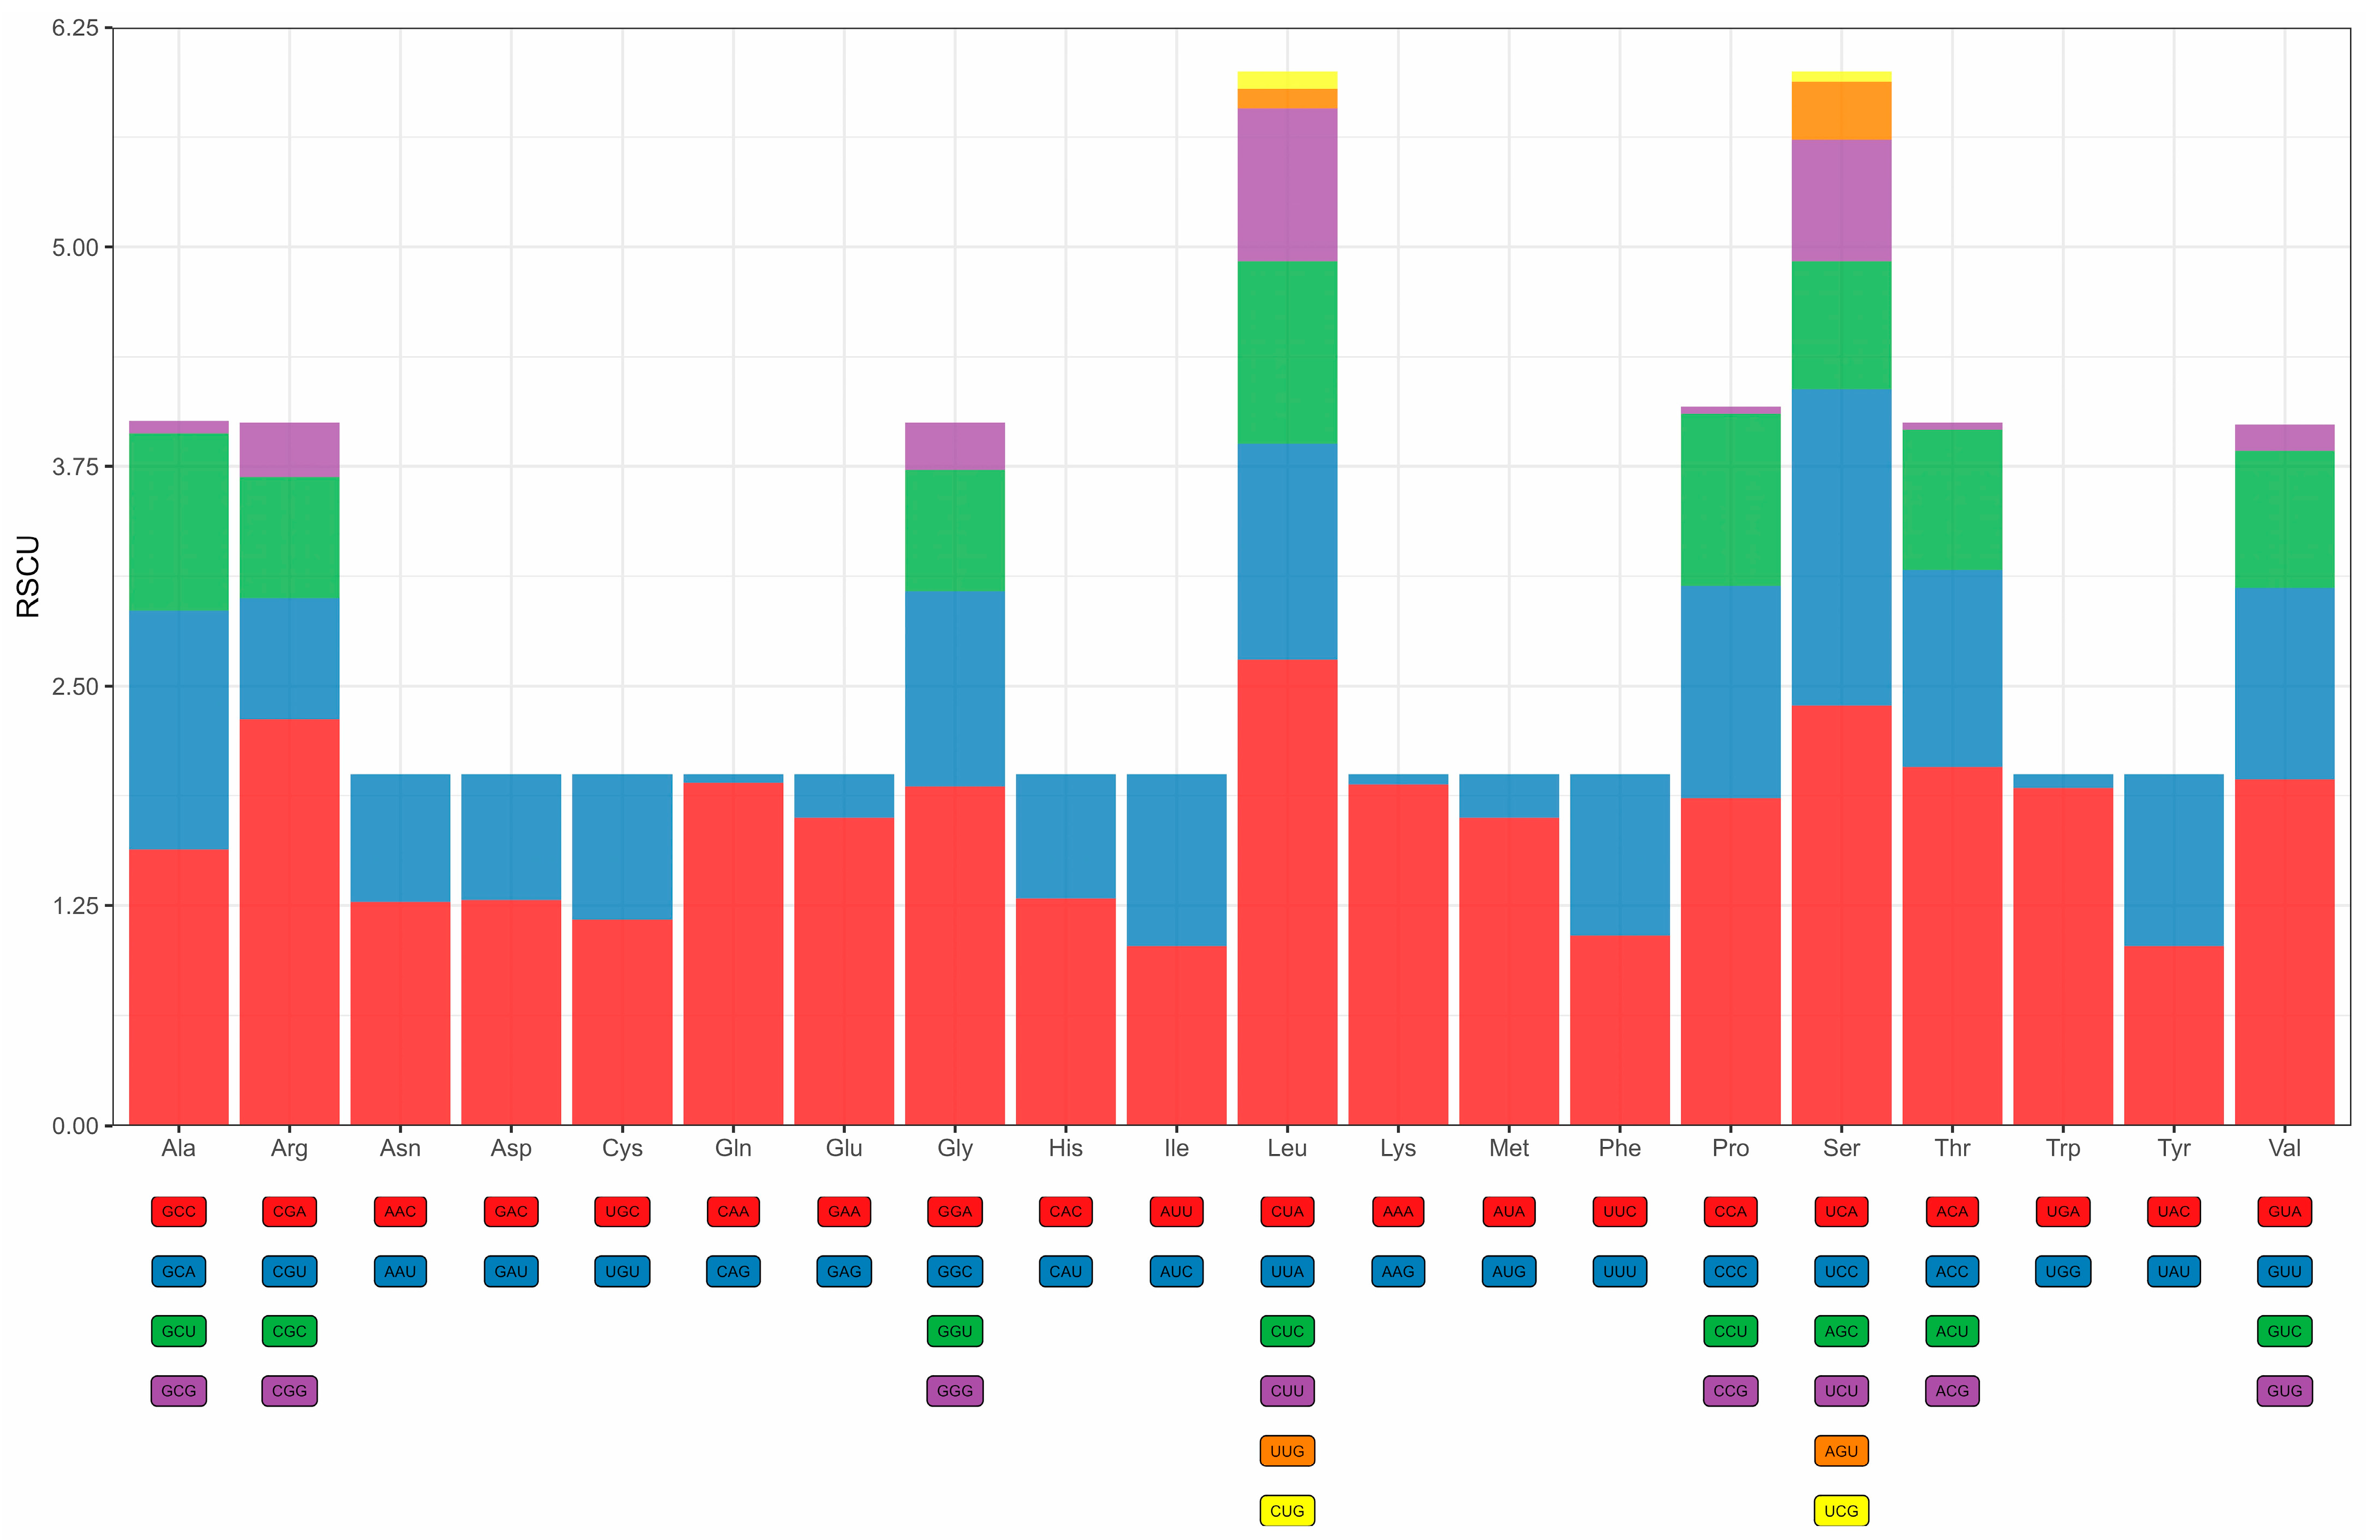
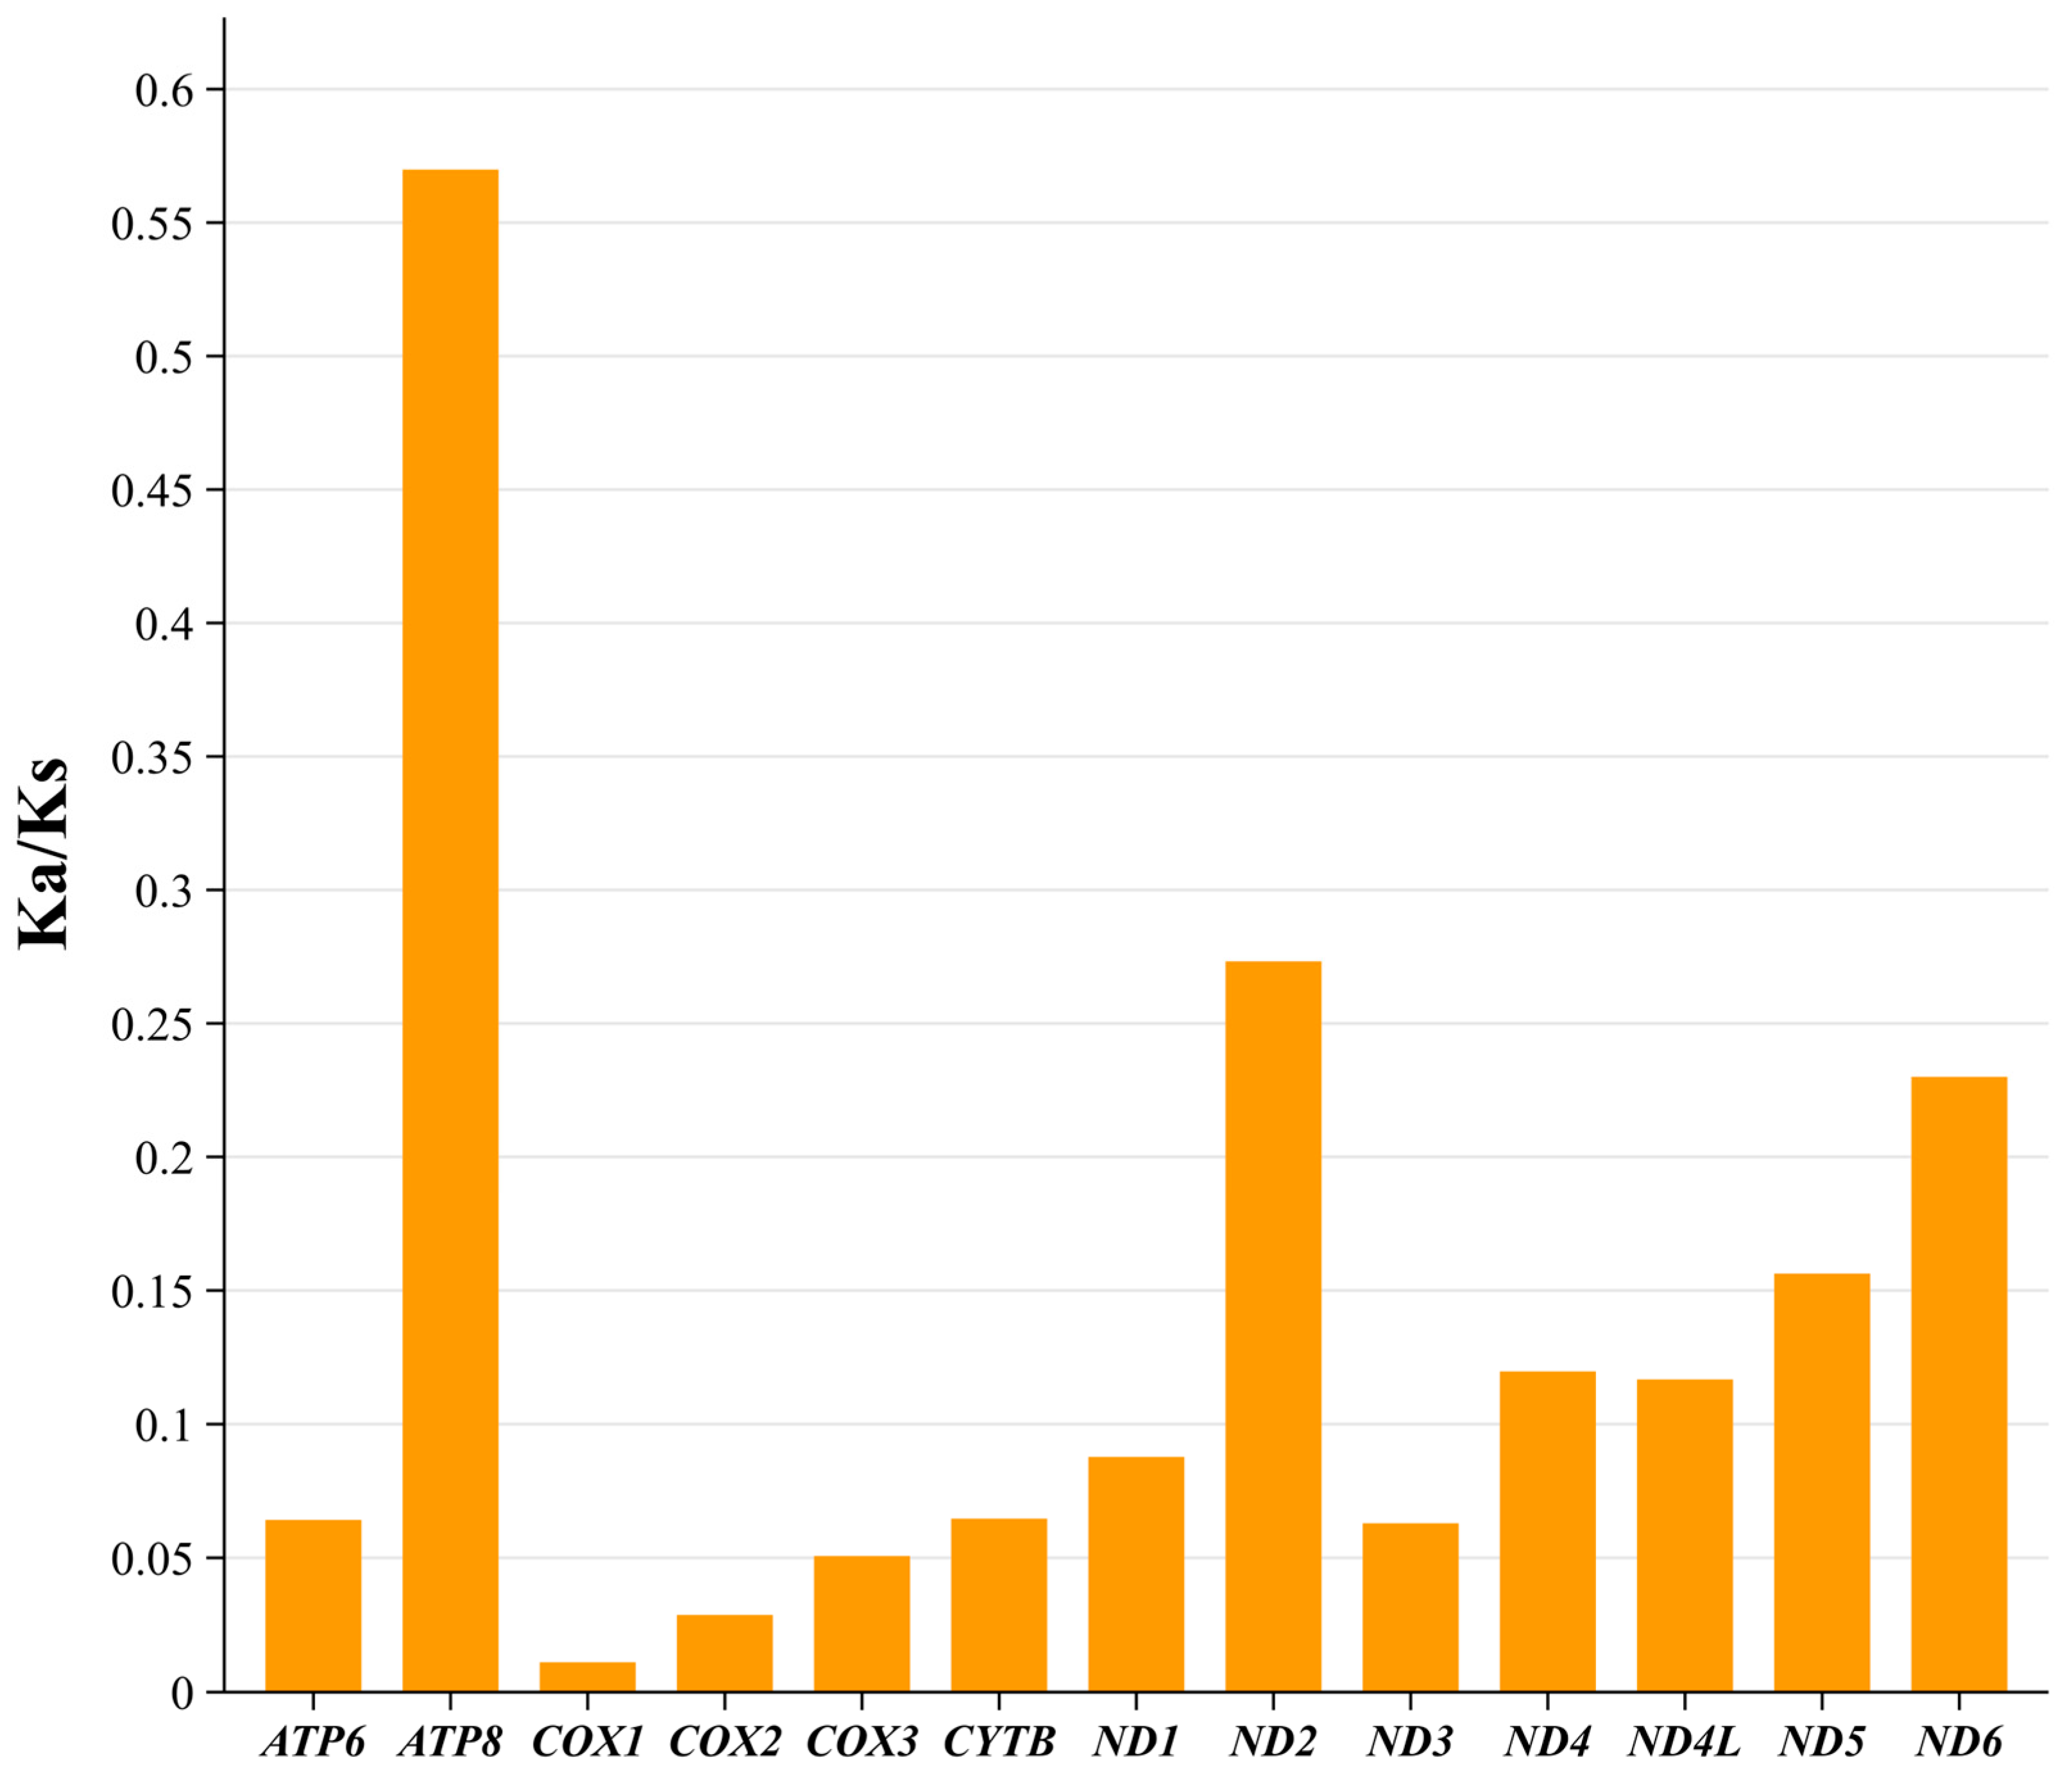
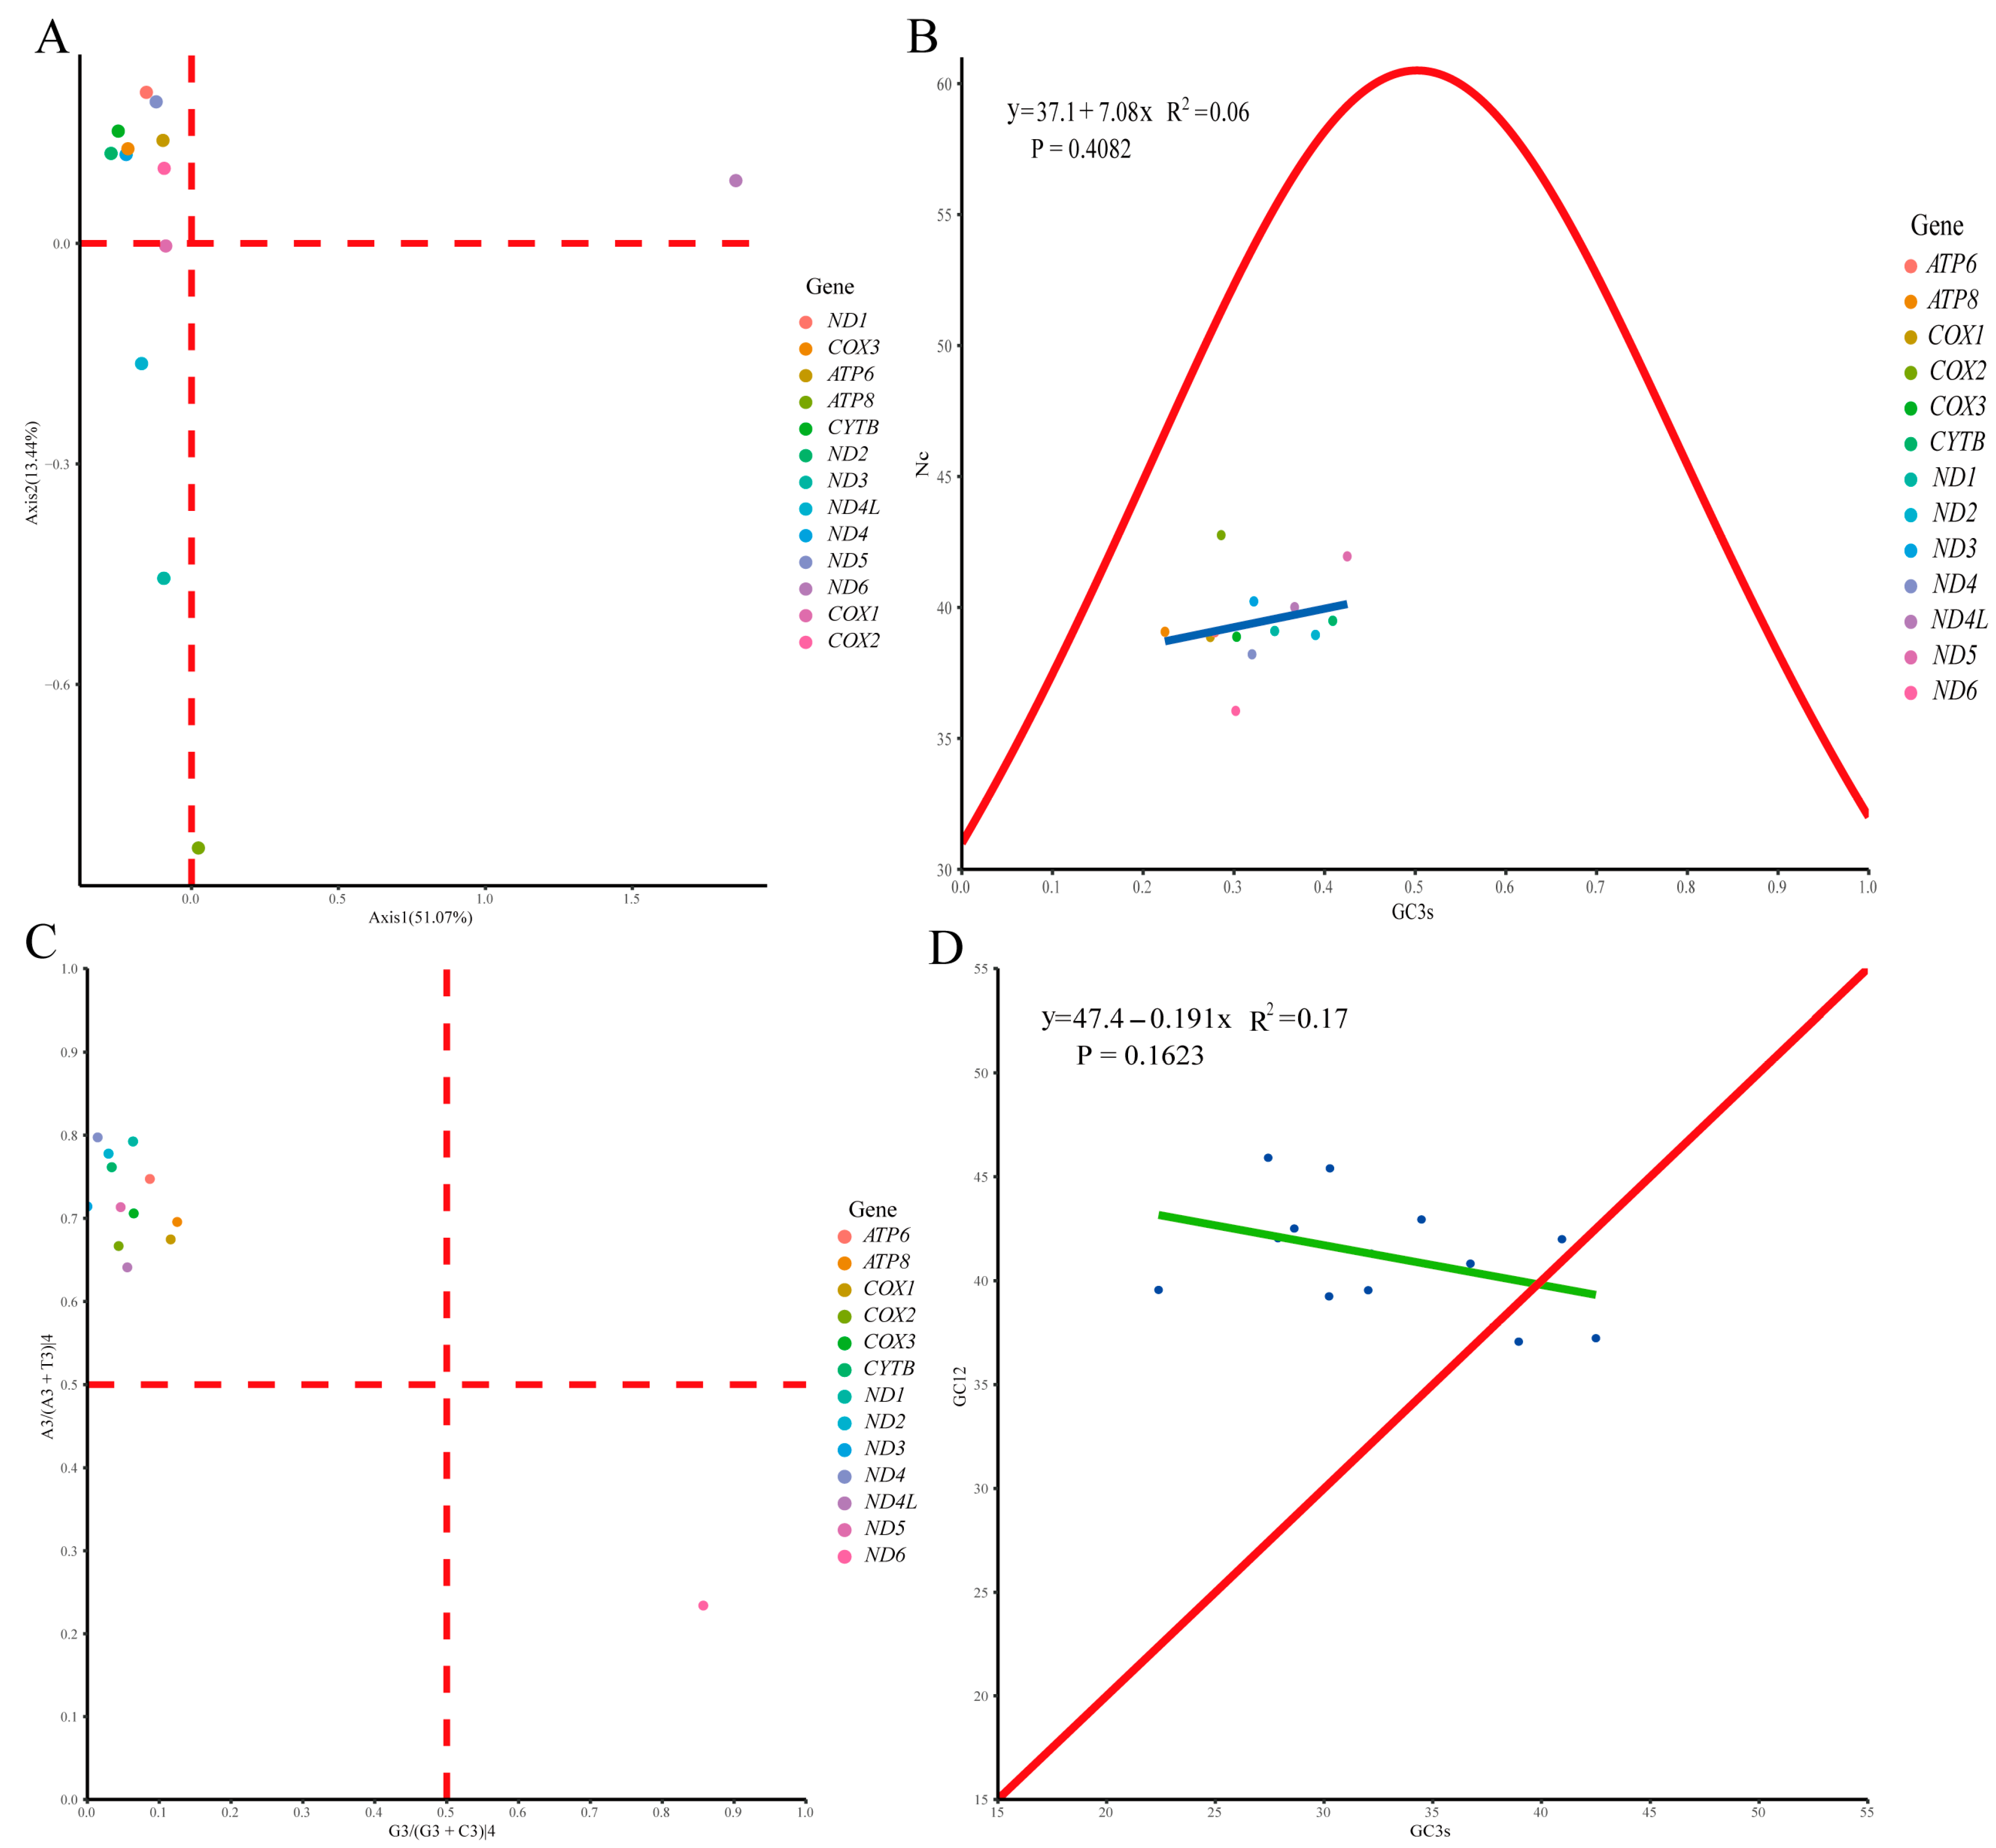
3.4. Protein-Coding Genes, Codon Usage, and Genetic Diversity

The length of 13 PCGs in the D. millardi mitogenome was 11,400 bp, accounting for 69.9% of the total mitogenome length (16,289 bp). Nucleotide composition of PCGs was A = 31.6%, T = 29.7%, C = 27.0%, and G = 11.7%, yielding moderate AT bias (AT content = 61.3%; AT-skew = 0.031; GC-skew = −0.396; Table 2). All PCGs initiated with standard ATN start codons, while termination signals exhibited four patterns: canonical TAA (eight genes), incomplete T-- (CYTB, COX3, ND4), TAG (ND1), and AGA (ND2) (Table 1). RSCU analysis of 3792 codons revealed strong bias (Figure 5; Table 3), with 29 preferred codons (RSCU > 1) representing 74.2% of total usage (2815/3792). Highly overrepresented codons (RSCU > 1.6; 13 types, 1493 occurrences) included CUA (for Leucine, Leu), CGA (for Arginine, Arg), ACA (for Threonine, Thr), and UCA (for Serine, Ser), while 15 underrepresented codons (RSCU < 0.6; 124 occurrences) reflected translational selection against energetically costly amino acids. Purifying selection dominated mitogenome evolution, as evidenced by Ka/Ks ratios < 1 for all PCGs (Figure 6), ranging from COX1 (Ka/Ks = 0.03) to ATP8 (Ka/Ks = 0.57).
Codon usage bias in the D. millardi mitogenome was analyzed through COA, ENC-plot, PR2, and neutrality curve (Figure 7). COA revealed heterogeneous codon usage patterns across PCGs, with most genes dispersed across the ordination space, except for COX3 and ND4, which clustered closely together (Figure 7A). ENC values ranged from 36.05 (ND6) to 42.76 (COX2), with all points below the expected standard curve (Figure 7B), indicating predominant natural selection over mutation–drift equilibrium. PR2 analysis showed significant deviation from the parity rule central point (0.5, 0.5), with 12 PCGs exhibiting A/C bias and ND6 showing G/T bias (Figure 7C), consistent with COA and ENC results. Neutrality curve regression (GC12 vs. GC3s) yielded a non-significant slope (|r| < 0.2, p > 0.05; Figure 7D), further supporting natural selection as the primary driver of codon usage variation.
Genetic diversity analysis among D. millardi populations from southwestern China (this study), northern and southern Vietnam displayed low genetic difference (CYTB divergence ≤ 0.021; Table S7). Additionally, D. millardi exhibited high haplotype diversity coupled with low nucleotide diversity (CYTB: Hd = 0.978 ± 0.054, π = 0.0135 ± 0.0023; COX1: Hd = 0.844 ± 0.103, π = 0.0101 ± 0.0025); neutrality tests yielded negative values (CYTB: Tajima’s D = −0.40094; COX1: Tajima’s D = −0.48964), although these deviations were not statistically significant (p > 0.05; Table S8).

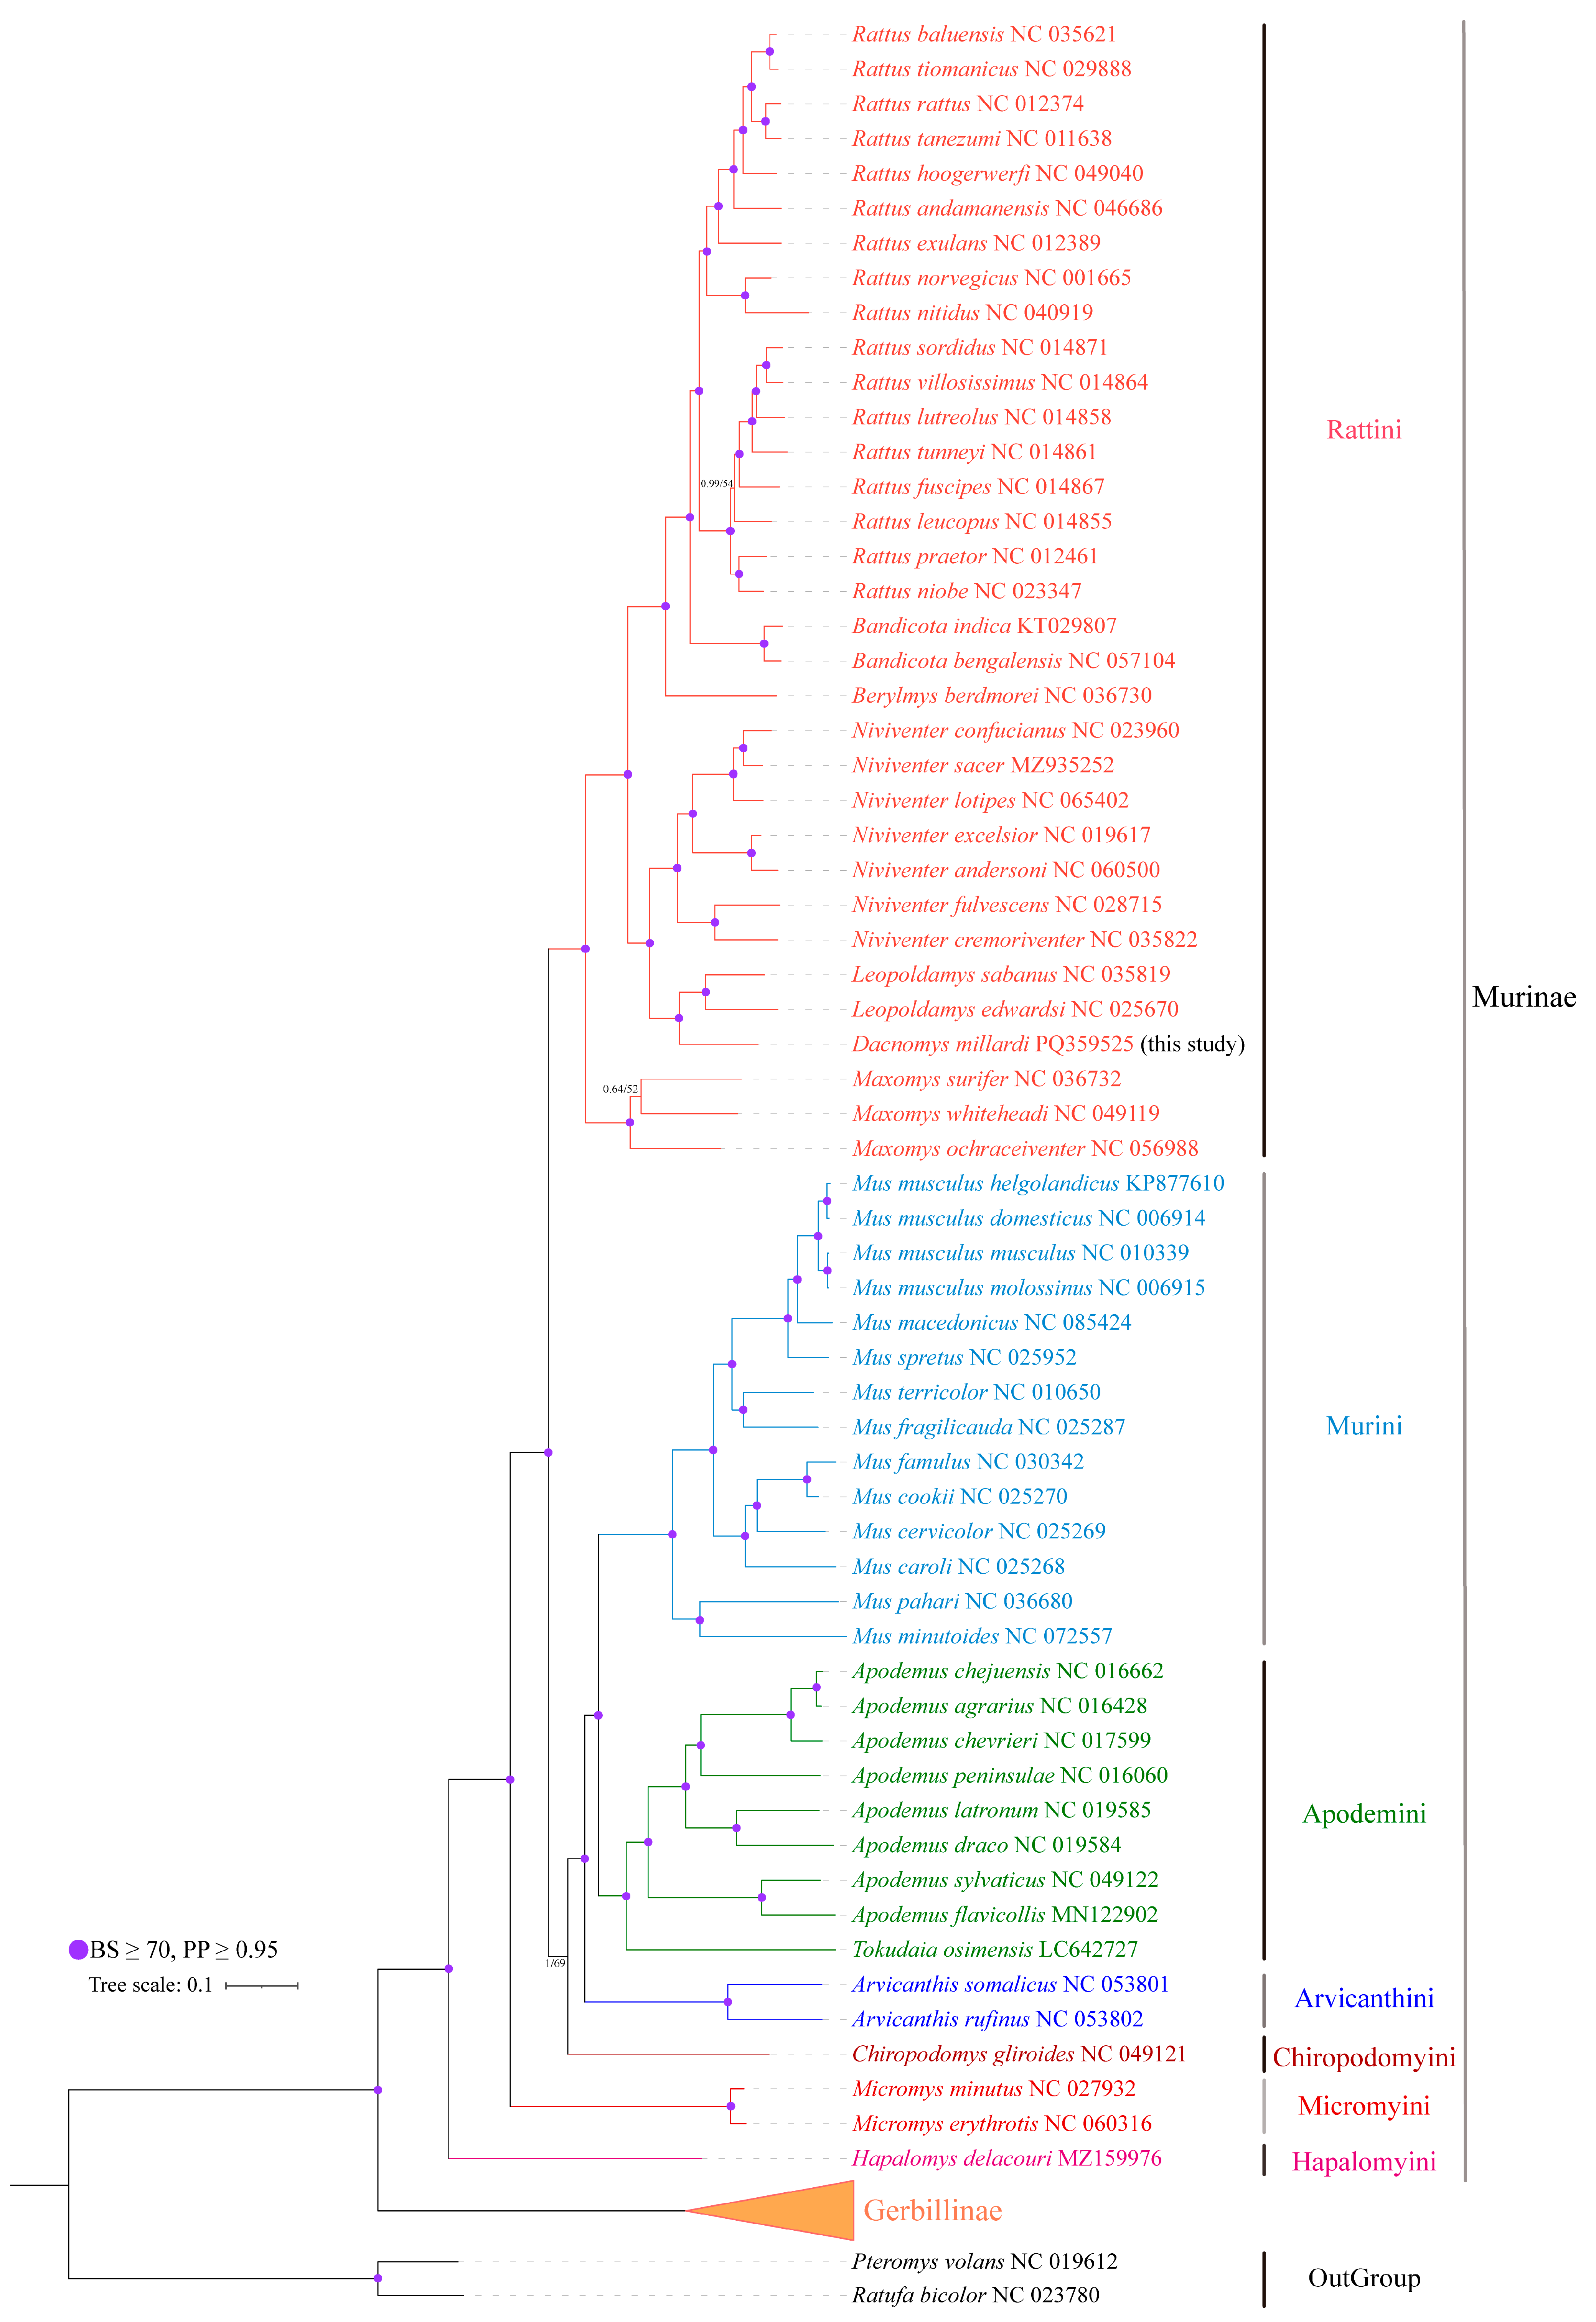
3.5. Phylogenetic Analysis and Divergence Time Estimation

Phylogenetic position of D. millardi within Muridae yielded congruent topologies with strong nodal support (PP = 1.00; BS = 100%; Figure 8). The phylogenetic relationship among different genera of Murinae were as follows: ((((((Rattus + Bandicota) +Berylmys) + (Niviventer + (Leopoldamys + Dacnomys))) + Maxomys) + (((Mus + (Apodemus + Tokadaia)) + Arvicanthis) + Chiropodomys)) + Micromys) + Hapalomys. Murinae formed a monophyletic clade (PP = 1.00; BS = 100%), with Micromys positioned as the basal lineage (PP = 1.00; BS = 100%) within Murinae. D. millardi exhibited a sister relationship with Leopoldamys (PP = 1.00; BS = 100%), collectively forming a clade with Niviventer. The Apodemus–Tokudaia–Mus alliance formed a monophyletic group, with Tokudaia sister to Apodemus and Mus as their distant relative. Hapalomys occupied a basal Murinae position (PP = 1.00; BS = 91%), although with lower ML support compared to Micromys.
A molecular dating analysis using four fossil calibrations revealed that the most recent common ancestor (MRCA) of Murinae emerged in the Middle Miocene (~14.3 million years ago [Mya], 95% highest posterior density [HPD]: 13.81–14.98 Mya), with the Murinae–Gerbillinae split occurring earlier in the Early Miocene (~18.0 Mya, 95% HPD: 16.37–20.51 Mya). Within Murinae, three primary lineages diverged in the Middle Miocene: Hapalomyini, Micromyini (~12.9 Mya, 95% HPD: 12.24–13.57 Mya), and core Murinae. Subsequent radiations included the Chiropodomyini–Murini–Apodemini–Arvicanthini split at ~11.0 Mya (95% HPD: 10.64–11.59 Mya), followed by tribe-level divergences within Apodemini (~9.3 Mya, 95% HPD: 7.90–11.27 Mya), Murini (~7.8 Mya, 95% HPD: 7.95–9.84 Mya), and Arvicanthini (~6.0 Mya, 95% HPD: 4.59–6.77 Mya). The Rattini tribe diverged from other Murinae ~9.1 Mya (95% HPD: 8.45–9.94 Mya). The Dacnomys–Leopoldamys divergence occurred in the Early Pliocene (~4.8 Mya, 95% HPD: 3.65–5.47 Mya), followed by Niviventer (~4.6 Mya, 95% HPD: 3.86–5.54 Mya) and Berylmys (~5.5 Mya, 95% HPD: 4.92–6.48 Mya). The Rattus–Bandicota split was resolved at ~4.0 Mya (95% HPD: 3.89–5.27 Mya), with intrageneric diversification in Rattus continuing into the Pleistocene (~0.4 Mya, 95% HPD: 0.27–0.60 Mya). These results aligned with Miocene–Pliocene climatic shifts driving murid adaptive radiation (Figure 9).

4. Discussion

4.1. Evolutionary Conservation and Structural Features in the D. millardi Mitogenome

We presented the first complete mitogenome assembly for the monotypic genus Dacnomys, filling a critical gap in understanding the genomic evolution of this taxonomically contentious lineage. The circular 16,289 bp mitogenome of D. millardi comprises 37 genes (13 PCGs, 22 tRNAs, and 2 rRNAs) arranged with transcriptional polarity typical of eutherian mammals [31,76], providing a molecular framework for resolving its phylogenetic placement. The genome exhibited pronounced AT bias (61.3%), aligning with strand-specific deamination patterns characteristic of murid mitogenome evolution [77]. Notably, the OL region displayed anomalous GC enrichment (58.1%), likely attributable to relaxed selective constraints on RNA primer binding during L-strand replication initiation [78]. This region’s position within the ‘WANCY’ tRNA cluster retained the ancestral eutherian ‘W-A-N-C-Y’ configuration, sharply contrasting with the derived marsupial ‘A-C-W-N-Y’ arrangement [76].
The tRNAs of D. millardi revealed deep evolutionary constraints through three structural hallmarks: (1) The loss of the trnS1 dihydrouridine (DHU) arm could be traced to early metazoan diversification [79] and functionally compensated by tertiary RNA structural adaptations [80]; (2) D-loop truncation of trnK, a synapomorphy unifying placental mammals [12], showed parallel evolution in Microtus and Apodemus lineages [81,82]; (3) most significantly, non-Watson–Crick pairing (29 G-U wobble pairs and 10 mismatches) likely stabilized tRNA architecture through low-energy hydrogen bonding [83], with potential mechanistic homology to invertebrate post-transcriptional editing processes [84]. The abovementioned mitogenomic architecture provided genomic evidence for the structural evolutionary conservation in D. millardi.
Crucially, we observed polyadenylation-mediated completion of truncated stop codons (T--) in D. millardi (Table 1), a mechanism empirically validated in Clethrionomys glareolus (Rodentia: Cricetidae) [85,86]. Anticodon conservation analyses further revealed that D. millardi retained the ancestral trnK (UUU) codon despite known mammalian variability [87], while its trnS1 (GCU) anticodon starkly differed from UCU variants in Siphonaptera and Arachnida [88,89]. This finding strongly suggests stringent evolutionary constraints in eutherian mitogenomes.

4.2. Codon Usage Bias and Evolutionary Constraints in the D. millardi Mitogenome

Analysis of RSCU across 13 PCGs revealed distinct translational preferences in D. millardi (RSCU = 1: neutral; RSCU > 1: preferred; RSCU < 1: avoided) [90,91]. Twenty-nine codons exhibited preference (RSCU > 1), with 13 strongly preferred codons (RSCU > 1.6) predominantly terminating in adenine (A), except UCC. Conversely, 15 codons (RSCU < 0.6) showed avoidance, primarily ending in guanine (G), excluding AGU. This bias aligns with the observed AT enrichment and GC depletion in coding regions, likely minimizing premature stop codons and preserving amino acid integrity via third-position A/T preference [92].
Purifying selection dominated mitogenome evolution (Ka/Ks < 1 for all PCGs), with divergent evolutionary rates reflecting functional constraints: ATP8 displayed the highest rate (0.57), consistent with relaxed selective pressures in its auxiliary role [93,94], while COX1 exhibited extreme conservation (0.03), mirroring murid-wide patterns [82]. These trends align with broader metazoan mitogenome evolution observed in Charadriiformes, Cimicomorpha, Ranidae, and other taxa [95,96,97,98].
Multivariate analyses delineated drivers of codon usage bias: (1) Functional coordination: COA revealed clustered codon preferences for COX3, ND4, and CYTB (Figure 7A), reflecting their coordinated roles in oxidative phosphorylation (Complexes I, III, and IV) [99]; (2) strand-specific selection: PR2 suggested ND6’s distinct codon usage, diverging from 12 H-strand PCGs, likely steming from L-strand-specific mutational pressures and selective optimization [100]; (3) selection dominance: ENC-plot and neutrality curve analyses confirmed natural selection as the predominant driver (80.9%) versus mutational bias (19.1%). These findings illuminate adaptive strategies shaping Murinae mitogenomes, where codon usage patterns balance structural stability, translational efficiency, and environmental adaptation—a critical framework for decoding evolutionary trajectories in the monotypic genus Dacnomys.

4.3. Phylogenetic Reconstruction and Divergence Time Estimation

In the current study, our phylogenetic analyses robustly resolved D. millardi as the sister lineage to Leopoldamys (PP = 1.00, BS = 100%), with divergence dating to the Early Pliocene (~4.8 Mya; 95% HPD: 3.65–5.47 Mya). Our results are consistent with traditional morphological classifications [1,30], obtain similar tree topologies and the stable phylogenetic placement of Dacnomys from different datasets [10,31].
Despite the well-established phylogenetic relationships in Murinae, the intergeneric and interspecific relationships remain contentious. A notable example is the unresolved systematic position of Micromys, with conflicting hypotheses emerging from different molecular datasets: (1) Sister relationship to Rattus (CYTB data) or Tokudaisa (IRBP) [101]; (2) basal positioning within the Apodemus–Rattus clade (CYTB analysis) [102]; (3) basal placement in tribe Rattini based on combined CYTB and nuclear loci [10,69]. Our mitogenome-based phylogeny and divergence dating provide robust support (PP = 1.00, BS = 98%) for Micromys as an early-diverging lineage (~12.9 Mya, 95% HPD: 12.24–13.57 Mya) within the Murinae, is consistent with a recent study [103] and paleontological evidence (Late Miocene origin) [104]. This contrasts with Liu et al. (2025) [25], who placed Micromys at the base of Rattini and identified it as sister to Vernaya. This topological discrepancy is likely due to methodological differences in genomic sampling: The constrained resolution for early murine radiations (e.g., Micromys) in Liu et al. (2025) [25] stems from limited mitogenomic representation (40 mitogenomes and 17 CYTB genes), whereas our comprehensive dataset (69 complete mitogenomes) provides enhanced phylogenetic signal density and branch coverage critical for resolving short internal branches [105,106]. Moreover, Pagès et al. (2015) [107] considered that the dental morphology of Micromys strongly differed from most other Rattini. Consequently, we support reclassifying Micromys from tribe Rattini to the tribe Micromyini, following the taxonomic framework of Wilson et al. (2017) [1] and the recently molecular study of Liu et al. (2025) [25], which requires further morphological validation and attention from taxonomists.
Notably, mitochondrial phylogenies inherently faced methodological constraints including incomplete lineage sorting, introgression artifacts, and hybridization signals [26,29]. While mitochondrial substitution rates (4.8 × 10⁻⁸ substitutions/site/year) provide superior resolution for recent radiations (faster than nuclear gene rate at 1.2 × 10⁻⁹) [14,108], these maternal markers alone cannot fully resolve deep divergence events like Micromys’s Miocene origin. We therefore advocate integrating mitogenomic and multi-locus nuclear datasets—ideally whole-genome sequences—to reconcile potential mitochondrion–nuclear gene discordance and establish a cohesive phylogenetic hypothesis.

4.4. Evolutionary Constraints and Anthropogenic Pressures Drive Genetic Diversity Erosion in the Threatened Murid D. millardi

As a monotypic genus, D. millardi exhibited distinct genetic diversity patterns, although the underlying drivers remain poorly resolved. Previous studies reported minimal cranial and body size differentiation between northern and southern Vietnamese populations of D. millardi, alongside low mitochondrial genetic diversity (CYTB divergence ≤ 0.023) [2]. However, the factors driving this homogeneity were not explicitly expatiated. To address this gap, we integrated morphological and genetic data from newly sampled populations in southwestern China (Yunnan Province), which similarly showed limited morphological variation and low genetic diversity. This pattern seems consistent with a demographic expansion following a genetic bottleneck, likely driven by post-glacial recolonization or recent habitats fragmentation [46,109]. We propose three factors underpinning D. millardi’s low genetic diversity, likely linked to its evolutionary history, anthropogenic pressures, and ecological specialization.
  • Habitats loss and geographic confinement synergistically drive genetic diversity erosion
Accelerating deforestation-driven habitat loss (>20,000 km2/year) and geographic confinement synergistically drive genetic diversity erosion in D. millardi—the process revealing how rapid forest degradation disproportionately threatens stenotopic species across Southeast Asia [110,111]. According to population genetic theory, genetic diversity was positively correlated with effective population size (Nₑ) and geographic range [112,113]. The species’ small, fragmented populations likely exacerbated genetic drift and inbreeding, reducing adaptive potential and amplifying extinction risks—a pattern consistent with other range-restricted murids (e.g., Leopoldamys neilli) [114]. Critically, low genetic diversity (π < 0.02) is a well-established hallmark of threatened mammalian species [115]. The markedly low nucleotide diversity observed in D. millardi (CYTB: π = 0.0135 ± 0.0023; COX1: π = 0.0101 ± 0.0025) aligns with this pattern, indicating substantial conservation concern for this taxon.
Consequently, we propose updating the conservation status of D. millardi and advocating for its IUCN Red List reclassification from Data Deficient (DD) to Near Threatened (NT) based on documented population declines and habitat fragmentation, while urging the integration of genetic diversity metrics into IUCN assessments to address extinction risks exacerbated by adaptive potential loss in isolated populations. Furthermore, we provide a new perspective on protecting threatened murids such as D. millardi by implementing protection of core habitats to prevent population collapses driven by deforestation.
2.
Shallow evolutionary history
Divergence time estimation (by BEAST) revealed that Dacnomys split from its sister genus Leopoldamys in the early Pliocene (~4.8 Mya; 95% HPD: 3.65–5.47 Mya). This relatively shallow evolutionary history may have limited time for mutation accumulation compared to polytypic genera lineages [109], which might have a longer evolutionary history, accumulate more genetic variations, and exhibit higher genetic diversity [116,117]. Short evolutionary histories often constrain genetic variation in monotypic genera due to insufficient time for lineage-specific substitution [118], particularly under stabilizing selection in special environments.
3.
Ecological specialization and adaptive stability
As a threatened lineage endemic to the Indo-Malayan biodiversity hotspot—a proposed center of Murinae diversification [69]—D. millardi has likely undergone long-term adaptation to stable montane rainforest niches. Specialization to narrow ecological optima could reduce selective pressures for novel genetic variation, favoring purifying selection to preserve adaptive traits while eliminating deleterious alleles [119,120]. This process, combined with environmental stability in undisturbed habitats where D. millardi has only been discovered, might explain the observed genetic homogeneity, as the species’ genomic architecture reflects optimization for its ancestral niche rather than adaptive flexibility.

5. Conclusions

Our study combines morphological characterization with the complete mitogenome to validate the phylogenetic placement of Dacnomys and reconstruct the phylogenetic framework of the subfamily Murinae. By coupling the complete mitogenome, genetic diversity, and codon usage bias analysis, we reveal the following. (1) Phylogenetic reassessment: Dacnomys forms a well-supported sister clade to Leopoldamys (PP = 1.0, BS = 100%), while the basal positioning of Micromys within Murinae necessitates its elevation to the tribal rank Micromyini, which requires further morphological validation and attention from taxonomists. These findings refine the subfamily’s classification and highlight the evolutionary uniqueness of the understudied monotypic genus Dacnomys. (2) Evolutionary constraints: strong purifying selection (Ka/Ks < 1) dominates mitogenome evolution, as evidenced by codon usage patterns. This intrinsic constraint, coupled with the lineage’s recent Pliocene divergence (~4.8 Mya), limits mutational accumulation, resulting in reduced nucleotide diversity. (3) Synergistic risks: habitat fragmentation and population decline—driven by Southeast Asia’s unparalleled deforestation rates (>20,000 km2/year since 2000)—amplify genetic drift in D. millardi’s small, isolated populations. The interaction of these extrinsic pressures with evolutionary constraints creates a dual erosion trap, depleting adaptive potential and escalating extinction vulnerability. These findings necessitate urgent conservation prioritization for threatened murids by implementing protection of core habitats to prevent deforestation-driven population collapses and advocating IUCN Red List reclassification of D. millardi from Data Deficient (DD) to Near Threatened (NT) with integration of genetic diversity metrics into IUCN Red List assessments.

Supplementary Materials

The following supporting information can be downloaded at: https://www.mdpi.com/article/10.3390/biology14080948/s1, Table S1: Geographic coordinates of sampling sites from this study and Abramov et al. (2017) [2]; Table S2: Detailed information of the 18 Dacnomys millardi DNA sequences (nine CYTB and nine COX1) from Abramov et al. (2017) [2] used for genetic diversity analysis, including GenBank accession numbers and geographic distribution; Table S3: Mitochondrial genomes used in phylogenetic analyses of Muridae, with specimen collection localities and GenBank accession numbers; Table S4: The test results of substitution saturation based on partitioned mitochondrial PCGRNA alignment (13,735 bp); Table S5: Fossil constraints and node calibrations for divergence dating of Muridae, including fossil taxa, phylogenetic placement, and geological age (Mya); Table S6: External and craniometric measurements (mm, g) of adult Dacnomys millardi specimens from Weixi Lisu Autonomous County, Yunnan Province, China (27.18° N, 99.28° E; voucher IDs: E420001, E420002). Specimen E420002 exhibited bilateral broken zygomatic arches, compromising the accuracy of key metrics like orbital length and zygomatic breadth. Damaged measurements flagged with ‘*’. The intact specimen (E420001) is retained in the study; Table S7: Intraspecific genetic divergence of Dacnomys millardi across Southwestern China, northern and southern Vietnam inferred from mitochondrial CYTB sequences; Table S8: Genetic diversity metrics of mitochondrial CYTB and COX1 genes in Dacnomys millardi populations from China (Yunnan Province) and Vietnam.

Author Contributions

W.D. conceived and designed the study and revised the manuscript; W.S. assisted in the morphological description and identification of specimens; D.Z. and Z.W. performed statistical analyses; Z.W. wrote the manuscript. All authors have read and agreed to the published version of the manuscript.

Funding

This work was supported by the National Natural Science Foundation of China (No. 32260152 to Wenge Dong; No. 32260277 to Wenyu Song).

Institutional Review Board Statement

This study was conducted in strict accordance with the animal practice standards established by the relevant national and/or local animal welfare agencies. All animal capture protocols and procedures were approved by the Animal Ethics Committee of Dali University (approval No.: 2021-P2-162). All experimental methods used in this study were carried out in compliance with the approved guidelines and regulations.

Informed Consent Statement

Not applicable.

Data Availability Statement

The experimental data used to support the findings of this study are available from GenBank of NCBI: https://www.ncbi.nlm.nih.gov/ (accessed on 5 June 2025) for the complete mitogenome of D. millardi (accession number: PQ359525). The two specimens of D. millardi are also available from the Institute of Pathogens and Vectors, Dali University, China (voucher IDs: E420001, E420002).

Acknowledgments

We are immensely grateful to Xianguo Guo for providing the experimental specimens that supported this research project.

Conflicts of Interest

The authors declare no conflicts of interest.

References

  1. Wilson, D.E.; Lacher, T.E., Jr.; Mittermeier, R.A. Handbook of the Mammals of the World; Lynx Edicions: Barcelona, Spain, 2017; Volume 7. [Google Scholar]
  2. Abramov, A.V.; Balakirev, A.E.; Rozhnov, V.V. New data on the distribution and intraspecific variation of the Millard’s giant rat Dacnomys millardi (Mammalia, Rodentia) from Vietnam. Mammal Res. 2017, 62, 307–311. [Google Scholar] [CrossRef]
  3. Wei, F.W. Taxonomy and Distribution of Mammals in China; Science Press: Beijing, China, 2022. [Google Scholar]
  4. Pan, Q.H.; Wang, Y.X.; Yan, K. A Field Guild to the Mammals of China; Chinese Forestry Publishing Press: Beijing, China, 2007. [Google Scholar]
  5. Sunyer, P.; Muñoz, A.; Bonal, R.; Espelta, J.M.; McArthur, C. The ecology of seed dispersal by small rodents: A role for predator and conspecific scents. Funct. Ecol. 2013, 27, 1313–1321. [Google Scholar] [CrossRef]
  6. Jiang, Z.G. China’s Red List of Biodiversity: Vertebrates; Science Press: Beijing, China, 2021; Volume 1. [Google Scholar]
  7. Molur, S. Dacnomys millardi. The IUCN Red List of Threatened Species. Available online: https://dx.doi.org/10.2305/IUCN.UK.2016-1.RLTS.T6219A22466747.en (accessed on 4 June 2025).
  8. Rosa, I.M.D.; Smith, M.J.; Wearn, O.R.; Purves, D.; Ewers, R.M. The Environmental Legacy of Modern Tropical Deforestation. Curr. Biol. 2016, 26, 2161–2166. [Google Scholar] [CrossRef]
  9. Lynam, A.J.; Tantipisanuh, N.; Chutipong, W.; Ngoprasert, D.; Baker, M.C.; Cutter, P.; Gale, G.; Kitamura, S.; Steinmetz, R.; Sukmasuang, R.; et al. Comparative sensitivity to environmental variation and human disturbance of Asian tapirs (Tapirus indicus) and other wild ungulates in Thailand. Integr. Zool. 2012, 7, 389–399. [Google Scholar] [CrossRef] [PubMed]
  10. Steppan, S.J.; Schenk, J.J. Muroid rodent phylogenetics: 900-species tree reveals increasing diversification rates. PLoS ONE 2017, 12, e0183070. [Google Scholar] [CrossRef]
  11. Abreu-Jr, E.F.; Pavan, S.E.; Tsuchiya, M.T.N.; Wilson, D.E.; Percequillo, A.R.; Maldonado, J.E. Museomics of tree squirrels: A dense taxon sampling of mitogenomes reveals hidden diversity, phenotypic convergence, and the need of a taxonomic overhaul. BMC Evol. Biol. 2020, 20, 77. [Google Scholar] [CrossRef] [PubMed]
  12. Pereira, S.L. Mitochondrial genome organization and vertebrate phylogenetics. Genet. Mol. Biol. 2000, 23, 745–752. [Google Scholar] [CrossRef]
  13. Ladoukakis, E.D.; Zouros, E. Evolution and inheritance of animal mitochondrial DNA: Rules and exceptions. J. Biol. Res. 2017, 24, 2. [Google Scholar] [CrossRef] [PubMed]
  14. Peters, J.L.; Gretes, W.; Omland, K.E. Late Pleistocene divergence between eastern and western populations of wood ducks (Aix sponsa) inferred by the ‘isolation with migration’ coalescent method. Mol. Ecol. 2005, 14, 3407–3418. [Google Scholar] [CrossRef]
  15. Yue, H.; Yan, C.; Tu, F.; Yang, C.; Ma, W.; Fan, Z.; Song, Z.; Owens, J.; Liu, S.; Zhang, X. Two novel mitogenomes of Dipodidae species and phylogeny of Rodentia inferred from the complete mitogenomes. Biochem. Syst. Ecol. 2015, 60, 123–130. [Google Scholar] [CrossRef]
  16. Funk, D.J.; Omland, K.E. Species-Level Paraphyly and Polyphyly: Frequency, Causes, and Consequences, with Insights from Animal Mitochondrial DNA. Annu. Rev. Ecol. Evol. Syst. 2003, 34, 397–423. [Google Scholar] [CrossRef]
  17. Ding, L.; Li, W.; Liao, J. Characterization of the complete mitochondrial genome of Phodopus roborovskii (Rodentia: Cricetidae) and systematic implications for Cricetinae phylogenetics. Biochem. Syst. Ecol. 2016, 69, 226–235. [Google Scholar] [CrossRef]
  18. Frank, K.; Barta, E.; Bana, N.Á.; Nagy, J.; Horn, P.; Orosz, L.; Stéger, V. Complete mitochondrial genome sequence of a Hungarian red deer (Cervus elaphus hippelaphus) from high-throughput sequencing data and its phylogenetic position within the family Cervidae. Acta Biol. Hung. 2016, 67, 133–147. [Google Scholar] [CrossRef]
  19. Sarvani, R.K.; Parmar, D.R.; Tabasum, W.; Thota, N.; Sreenivas, A.; Gaur, A. Characterization of the complete mitogenome of Indian Mouse Deer, Moschiola indica (Artiodactyla: Tragulidae) and its evolutionary significance. Sci. Rep. 2018, 8, 2697. [Google Scholar] [CrossRef]
  20. Thalmann, O.; Shapiro, B.; Cui, P.; Schuenemann, V.J.; Sawyer, S.K.; Greenfield, D.L.; Germonpré, M.B.; Sablin, M.V.; López-Giráldez, F.; Domingo-Roura, X.; et al. Complete Mitochondrial Genomes of Ancient Canids Suggest a European Origin of Domestic Dogs. Science 2013, 342, 871–874. [Google Scholar] [CrossRef]
  21. Waddell, P.J.; Cao, Y.; Hauf, J.; Hasegawa, M.; Olmstead, R. Using Novel Phylogenetic Methods to Evaluate Mammalian mtDNA, Including Amino Acid-Invariant Sites-LogDet plus Site Stripping, to Detect Internal Conflicts in the Data, with Special Reference to the Positions of Hedgehog, Armadillo, and Elephant. Syst. Biol. 1999, 48, 31–53. [Google Scholar] [CrossRef]
  22. Xu, X.; Janke, A.; Arnason, U. The complete mitochondrial DNA sequence of the greater Indian rhinoceros, Rhinoceros unicornis, and the Phylogenetic relationship among Carnivora, Perissodactyla, and Artiodactyla (+Cetacea). Mol. Biol. Evol. 1996, 13, 1167–1173. [Google Scholar] [CrossRef] [PubMed]
  23. İbiş, O.; Selçuk, A.Y.; Sacks, B.N.; Yıldız, B.; Özcan, S.; Kefelioğlu, H.; Tez, C. Whole mitochondrial genome of long-clawed mole vole (Prometheomys schaposchnikowi) from Turkey, with its phylogenetic relationships. Genomics 2020, 112, 3247–3255. [Google Scholar] [CrossRef]
  24. Yu, H.; Jamieson, A.; Hulme-Beaman, A.; Conroy, C.J.; Knight, B.; Speller, C.; Al-Jarah, H.; Eager, H.; Trinks, A.; Adikari, G.; et al. Palaeogenomic analysis of black rat (Rattus rattus) reveals multiple European introductions associated with human economic history. Nat. Commun. 2022, 13, 2399. [Google Scholar] [CrossRef]
  25. Liu, S.; Zhao, S.; Wang, J.; Fu, C.; Wang, X.; Liu, S.; Chen, S. New insights into the mitogenomic phylogeny and evolutionary history of Murinae (Rodentia, Muridae) with the description of a new tribe. ZooKeys 2025, 1233, 55–74. [Google Scholar] [CrossRef]
  26. Barbosa, S.; Paupério, J.; Pavlova, S.V.; Alves, P.C.; Searle, J.B. The Microtus voles: Resolving the phylogeny of one of the most speciose mammalian genera using genomics. Mol. Phylogent. Evol. 2018, 125, 85–92. [Google Scholar] [CrossRef]
  27. Fenn, J.D.; Song, H.; Cameron, S.L.; Whiting, M.F. A preliminary mitochondrial genome phylogeny of Orthoptera (Insecta) and approaches to maximizing phylogenetic signal found within mitochondrial genome data. Mol. Phylogenet. Evol. 2008, 49, 59–68. [Google Scholar] [CrossRef]
  28. Jacobsen, M.W.; Hansen, M.M.; Orlando, L.; Bekkevold, D.; Bernatchez, L.; Willerslev, E.; Gilbert, M.T.P. Mitogenome sequencing reveals shallow evolutionary histories and recent divergence time between morphologically and ecologically distinct European whitefish (Coregonus spp.). Mol. Ecol. 2012, 21, 2727–2742. [Google Scholar] [CrossRef]
  29. Rubinoff, D.; Holland, B.S.; Savolainen, V. Between Two Extremes: Mitochondrial DNA is neither the Panacea nor the Nemesis of Phylogenetic and Taxonomic Inference. Syst. Biol. 2005, 54, 952–961. [Google Scholar] [CrossRef] [PubMed]
  30. Smith, A.T.; Xie, Y. A Guide to the Mammals of China; Princeton University Press: Princeton, NJ, USA, 2009. [Google Scholar]
  31. Balakirev, A.E.; Abramov, A.V.; Tikhonov, A.N.; Rozhnov, V.V. Molecular phylogeny of the Dacnomys division (Rodentia, Muridae): The taxonomic positions of Saxatilomys and Leopoldamys. Dokl. Biol. Sci. 2012, 445, 251–254. [Google Scholar] [CrossRef]
  32. He, K.; Li, Y.-J.; Brandley, M.C.; Lin, L.-K.; Wang, Y.-X.; Zhang, Y.-P.; Jiang, X.-L. A multi-locus phylogeny of Nectogalini shrews and influences of the paleoclimate on speciation and evolution. Mol. Phylogent. Evol. 2010, 56, 734–746. [Google Scholar] [CrossRef] [PubMed]
  33. Modi, A.; Vai, S.; Caramelli, D.; Lari, M. The Illumina Sequencing Protocol and the NovaSeq 6000 System. Methods Mol. Biol. 2021, 2242, 15–42. [Google Scholar] [CrossRef]
  34. O’Halloran, D.M. fastQ_brew: Module for analysis, preprocessing, and reformatting of FASTQ sequence data. BMC Res. Notes 2017, 10, 275. [Google Scholar] [CrossRef] [PubMed]
  35. Meng, G.; Li, Y.; Yang, C.; Liu, S. MitoZ: A toolkit for animal mitochondrial genome assembly, annotation and visualization. Nucleic Acids Res. 2019, 47, e63. [Google Scholar] [CrossRef] [PubMed]
  36. Kearse, M.; Moir, R.; Wilson, A.; Stones-Havas, S.; Cheung, M.; Sturrock, S.; Buxton, S.; Cooper, A.; Markowitz, S.; Duran, C.; et al. Geneious Basic: An integrated and extendable desktop software platform for the organization and analysis of sequence data. Bioinformatics 2012, 28, 1647–1649. [Google Scholar] [CrossRef]
  37. Li, H.; Durbin, R. Fast and accurate short read alignment with Burrows–Wheeler transform. Bioinformatics 2009, 25, 1754–1760. [Google Scholar] [CrossRef]
  38. Li, H.; Handsaker, B.; Wysoker, A.; Fennell, T.; Ruan, J.; Homer, N.; Marth, G.; Abecasis, G.; Durbin, R. The Sequence Alignment/Map format and SAMtools. Bioinformatics 2009, 25, 2078–2079. [Google Scholar] [CrossRef]
  39. Bernt, M.; Donath, A.; Jühling, F.; Externbrink, F.; Florentz, C.; Fritzsch, G.; Pütz, J.; Middendorf, M.; Stadler, P.F. MITOS: Improved de novo metazoan mitochondrial genome annotation. Mol. Phylogent. Evol. 2013, 69, 313–319. [Google Scholar] [CrossRef]
  40. Chan, P.P.; Lin, B.Y.; Mak, A.J.; Lowe, T.M. tRNAscan-SE 2.0: Improved detection and functional classification of transfer RNA genes. Nucleic Acids Res. 2021, 49, 9077–9096. [Google Scholar] [CrossRef]
  41. Laslett, D.; Canbäck, B. ARWEN: A program to detect tRNA genes in metazoan mitochondrial nucleotide sequences. Bioinformatics 2008, 24, 172–175. [Google Scholar] [CrossRef]
  42. Greiner, S.; Lehwark, P.; Bock, R. OrganellarGenomeDRAW (OGDRAW) version 1.3.1: Expanded toolkit for the graphical visualization of organellar genomes. Nucleic Acids Res. 2019, 47, W59–W64. [Google Scholar] [CrossRef]
  43. Tamura, K. Estimation of the number of nucleotide substitutions when there are strong transition-transversion and G+C-content biases. Mol. Biol. Evol. 1992, 9, 678–687. [Google Scholar] [CrossRef] [PubMed]
  44. Steinke, D.; Nicolas, V.; Schaeffer, B.; Missoup, A.D.; Kennis, J.; Colyn, M.; Denys, C.; Tatard, C.; Cruaud, C.; Laredo, C. Assessment of Three Mitochondrial Genes (16S, Cytb, CO1) for Identifying Species in the Praomyini Tribe (Rodentia: Muridae). PLoS ONE 2012, 7, e36586. [Google Scholar] [CrossRef]
  45. Rozas, J.; Ferrer-Mata, A.; Sánchez-DelBarrio, J.C.; Guirao-Rico, S.; Librado, P.; Ramos-Onsins, S.E.; Sánchez-Gracia, A. DnaSP 6: DNA Sequence Polymorphism Analysis of Large Data Sets. Mol. Biol. Evol. 2017, 34, 3299–3302. [Google Scholar] [CrossRef] [PubMed]
  46. Tajima, F. Statistical method for testing the neutral mutation hypothesis by DNA polymorphism. Genetics 1989, 123, 585–595. [Google Scholar] [CrossRef] [PubMed]
  47. Krutovsky, K.V.; Neale, D.B. Nucleotide Diversity and Linkage Disequilibrium in Cold-Hardiness- and Wood Quality-Related Candidate Genes in Douglas Fir. Genetics 2005, 171, 2029–2041. [Google Scholar] [CrossRef] [PubMed]
  48. Tamura, K.; Stecher, G.; Kumar, S.; Battistuzzi, F.U. MEGA11: Molecular Evolutionary Genetics Analysis Version 11. Mol. Biol. Evol. 2021, 38, 3022–3027. [Google Scholar] [CrossRef]
  49. Perna, N.; Kocher, T. Patterns of nucleotide composition at fourfold degenerate sites of animal mitochondrial genomes. J. Mol. Evol. 1995, 41, 353–358. [Google Scholar] [CrossRef]
  50. Sharp, P.M.; Tuohy, T.M.F.; Mosurski, K.R. Codon usage in yeast: Cluster analysis clearly differentiates highly and lowly expressed genes. Nucleic Acids Res. 1986, 14, 5125–5143. [Google Scholar] [CrossRef]
  51. Wright, F. The ‘effective number of codons’ used in a gene. Gene 1990, 87, 23–29. [Google Scholar] [CrossRef]
  52. Patil, S.S.; Indrabalan, U.B.; Suresh, K.P.; Shome, B.R. Analysis of codon usage bias of classical swine fever virus. Vet. World 2021, 14, 1450–1458. [Google Scholar] [CrossRef] [PubMed]
  53. Peden, J.F. Analysis of Codon Usage. Ph.D. Thesis, University of Nottingham, Nottingham, UK, 2000. [Google Scholar]
  54. Sueoka, N. Directional mutation pressure and neutral molecular evolution. Proc. Natl. Acad. Sci. USA 1988, 85, 2653–2657. [Google Scholar] [CrossRef]
  55. Sueoka, N. Intrastrand parity rules of DNA base composition and usage biases of synonymous codons. J. Mol. Evol. 1996, 42, 323. [Google Scholar] [CrossRef]
  56. Zhang, D.; Gao, F.; Jakovlić, I.; Zou, H.; Zhang, J.; Li, W.X.; Wang, G.T. PhyloSuite: An integrated and scalable desktop platform for streamlined molecular sequence data management and evolutionary phylogenetics studies. Mol. Ecol. Resour. 2019, 20, 348–355. [Google Scholar] [CrossRef]
  57. Katoh, K.; Standley, D.M. MAFFT Multiple Sequence Alignment Software Version 7: Improvements in Performance and Usability. Mol. Biol. Evol. 2013, 30, 772–780. [Google Scholar] [CrossRef] [PubMed]
  58. Castresana, J. Selection of Conserved Blocks from Multiple Alignments for Their Use in Phylogenetic Analysis. Mol. Biol. Evol. 2000, 17, 540–552. [Google Scholar] [CrossRef] [PubMed]
  59. Xia, X.; Xie, Z.; Salemi, M.; Chen, L.; Wang, Y. An index of substitution saturation and its application. Mol. Phylogent. Evol. 2003, 26, 1–7. [Google Scholar] [CrossRef]
  60. Xia, X.; Kumar, S. DAMBE7: New and Improved Tools for Data Analysis in Molecular Biology and Evolution. Mol. Biol. Evol. 2018, 35, 1550–1552. [Google Scholar] [CrossRef]
  61. Ronquist, F.; Huelsenbeck, J.P. MrBayes 3: Bayesian phylogenetic inference under mixed models. Bioinformatics 2003, 19, 1572–1574. [Google Scholar] [CrossRef]
  62. Lanfear, R.; Frandsen, P.B.; Wright, A.M.; Senfeld, T.; Calcott, B. PartitionFinder 2: New Methods for Selecting Partitioned Models of Evolution for Molecular and Morphological Phylogenetic Analyses. Mol. Biol. Evol. 2017, 34, 772–773. [Google Scholar] [CrossRef]
  63. Nguyen, L.-T.; Schmidt, H.A.; von Haeseler, A.; Minh, B.Q. IQ-TREE: A Fast and Effective Stochastic Algorithm for Estimating Maximum-Likelihood Phylogenies. Mol. Biol. Evol. 2015, 32, 268–274. [Google Scholar] [CrossRef]
  64. Kalyaanamoorthy, S.; Minh, B.Q.; Wong, T.K.F.; von Haeseler, A.; Jermiin, L.S. ModelFinder: Fast model selection for accurate phylogenetic estimates. Nat. Methods 2017, 14, 587–589. [Google Scholar] [CrossRef] [PubMed]
  65. Guindon, S.; Dufayard, J.-F.; Lefort, V.; Anisimova, M.; Hordijk, W.; Gascuel, O. New Algorithms and Methods to Estimate Maximum-Likelihood Phylogenies: Assessing the Performance of PhyML 3.0. Syst. Biol. 2010, 59, 307–321. [Google Scholar] [CrossRef]
  66. Minh, B.Q.; Nguyen, M.A.T.; von Haeseler, A. Ultrafast Approximation for Phylogenetic Bootstrap. Mol. Biol. Evol. 2013, 30, 1188–1195. [Google Scholar] [CrossRef]
  67. Letunic, I.; Bork, P. Interactive Tree Of Life (iTOL): An online tool for phylogenetic tree display and annotation. Bioinformatics 2007, 23, 127–128. [Google Scholar] [CrossRef] [PubMed]
  68. Prlic, A.; Bouckaert, R.; Heled, J.; Kühnert, D.; Vaughan, T.; Wu, C.-H.; Xie, D.; Suchard, M.A.; Rambaut, A.; Drummond, A.J. BEAST 2: A Software Platform for Bayesian Evolutionary Analysis. PLoS Comp. Biol. 2014, 10, e1003537. [Google Scholar] [CrossRef]
  69. Aghová, T.; Kimura, Y.; Bryja, J.; Dobigny, G.; Granjon, L.; Kergoat, G.J. Fossils know it best: Using a new set of fossil calibrations to improve the temporal phylogenetic framework of murid rodents (Rodentia: Muridae). Mol. Phylogent. Evol. 2018, 128, 98–111. [Google Scholar] [CrossRef]
  70. Rambaut, A.; Drummond, A.J.; Xie, D.; Baele, G.; Suchard, M.A.; Susko, E. Posterior Summarization in Bayesian Phylogenetics Using Tracer 1.7. Syst. Biol. 2018, 67, 901–904. [Google Scholar] [CrossRef]
  71. Gelman, A.; Rubin, D.B. Inference from Iterative Simulation Using Multiple Sequences. Stat. Sci. 1992, 7, 457–472. [Google Scholar] [CrossRef]
  72. Alekseyenko, A.V.; Chen, S.-C.; Ogata, A. MixtureTree Annotator: A Program for Automatic Colorization and Visual Annotation of MixtureTree. PLoS ONE 2015, 10, e0118893. [Google Scholar] [CrossRef]
  73. Huelsenbeck, J.P.; Rannala, B.; Buckley, T. Frequentist Properties of Bayesian Posterior Probabilities of Phylogenetic Trees Under Simple and Complex Substitution Models. Syst. Biol. 2004, 53, 904–913. [Google Scholar] [CrossRef] [PubMed]
  74. Nguyen, T.Q.; Wang, Y.-Y.; Yang, J.-H.; Lehmann, T.; Le, M.D.; Ziegler, T.; Bonkowski, M. A new species of the Gekko japonicus group (Squamata: Sauria: Gekkonidae) from the border region between China and Vietnam. Zootaxa 2013, 3652, 501–518. [Google Scholar] [CrossRef] [PubMed]
  75. Xie, J.; Chen, Y.; Cai, G.; Cai, R.; Hu, Z.; Wang, H. Tree Visualization By One Table (tvBOT): A web application for visualizing, modifying and annotating phylogenetic trees. Nucleic Acids Res. 2023, 51, W587–W592. [Google Scholar] [CrossRef]
  76. Prada, C.F.; Boore, J.L. Gene annotation errors are common in the mammalian mitochondrial genomes database. BMC Genom. 2019, 20, 73. [Google Scholar] [CrossRef] [PubMed]
  77. Reyes, A.; Gissi, C.; Pesole, G.; Saccone, C. Asymmetrical directional mutation pressure in the mitochondrial genome of mammals. Mol. Biol. Evol. 1998, 15, 957–966. [Google Scholar] [CrossRef]
  78. Zardoya, R.; Garrido-Pertierra, A.; Bautista, J.M. The complete nucleotide sequence of the mitochondrial DNA genome of the rainbow trout, Oncorhynchus mykiss. J. Mol. Evol. 1995, 41, 942–951. [Google Scholar] [CrossRef] [PubMed]
  79. Wolstenholme, D.R. Animal Mitochondrial DNA: Structure and Evolution. Int. Rev. Cytol. 1992, 141, 173–216. [Google Scholar] [CrossRef]
  80. Ding, L.; Luo, G.; Zhou, Q.; Sun, Y.; Liao, J. Comparative Mitogenome Analysis of Gerbils and the Mitogenome Phylogeny of Gerbillinae (Rodentia: Muridae). Biochem. Genet. 2022, 60, 2226–2249. [Google Scholar] [CrossRef]
  81. Jiang, X.; Gao, J.; Ni, L.; Hu, J.; Li, K.; Sun, F.; Xie, J.; Bo, X.; Gao, C.; Xiao, J.; et al. The complete mitochondrial genome of Microtus fortis calamorum (Arvicolinae, Rodentia) and its phylogenetic analysis. Gene 2012, 498, 288–295. [Google Scholar] [CrossRef]
  82. Wu, D.; Zhou, L.; Xue, J.; Xia, Q.; Meng, L. Characterization of Two New Apodemus Mitogenomes (Rodentia: Muridae) and Mitochondrial Phylogeny of Muridae. Diversity 2022, 14, 1089. [Google Scholar] [CrossRef]
  83. Petersheim, M.; Turner, D.H. Base-stacking and base-pairing contributions to helix stability: Thermodynamics of double-helix formation with CCGG, CCGGp, CCGGAp, ACCGGp, CCGGUp, and ACCGGUp. Biochemistry 1983, 22, 256–263. [Google Scholar] [CrossRef]
  84. Lavrov, D.V.; Brown, W.M.; Boore, J.L. A novel type of RNA editing occurs in the mitochondrial tRNAs of the centipede Lithobius forficatus. Proc. Natl. Acad. Sci. USA 2000, 97, 13738–13742. [Google Scholar] [CrossRef] [PubMed]
  85. Ojala, D.; Montoya, J.; Attardi, G. tRNA punctuation model of RNA processing in human mitochondria. Nature 1981, 290, 470–474. [Google Scholar] [CrossRef]
  86. Marková, S.; Filipi, K.; Searle, J.B.; Kotlík, P. Mapping 3′ transcript ends in the bank vole (Clethrionomys glareolus) mitochondrial genome with RNA-Seq. BMC Genom. 2015, 16, 870. [Google Scholar] [CrossRef]
  87. Dorner, M.; Altmann, M.; Paabo, S.; Morl, M. Evidence for import of a lysyl-tRNA into marsupial mitochondria. Mol. Biol. Cell 2001, 12, 2688–2698. [Google Scholar] [CrossRef] [PubMed]
  88. He, G.; Li, W.; Yuan, B.; Dong, W. The complete mitochondrial genome of Echinolaelaps fukienensis provide insights into phylogeny and rearrangement in the superfamily Dermanyssoidea. PLoS ONE 2023, 18, e0288991. [Google Scholar] [CrossRef]
  89. Lin, X.; Pu, J.; Dong, W. The first mitogenome of the subfamily Stenoponiinae (Siphonaptera: Ctenophthalmidae) and implications for its phylogenetic position. Sci. Rep. 2024, 14, 18179. [Google Scholar] [CrossRef] [PubMed]
  90. Liu, J.; Zhu, D.; Ma, G.; Liu, M.; Wang, M.; Jia, R.; Chen, S.; Sun, K.; Yang, Q.; Wu, Y.; et al. Genome-Wide Analysis of the Synonymous Codon Usage Patterns in Riemerella anatipestifer. Int. J. Mol. Sci. 2016, 17, 1304. [Google Scholar] [CrossRef] [PubMed]
  91. Yang, H.J.; Yang, Z.H.; Ren, T.G.; Dong, W.G. The complete mitochondrial genome of Eulaelaps huzhuensis (Mesostigmata: Haemogamasidae). Exp. Appl. Acarol. 2023, 90, 301–316. [Google Scholar] [CrossRef]
  92. Petrov, D.A.; Charneski, C.A.; Honti, F.; Bryant, J.M.; Hurst, L.D.; Feil, E.J. Atypical AT Skew in Firmicute Genomes Results from Selection and Not from Mutation. PLoS Genet. 2011, 7, e1002283. [Google Scholar] [CrossRef]
  93. Dorus, S.; Busby, S.A.; Gerike, U.; Shabanowitz, J.; Hunt, D.F.; Karr, T.L. Genomic and functional evolution of the Drosophila melanogaster sperm proteome. Nat. Genet. 2006, 38, 1440–1445. [Google Scholar] [CrossRef]
  94. Hurst, L.D. The Ka/Ks ratio: Diagnosing the form of sequence evolution. Trends Genet. 2002, 18, 486. [Google Scholar] [CrossRef]
  95. Chen, W.; Qian, W.; Miao, K.; Qian, R.; Yuan, S.; Liu, W.; Dai, J.; Hu, C.; Chang, Q. Comparative Mitogenomics of True Frogs (Ranidae, Anura), and Its Implications for the Phylogeny and Evolutionary History of Rana. Animals 2022, 12, 1250. [Google Scholar] [CrossRef]
  96. Yang, H.; Li, T.; Dang, K.; Bu, W. Compositional and mutational rate heterogeneity in mitochondrial genomes and its effect on the phylogenetic inferences of Cimicomorpha (Hemiptera: Heteroptera). BMC Genom. 2018, 19, 264. [Google Scholar] [CrossRef]
  97. Yue, B.-S.; Hu, C.; Zhang, C.; Sun, L.; Zhang, Y.; Xie, W.; Zhang, B.; Chang, Q. The mitochondrial genome of pin-tailed snipe Gallinago stenura, and its implications for the phylogeny of Charadriiformes. PLoS ONE 2017, 12, e0175244. [Google Scholar] [CrossRef]
  98. Zheng, C.G.; Zhu, X.X.; Yan, L.P.; Yao, Y.; Bu, W.J.; Wang, X.H.; Lin, X.L. First complete mitogenomes of Diamesinae, Orthocladiinae, Prodiamesinae, Tanypodinae (Diptera: Chironomidae) and their implication in phylogenetics. PeerJ 2021, 9, e11294. [Google Scholar] [CrossRef]
  99. Kretzschmar, C.; Roolf, C.; Timmer, K.; Sekora, A.; Knubel, G.; Murua Escobar, H.; Fuellen, G.; Ibrahim, S.M.; Tiedge, M.; Baltrusch, S.; et al. Polymorphisms of the murine mitochondrial ND4, CYTB and COX3 genes impact hematopoiesis during aging. Oncotarget 2016, 7, 74460–74472. [Google Scholar] [CrossRef] [PubMed]
  100. Yu, L.; Wang, X.; Ting, N.; Zhang, Y. Mitogenomic analysis of Chinese snub-nosed monkeys: Evidence of positive selection in NADH dehydrogenase genes in high-altitude adaptation. Mitochondrion 2011, 11, 497–503. [Google Scholar] [CrossRef] [PubMed]
  101. Suzuki, H.; Tsuchiya, K.; Takezaki, N. A Molecular Phylogenetic Framework for the Ryukyu Endemic Rodents Tokudaia osimensis and Diplothrix legata. Mol. Phylogent. Evol. 2000, 15, 15–24. [Google Scholar] [CrossRef]
  102. Martin, Y.; Gerlach, G.; Schlötterer, C.; Meyer, A. Molecular Phylogeny of European Muroid Rodents Based on Complete Cytochrome b Sequences. Mol. Phylogent. Evol. 2000, 16, 37–47. [Google Scholar] [CrossRef] [PubMed]
  103. Jing, J.; Song, X.; Yan, C.; Lu, T.; Zhang, X.; Yue, B. Phylogenetic analyses of the harvest mouse, Micromys minutus (Rodentia: Muridae) based on the complete mitogenome sequences. Biochem. Syst. Ecol. 2015, 62, 121–127. [Google Scholar] [CrossRef]
  104. Minwer-Barakat, R.; García-Alix, A.; Martín-Suárez, E.; Freudenthal, M. Micromys caesaris, a new murid (Rodentia, Mammalia) from the Late Pliocene of the Guadix Basin, southeastern Spain. J. Paleontol. 2016, 82, 436–441. [Google Scholar] [CrossRef]
  105. Fabre, P.-H.; Upham, N.S.; Emmons, L.H.; Justy, F.; Leite, Y.L.R.; Loss, A.C.; Orlando, L.; Tilak, M.-K.; Patterson, B.D.; Douzery, E.J.P. Mitogenomic phylogeny, diversification, and biogeography of South American spiny rats. Mol. Biol. Evol. 2016, 34, 613–633. [Google Scholar] [CrossRef]
  106. Tonini, J.; Moore, A.; Stern, D.; Shcheglovitova, M.; Ortí, G. Concatenation and Species Tree Methods Exhibit Statistically Indistinguishable Accuracy under a Range of Simulated conditions. PLoS Curr. 2015, 7, 1. [Google Scholar] [CrossRef]
  107. Pagès, M.; Fabre, P.H.; Chaval, Y.; Mortelliti, A.; Nicolas, V.; Wells, K.; Michaux, J.R.; Lazzari, V. Molecular phylogeny of South-East Asian arboreal murine rodents. Zool. Scr. 2015, 45, 349–364. [Google Scholar] [CrossRef]
  108. Peters, J.L.; Zhuravlev, Y.N.; Fefelov, I.; Humphries, E.M.; Omland, K.E. Multilocus Phylogeography of a Holarctic Duck: Colonization of North America from Eurasia by Gadwall (Anas Strepera). Evolution 2008, 62, 1469–1483. [Google Scholar] [CrossRef]
  109. Shen, Y.; Gong, Y.; Solovyeva, D.; Wang, L.; Li, M.; Hu, M.; Jiang, Y.; Vartanyan, S.; Wang, H. Genetic diversity and shallow genetic differentiation of the endangered scaly-sided merganser Mergus squamatus. Ecol. Evol. 2024, 14, e70011. [Google Scholar] [CrossRef]
  110. Brook, B.W.; Sodhi, N.S.; Ng, P.K.L. Catastrophic extinctions follow deforestation in Singapore. Nature 2003, 424, 420–423. [Google Scholar] [CrossRef]
  111. Zang, R.; Connette, G.M.; Oswald, P.; Thura, M.K.; LaJeunesse Connette, K.J.; Grindley, M.E.; Songer, M.; Zug, G.R.; Mulcahy, D.G. Rapid forest clearing in a Myanmar proposed national park threatens two newly discovered species of geckos (Gekkonidae: Cyrtodactylus). PLoS ONE 2017, 12, e0174432. [Google Scholar] [CrossRef]
  112. Frankham, R. Relationship of Genetic Variation to Population Size in Wildlife. Conserv. Biol. 2002, 10, 1500–1508. [Google Scholar] [CrossRef]
  113. Soule, M. Allozyme variation: Its determinants in space and time. Mol. Evol. 1976, 60–77. [Google Scholar]
  114. Knapp, M.; Latinne, A.; Waengsothorn, S.; Rojanadilok, P.; Eiamampai, K.; Sribuarod, K.; Michaux, J.R. Combined Mitochondrial and Nuclear Markers Revealed a Deep Vicariant History for Leopoldamys neilli, a Cave-Dwelling Rodent of Thailand. PLoS ONE 2012, 7, e47670. [Google Scholar] [CrossRef]
  115. Spielman, D.; Brook, B.W.; Frankham, R. Most species are not driven to extinction before genetic factors impact them. Proc. Natl. Acad. Sci. USA 2004, 101, 15261–15264. [Google Scholar] [CrossRef] [PubMed]
  116. Moritz, C. Defining ‘Evolutionarily Significant Units’ for conservation. Trends Ecol. Evol. 1994, 9, 373–375. [Google Scholar] [CrossRef] [PubMed]
  117. Wang, W.; Zheng, Y.; Zhao, J.; Yao, M. Low genetic diversity in a critically endangered primate: Shallow evolutionary history or recent population bottleneck? BMC Evol. Biol. 2019, 19, 134. [Google Scholar] [CrossRef] [PubMed]
  118. Avise, J.C. Phylogeography: The History and Formation of Species; Harvard University Press: London, UK, 2000. [Google Scholar]
  119. Losos, J. Lizards in an Evolutionary Tree: Ecology and Adaptive Radiation of Anoles; University of California Press: Oakland, CA, USA, 2009. [Google Scholar]
  120. Nevo, E. Adaptive Convergence and Divergence of Subterranean Mammals. Annu. Rev. Ecol. Syst. 1979, 10, 269–308. [Google Scholar] [CrossRef]
Figure 1. Biogeographic distribution of Dacnomys millardi occurrence records classified by evidence type. Here, Red points = whole-mitogenome sequenced specimens with morphological validation (this study), Blue points = published genetic samples (partial CYTB/COX1 sequences), Green points = museum vouchers with only morphology. Data are from new occurrence records of southwestern China (this study), genetic samples and museum voucher records of Abramov et al. (2017) [2].
Biology 14 00948 g001
Figure 2. Morphological characterization of Dacnomys millardi (specimen E420001). (A) The cranium and mandible in dorsal, ventral, and lateral views; (B) the study skin in dorsal, ventral, and lateral views.
Biology 14 00948 g002
Figure 3. Circular mitogenome map of the Dacnomys millardi. The morphological illustration of D. millardi (inset) was adapted from Wilson et al. (2017, Figure 639) [1].
Biology 14 00948 g003
Figure 4. Predicted cloverleaf secondary structures of 22 tRNAs in Dacnomys millardi mitogenome (GenBank: PQ359525). The structures of tRNAs were identified using tRNAscan-SE v2.0 and ARWEN v1.2. Anticodons were indicated by bracket annotations. Watson–Crick pairings are denoted by dashes (−); non-Watson–Crick pairings marked with red dots (·).
Biology 14 00948 g004
Figure 5. The relative synonymous codon usage (RSCU) patterns for 13 protein-coding genes (PCGs) in the Dacnomys millardi mitogenome.
Biology 14 00948 g005
Figure 6. Selective pressure analysis of 13 protein-coding genes (PCGs) in the Dacnomys millardi mitogenome. Ka/Ks ratios were calculated for 13 PCGs using the complete mitogenome (GenBank: PQ359525) with Ratufa bicolor (NC_023780) and Pteromys volans (NC_019612) as outgroups in DnaSP v6.12.03 (default parameters).
Biology 14 00948 g006
Figure 7. Multivariate analysis of codon usage bias of 13 protein-coding genes (PCGs) in the Dacnomys millardi mitogenome. (A) Correspondence analysis (COA) of codon frequencies (Axis 1: the first principal component; Axis 2: the second principal component); (B) effective number of codons (ENC)-plot (GC3s: GC content of the third position of synonymous codon; Nc: effective number of codons; the linear expression y = 37.1 + 7.08x is shown as a blue line in the figure, R2 represents the correlation, and p represents the significant difference); (C) parity rule 2 (PR2) plot of purine/pyrimidine bias; and (D) neutrality curve (GC12: average value of the first and second positions of synonymous codon; the linear expression y = 47.4 − 0.191x is shown as a green line in the figure, blue dots represent protein-coding genes).
Biology 14 00948 g007
Figure 8. Phylogenetic reconstruction of Murinae based on partitioned mitochondrial PCGRNA alignment (13,735 bp). Purple points denote nodes with strong concordant support (BI, PP ≥ 0.95 and ML, BS ≥ 70%); the remaining nodes show BI posterior probabilities (left) and ML bootstrap supports percentages (right). The seven tribes of Murinae are marked by different colors. Ratufa bicolor and Pteromys volans were used as the outgroups.
Biology 14 00948 g008
Figure 9. Time-calibrated phylogeny of the subfamily Murinae (Rodentia: Muridae) inferred from mitogenomes using BEAST v2.6.7. Nodes show medians of times to MRCA; node bars indicate 95% HPD intervals. Arabic numerals in yellow squares indicate positions of four fossil constraints selected by multiple-step evaluation and used for final analysis (see Table S5 for more details).
Biology 14 00948 g009
Table 1. Structural characteristics and annotation of the Dacnomys millardi mitogenome.
GeneStrandPosition (bp)Size (bp)Start CodonStop CodonAnticodonIntergenic
Nucleotides
trnFH1–6969 GAA0
rrnSH70–1023954 0
trnVH1024–109269 UAC0
rrnLH1093–26681576 0
trnL1H2667–274175 UAG−2
ND1H2739–3698960ATATAG −3
trnIH3697–376569 GAU−2
trnQL3763–383371 UUG−3
trnMH3837–390569 CAU3
ND2H3906–49401035ATTAGA 0
trnWH4942–500766 UCA1
trnAL5009–507769 UGC1
trnNL5079–514971 GUU1
OLL5150–518031 0
trnCL5181–524767 GCA0
trnYL5248–531467 GUA0
COX1H5316–68601545ATGTAA 1
trnS2L6858–692669 UGA−3
trnDH6930–699869 GUC3
COX2H7000–7683684ATGTAA 1
trnKH7687–775064 UUU3
ATP8H7752–7955204ATGTAA 1
ATP6H7913–8593681ATGTAA −43
COX3H8593–9376784ATGT-- −1
trnGH9377–944468 UCC0
ND3H9445–9792348ATCTAA 0
trnRH9794–986269 UCG1
ND4LH9865–10,161297ATGTAA 2
ND4H10,155–11,5321378ATGT-- −7
trnHH11,533–11,60068 GUG0
trnS1H11,601–11,65959 GCU0
trnL2H11,659–11,72971 UAA−1
ND5H11,736–13,5591824ATATAA 6
ND6L13,537–14,055519ATGTAA −23
trnEL14,056–14,12469 UUC0
CYTBH14,130–15,2731144ATGT-- 5
trnTH15,274–15,34067 UGU0
trnPL15,341–15,40868 UGG0
D-loopH15,409–16,289881 0
Table 2. Nucleotide composition and AT-GC skew of the Dacnomys millardi mitogenome.
Dacnomys millardiSize (bp)A%T%G%C%A + T%G + C%AT SkewGC Skew
Mitogenome16,28933.928.112.125.962.038.00.094−0.363
PCGs11,40031.629.711.727.061.338.70.031−0.396
rRNAs253038.224.916.620.363.136.90.211−0.099
tRNAs150334.431.317.816.665.734.40.0480.035
D-loop88133.629.311.625.562.937.10.068−0.375
OL3125.816.129.029.141.958.10.232−0.002
Table 3. Codon frequency and relative synonymous codon usage (RSCU) for 13 protein-coding genes (PCGs) in the Dacnomys millardi mitogenome.
CodonNo.RSCUCodonNo.RSCUCodonNo.RSCUCodonNo.RSCU
UUU(F)1070.92GUG(V)60.15CAU(H)370.71UGG(W)40.08
UUC(F)1261.08CCU(P)440.98CAC(H)671.29CGU(R)110.69
UUA(L)1221.23CCC(P)601.21CAA(Q)801.95CGC(R)110.69
UUG(L)110.11CCA(P)921.86CAG(Q)20.05CGA(R)372.31
CUU(L)860.87CCG(P)20.04AAU(N)600.73CGG(R)50.31
CUC(L)1031.04ACU(T)600.80AAC(N)1041.27GGU(G)390.69
CUA(L)2632.65ACC(T)851.12AAA(K)961.94GGC(G)581.11
CUG(L)100.10ACA(T)1552.04AAG(K)30.06GGA(G)1011.93
AUU(I)2011.02ACG(T)30.04GAU(D)260.72GGG(G)140.27
AUC(I)1950.98GCU(A)581.01GAC(D)461.28UCU(S)350.69
AUA(M)1931.75GCC(A)901.57GAA(E)841.75UCC(S)921.80
AUG(M)280.25GCA(A)781.36GAG(E)120.25UCA(S)1222.39
GUU(V)431.09GCG(A)40.07UGU(C)120.83UCG(S)30.06
GUC(V)310.78UAU(Y)620.98UGC(C)171.17AGU(S)170.33
GUA(V)781.97UAC(Y)641.02UGA(W)1001.92AGC(S)370.73
Notes: Termination codons were excluded from analysis. Preferred codons (RSCU > 1.0) are in bold, over-represented codons (RSCU > 1.6) are highlighted in red, and under-represented codons (RSCU < 0.6) are presented in blue.
Disclaimer/Publisher’s Note: The statements, opinions and data contained in all publications are solely those of the individual author(s) and contributor(s) and not of MDPI and/or the editor(s). MDPI and/or the editor(s) disclaim responsibility for any injury to people or property resulting from any ideas, methods, instructions or products referred to in the content.

