Article

The Regulatory Role of EvfG Through Coordinated Control of Flagellar Biosynthesis and Energy Metabolism in Porcine Extraintestinal Pathogenic Escherichia coli (ExPEC)

1
Hubei Key Laboratory of Animal Nutrition and Feed Science, Wuhan Polytechnic University, Wuhan 430023, China
2
Engineering Research Center of Feed Protein Resources on Agricultural By-Products, Ministry of Education, Wuhan Polytechnic University, Wuhan 400023, China
3
Hubei Collaborative Innovation Center for Animal Nutrition and Feed Safety, Wuhan 400023, China
4
School of Basic Medicine, Hubei University of Arts and Science, Xiangyang 441000, China
*
Authors to whom correspondence should be addressed.
These authors contributed equally to this work.
Biology 2025, 14(7), 822; https://doi.org/10.3390/biology14070822
Submission received: 27 April 2025 / Revised: 26 June 2025 / Accepted: 27 June 2025 / Published: 7 July 2025

Simple Summary

Extraintestinal pathogenic Escherichia coli (ExPEC) is a pathogen that can invade and colonize multiple tissues outside the intestine, leading to diseases such as sepsis, immune damage and meningitis. In recent years, the isolation rate of porcine ExPEC has been increasing and exhibits multidrug resistance, which poses severe challenges to the prevention and control of porcine ExPEC. The correct assembly and drive of flagellar-associated gene expression are essential for the motility and pathogenicity of ExPEC. This study was conducted to elucidate the regulator role of EvfG in porcine ExPEC PCN033. We found that the deletion of the gene evfG in the type VI secretion system gene cluster significantly affected the motility of porcine ExPEC PCN033. The metabolome profile and functional annotation analysis indicated that the motility of ΔevfG was inhibited by the energy metabolism pathway and the downregulation of gene expression levels related to flagellar assembly. This research confirmed that evfG can affect the motility of PCN033 by regulating energy metabolism and the expression of flagellar genes, while also providing a theoretical basis for strategies aimed at preventing and controlling infections caused by porcine ExPEC PCN033.

Abstract

In this study, we found that the deletion of the gene evfG in the type VI secretion system (T6SS) gene cluster significantly affected the motility of porcine extraintestinal pathogenic Escherichia coli (ExPEC) strain PCN033. Furthermore, the bacterial motility assay showed that ΔevfG mutants exhibited reduced motility compared to the parental strain. Transmission electron microscopy (TEM) showed a significant reduction in the number of flagella in the mutant ΔevfG when compared with PCN033. To further explore the reasons why the deletion of evfG affects the motility of PCN033, transcriptomic and metabolomic analyses were conducted. The omics analyses showed that 134 differentially accumulated metabolites and 2236 differentially expressed genes were identified between the mutant ΔevfG and the parental strain PCN033. The metabolome profile and functional annotation analyses indicated that the impaired motility of ΔevfG was connected to the downregulation of the expression levels of genes associated with the energy metabolism pathway and flagellar assembly. Our study provides a new insight into the diminished PCN033 motility induced by evfG deletion. Moreover, the candidate genes and metabolites regulated by the gene evfG in the T6SS, which was involved in the motility of PCN033, were reported in this study.

1. Introduction

Extraintestinal pathogenic Escherichia coli (ExPEC) is a pathogen that can invade and colonize multiple tissues outside the intestine, leading to diseases such as sepsis, immune damage and meningitis [1,2,3]. The isolation rate of porcine ExPEC has been rising in recent years due to China’s swine breeding industry’s rapid development. Additionally, the majority of isolated strains displayed multidrug resistance, which presents significant obstacles to ExPEC prevention and management [4,5,6]. In addition, numerous studies have reported on the similarities between porcine ExPEC and human ExPEC in terms of serogroup and pathogenic characteristics, suggesting that porcine ExPEC may be a zoonotic pathogen and could pose a threat to public health [7,8,9]. At present, there are no effective preventive and therapeutic measures for porcine ExPEC; therefore, the pathogenic mechanism of porcine ExPEC requires further study [10].
The type VI secretion system (T6SS), recognized as a multiprotein apparatus, is widely found in Gram-negative bacteria. It facilitates the delivery of toxins, proteins, and various molecules from bacterial cells into their target cells [11,12,13]. The T6SS gene cluster is usually composed of 15–25 genes, including hcp, vgrG, clpV, icmF and so on, in the bacterial genome [14,15,16]. Thus, T6SS is assembled by complex components to form a needle-like hollow tube structure. During the process of bacterial pathogenicity, the T6SS assists bacteria to invade and infect host cells, leading to the development of the disease [17,18]. In addition, T6SS is involved in bacterial collective behavior, biofilm formation, and antibiotic resistance [19,20]. Some reports have shown that when the core gene or effectors of T6SS are missing, the competitiveness and pathogenicity of ExPEC are significantly decreased, highlighting the crucial role of T6SS in the survival and pathogenesis of porcine ExPEC [21,22,23]. Previous studies have reported that EvfG in the T6SS in the human ExPEC RS218 strain is a multifunctional protein that can inhibit bacterial flagellar synthesis, affect bacterial motility, and is also related to bacterial virulence, oxidative stress, and drug transport [16]. However, in porcine ExPEC, previous research has only reported that the EvfG encoded by gene evfG in the T6SS gene cluster is a nonclassical protein of unclear function [14,15]. The function of the gene evfG in the T6SS gene cluster on ExPEC pathogenicity is still unclear. Although we found that the deletion of gene evfG significantly diminished the motility of PCN033 and led to a noticeable decrease in the flagella count of PCN033 in this investigation, the relevant mechanism has not been reported yet. Therefore, this study aimed to reveal the mechanism by which gene evfG regulates flagellar assembly to affect porcine ExPEC movement and subsequently impact pathogenicity.
The movement of bacteria is crucial during the initial phases of pathogenic bacterial infections, as well as in the processes of colonization and biofilm development [24]. Depending on the growth environment, Escherichia coli (E. coli) has two common states of movement: moving independently in large amounts of liquid (swimming); and moving with other cells in a liquid film on a wet surface (swarming). The thrust of both modes of motion is generated by the rotating spiral flagella [25]. The movement of the flagella not only helps the bacteria to better adapt to the environment, but is also closely related to its chemotaxis, adhesion, virulence, and pathogenicity. The flagellum’s migration to host cells is crucial for colonization and is required for adhesion and invasion [26]. Flagella also facilitate the escape of bacteria from infected macrophages and return to the broader environment of the host [27]. Therefore, it is of great significance, for revealing porcine ExPEC pathogenic mechanisms, to study the mechanism by which gene evfG affects porcine ExPEC movement.
Recently, transcriptomics and metabolomics have been widely used to study the survival and pathogenic mechanisms of pathogenic bacteria [28,29]. To elucidate the mechanism by which T6SS EvfG regulates the motility of porcine ExPEC PCN033, liquid chromatography-mass spectrometry (LC-MS) was employed to identify differential accumulation metabolites (DAMs) in PCN033 (parental strain) and ΔevfG (mutant). Additionally, RNA-Seq was used to analyze differentially expressed genes (DEGs), which was later confirmed through qRT-PCR. This research clarified the genes and metabolites impacted by the evfG gene concerning the motility of ExPEC PCN033, while also providing a theoretical basis for strategies aimed at preventing and controlling infections caused by porcine ExPEC PCN033.

2. Materials and Methods

2.1. Bacteria and Culture Conditions

The porcine ExPEC strains (parental strain PCN033, mutant ΔevfG of PCN033 and its complementary strain ΔevfG-EvfG) used in this study were donated by the State Key Laboratory of Agricultural Microbiology and stored at our lab. The porcine ExPEC strain PCN033 was isolated from the brain tissue of diseased pigs at a pig farm in Hunan Province (China) in 2006; its serotypes and virulence genes were analyzed in 2012 [4]. All strains were cultured in either Luria-Bertani (LB) broth or on LB agar plates.

2.2. Bacteria Motility Assays

The motility assay was conducted using a method reported previously with slight modifications [30,31,32]. For the analysis of swimming motility, PCN033, ΔevfG, and ΔevfG-EvfG were cultured on semi-solid agar (comprising 1% tryptone, 0.5% sodium chloride, and 0.3% agar) at 30 °C for 14 h. Furthermore, for the assessment of swarming motility, these strains (PCN033, ΔevfG, and ΔevfG-EvfG) were cultivated on solid agar (containing 1% tryptone, 0.5% sodium chloride, 0.4% agar, and 0.3% beef extract) at 37 °C for 12 h. By comparing the motility ability of the mutant with the parental strain and the motility ability of the complementary strain with the mutant strain, the impact of evfG deletion on the motility (both swimming and swarming) of PCN033 was elucidated.

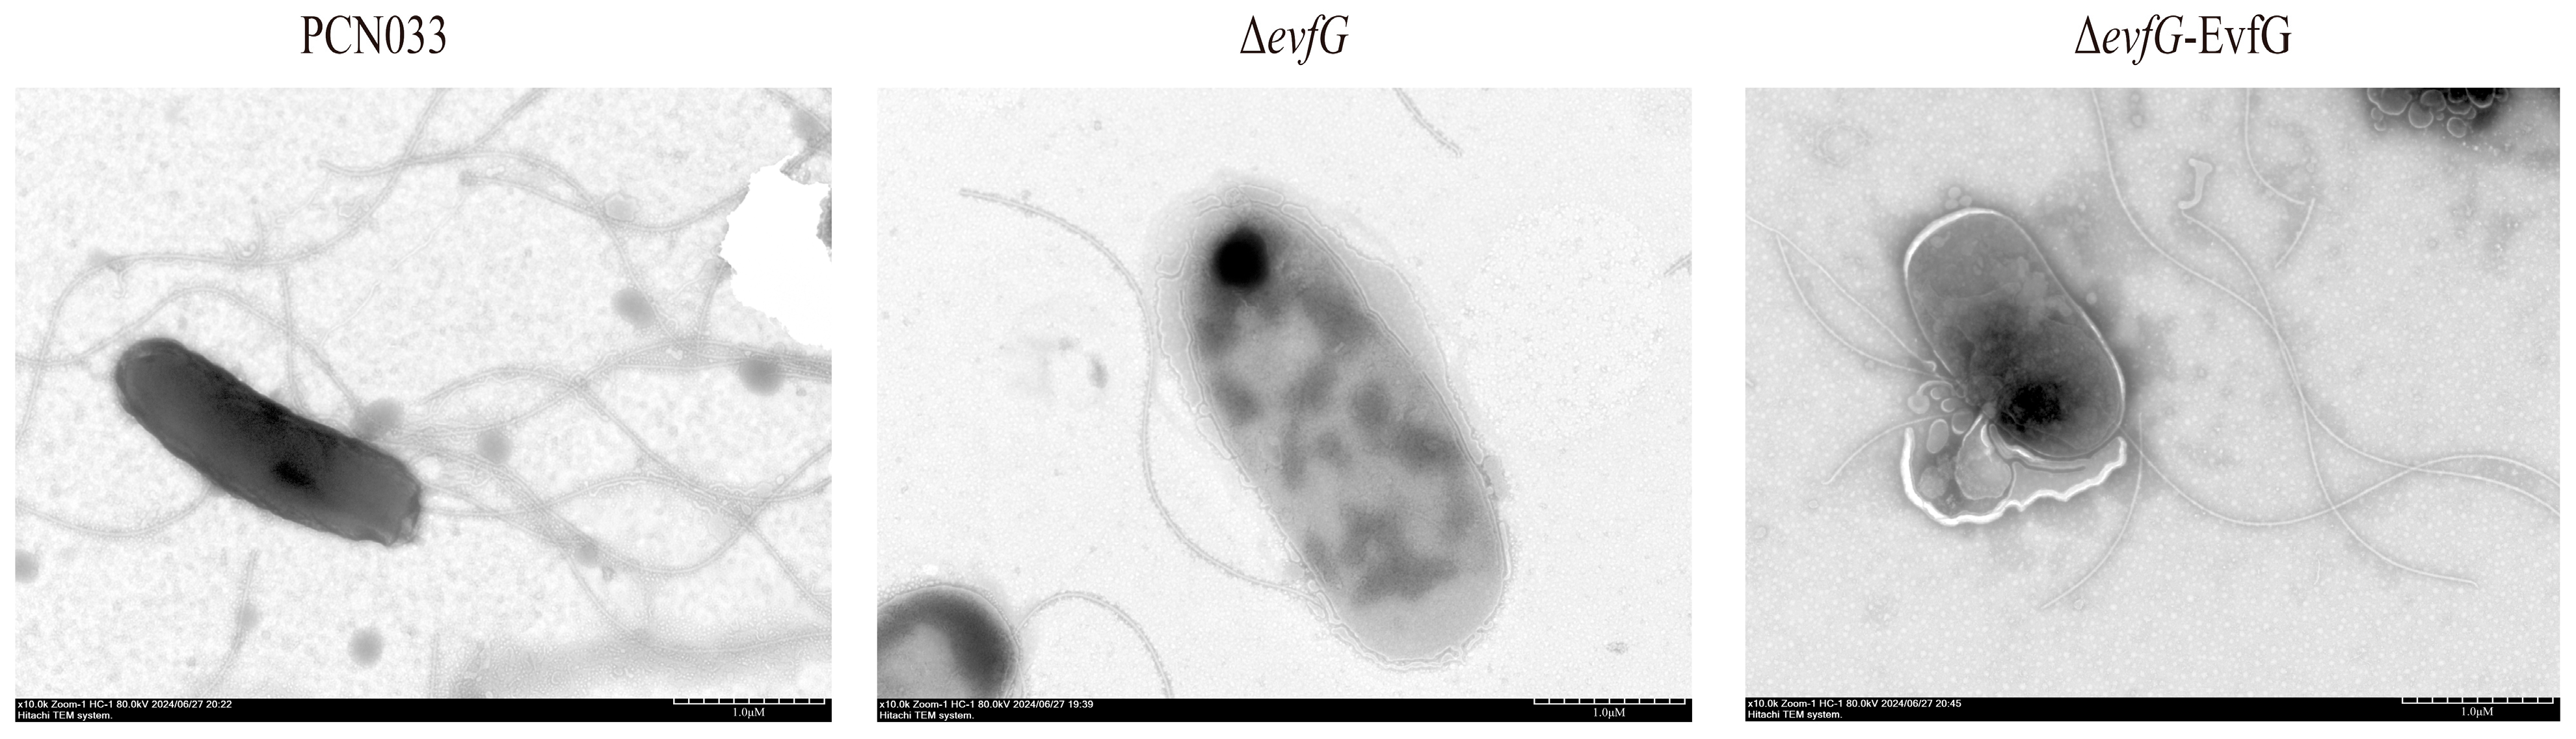
2.3. Bacterial Flagella Visualization with Transmission Electron Microscopy (TEM)

TEM was conducted, as outlined in previous studies [32,33]. Initially, the bacterial strains—including the parental strain PCN033, the mutant strain ΔevfG, and its complementary strain ΔevfG-EvfG—were grown overnight in LB media. Following this incubation, these cultures were diluted 1:1000 into new media and permitted to grow at 37 °C until they achieved an optical density (OD600) of 0.6 to 0.8. After centrifuging the bacterial cells for 20 min at a speed of 1000 rpm, they were rinsed with phosphate-buffered saline (PBS). After that, aliquots of the suspension cells were placed onto copper grids that featured a mesh size of 200–400, negatively stained for one minute with 1% phosphotungstic acid, and then photographed using a TEM.

2.4. Total RNA Extraction, Library Building, and Transcriptome Sequencing

Total RNA was obtained from PCN033 (n = 3) and ΔevfG (n = 3) utilizing the TRIzol reagent (Takara, Dalian, China). To eliminate genomic DNA from the extracted total RNA, DNase I (Takara) was applied. An RNA-seq transcriptome library was constructed from 2 µg of RNA employing the TruSeqTM RNA Sample Preparation Kit (Illumina, San Diego, CA, USA). Initially, ribosomal RNA (rRNA) was removed with the Ribo-Zero Magnetic Kit (epicenter). Subsequently, a fragmentation buffer was employed to cleave the mRNA into smaller fragments (approximately 200 bp). The fragmented mRNA was reverse transcribed into cDNA through qRT-PCR with the SuperScript Double-Stranded cDNA Synthesis Kit (Invitrogen, Carlsbad, CA, USA) and random hexamer primers (Illumina). During the synthesis of the second strand, dTTP was substituted with dUTP. After the synthesis, the cDNA underwent end-repair and phosphorylation processes. Subsequently, an “A” base was added to the cDNA following Illumina’s protocol. The second-strand cDNA containing dUTP was then identified and broken down by the UNG enzyme. The library was made using 200 bp cDNA target fragments and 2% low-range ultra-agarose. These fragments were measured with TBS380 following 15 PCR cycles of amplification using Phusion DNA polymerase. Finally, a paired-end RNA-seq sequencing library was developed using an Illumina Novaseq with a read length of 2 × 150 bp.

2.5. Transcriptome Data Analysis

Base calling was used to transform the raw data from Illumina Hiseq sequencing and the output was saved in FASTQ file format. The reference sequences (GenBank: CP006632.1) were mapped to the assembled sequences and individual genes using Bowtie with default parameters. The abundance of genes and transcripts was assessed through the use of FPKM (fragments per kilobase million). The transcriptome data were analyzed on Majorbio’s (Shanghai, China) cloud platform. Furthermore, the DEGs between PCN033 and ΔevfG were identified using DESeq2, with p-values adjusted for multiple testing via Benjamini/Hochberg (BH). DEGs were defined as having adjusted p < 0.05 and fold change ≥2 or ≤1. KEGG analysis was performed using an R script; GO analysis of DEGs was conducted via Goatools.

2.6. Metabolite Extraction

After growing in LB media overnight, the strain PCN033 and ΔevfG were transferred at a 1:1000 ratio into a new medium and allowed to develop to an OD600 of 0.6–0.8 at 37 °C. After centrifuging the bacterial cells for five minutes at 12,000 rpm, they were rinsed with phosphate-buffered saline (PBS). After precisely weighing a 50 mg solid sample, the metabolites were extracted using an internal standard of 0.02 mg/mL L-2-chlorophenylalanin and a 400 µL methanol:water (4:1, v/v) solution. After being instantly pulverized for 6 min at −10 °C and 50 Hz in a high-throughput tissue crusher (Wonbio-96c, Shanghai Wanbo Biotechnology Co., Ltd., Shanghai, China), the mixture was treated for 30 min at 5 °C and 40 kHz in an ultrasonic cleaner (SBL-10TD, Ningbo Xinzhi Biotechnology Co., Ltd., Ningbo, China). After that, the samples were kept for 30 min at −20 °C. Following centrifugation at 13,000× g for 15 min at 4 °C, the supernatant was meticulously collected and placed into sample vials for analysis using LC-MS.

2.7. Metabolite Extract LC-MS and Quality Control (QC) Measurements

An LC-MS system was used to investigate metabolite extracts. The system consisted of a Q-Exactive mass spectrometer (Thermo Scientific™, Waltham, MA, USA) coupled with a Vanquish Horizon UHPLC system (Thermo Scientific™). An HSS T3 column (100 mm × 2.1 mm i.d., 1.8 μm particle size, Waters, Milford, MA, USA) was filled with 2 μL of the extracts. The mobile phases were composed of solvent A (0.1% formic acid in water:acetonitrile, 95:5, v/v) and solvent B (0.1% formic acid in acetonitrile:isopropanol:water, 47.5:47.5:5, v/v). The gradient elution program was as follows: 0–0.1 min, 0% B increasing to 5% B; 0.1–2 min, 5% B increasing to 25% B; 2–9 min, 25% B increasing to 100% B; 9–13 min, maintaining 100% B; 13–13.1 min, decreasing from 100% B to 0% B; 13.1–16 min, holding at 0% B. The injection volume was set to 2 µL. The flow rate was maintained at 0.4 mL/min under a temperature of 40 °C. Data were obtained through continuous scanning in both positive and negative ionization modes. The electrospray ionization (ESI) source parameters were configured as follows: mass-to-charge (m/z), 70–1050; sheath gas flow rate of 40 arbitrary units (arb); auxiliary gas flow rate of 10 arb; auxiliary gas heater temperature of 400 °C; capillary temperature of 320 °C; ESI+ spray voltage of +3500 V; ESI− spray voltage of −2800 V; and normalized collision energy levels of 20, 40, and 60 V. The mass spectrometer operated at a resolution of 70,000 for full-scan MS and 17,500 for tandem MS/MS experiments. Data collection was carried out in Data Dependent Acquisition (DDA) mode.

2.8. Metabolite Data Analysis

Metabolite data were analyzed with the help of Progenesis QI (Waters Corporation, Milford, CT, USA) to generate a 3D CSV matrix, which included details about the samples, the names of metabolites, and the intensity of mass spectral responses. After removing internal standard peaks, noise, column bleed, and derivatization artifacts, data were deduplicated and peak-pooled. Metabolic features were identified via precise mass analysis, MS/MS fragmentation, and isotope ratio matching against METLIN and HMDB.
These data were uploaded to the Majorbio cloud platform (https://cloud.majorbio.com, accessed on 26 June 2025) for further database-driven analysis. At least 80% of the identified metabolic characteristics were preserved in each batch of samples. Each metabolic feature was standardized by sum, and values below the lower limit of quantification in specific samples were imputed using minimal metabolite levels. Sum normalization was applied to the sample mass spectral peak intensities to generate the normalized data matrix. After eliminating the QC samples with variables exhibiting a relative standard deviation exceeding 30%, the resulting data matrix was subjected to a logarithmic transformation (log10) in preparation for further analysis.
The data array that had undergone preprocessing was subsequently analyzed using principal component analysis (PCA) and orthogonal partial least squares discriminant analysis (OPLS-DA) through the R package (Version 1.6.2). Model stability was evaluated using seven-fold cross-validation. DAMs were identified based on VIP values from the OPLS-DA model combined with Student’s t-tests, with significance thresholds set at VIP > 1 and p < 0.05. In order to determine the associations of differential metabolites with specific pathways, metabolic pathway annotation was performed utilizing the KEGG database. The pathway enrichment analysis was carried out using the Python packages scipy.stats (Version: 1.16.0, https://docs.scipy.org/doc/scipy/, accessed on 26 June 2025), while Fisher’s exact test was employed to identify the biological pathways most closely associated with the experimental treatments.

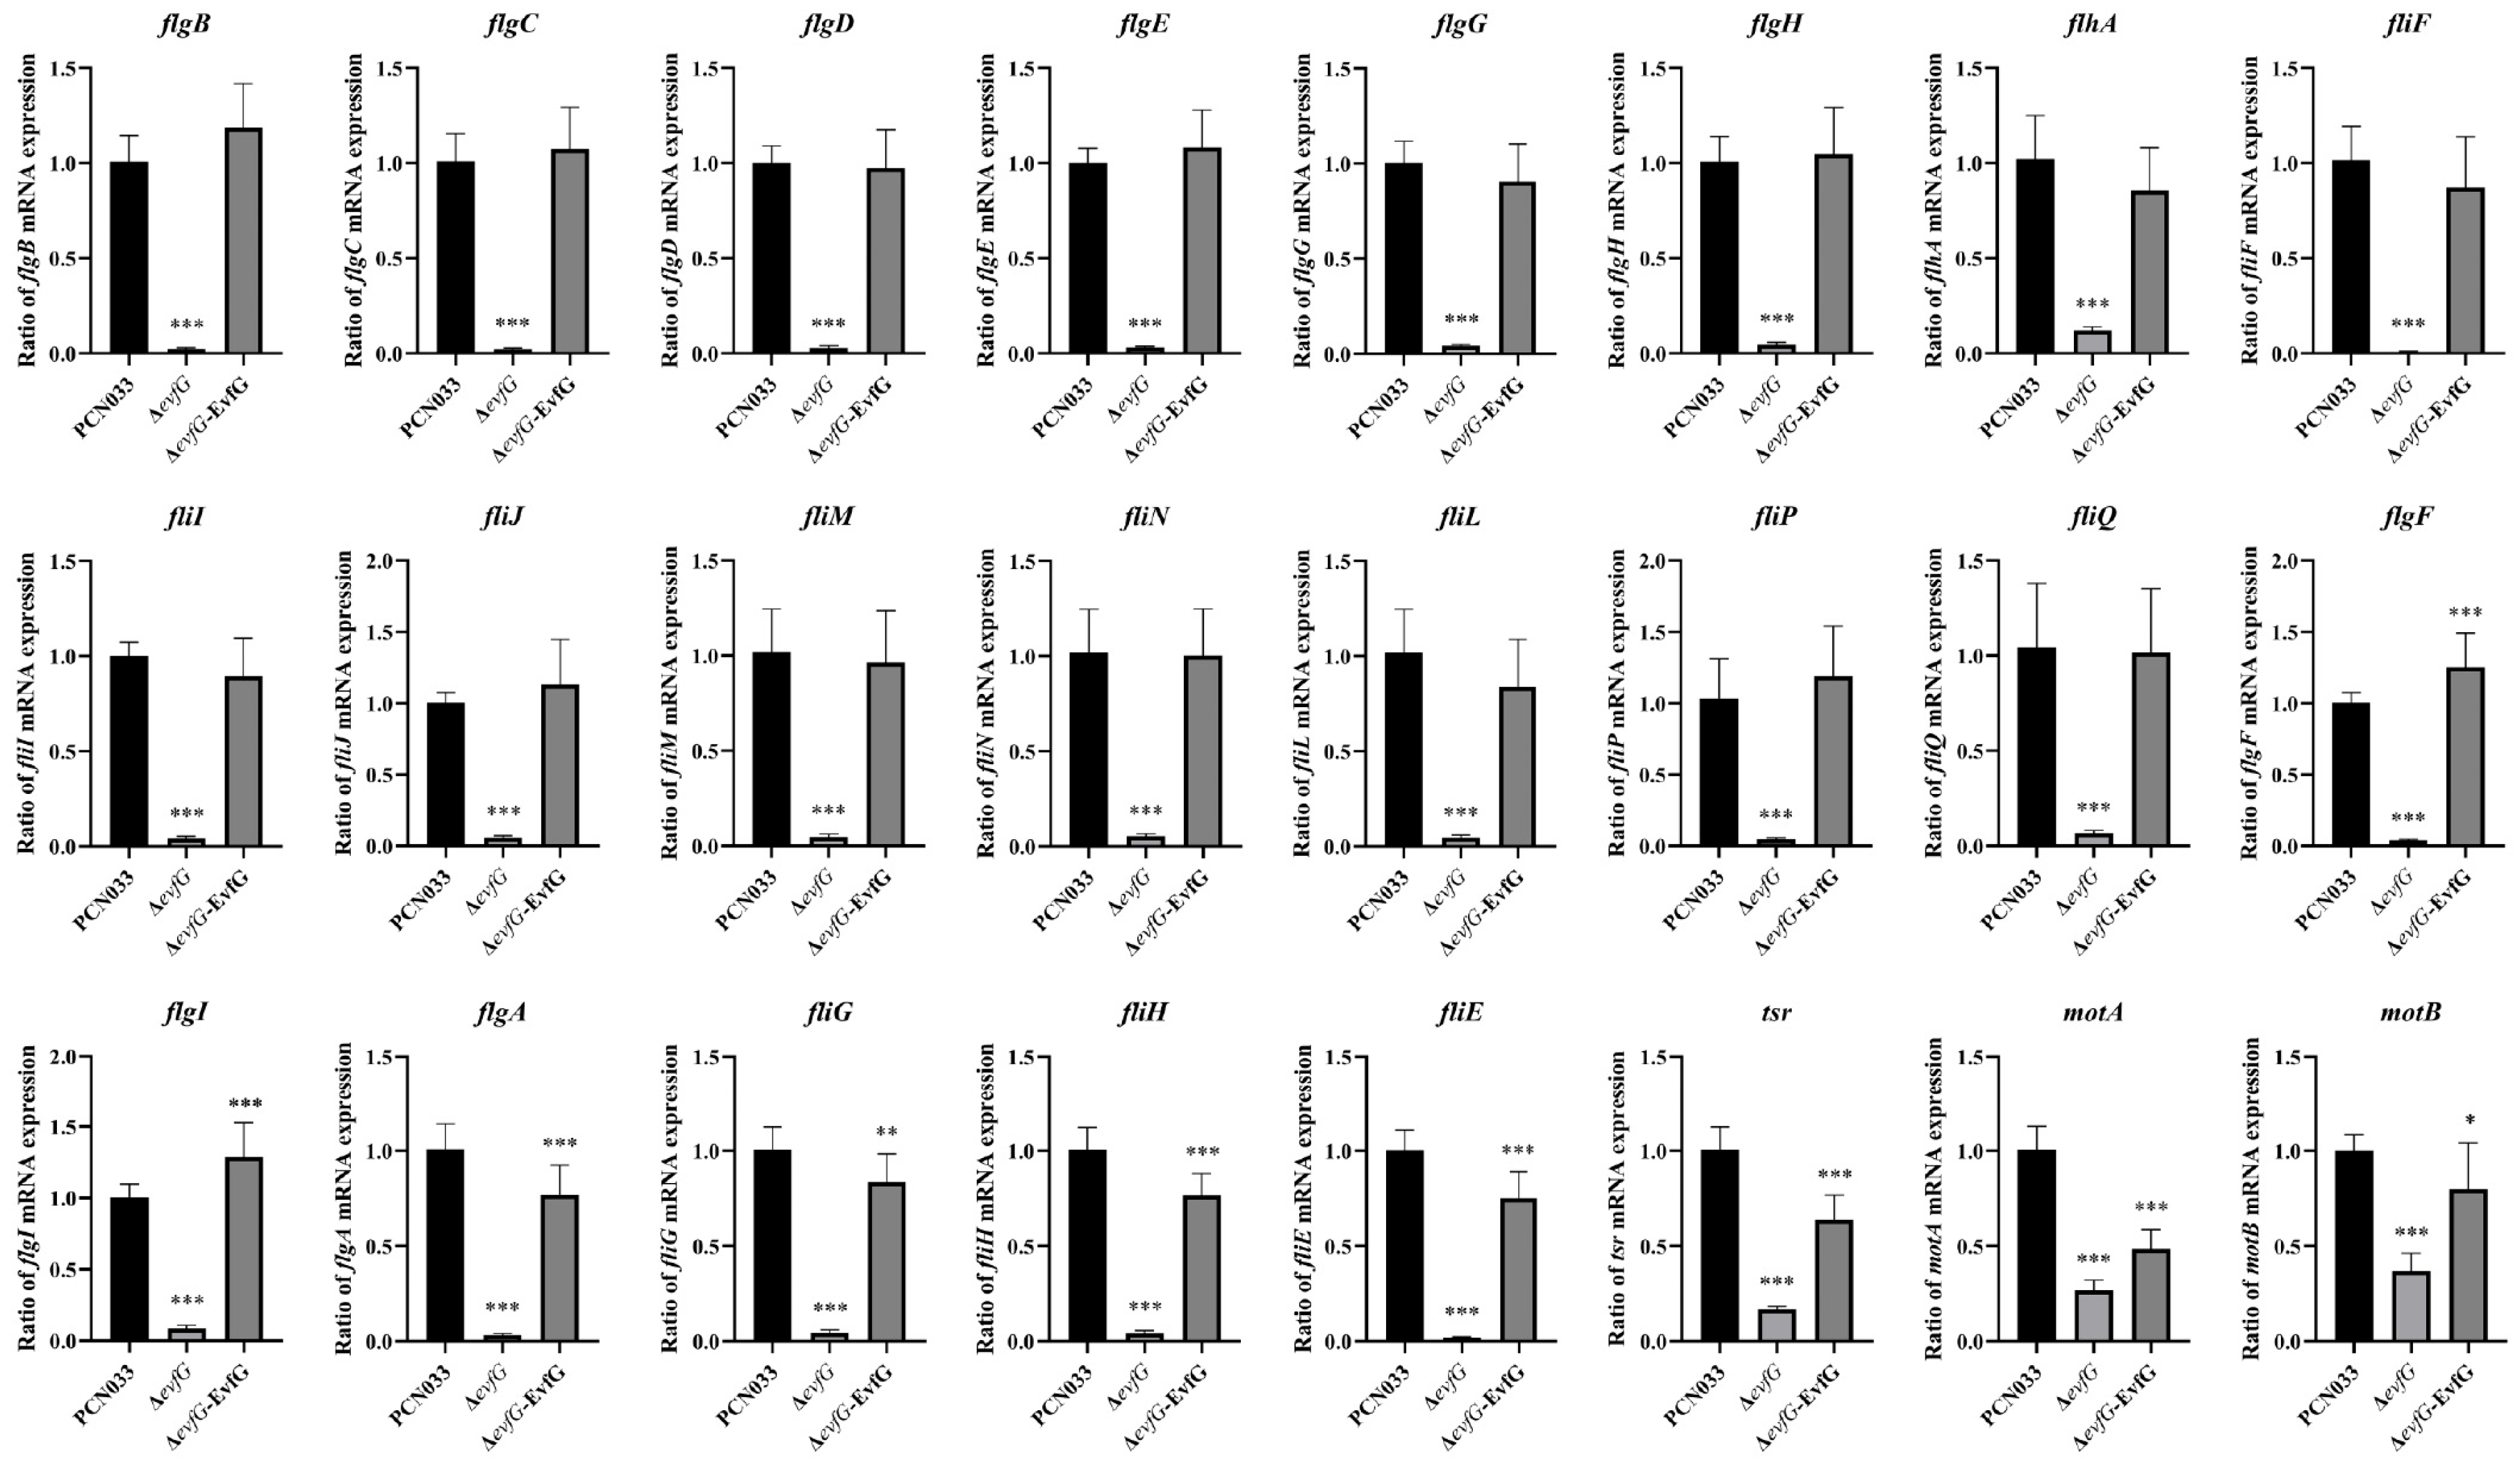
2.9. Bacterial RNA Extraction and qRT-PCR Analysis

Parental strain PCN033 and mutant ΔevfG were cultured overnight in LB medium, then subcultured into a fresh medium at a 1:1000 dilution and incubated at 37 °C until an OD600 of 0.6–0.8 was reached. Then, bacterial cells were collected by centrifugation at 12,000 rpm for 5 min. The transcriptional level of PCN033 and mutant ΔevfG was assessed using reverse transcription-quantitative polymerase chain reaction (qRT-PCR). As directed by the manufacturer, the Bacteria RNA Extraction Kit (Vazyme, Nanjing, China) was used to extract the total RNA. Next, using ABScript Neo RT Master Mix for qPCR with gDNA Remover (ABclonal, Wuhan, China), 1 μg of total RNA was reverse-transcribed. The Bright Cycle Universal SYBR Green qPCR Mix with UDG (ABclonal, Wuhan, China) was used in the qRT-PCR reactions, which were carried out using the QuantStudioTM 1 Plus Real-Time PCR System (Thermo Fisher, Shanghai, China). Results were normalized relative to E. coli 16S rRNA and determined using the 2−ΔΔCT method. A comprehensive list of all primers utilized for RT-PCR can be found in Table 1.

2.10. Statistical Analysis

The analysis of the study’s data was conducted using GraphPad Prism 8 and IBM SPSS Statistics 23. For comparisons between two groups, unpaired two-sided t-tests were employed, while one-way ANOVA was utilized for comparisons involving more than three groups. Significance levels were indicated as follows: # p < 0.05, ## p < 0.01, ### p < 0.001; * p < 0.05, ** p < 0.01, *** p < 0.001.

3. Results

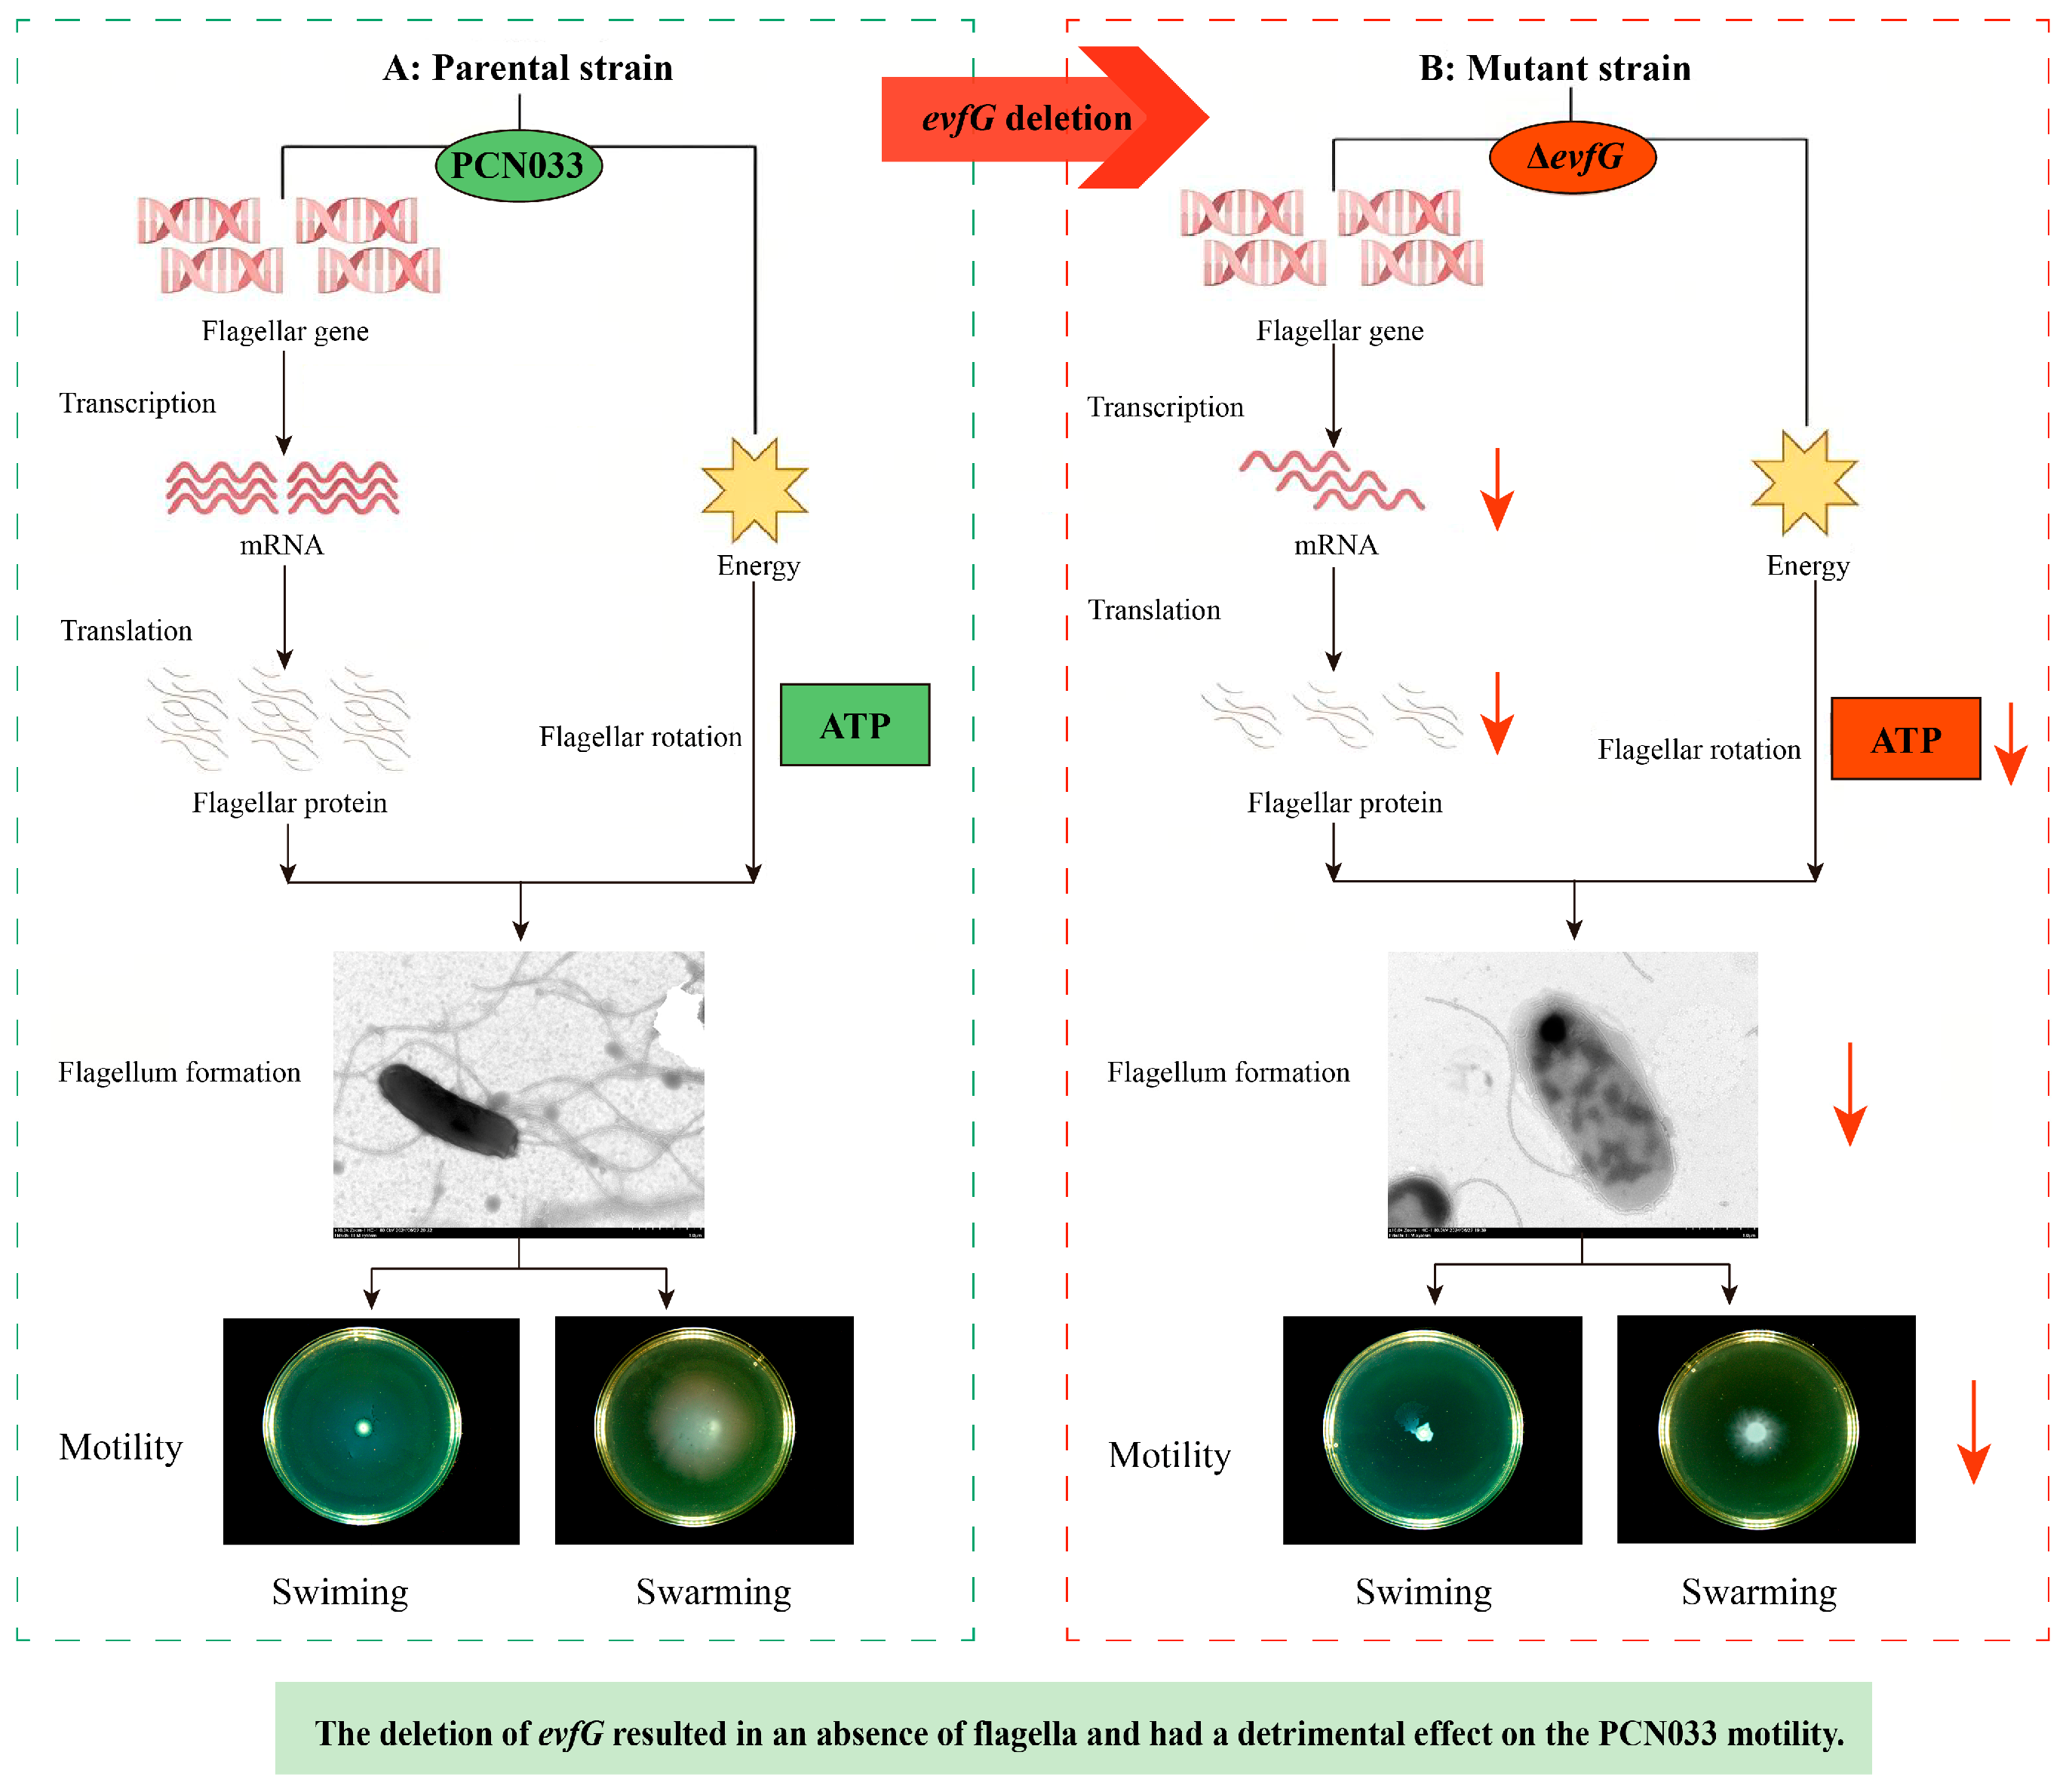
3.1. The Deletion of Gene evfG Affects Bacterial Swimming and Swarming

The motility of parental strain PCN033, mutant ΔevfG,and the complementary strain ΔevfG-EvfG was assessed through swimming and swarming assays. The results demonstrated that the swimming and swarming capabilities of the ΔevfG strain were markedly diminished in comparison to the parental strain PCN033, while the ΔevfG-EvfG strain exhibited motility that was largely comparable to that of PCN033 (Figure 1A,C). In addition, the diameters of the bacterial swimming and swarming zones were quantitatively measured. The results demonstrated that the diameter for the mutant ΔevfG was notably smaller than that of parental strain PCN033, while the diameter of the complementary strain ΔevfG-EvfG was substantially restored relative to that of the mutant ΔevfG (Figure 1B,D). These results suggested that the deletion of gene evfG in the T6SS gene cluster had a detrimental effect on PCN033 motility.

3.2. Deletion of evfG Affects the Flagellum Formation in PCN033

To explore how the deletion of evfG affects the motility of PCN033, we performed a comparative analysis of flagella among PCN033, ΔevfG, and ΔevfG-EvfG, which was conducted by using negative staining electron microscopy (negative-stain EM). As illustrated in Figure 2, the deletion of evfG resulted in an absence of flagella, whereas complementation with the evfG gene reestablished the flagella on the ΔevfG strain. These results suggest that evfG is essential for flagellum formation in PCN033.

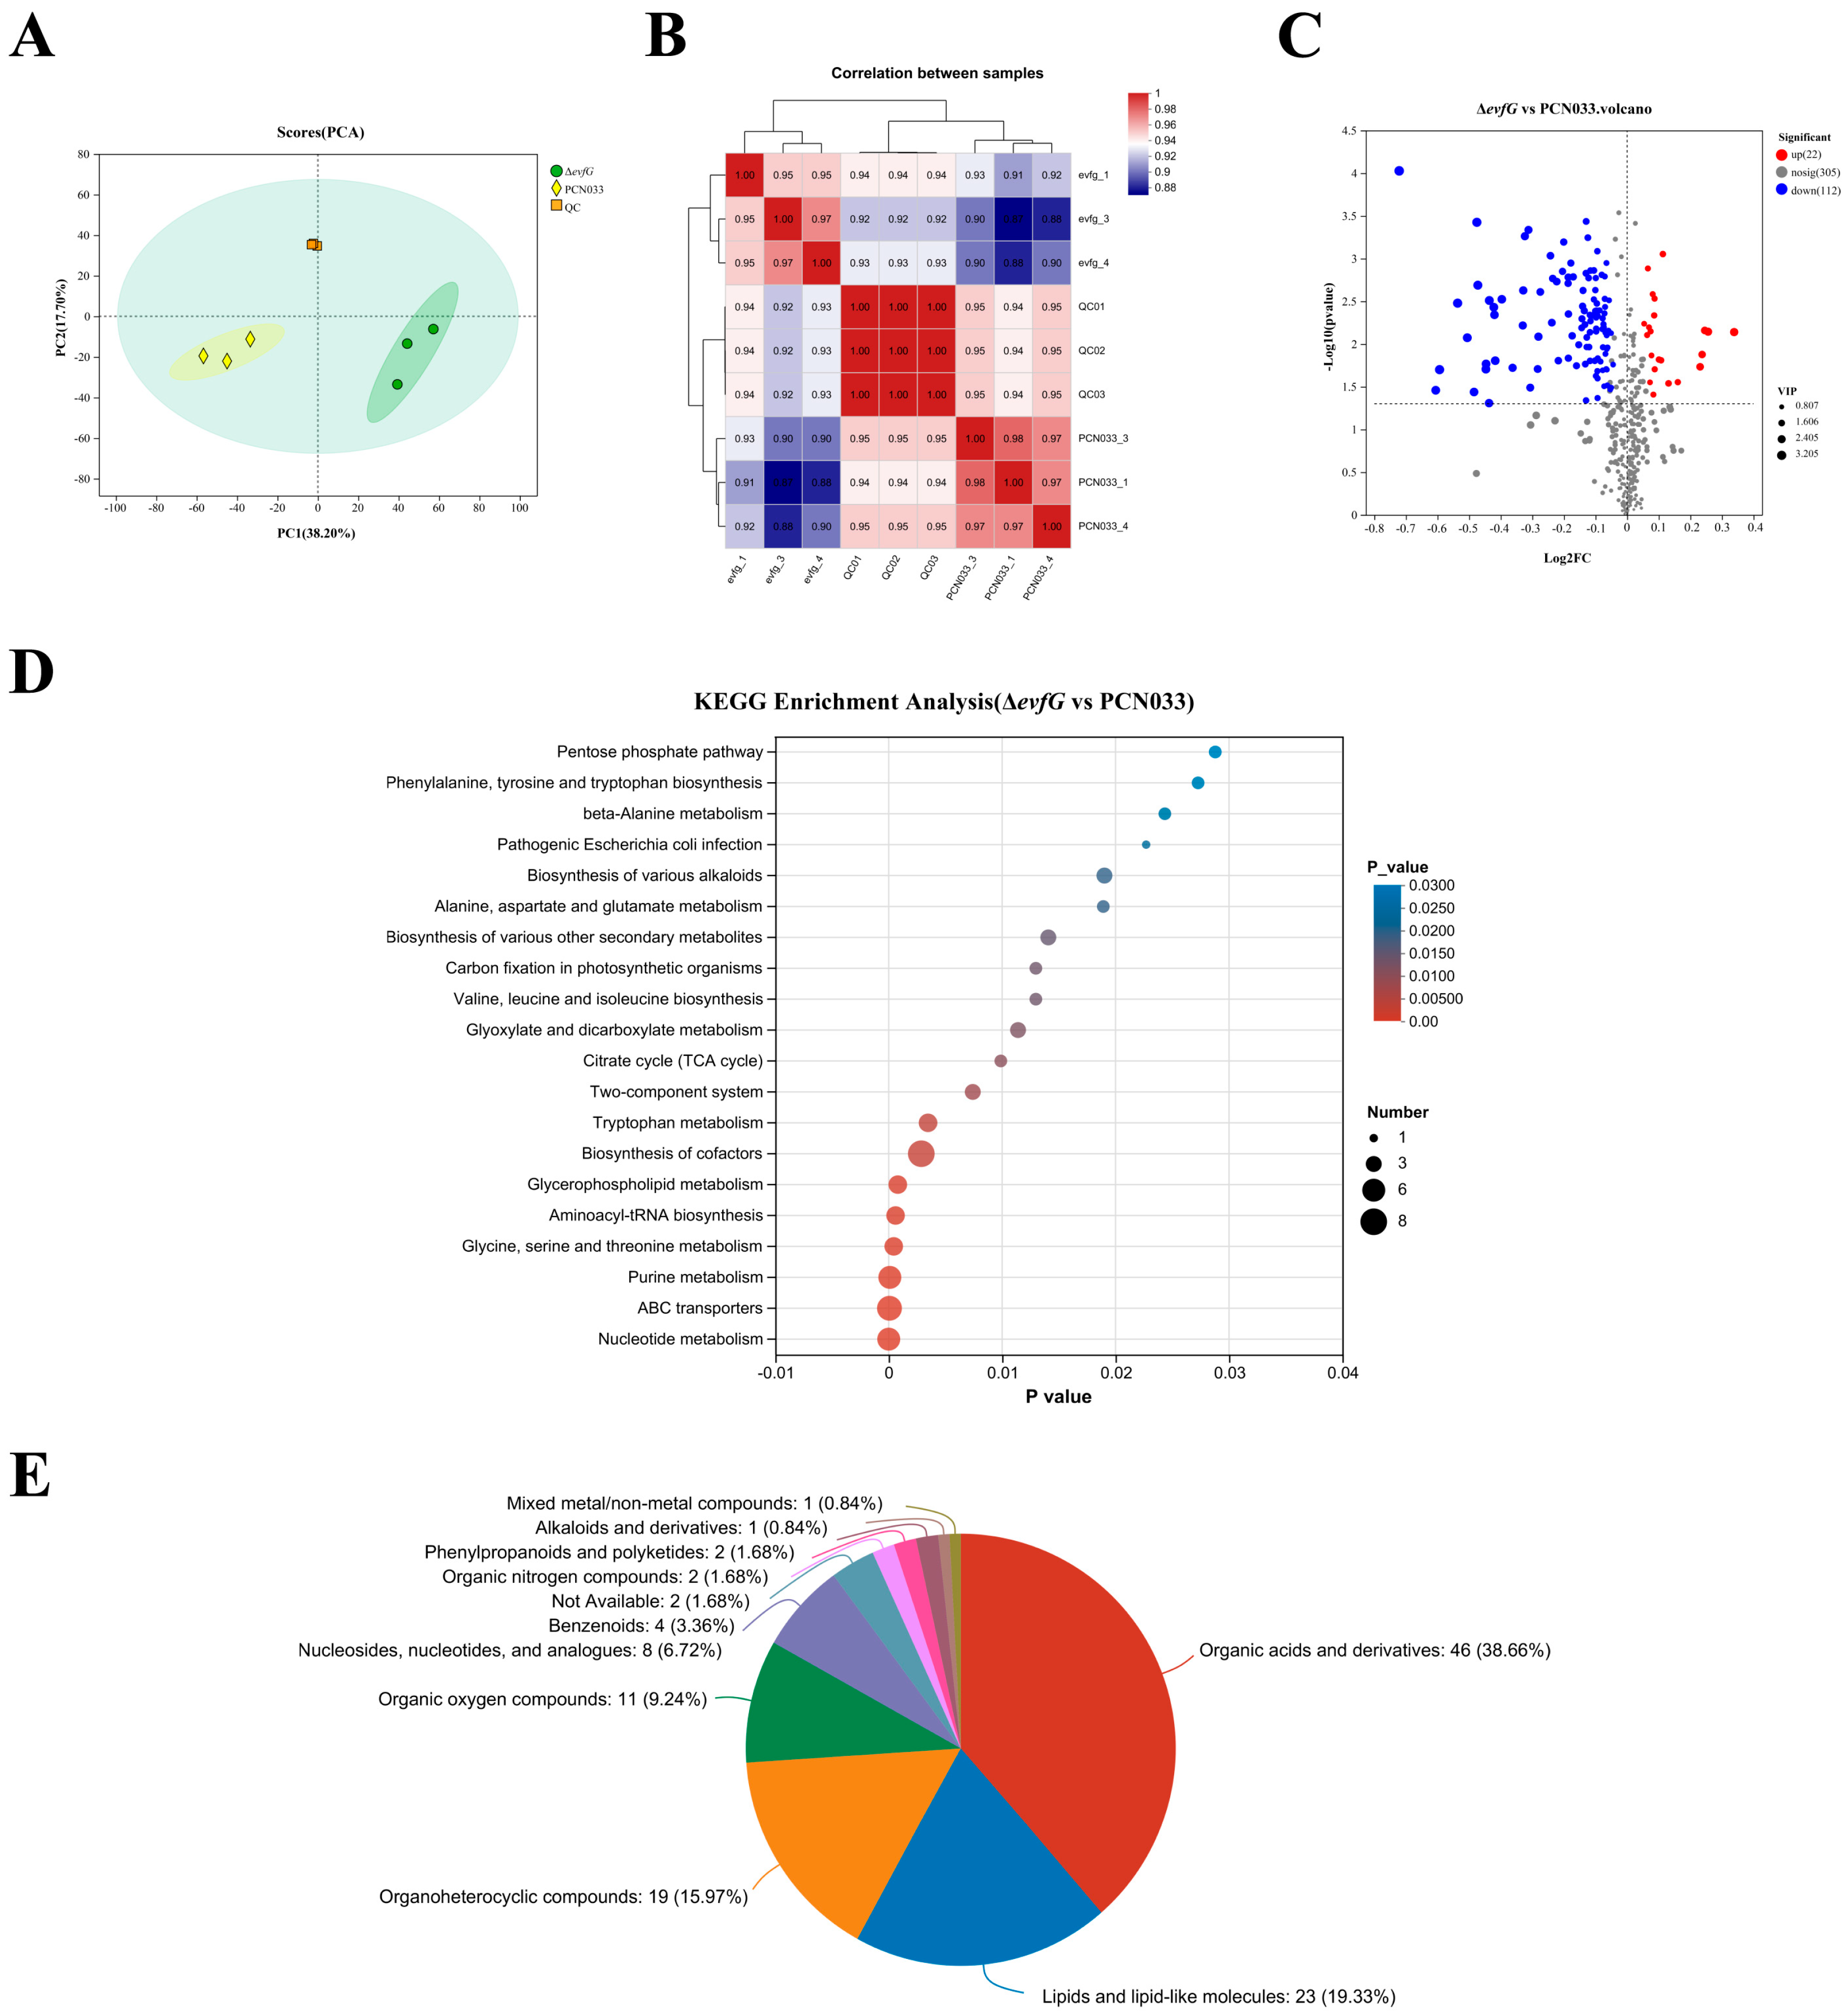
3.3. Metabolome Profiling

To further investigate the impact of gene evfG on flagella formation in ExPEC PCN033, metabolome profiling was conducted on samples from PCN033 and ΔevfG using untargeted LC-MS. The metabolites revealed by LC-MS analysis are detailed in Supplementary Table S1. In total, 439 metabolites were detected, which were categorized into 11 distinct groups. Principal component analysis (PCA) performed on samples from PCN033, ΔevfG, and the quality control (QC) demonstrated a clear separation among these groups (Figure 3A). The concentration data of the metabolites were utilized to assess correlations between the samples, revealing that they could be distinctly differentiated (Figure 3B), thereby indicating a high level of reliability in the metabolome data obtained. Consequently, both PCA and correlation analyses suggest that significant variations exist in the metabolite profiles between the PCN033 and ΔevfG samples.

3.4. Differentially Accumulated Metabolites (DAMs) in PCN033 and ΔevfG

All metabolite data were analyzed using criteria, such as p-values < 0.05, |Log2 Fold Change| > 1, and a variable importance in projection (VIP) > 1, to determine the DAMs between the PCN033 and the mutant ΔevfG. A total of 134 DAMs were obtained, of which 22 were upregulated and 112 were downregulated (Figure 3C, Supplementary Table S2). The results of the KEGG analysis showed that nucleotide metabolism (map01232), ABC transporters (map02010), purine metabolism (map00230), aminoacyl-tRNA biosynthesis (map00970), glycerophospholipid metabolism (map00564) and glycine, serine and threonine metabolism (map00260) were significantly enriched (Figure 3D). The results of additional research indicated that DAMs within these enrichment pathways were probably engaged in the metabolism of amino acids and energy (Table 2). Furthermore, Figure 3E shows that the 134 DAMs may be divided into >6 classes. These results suggest that DAMs linked to energy and amino acid metabolism may be important in affecting PCN033 strain motility as a result of evfG deletion.

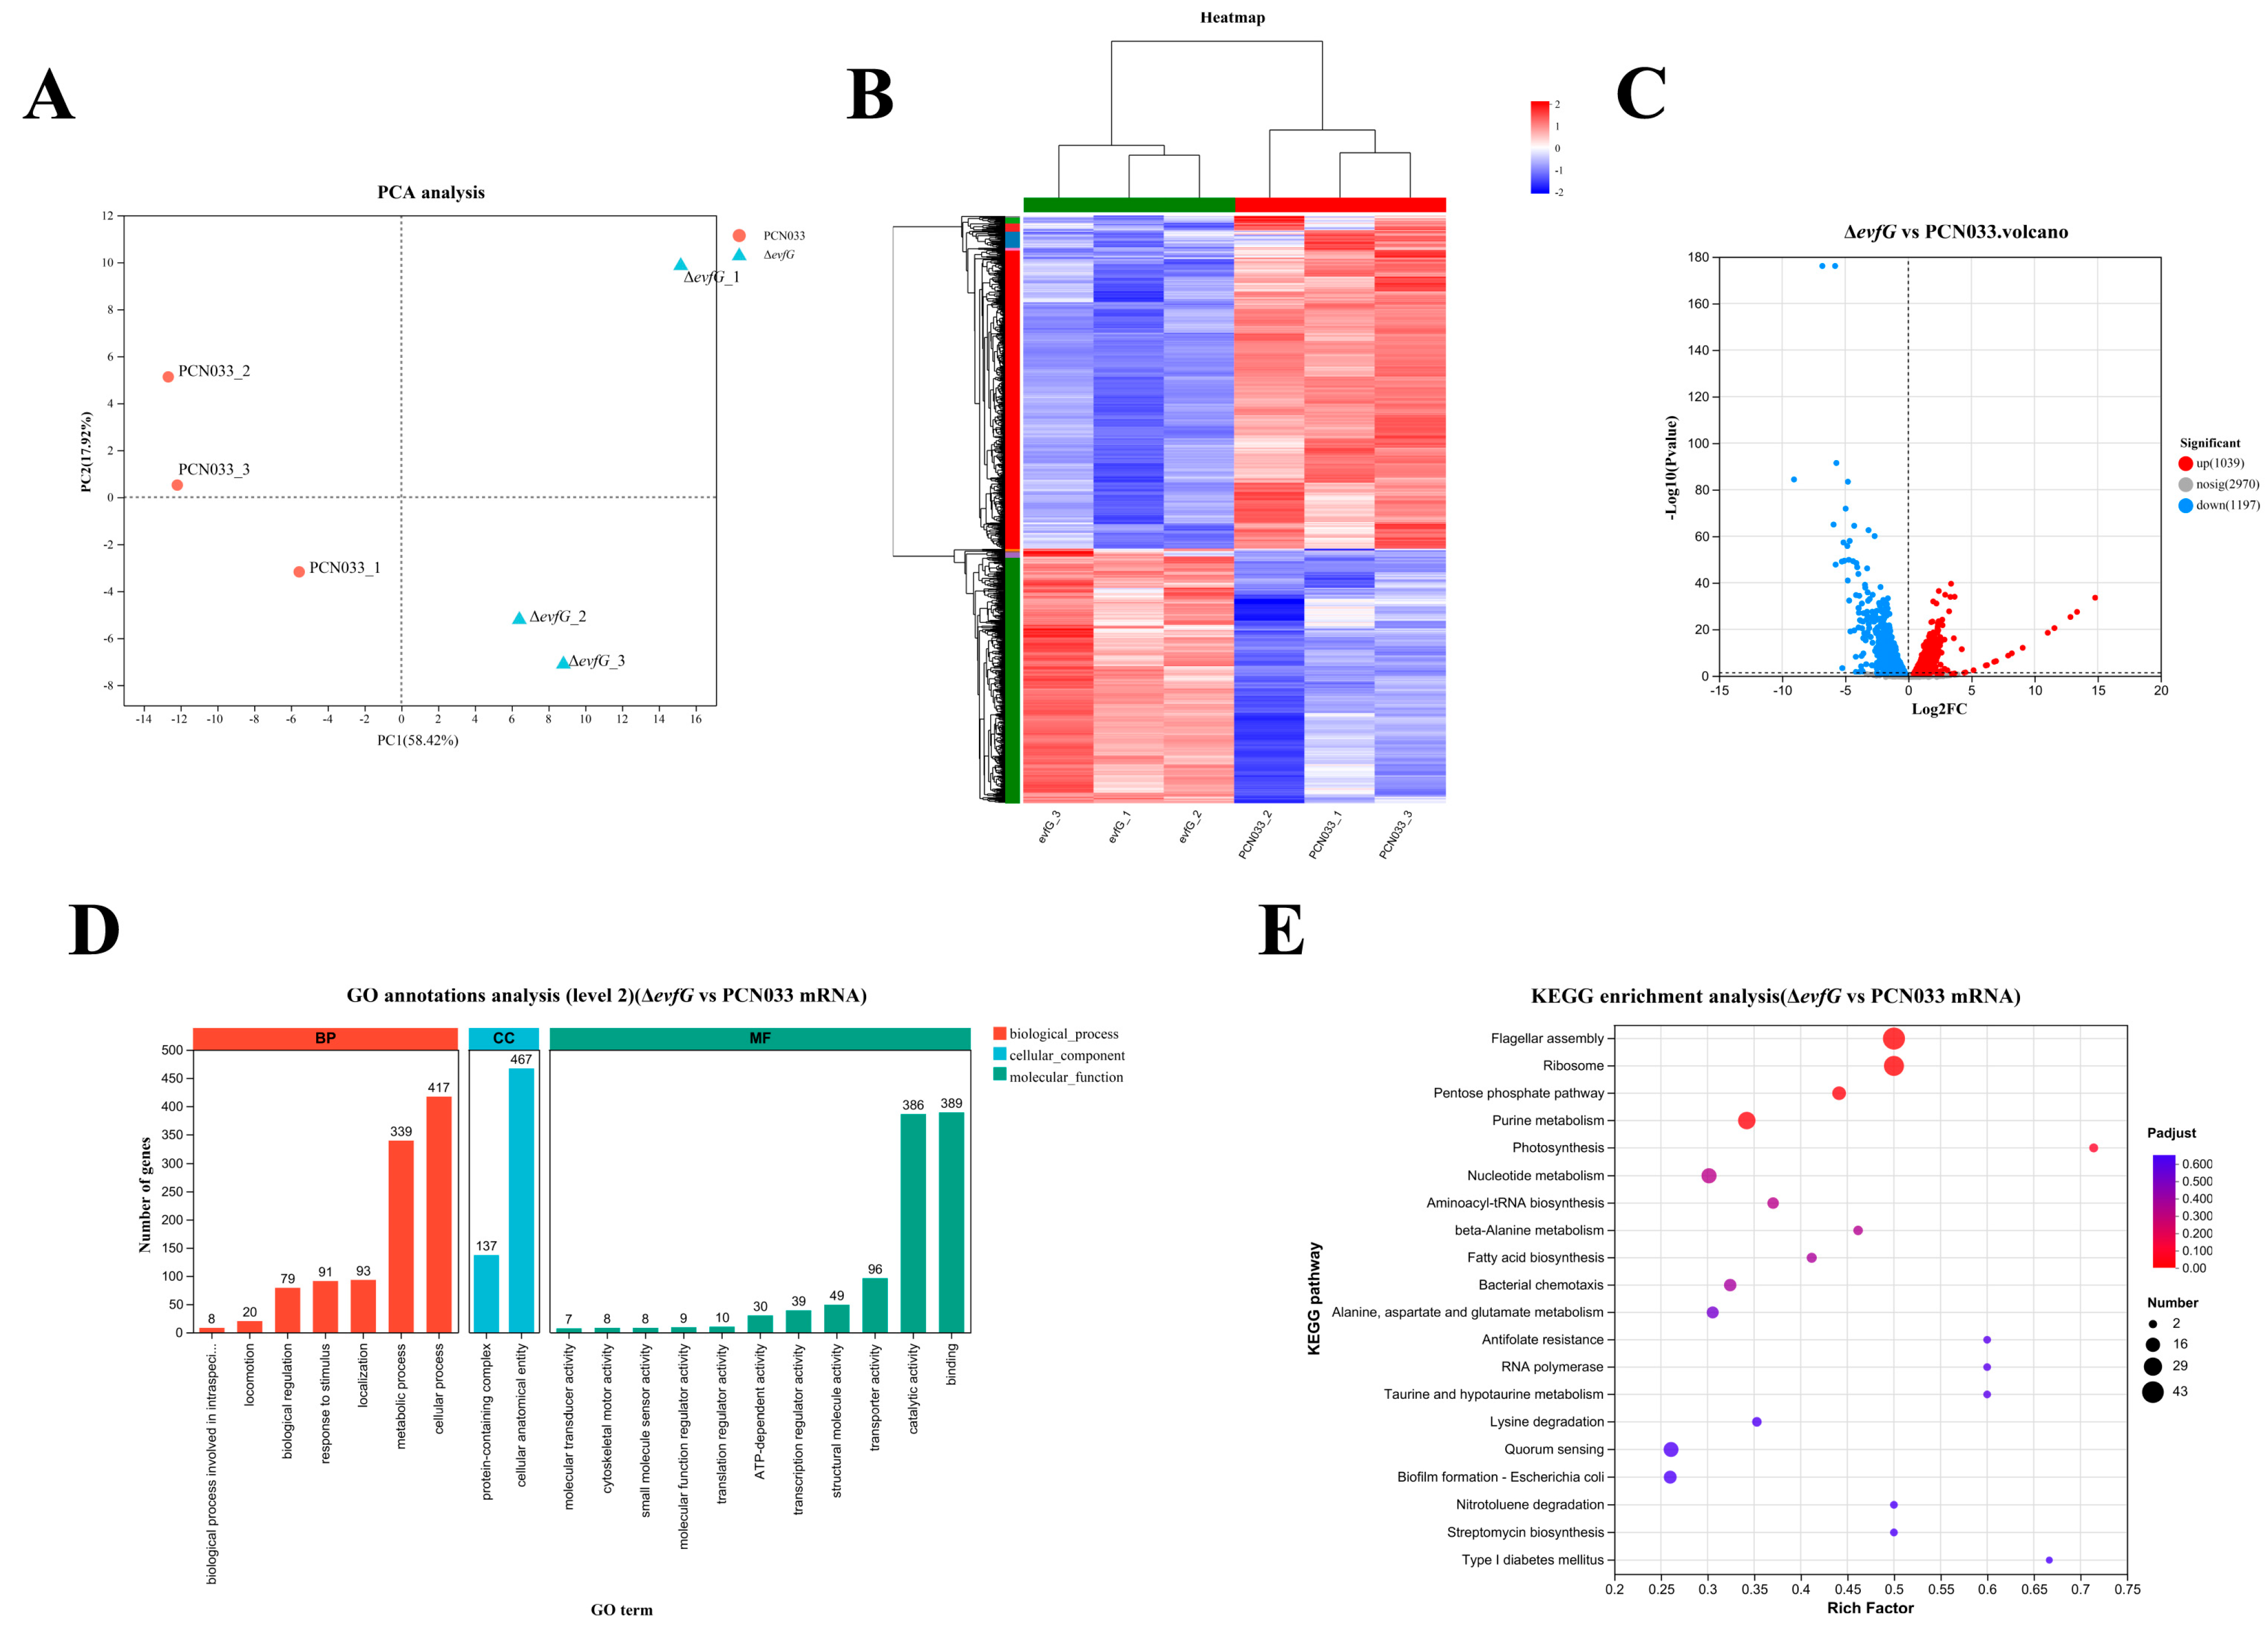
3.5. Transcriptome Profiles Between PCN033 and ΔevfG

The changes in gene expression levels between ΔevfG and PCN033 were investigated. There were 94,346,816 (PCN033, 46,328,404; ΔevfG, 48,018,412) total reads generated by RNA-seq. there were 93,771,450 (PCN033, 46,012,606; ΔevfG, 47,758,844) clean reads obtained after removal of low-quality reads. A total of 57,094,558 (PCN033, 36,556,182; ΔevfG, 20,538,376) mapped reads were generated. The PCA results demonstrated that all biological replicates clustered together (Figure 4A), while the correlation analysis showed significant differences between the PCN033 and ΔevfG (Figure 4B).

3.6. DEGs Between PCN033 and ΔevfG

To predict candidate genes causing reduced motility in the mutant ΔevfG, DEGs were selected based on |Log2 Fold Change| > 2 or <1 between the PCN033 and ΔevfG. This analysis resulted in the identification of 2236 DEGs; a volcano plot was created for subsequent analyses (Figure 4C). In total, 1039 genes were upregulated and 1197 genes were downregulated. GO annotation analysis classified 2236 DEGs into three categories: molecular functions, cellular components, and biological processes (Figure 4D), among which the integral component of the cellular anatomical entity (467, 20.9%) was the largest group, followed by the cellular process (417, 18.6%) and binding (389, 17.4%); only a few DEGs (7, 0.3%) were associated with molecular transducer activity. As shown in Figure 4E, the enrichment pathway in the KEGG is flagellar assembly (map02040), ribosome (map03010), pentose phosphate pathway (map00030), and purine metabolism (map00230) (Supplementary Table S3).

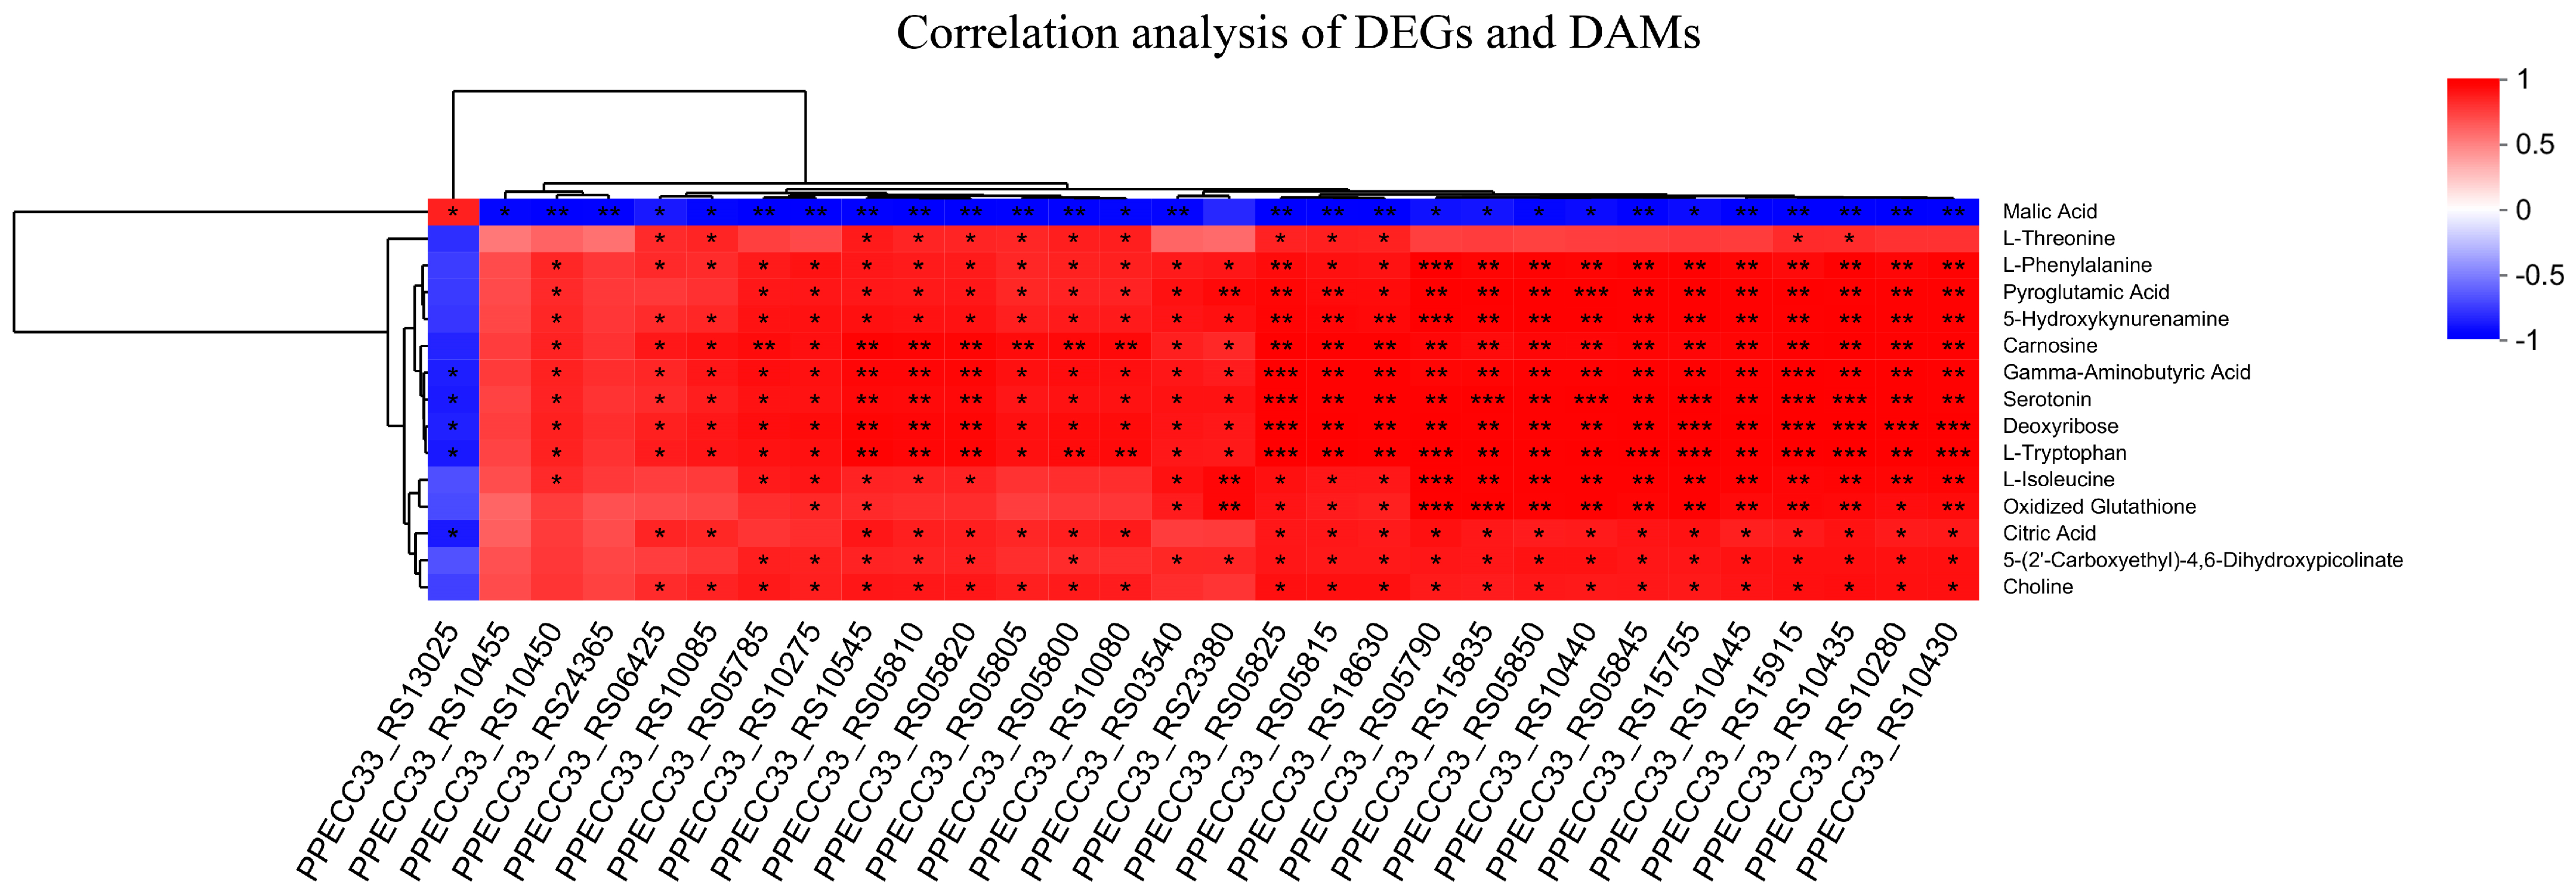
3.7. The Correlation Analysis of DAMs and DEGs

The most significant enrichment of DEGs in ΔevfG and PCN033 was observed in the pathway related to flagellar assembly (map02040). To validate the accuracy of RNA-seq data, we selected 24 DEGs associated with bacterial flagella for qRT-PCR validation (Figure 5). The results from qRT-PCR demonstrated that all these DEGs exhibited significantly lower expression levels in the mutant ΔevfG compared to those in the parental strain PCN033, which is consistent with our RNA-Seq findings (Supplementary Table S4). Further analysis revealed that all data collected from both metabolomic and transcriptomic profiles displayed high reliability based on the correlation analyses (Figure 6). Therefore, we propose that variations in metabolite accumulation between PCN033 and mutant ΔevfG are closely regulated by distinct patterns of differential gene expression.

4. Discussion

Bacterial motility significantly influences both the survival and the pathogenic characteristics of these microorganisms, serving a vital function throughout their lifecycle. Previous studies have found that the bacterial quorum sensing (quorum sensing, QS) system, cyclic diguanosine monophosphate (c-di-GMP) signaling system, protein glycosylation and other factors can affect bacterial motility to varying degrees [34,35,36]. This research revealed that the deletion of the gene evfG in the T6SS gene cluster significantly weakened the motility of porcine ExPEC. Nevertheless, the exact mechanism through which the evfG deletion impacts the motility of porcine ExPEC remains unclear.

4.1. EvfG Is Essential for the Motility of Porcine ExPEC PCN033

First, our motility tests revealed that the motility capacity of the mutant ΔevfG was significantly lower than that of the parental strain PCN033. In contrast, the motility capacity of the complementary strain ΔevfG-EvfG returned to levels comparable to those of the parental strain (Figure 1). Subsequently, by utilizing negative staining EM, a marked reduction in peripheral flagella in the mutant ΔevfG was observed compared to the parental strain PCN033. Notably, the number of flagella in the complementary strain ΔevfG-EvfG reverted to levels similar to those found in the parental strain once again (Figure 2). Through the above experiments, we have established that deletion of the evfG gene led to decreased motility and impaired flagella formation in ExPEC PCN033 strains. However, our research results differ from previous research findings by Lu et al. (2024) [16], which reported that the deletion of evfG in the T6SS gene cluster of human ExPEC RS218 strain can enhance the expression of genes related to bacterial motility and chemotaxis, indicating a negative correlation between evfG and bacterial motility [16]. However, the mechanism by which the gene evfG weakens the motility of porcine ExPEC is still unclear. Therefore, further investigation is required to elucidate how EvfG regulates both motility and flagella formation in porcine ExPEC PCN033. To gain deeper insights into the mechanisms underlying reduced motility in ΔevfG, we conducted transcriptome and metabolome analyses.

4.2. The Reduced Motility of the Mutant ΔevfG Is Related to the Energy Metabolism

Energy metabolism is the process of energy metabolism in vivo that maintains the normal growth and metabolic function of bacteria, including the citrate cycle (TCA cycle), pentose phosphate pathway and glycolysis pathway. Our combined analysis of transcriptomic and metabolomics results found that KEGG analysis of DAMs and DEGs for both ΔevfG and PCN033 were significantly enriched in carbohydrate metabolism and energy metabolism pathways. Furthermore, we found that the content of citric Acid and 3-phosphoglycerate of ΔevfG was significantly decreased; 2-hydroxybutinic acid was significantly increased in the ΔevfG compared to PCN033. In the TCA cycle, the condensation of acetyl CoA and oxaloacetic acid first forms citric acid. Citric acid through isomerization, oxidative decarboxylation, and hydration forms malic acid. Malic acid dehydrogenation forms oxaloacetic acid. Finally oxaloacetic acid again combines with acetyl CoA condensation to form citric acid, and completes the whole cycle process [37]. NADH and FADH2, generated in the citric acid cycle, enter the oxidative phosphorylation pathway to produce large amounts of ATP and provide energy to the cells [37]. However, the decrease in citrate and increased 2-hydroxysuccinate in ΔevfG indicate that there are obstacles in the dehydrogenation of malic acid in the TCA cycle. This causes a reduction in NADH and FADH2 entering the oxidative phosphorylation pathway, which in turn leads to reduced ATP generation and reduced cellular energy supply. In E. coli, motility is driven by flagellar rotation. Both the biogenesis of the motility system and the flagellar motor rotation consume energy in order to perform [38,39,40]. Combined with the above results, we learned that evfG deficiency causes citric acid cycle disorders and the cells produce less energy compared to the normal strain, while E. coli exercise requires energy consumption. Therefore, we reasoned that the weakened motility of the mutant ΔevfG may be due to its reduced energy metabolism level.

4.3. The Reduced Motility of the Mutant ΔevfG Was Associated with the Loss of Flagellar-Associated Genes

Both the swimming and swarming of E. coli are driven by flagellar rotation [25]. Bacterial motility is a complex biological property; the bacterial motility behavior and the expression of flagella-related genes are regulated by various factors. The movement of the flagellum not only helps the bacteria to better adapt to the environment, it is also closely related to its chemotaxis, adhesion, virulence, and pathogenicity characteristics [26,27]. In previous reports, the loss of flagella-related genes, such as fliC, flgD, and fliN, affected the assembly of flagella and weakened bacterial motility [32,33,41,42]. In this study, KEGG enrichment analysis of the transcriptome results of ΔevfG and CN033 (Figure 4E) showed that the differential genes were mainly enriched in flagellar assembly (map02040), ribosome (map03010), pentose phosphate pathway (map00030), and purine metabolism (map00230). The differential genes enriched in flagellar assembly were subsequently examined and found to be genes related to flagellar assembly and motility (see Supplementary Table S4); these genes were significantly downregulated compared with the wild strain. The findings from qRT-PCR validation aligned with the transcriptomic outcomes (Figure 5). Furthermore, by integrating the findings from the bacterial motility assay with those from the electron microscopy assay, we speculate that evfG of E. coli PCN033 plays a role in flagella synthesis. The deletion of evfG impairs the expression of genes related to flagella, inhibits the synthesis of flagellin, and consequently affects the motility of PCN033. However, research by Lu et al. (2024) [16], demonstrated through electron microscopy that the ΔevfG strain displayed a considerably greater number of flagella compared to the parental strain RS218. Both the transcriptomics and qRT-PCR results indicated that the deletion of evfG led to a marked increase in the expression of flagella-related genes. That is to say, the evfG of E. coli RS218 has a negative correlation with flagella synthesis [16], which is inconsistent with the findings of our study. We speculate that the molecular mechanisms by which the evfG of RS218 and PCN033 are involved in the regulation of flagella synthesis may be different; therefore, further research is required.
In conclusion, the influencing factors of diminished motility in the mutant ΔevfG are shown in Figure 7. The motility ability of ΔevfG was weakened after the gene evfG deletion, which demonstrated that gene evfG play an important role in the motility of ExPEC. The motility of ExPEC, controlled by EvfG, occurs in a flagellum-dependent manner. In addition, the deficiency of gene evfG has inhibitory effects on energy production-related pathways, including the TCA cycle, the pentose phosphate pathway, the carbon fixation pathway in prokaryotes, and glyoxylate and dicarboxylate metabolism. Although the present study cannot explain the full mechanisms of EvfG action in the energy metabolism pathway and flagellar assembly, it seems closely related to the motility of ExPEC by indirectly regulating the energy metabolism pathway and flagellar assembly.

5. Conclusions

In the comparison between PCN033 and ΔevfG, 1039 upregulated and 1197 downregulated genes, 22 upregulated metabolites and 112 downregulated metabolites were found. Metabolome and transcriptomic analyses indicate that changes in energy metabolism and flagellar secretion assembly and chemotaxis are the main causes for diminished PCN033 motility after evfG deletion. The TCA cycle, pentose phosphate pathway, and carbon fixation pathway in prokaryotes provide energy for the flagellar movement of PCN033. The correct assembly and drive of flagellar-associated gene expression are essential for PCN033 movement. These findings offer experimental evidence and improve our comprehension of the mechanisms of pig ExPEC PCN033 motility. Our study has confirmed that evfG can affect the motility of PCN033 by regulating energy metabolism and the expression of flagellar genes. However, the specific mechanisms still require further in-depth investigation.

Supplementary Materials

The following supporting information can be downloaded at: https://www.mdpi.com/article/10.3390/biology14070822/s1.

Author Contributions

In this study, the research concept was put forward by Y.Z., W.L. (Wentong Liu), B.Z., Y.Q. and S.F., who were also in charge of project management. P.W., W.L. (Wei Liu) and Y.X. designed the experiments and completed data collection. Y.Z., P.W., W.L. (Wei Liu), A.W. and Y.X. were responsible for data management and data analysis. Y.Z., B.Z., P.W. and Y.X. jointly engaged in data interpretation and visualization. The initial draft of the manuscript was written by B.Z. and P.W. All authors participated in the revision and final review of the paper. All authors have read and agreed to the published version of the manuscript.

Funding

This work was supported by the Natural Science Foundation of China project (32202814) and the Hubei Provincial Major Science and Technology Innovation Plan (2023BBB069), the Natural Science Foundation of Hubei Province (2022CFB572).

Institutional Review Board Statement

Not applicable.

Informed Consent Statement

Not applicable.

Data Availability Statement

The data used and/or analyzed during the current study are available from the corresponding author on reasonable request.

Conflicts of Interest

The authors declare that the research was conducted in the absence of any commercial or financial relationships that could be construed as a potential conflict of interest.

References

  1. Weston, E.J.; Pondo, T.; Lewis, M.M.; Martell-Cleary, P.; Morin, C.; Jewell, B.; Daily, P.; Apostol, M.; Petit, S.; Farley, M.; et al. The burden of invasive early-onset neonatal sepsis in the United States, 2005–2008. Pediatr. Infect. Dis. J. 2011, 30, 937–941. [Google Scholar] [CrossRef] [PubMed]
  2. Mellata, M. Human and Avian Extraintestinal Pathogenic Escherichia coli: Infections, Zoonotic Risks, and Antibiotic Resistance Trends. Foodborne Pathog. Dis. 2013, 10, 916–932. [Google Scholar] [CrossRef]
  3. Huang, S.; Chi, F.; Peng, L.; Bo, T.; Zhang, B.; Liu, L.; Wu, X.; Mor-Vaknin, N.; Markovitz, D.M.; Cao, H.; et al. Vimentin, a Novel NF-κB Regulator, Is Required for Meningitic Escherichia coli K1-Induced Pathogen Invasion and PMN Transmigration across the Blood-Brain Barrier. PLoS ONE 2016, 11, e0162641. [Google Scholar] [CrossRef] [PubMed]
  4. Tan, C.; Tang, X.; Zhang, X.; Ding, Y.; Zhao, Z.; Wu, B.; Cai, X.; Liu, Z.; He, Q.; Chen, H. Serotypes and virulence genes of extraintestinal pathogenic Escherichia coli isolates from diseased pigs in China. Vet. J. 2011, 192, 483–488. [Google Scholar] [CrossRef] [PubMed]
  5. Tang, X.; Tan, C.; Zhang, X.; Zhao, Z.; Xia, X.; Wu, B.; Guo, A.; Zhou, R.; Chen, H. Antimicrobial resistances of extraintestinal pathogenic Escherichia coli isolates from swine in China. Microb. Pathog. 2011, 50, 207–212. [Google Scholar] [CrossRef]
  6. Jahanbakhsh, S.; Smith, M.G.; Kohan-Ghadr, H.; Letellier, A.; Abraham, S.; Trott, D.J.; Fairbrother, J.M. Dynamics of extended-spectrum cephalosporin resistance in pathogenic Escherichia coli isolated from diseased pigs in Quebec, Canada. Int. J. Antimicrob. Agents 2016, 48, 194–202. [Google Scholar] [CrossRef]
  7. Moulin-Schouleur, M.; Schouler, C.; Tailliez, P.; Kao, M.; BréE, A.; Germon, P.; Oswald, E.; Mainil, J.; Blanco, M.; Blanco, J. Common Virulence Factors and Genetic Relationships between O18:K1:H7 Escherichia coli Isolates of Human and Avian Origin. J. Clin. Microbiol. 2006, 44, 3484–3492. [Google Scholar] [CrossRef]
  8. Zhu, Y.; Dong, W.; Ma, J.; Yuan, L.; Hejair, H.M.; Pan, Z.; Liu, G.; Yao, H. Characterization and virulence clustering analysis of extraintestinal pathogenic Escherichia coli isolated from swine in China. BMC Vet. Res. 2017, 13, 94. [Google Scholar] [CrossRef]
  9. Biran, D.; Ron, E.Z. Extraintestinal Pathogenic Escherichia coli. In Escherichia coli, a Versatile Pathogen; Current Topics in Microbiology and Immunology; Springer: Cham, Switzerland, 2018; pp. 149–161. [Google Scholar] [CrossRef]
  10. Li, X.; Hu, H.; Zhu, Y.; Wang, T.; Lu, Y.; Wang, X.; Peng, Z.; Sun, M.; Chen, H.; Zheng, J.; et al. Population structure and antibiotic resistance of swine extraintestinal pathogenic Escherichia coli from China. Nat. Commun. 2024, 15, 5811. [Google Scholar] [CrossRef]
  11. Das, S.; Chaudhuri, K. Identification of a unique IAHP (IcmF associated homologous proteins) cluster in Vibrio cholerae and other proteobacteria through in silico analysis. In Silico Biol. 2003, 3, 287–300. [Google Scholar]
  12. Mougous, J.D.; Cuff, M.E.; Raunser, S.; Shen, A.; Zhou, M.; Gifford, C.A.; Goodman, A.L.; Joachimiak, G.; OrdoñEz, C.L.; Lory, S.; et al. A Virulence Locus of Pseudomonas aeruginosa Encodes a Protein Secretion Apparatus. Science 2006, 312, 1526–1530. [Google Scholar] [CrossRef] [PubMed]
  13. Pukatzki, S.; Ma, A.T.; Sturtevant, D.; Krastins, B.; Sarracino, D.; Nelson, W.C.; Heidelberg, J.F.; Mekalanos, J.J. Identification of a conserved bacterial protein secretion system in Vibrio cholerae using the Dictyostelium host model system. Proc. Natl. Acad. Sci. USA 2006, 103, 1528–1533. [Google Scholar] [CrossRef] [PubMed]
  14. Basler, M.; Pilhofer, M.; Henderson, G.P.; Jensen, G.J.; Mekalanos, J.J. Type VI secretion requires a dynamic contractile phage tail-like structure. Nature 2012, 483, 182–186. [Google Scholar] [CrossRef] [PubMed]
  15. Leiman, P.G.; Basler, M.; Ramagopal, U.A.; Bonanno, J.B.; Sauder, J.M.; Pukatzki, S.; Burley, S.K.; Almo, S.C.; Mekalanos, J.J. Type VI secretion apparatus and phage tail-associated protein complexes share a common evolutionary origin. Proc. Natl. Acad. Sci. USA 2009, 106, 4154–4159. [Google Scholar] [CrossRef]
  16. Lu, W.; Lu, H.; Huo, X.; Wang, C.; Zhang, Z.; Zong, B.; Wang, G.; Dong, W.; Li, X.; Li, Y.; et al. EvfG is a multi-function protein located in the Type VI secretion system for ExPEC. Microbiol. Res. 2024, 283, 127647. [Google Scholar] [CrossRef]
  17. Ho, B.T.; Fu, Y.; Dong, T.G.; Mekalanos, J.J. Vibrio cholerae type 6 secretion system effector trafficking in target bacterial cells. Proc. Natl. Acad. Sci. USA 2017, 114, 9427–9432. [Google Scholar] [CrossRef]
  18. MacIntyre, D.L.; Miyata, S.T.; Kitaoka, M.; Pukatzki, S. The Vibrio cholerae type VI secretion system displays antimicrobial properties. Proc. Natl. Acad. Sci. USA 2010, 107, 19520–19524. [Google Scholar] [CrossRef]
  19. Filloux, A. The type VI secretion system: A tubular story. EMBO J. 2009, 28, 309–310. [Google Scholar] [CrossRef]
  20. Whitney, J.C.; Beck, C.M.; Goo, Y.A.; Russell, A.B.; Harding, B.N.; De Leon, J.A.; Cunningham, D.A.; Tran, B.Q.; Low, D.A.; Goodlett, D.R.; et al. Genetically distinct pathways guide effector export through the type VI secretion system. Mol. Microbiol. 2014, 92, 529–542. [Google Scholar] [CrossRef]
  21. Peng, Y.; Wang, X.; Shou, J.; Zong, B.; Zhang, Y.; Tan, J.; Chen, J.; Hu, L.; Zhu, Y.; Chen, H.; et al. Roles of Hcp family proteins in the pathogenesis of the porcine extraintestinal pathogenic Escherichia coli type VI secretion system. Sci. Rep. 2016, 6, 26816. [Google Scholar] [CrossRef]
  22. Zong, B.; Zhang, Y.; Wang, X.; Liu, M.; Zhang, T.; Zhu, Y.; Zheng, Y.; Hu, L.; Li, P.; Chen, H.; et al. Characterization of multiple type-VI secretion system (T6SS) VgrG proteins in the pathogenicity and antibacterial activity of porcine extra-intestinal pathogenic Escherichia coli. Virulence 2019, 10, 118–132. [Google Scholar] [CrossRef] [PubMed]
  23. Lu, W.; Tan, J.; Lu, H.; Wang, G.; Dong, W.; Wang, C.; Li, X.; Tan, C. Function of Rhs proteins in porcine extraintestinal pathogenic Escherichia coli PCN033. J. Microbiol. 2021, 59, 854–860. [Google Scholar] [CrossRef]
  24. Islam, M.I.; Bae, J.H.; Ishida, T.; Ridone, P.; Lin, J.; Kelso, M.J.; Sowa, Y.; Buckley, B.J.; Baker, M.a.B. Novel Amiloride Derivatives That Inhibit Bacterial Motility across Multiple Strains and Stator Types. J. Bacteriol. 2021, 203, e00367-21. [Google Scholar] [CrossRef]
  25. Wadhwa, N.; Berg, H.C. Bacterial motility: Machinery and mechanisms. Nat. Rev. Microbiol. 2022, 20, 161–173. [Google Scholar] [CrossRef]
  26. Haiko, J.; Westerlund-Wikström, B. The role of the bacterial flagellum in adhesion and virulence. Biology 2013, 2, 1242–1267. [Google Scholar] [CrossRef]
  27. Chaban, B.; Hughes, H.V.; Beeby, M. The flagellum in bacterial pathogens: For motility and a whole lot more. Semin. Cell Dev. Biol. 2015, 46, 91–103. [Google Scholar] [CrossRef]
  28. Wu, X.; Xu, J.; Yang, X.; Wang, D.; Xu, X. Integrating Transcriptomics and Metabolomics to Explore the Novel Pathway of Fusobacterium nucleatum Invading Colon Cancer Cells. Pathogens 2023, 12, 201. [Google Scholar] [CrossRef]
  29. Zong, B.; Xiao, Y.; Li, R.; Li, H.; Wang, P.; Yang, X.; Zhang, Y. Transcriptome and metabolome profiling to elucidate the mechanism underlying the poor growth of Streptococcus suis serotype 2 after orphan response regulator CovR deletion. Front. Vet. Sci. 2023, 10, 1280161. [Google Scholar] [CrossRef]
  30. Darnton, N.C.; Turner, L.; Rojevsky, S.; Berg, H.C. Dynamics of bacterial swarming. Biophys. J. 2010, 98, 2082–2090. [Google Scholar] [CrossRef]
  31. Duan, Q.; Zhou, M.; Liang, H.; Zhu, X.; Guo, Z.; Li, Y.; Hardwidge, P.R.; Zhu, G. Contribution of flagellin subunit FliC to piglet epithelial cells invasion by F18ab E. coli. Vet. Microbiol. 2013, 166, 220–224. [Google Scholar] [CrossRef]
  32. Liu, F.; Fu, J.; Liu, C.; Chen, J.; Sun, M.; Chen, H.; Tan, C.; Wang, X. Characterization and distinction of two flagellar systems in extraintestinal pathogenic Escherichia coli PCN033. Microbiol. Res. 2016, 196, 69–79. [Google Scholar] [CrossRef] [PubMed]
  33. He, Y.; Xu, T.; Fossheim, L.E.; Zhang, X. FliC, a Flagellin Protein, Is Essential for the Growth and Virulence of Fish Pathogen Edwardsiella tarda. PLoS ONE 2012, 7, e45070. [Google Scholar] [CrossRef] [PubMed]
  34. Kim, J.; Kang, Y.; Choi, O.; Jeong, Y.; Jeong, J.; Lim, J.Y.; Kim, M.; Moon, J.S.; Suga, H.; Hwang, I. Regulation of polar flagellum genes is mediated by quorum sensing and FlhDC in Burkholderia glumae. Mol. Microbiol. 2007, 64, 165–179. [Google Scholar] [CrossRef]
  35. Homma, M.; Kojima, S. Roles of the second messenger c-di-GMP in bacteria: Focusing on the topics of flagellar regulation and Vibrio spp. Genes Cells 2022, 27, 157–172. [Google Scholar] [CrossRef] [PubMed]
  36. Tomás, J.M.; Fulton, K.M.; Twine, S.M.; Merino, S. Generation of null mutants to elucidate the role of bacterial glycosyltransferases in bacterial motility. J. Vis. Exp. 2022, 181, e63231. [Google Scholar] [CrossRef]
  37. Judge, A.; Dodd, M.S. Metabolism. Essays Biochem. 2020, 64, 607–647. [Google Scholar] [CrossRef]
  38. Berg, H.C. The rotary motor of bacterial flagella. Annu. Rev. Biochem. 2003, 72, 19–54. [Google Scholar] [CrossRef]
  39. Colin, R.; Sourjik, V. Emergent properties of bacterial chemotaxis pathway. Curr. Opin. Microbiol. 2017, 39, 24–33. [Google Scholar] [CrossRef]
  40. Milo, R.; Jorgensen, P.; Moran, U.; Weber, G.; Springer, M. BioNumbers--the database of key numbers in molecular and cell biology. Nucleic Acids Res. 2010, 38, D750–D753. [Google Scholar] [CrossRef]
  41. Ling, N.; Wang, X.; Liu, D.; Shen, Y.; Zhang, D.; Ou, D.; Fan, H.; Wang, J.; Ding, Y.; Zhang, J.; et al. Role of fliC on biofilm formation, adhesion, and cell motility in Cronobacter malonaticus and regulation of luxS. Food Chem. Toxicol. 2021, 149, 111940. [Google Scholar] [CrossRef]
  42. Tang, H.; Billings, S.; Wang, X.; Sharp, L.; Blair, D.F. Regulated underexpression and overexpression of the FliN protein of Escherichia coli and evidence for an interaction between FliN and FliM in the flagellar motor. J. Bacteriol. 1995, 177, 3496–3503. [Google Scholar] [CrossRef]
Figure 1. Motility comparison of parental strain, mutant ΔevfG, and the complementary strain ΔevfG-EvfG: (A) swarming abilities of PCN033, ΔevfG, and ΔevfG-EvfG on a solid-agar medium. The area indicated by the red arrow represents the outer margin of the bacterial halo; (B) analysis of the diameter of bacterial swarming in Figure 1A (one-way ANOVA was used to determine statistical significance in comparison to the PCN033 group. ### p < 0.001. The unpaired Student’s two-sided t-test was used to evaluate the statistical significance between ΔevfG and ΔevfG-EvfG. *** p < 0.001); (C) swimming abilities of these strains on semi-solid agar; and (D) analysis of the diameter of bacterial swimming in Figure 1C (one-way ANOVA was used to determine statistical significance in comparison to the PCN033 group. ### p < 0.001. The unpaired Student’s two-sided t-test was used to evaluate the statistical significance between ΔevfG and ΔevfG-EvfG. *** p < 0.001).
Biology 14 00822 g001
Figure 2. TEM observation of parental strain PCN033, mutant ΔevfG, and the complementary strain ΔevfG-EvfG. TEM was used to visualize flagella that had been negatively stained.
Biology 14 00822 g002
Figure 3. Differentially accumulated metabolites between PCN033 and mutant ΔevfG: (A) an analysis using principal component methods was performed on the metabolites found in both PCN033 and ΔevfG. To create a QC sample, equal amounts of the samples from PCN033 and ΔevfG were combined; (B) examination of the relationship between the evfG and PCN033 samples. The color gradient ranges from low (blue) to high (red), indicating the level of correlation for each sample; (C) volcano plots display the DAMs that were either upregulated, downregulated, or remained unchanged when comparing PCN033 and ΔevfG; (D) KEGG enrichment analysis of DAMs; and (E) the classification map of HMDB compounds. In this figure, based on the number of metabolites, the names of the selected HMDB hierarchies, the quantity of metabolites, and the percentage of metabolites they account for are presented in descending order.
Biology 14 00822 g003
Figure 4. Differential phenotypes between PCN033 and mutant ΔevfG: (A) principal component analysis of genes identified from PCN033 and ΔevfG; (B) heat map of mutant ΔevfG and PCN033; (C) volcano plots; (D) GO enrichment; and (E) KEGG enrichment analysis of DEMs.
Biology 14 00822 g004
Figure 5. The qRT-PCR validation of flagella-associated genes of ExPEC strain PCN033, ΔevfG, and ΔevfG-EvfG. * p < 0.05, ** p < 0.01, *** p < 0.001.
Biology 14 00822 g005
Figure 6. Correlation analysis of DEGs and DAMs. Rows represent metabolites, while lists represent genes. The evolutionary tree on the left represents the hierarchical clustering results of metabolites, while the evolutionary tree on the top represents the hierarchical clustering results of genes. Red represents positive correlation and blue represents negative correlation. * p < 0.05, ** p < 0.01, *** p < 0.001.
Biology 14 00822 g006
Figure 7. Mechanism of diminished PCN033 motility after deletion of the gene evfG. The red arrow denotes a significant decrease or downregulation.
Biology 14 00822 g007
Table 1. Primers used in this study.
Gene NameForward (5′ to 3′)Reverese (5′ to 3′)
flgBACCTCAACGCAACACATTCCCGCTAAGGCTCATCTGGTATTG
flgCATGGCACTGCTGAATATTTTTGATACACCTTTACGCCGCCTGT
flgDCCACCAGTAGTAGTTCGCTCACGGCTGACCGTGCTGATTTGTGCC
flgGTACACCGAAACGCAATCCTCTGGACACCGCTTTACTGTTG
flgHGTCTACTCAGGTGGCGGATGACATTGGCGACAGGTTAAGGA
flgECTCAAGCGGTTAGCGGATTAGTGGTCGTGCCATCGGTA
flhACGCCTCATCTTCACCAATCATTGTTCTCGATGGTATGCCG
fliFTCGCACCATTCGTCATACCACATCTGTTCGTTGCTGAGAGG
fliICCCAATCAATGCCCTGCTTACCACCAATCAAACCCACGACAA
fliJGCGATATGAGTGCCGGGATGGCTGTTCAGGGCAATGTCAA
fliMGCCGACCAACCTGAACCTTACCACTTTAGTCGGGAAGCGT
fliNCCGCACACGAATGACCATCTATCAGCGACTACGACAACTTC
fliLTGGCATTCGCATCAGGTTGCATCTTTCAGTCGCAGGGTTAT
fliPGCGCCACCTAACCAGGTATTAACCCTAAATCCGCCTCACG
fliQCGCCACACAGATTAACGAAATGCAGCAACAGATTGAGCATCCA
flgFCACAATCTCGGTGCTCAATCCCGACATCACACGCAAGGTT
flgICTGGTTCGGTGGTGATGAATCGTATCTGGCTGGCTGACATTG
flgACTGCGGTAACGACAAACGATACAGGCTAACGGCATCAACAA
fliGTGCTCGACGGTCAGAATCTCGCGGTAATAACGGCTTCTTCC
fliHGCTTGATAGTGTGATTGCTTCGCGCTGAATAACGGTTCTTGCT
fliECCGCACCCGACCATTAGTTAGCTTATTACGCACCTGAATCC
tsrCAGCGATAACAATGCCTCCTACTCATTAGAGCCATCCACCTCAA
motAATAGAGCGTTTTGCGACCGACGATGGTGGGGACTTTCCTC
motBGCTGATTCAGATTGCGGAGTAATGTTCGGCTGCTTATTCACTT
16sRNAGAATGCCACGGTGAATACGGTTACCTTGTTACGACTTC
Table 2. The list of nine DAMs detected in the ΔevfG compared to PCN033.
PathwayMetaboliteFormulaPeak AreaVIPFCp_ValueType
ΔevfGPCN033
Citrate cycle (TCA cycle)Citric AcidC6H8O75.05 ± 0.1685.479 ± 0.0761.29680.9220.02568down
Malic AcidC4H6O55.678 ± 0.0365.411 ± 0.0811.47361.0490.0006089up
Glyoxylate and dicarboxylate metabolismCitric AcidC6H8O75.05 ± 0.1685.479 ± 0.0761.29680.9220.02568down
3-PhosphoglycerateC3H7O7P3.034 ± 0.2014.617 ± 0.8492.37620.6570.07599down
Malic AcidC4H6O55.678 ± 0.0365.411 ± 0.0811.47361.0490.0006089up
Pentose phosphate pathwayDeoxyriboseC5H10O45.58 ± 0.045.957 ± 0.061.17940.9370.03162down
3-PhosphoglycerateC3H7O7P3.034 ± 0.2014.617 ± 0.8492.37620.6570.07599down
Glycine, serine and threonine metabolismCholineC5H14NO+6.157 ± 0.1236.492 ± 0.041.19490.9480.01386down
L-TryptophanC11H12N2O24.294 ± 0.0614.935 ± 0.0981.76770.870.002812down
3-PhosphoglycerateC3H7O7P3.034 ± 0.2014.617 ± 0.8492.37620.6570.07599down
Aminoacyl-tRNA biosynthesisL-TryptophanC11H12N2O24.294 ± 0.0614.935 ± 0.0981.76770.870.002812down
L-PhenylalanineC9H11NO24.114 ± 0.1254.496 ± 0.0781.24850.9150.0234down
Tryptophan metabolismSerotoninC10H12N2O4.104 ± 0.0424.729 ± 0.1311.7020.8680.005014down
L-TryptophanC11H12N2O24.294 ± 0.0614.935 ± 0.0981.76770.870.002812down
Alanine, aspartate and glutamate metabolismGamma-Aminobutyric AcidC4H9NO25.967 ± 0.0676.419 ± 0.0731.47280.930.002632down
Citric AcidC6H8O75.05 ± 0.1685.479 ± 0.0761.29680.9220.02568down
Note: Pathway: Description of the pathway enriched by KEGG enrichment analysis; Metabolite: Metabolites enriched under the corresponding pathway; Formula: Chemical formula of the metabolite; Peak area: Peak area of the metabolite (mean ± standard deviation); VIP: Variable important in projection; FC: Fold Change; p_value: Derived from t-test statistical analysis; Type: Change trend of metabolites.
Disclaimer/Publisher’s Note: The statements, opinions and data contained in all publications are solely those of the individual author(s) and contributor(s) and not of MDPI and/or the editor(s). MDPI and/or the editor(s) disclaim responsibility for any injury to people or property resulting from any ideas, methods, instructions or products referred to in the content.

