
Comparison of Adenine-Induced Rat Models for Vascular Calcification in Chronic Kidney Disease

 , , and
Simple Summary
Abstract
1. Introduction
2. Methods
2.1. Experimental Animals
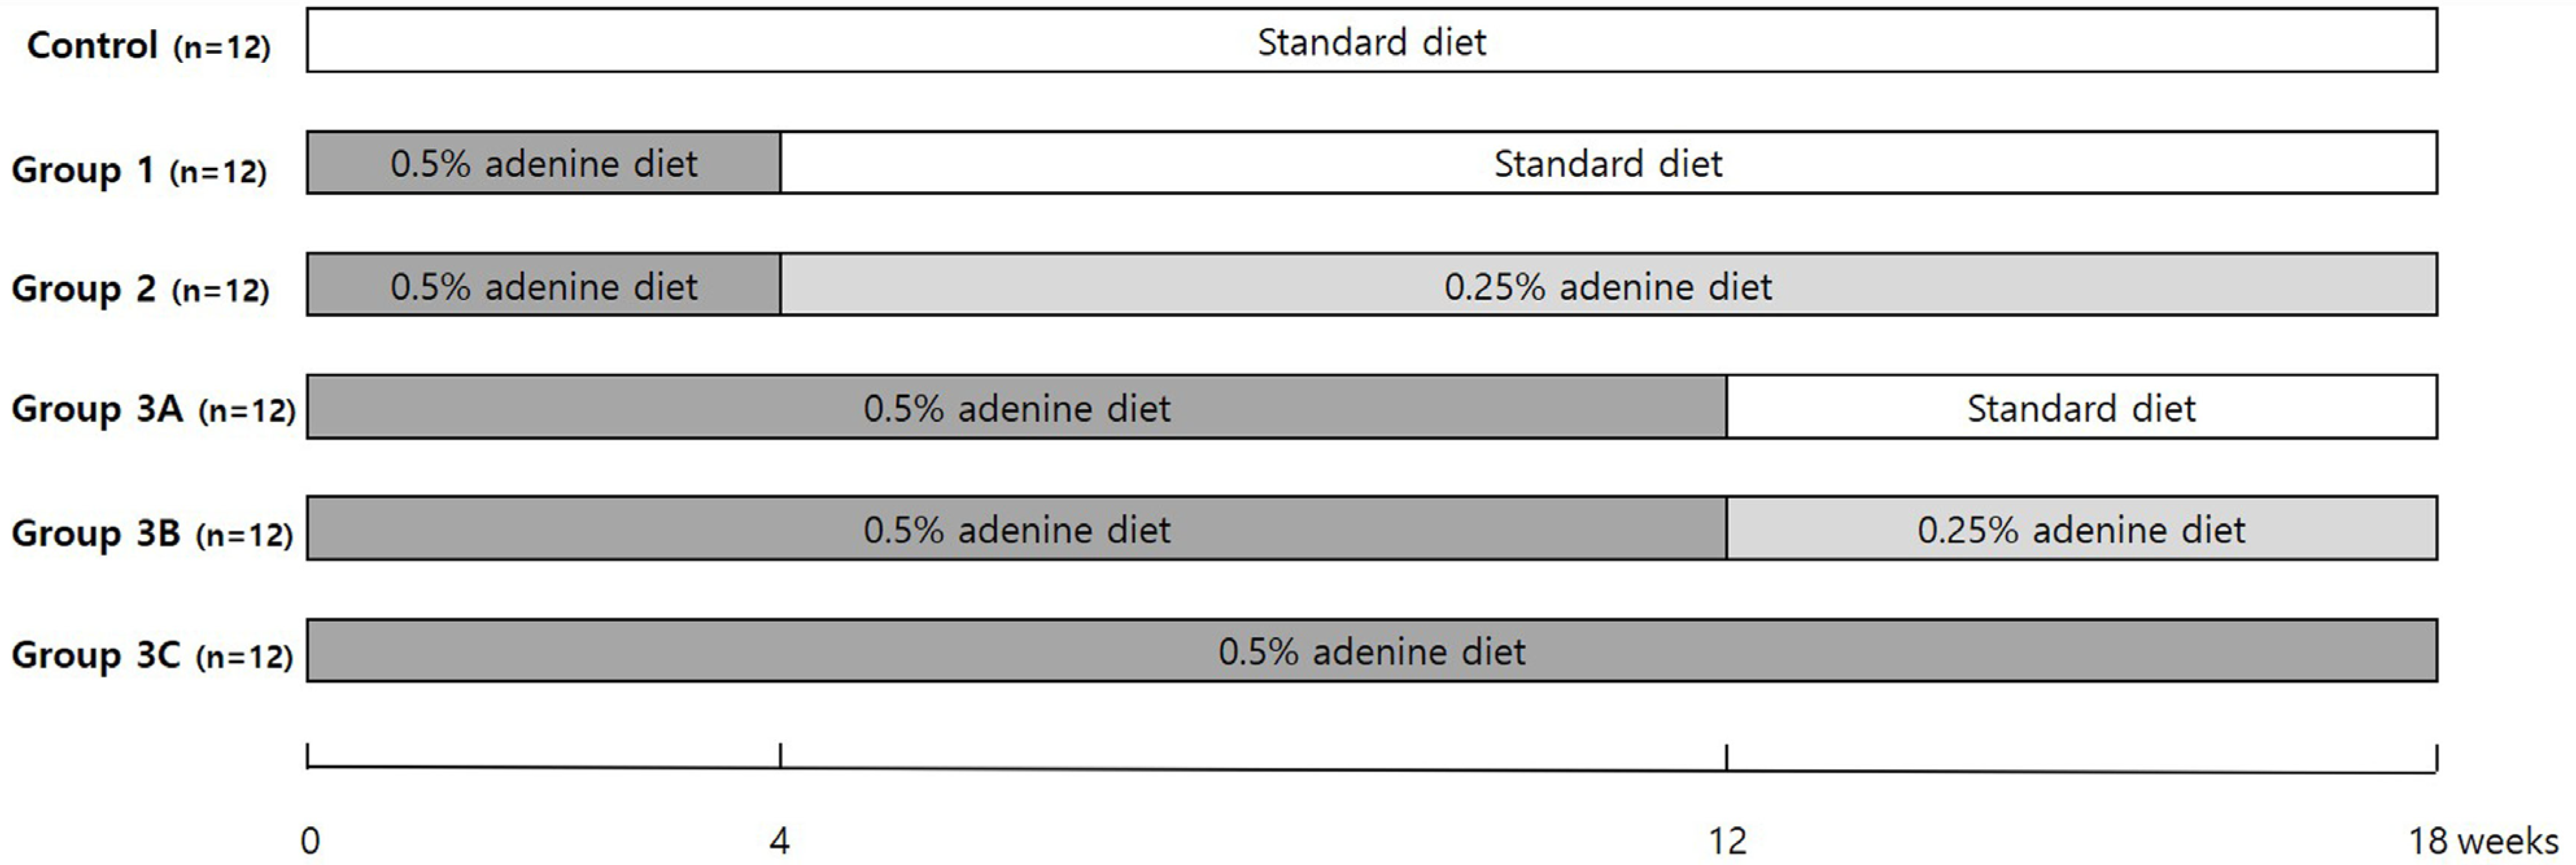
2.2. Experimental Protocols
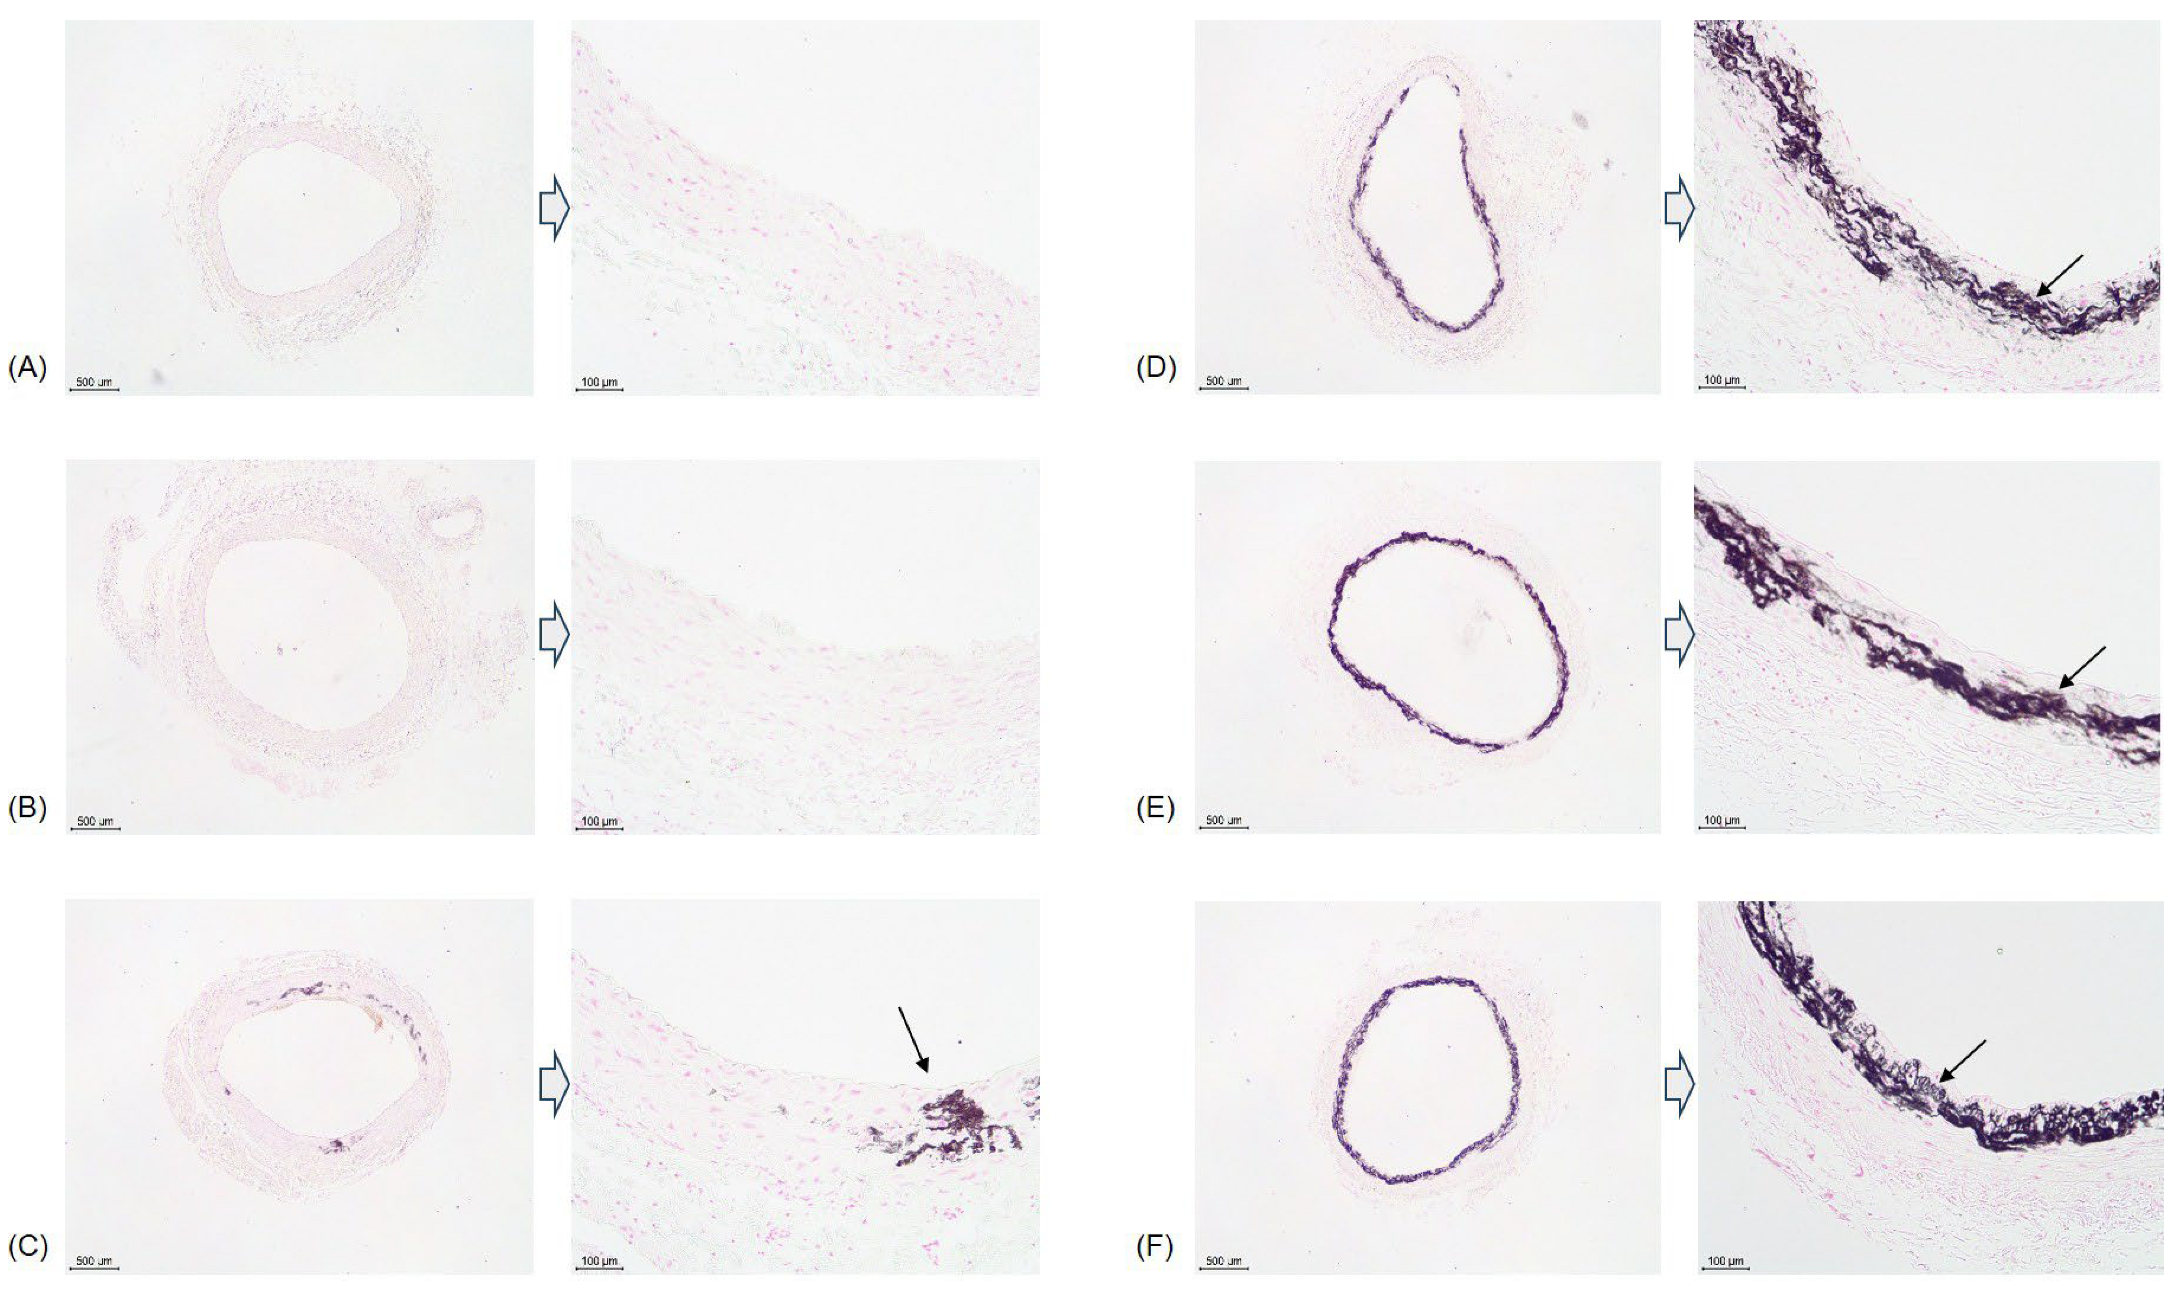
2.3. Histology
2.4. Statistical Analysis
3. Results
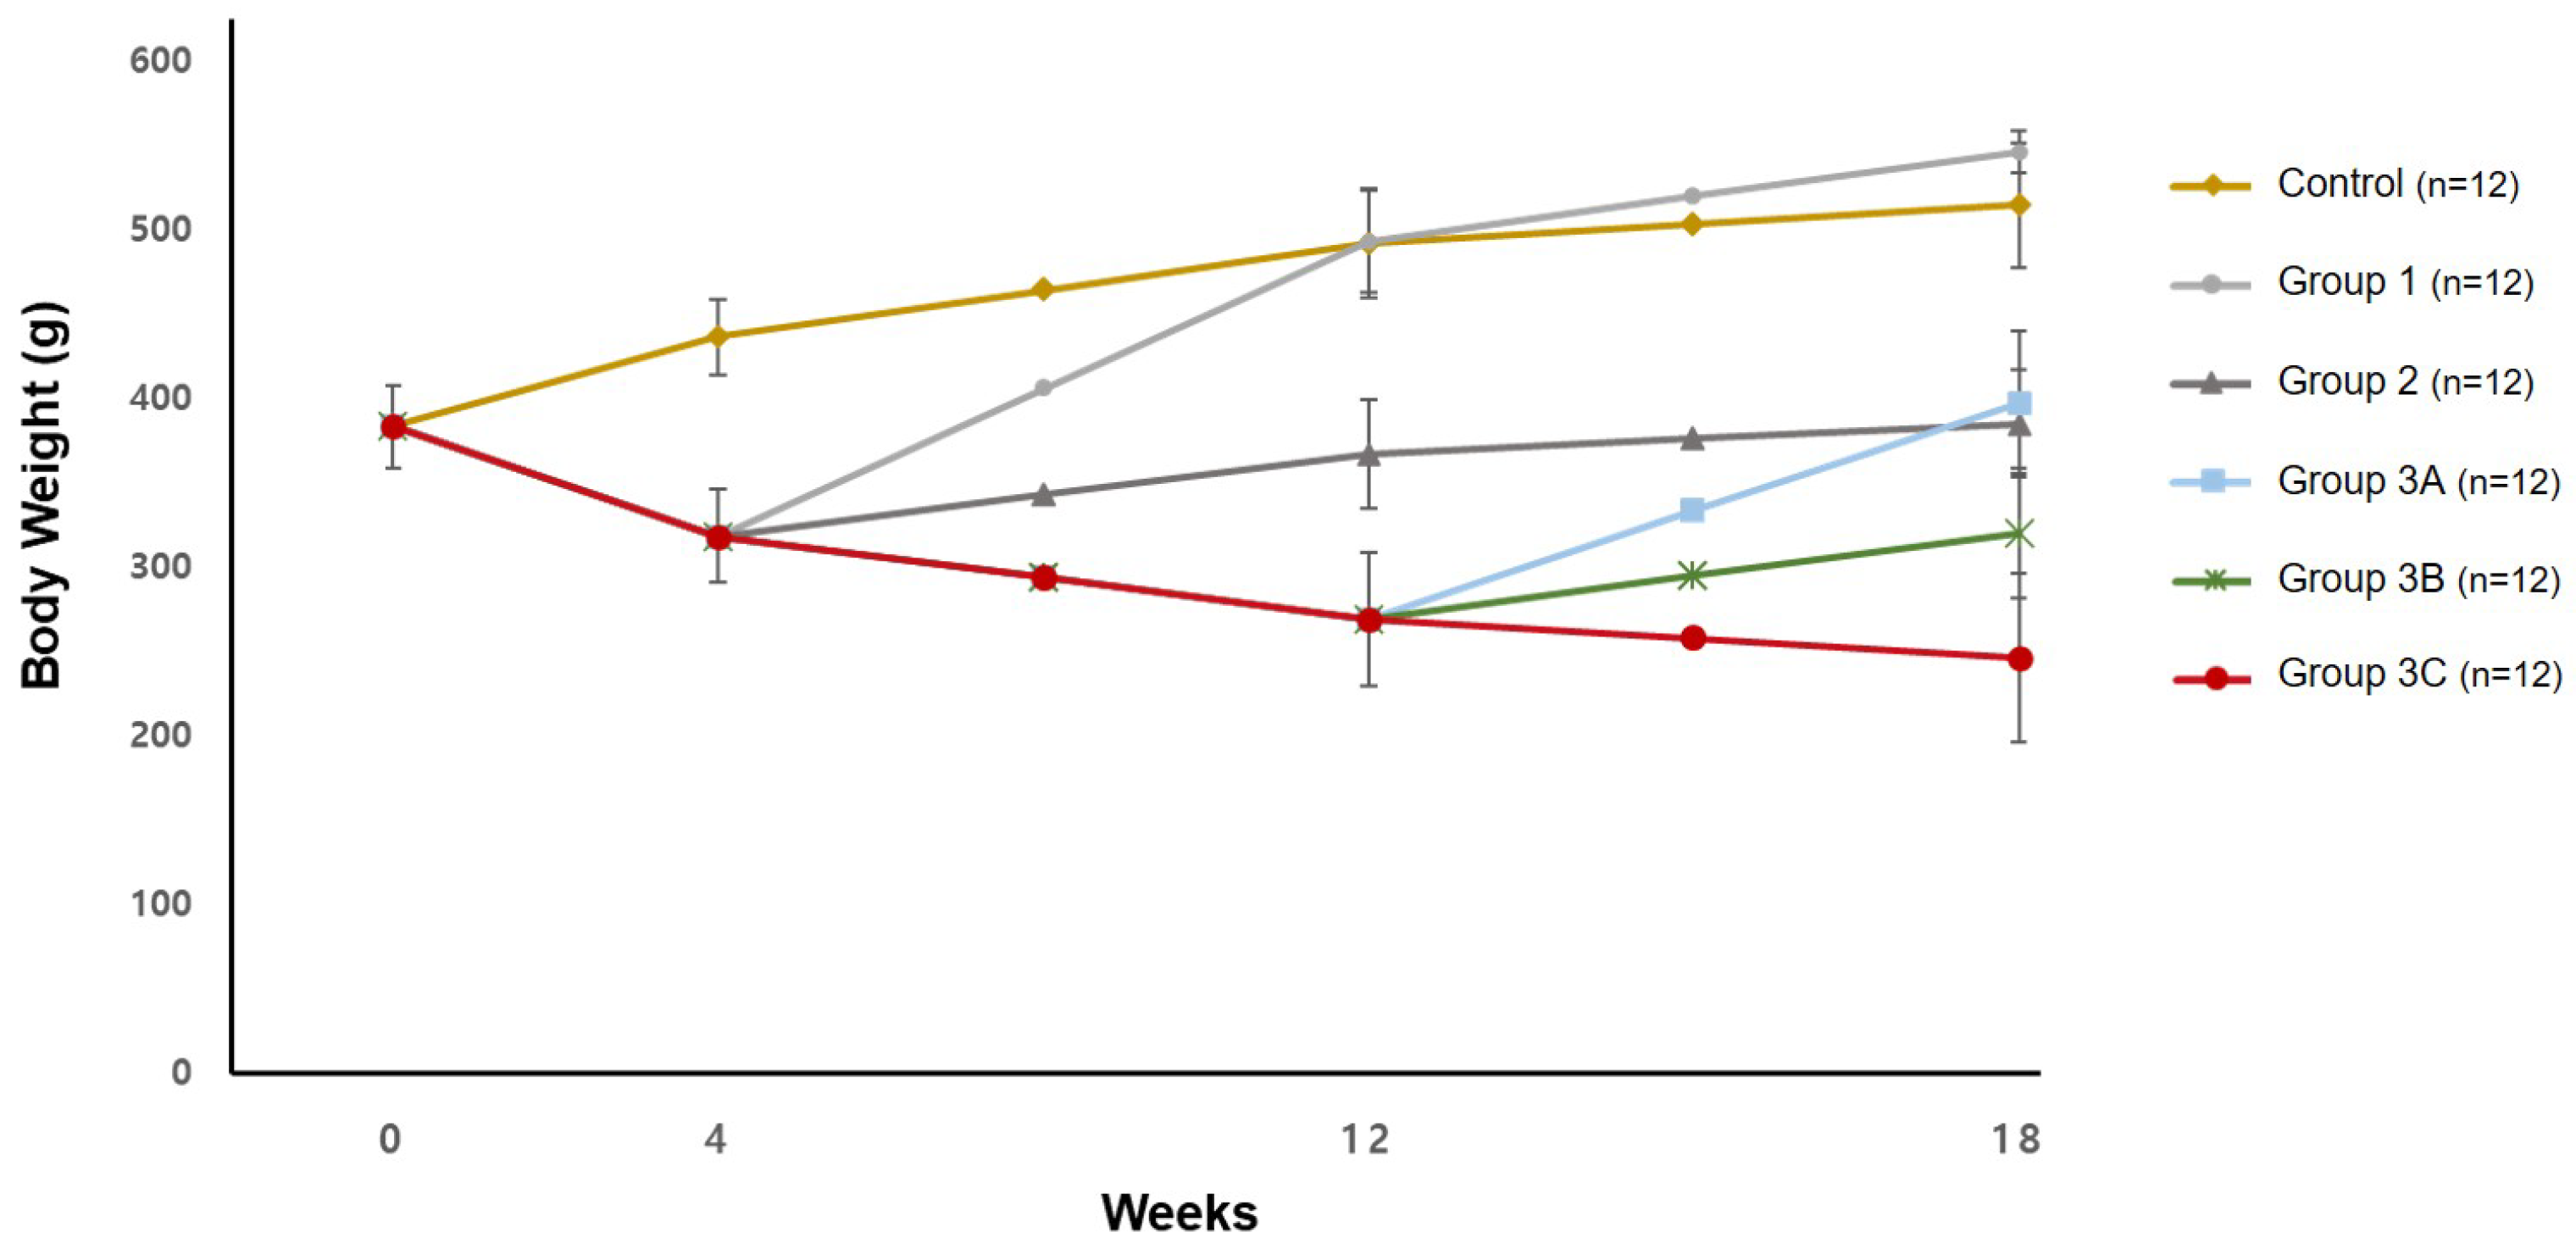
3.1. Body Weight
3.2. Serum Biochemistry
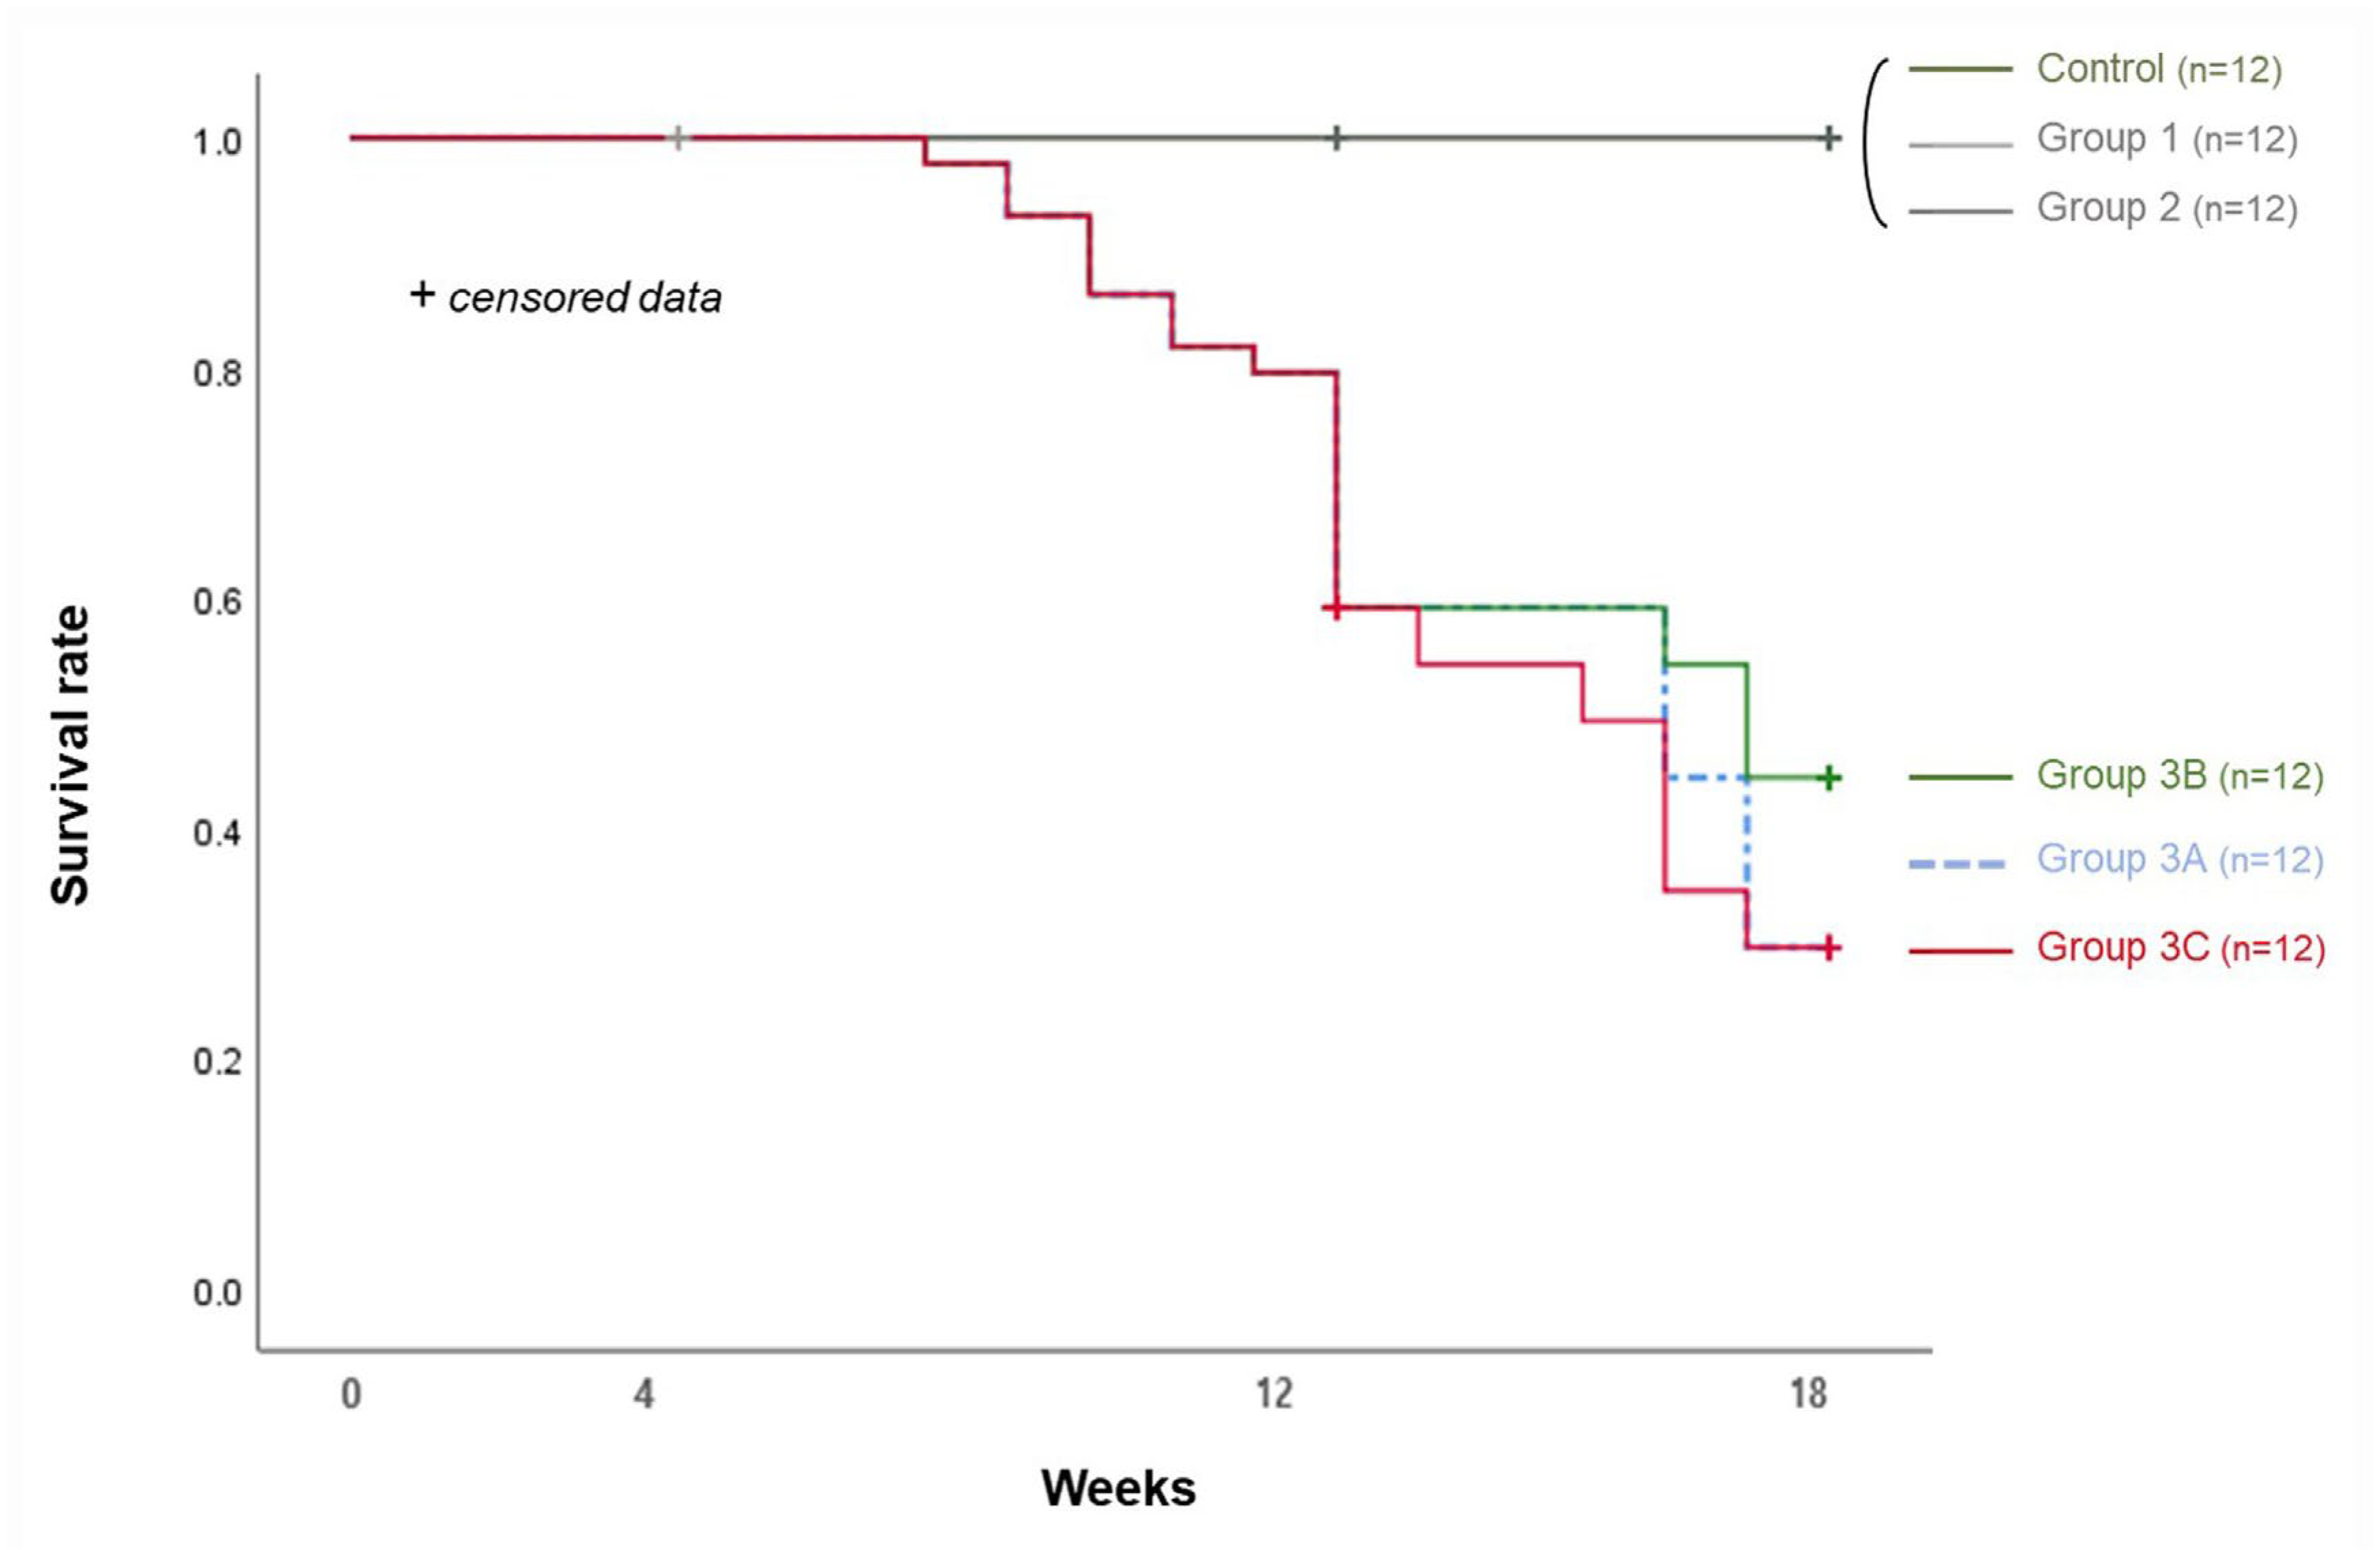
3.3. Survival Rate and Calcification Rate (Table 1 and Table 2)

| Survival Rate (%) | ||||
|---|---|---|---|---|
| Group | 4 wk | 8 wk | 12 wk | 18 wk |
| Control (n = 12) | 12/12 (100) | 8/8 (100) | 8/8 (100) | 4/4 (100) |
| Group 1 (n = 12) | 12/12 (100) | 8/8 (100) | 8/8 (100) | 4/4 (100) |
| Group 2 (n = 12) | 12/12 (100) | 12/12 (100) | 12/12 (100) | 8/8 (100) |
| Group 3 (n = 70) | 70/70 (100) | 67/70 (95.7) | 46/64 (71.9) | |
| Group 3A (n = 12) | 6/12 (50.0) * | |||
| Group 3B (n = 12) | 9/12 (75.0) * | |||
| Group 3C (n = 12) | 6/12 (50.0) * | |||
| Calcification Rate (%) | ||||
|---|---|---|---|---|
| Group | 4 wk | 8 wk | 12 wk | 18 wk |
| Control (n = 12) | 0/4 (0.0) | - | 0/4 (0.0) | 0/4 (0.0) |
| Group 1 (n = 12) | 0/4 (0.0) | - | 0/4 (0.0) | 0/4 (0.0) |
| Group 2 (n = 12) | - | - | 0/4 (0.0) | 1/8 (12.5) |
| Group 3 (n = 70) | - | 1/7 (14.3) | 5/16 (31.3) | |
| Group 3A (n = 12) | 1/8 (12.5) | |||
| Group 3B (n = 12) | 6/9 (66.7) | |||
| Group 3C (n = 12) | 4/6 (66.7) | |||
4. Discussion
5. Conclusions
Supplementary Materials
Author Contributions
Funding
Institutional Review Board Statement
Informed Consent Statement
Data Availability Statement
Conflicts of Interest
Abbreviations
| CKD | chronic kidney disease |
| PAD | peripheral artery disease |
| CLI | critical limb ischemia |
| BUN | blood urea nitrogen |
References
- Lanzer, P.; Boehm, M.; Sorribas, V.; Thiriet, M.; Janzen, J.; Zeller, T.; St Hilaire, C.; Shanahan, C. Medial vascular calcification revisited: Review and perspectives. Eur. Heart J. 2014, 35, 1515–1525. [Google Scholar] [CrossRef]
- Neven, E.; Dauwe, S.; De Broe, M.E.; D’Haese, P.C.; Persy, V. Endochondral bone formation is involved in media calcification in rats and in men. Kidney Int. 2007, 72, 574–581. [Google Scholar] [CrossRef]
- Lee, S.J.; Lee, I.K.; Jeon, J.H. Vascular Calcification-New Insights Into Its Mechanism. Int. J. Mol. Sci. 2020, 21, 2685. [Google Scholar] [CrossRef]
- Ho, C.Y.; Shanahan, C.M. Medial Arterial Calcification: An Overlooked Player in Peripheral Arterial Disease. Arterioscler. Thromb. Vasc. Biol. 2016, 36, 1475–1482. [Google Scholar] [CrossRef]
- Lee, D.O.; Kim, J.H.; Kang, H.W.; Kim, D.Y.; Lee, W.; Cho, T.J.; Lee, D.Y. Calcifying characteristics of peripheral vascular smooth muscle cells of chronic kidney disease patients with critical limb ischemia. Vasc. Med. 2021, 26, 139–146. [Google Scholar] [CrossRef]
- Garimella, P.S.; Hirsch, A.T. Peripheral artery disease and chronic kidney disease: Clinical synergy to improve outcomes. Adv. Chronic Kidney Dis. 2014, 21, 460–471. [Google Scholar] [CrossRef]
- Armstrong, E.J.; Armstrong, D.G. Critical limb ischemia. Vasc. Med. 2021, 26, 228–231. [Google Scholar] [CrossRef]
- Siracusa, C.; Carabetta, N.; Morano, M.B.; Manica, M.; Strangio, A.; Sabatino, J.; Leo, I.; Castagna, A.; Cianflone, E.; Torella, D.; et al. Understanding Vascular Calcification in Chronic Kidney Disease: Pathogenesis and Therapeutic Implications. Int. J. Mol. Sci. 2024, 25, 13096. [Google Scholar] [CrossRef]
- Thorud, J.C.; Plemmons, B.; Buckley, C.J.; Shibuya, N.; Jupiter, D.C. Mortality After Nontraumatic Major Amputation Among Patients with Diabetes and Peripheral Vascular Disease: A Systematic Review. J. Foot Ankle Surg. 2016, 55, 591–599. [Google Scholar] [CrossRef]
- Singh, S.; Saini, R.; Mathur, R.; Sarkar, S.; Sagar, R. The prevalence of depression in people following limb amputation: A systematic review and meta-analysis. J. Psychosom. Res. 2024, 181, 111677. [Google Scholar] [CrossRef]
- Quigley, M.; Dillon, M.P. Quality of life in persons with partial foot or transtibial amputation: A systematic review. Prosthet. Orthot. Int. 2016, 40, 18–30. [Google Scholar] [CrossRef]
- Pollard, J.; Hamilton, G.A.; Rush, S.M.; Ford, L.A. Mortality and morbidity after transmetatarsal amputation: Retrospective review of 101 cases. J. Foot Ankle Surg. 2006, 45, 91–97. [Google Scholar] [CrossRef]
- Diwan, V.; Brown, L.; Gobe, G.C. Adenine-induced chronic kidney disease in rats. Nephrology 2018, 23, 5–11. [Google Scholar] [CrossRef]
- Herrmann, J.; Babic, M.; Tölle, M.; van der Giet, M.; Schuchardt, M. Research Models for Studying Vascular Calcification. Int. J. Mol. Sci. 2020, 21, 2204. [Google Scholar] [CrossRef]
- Yokozawa, T.; Zheng, P.D.; Oura, H.; Koizumi, F. Animal model of adenine-induced chronic renal failure in rats. Nephron 1986, 44, 230–234. [Google Scholar] [CrossRef]
- Panditrao Lahane, G.; Dhar, A. Renoprotective effect of Nesfatin-1 in Adenine-Induced Chronic kidney Disease: An in vitro and in vivo study. Biochem. Pharmacol. 2024, 225, 116284. [Google Scholar] [CrossRef]
- Shobeiri, N.; Pang, J.; Adams, M.A.; Holden, R.M. Cardiovascular disease in an adenine-induced model of chronic kidney disease: The temporal link between vascular calcification and haemodynamic consequences. J. Hypertens. 2013, 31, 160–168. [Google Scholar] [CrossRef]
- Ferrari, G.O.; Ferreira, J.C.; Cavallari, R.T.; Neves, K.R.; dos Reis, L.M.; Dominguez, W.V.; Oliveira, E.C.; Graciolli, F.G.; Passlick-Deetjen, J.; Jorgetti, V.; et al. Mineral bone disorder in chronic kidney disease: Head-to-head comparison of the 5/6 nephrectomy and adenine models. BMC Nephrol. 2014, 15, 69. [Google Scholar] [CrossRef]
- Diwan, V.; Mistry, A.; Gobe, G.; Brown, L. Adenine-induced chronic kidney and cardiovascular damage in rats. J. Pharmacol. Toxicol. Methods 2013, 68, 197–207. [Google Scholar] [CrossRef]
- Sengupta, P. The Laboratory Rat: Relating Its Age with Human’s. Int. J. Prev. Med. 2013, 4, 624–630. [Google Scholar]
- Yamada, S.; Tatsumoto, N.; Tokumoto, M.; Noguchi, H.; Ooboshi, H.; Kitazono, T.; Tsuruya, K. Phosphate binders prevent phosphate-induced cellular senescence of vascular smooth muscle cells and vascular calcification in a modified, adenine-based uremic rat model. Calcif. Tissue Int. 2015, 96, 347–358. [Google Scholar] [CrossRef]
- Kim, K.; Anderson, E.M.; Thome, T.; Lu, G.; Salyers, Z.R.; Cort, T.A.; O’Malley, K.A.; Scali, S.T.; Ryan, T.E. Skeletal myopathy in CKD: A comparison of adenine-induced nephropathy and 5/6 nephrectomy models in mice. Am. J. Physiol. Renal Physiol. 2021, 321, F106–F119. [Google Scholar] [CrossRef]
- Yokozawa, T.; Oura, H.; Okada, T. Metabolic effects of dietary purine in rats. J. Nutr. Sci. Vitaminol. 1982, 28, 519–526. [Google Scholar] [CrossRef]
- Yang, Q.; Su, S.; Luo, N.; Cao, G. Adenine-induced animal model of chronic kidney disease: Current applications and future perspectives. Ren. Fail. 2024, 46, 2336128. [Google Scholar] [CrossRef]
- Hou, C.; Xiao, G.; Amakye, W.K.; Sun, J.; Xu, Z.; Ren, J. Guidelines for purine extraction and determination in foods. Food Front. 2021, 2, 557–573. [Google Scholar] [CrossRef]
- Yang, X.; Liu, Y.; Zhu, X.; Chen, P.; Xie, X.; Xu, T.; Zhang, X.; Zhao, Y. Vascular, valvular and kidney calcification manifested in mouse models of adenine-induced chronic kidney disease. Ren. Fail. 2023, 45, 2228920. [Google Scholar] [CrossRef]
- Su, Z.; Zong, P.; Chen, J.; Yang, S.; Shen, Y.; Lu, Y.; Yang, C.; Kong, X.; Sheng, Y.; Sun, W. Celastrol attenuates arterial and valvular calcification via inhibiting BMP2/Smad1/5 signalling. J. Cell. Mol. Med. 2020, 24, 12476–12490. [Google Scholar] [CrossRef]
- Herrmann, J.; Gummi, M.R.; Xia, M.; van der Giet, M.; Tölle, M.; Schuchardt, M. Vascular Calcification in Rodent Models-Keeping Track with an Extented Method Assortment. Biology 2021, 10, 459. [Google Scholar] [CrossRef]
- Morishita, Y.; Ohnishi, A.; Watanabe, M.; Ishibashi, K.; Kusano, E. Establishment of acute kidney injury mouse model by 0.75% adenine ingestion. Ren. Fail. 2011, 33, 1013–1018. [Google Scholar] [CrossRef]
- Metzger, C.E.; Swallow, E.A.; Stacy, A.J.; Allen, M.R. Adenine-induced chronic kidney disease induces a similar skeletal phenotype in male and female C57BL/6 mice with more severe deficits in cortical bone properties of male mice. PLoS ONE 2021, 16, e0250438. [Google Scholar] [CrossRef]
- Diwan, V.; Small, D.; Kauter, K.; Gobe, G.C.; Brown, L. Gender differences in adenine-induced chronic kidney disease and cardiovascular complications in rats. Am. J. Physiol. Renal Physiol. 2014, 307, F1169–F1178. [Google Scholar] [CrossRef]

Disclaimer/Publisher’s Note: The statements, opinions and data contained in all publications are solely those of the individual author(s) and contributor(s) and not of MDPI and/or the editor(s). MDPI and/or the editor(s) disclaim responsibility for any injury to people or property resulting from any ideas, methods, instructions or products referred to in the content. |
© 2025 by the authors. Licensee MDPI, Basel, Switzerland. This article is an open access article distributed under the terms and conditions of the Creative Commons Attribution (CC BY) license (https://creativecommons.org/licenses/by/4.0/).
Share and Cite
Kang, H.W.; Kim, J.H.; Yoon, A.R.; Kim, J.; Kim, J.; Kyung, M.G.; Lee, D.Y. Comparison of Adenine-Induced Rat Models for Vascular Calcification in Chronic Kidney Disease. Biology 2025, 14, 814. https://doi.org/10.3390/biology14070814
Kang HW, Kim JH, Yoon AR, Kim J, Kim J, Kyung MG, Lee DY. Comparison of Adenine-Induced Rat Models for Vascular Calcification in Chronic Kidney Disease. Biology. 2025; 14(7):814. https://doi.org/10.3390/biology14070814
Chicago/Turabian StyleKang, Ho Won, Ji Hye Kim, A Ro Yoon, Jahyung Kim, Joonhee Kim, Min Gyu Kyung, and Dong Yeon Lee. 2025. "Comparison of Adenine-Induced Rat Models for Vascular Calcification in Chronic Kidney Disease" Biology 14, no. 7: 814. https://doi.org/10.3390/biology14070814
APA StyleKang, H. W., Kim, J. H., Yoon, A. R., Kim, J., Kim, J., Kyung, M. G., & Lee, D. Y. (2025). Comparison of Adenine-Induced Rat Models for Vascular Calcification in Chronic Kidney Disease. Biology, 14(7), 814. https://doi.org/10.3390/biology14070814