Article

Genome-Wide Identification and Heat Stress-Induced Expression Profiling of the Hsp70 Gene Family in Phoebe bournei

College of Forestry, Fujian Agriculture and Forestry University, Fuzhou 350002, China
*
Authors to whom correspondence should be addressed.
Biology 2025, 14(6), 602; https://doi.org/10.3390/biology14060602
Submission received: 30 April 2025 / Revised: 18 May 2025 / Accepted: 22 May 2025 / Published: 25 May 2025
(This article belongs to the Section Physiology)

Simple Summary

Heat stress is one of the important factors affecting the distribution of Phoebe bournei, we analyzed Hsp70 in P. bournei, encompassing physicochemical properties, gene structure, phylogenetic tree construction, collinearity analysis, and cis-elements. Forty-five PbHsp70s were identified and classified into four groups (I–IV). Specifically, this study systematically demonstrates the molecular characteristics of PbHsp70 genes in P. bournei, which contributes to broadening our understanding of the evolutionary relationships. Moreover, the response of PbHsp70 genes to heat stress was studied, and a set of candidate genes for heat stress resistance was provided, which provided new insights for further investigating the role of Hsp70 proteins and for stress breeding.

Abstract

Phoebe bournei, a rare tree species native to China, holds considerable economic importance. The heat shock protein 70 (Hsp70) family is a group of molecular chaperones that is broadly distributed across living organisms and play a critical role in processes like growth, development, and stress response. While Hsp70 genes have been identified and studied in various plant species, their specific functions in the growth and development of P. bournei remain unexplored. We performed a comprehensive analysis of the Hsp70 gene family in P. bournei, identifying a total of 45 Hsp70 genes, which were classified into four groups (I–IV) through phylogenetic analysis. All Hsp70 proteins possessed conserved structural domains, including motif 7, and introns were present in 77.8% of the genes. Chromosomal localization and collinearity analyses of the Hsp70 genes revealed their evolutionary relationships and potential gene duplication events. Examination of the cis-acting elements within the Hsp70 promoter regions revealed that the predominant elements were associated with growth and development, followed by those responsive to hormones, and then elements linked to abiotic stress. Nine genes with high expression were selected for RT-qPCR analysis. Under high-temperature stress, all nine genes were differentially upregulated, and most of these genes belonged to subfamilies II and III, indicating that these two subfamilies have strong potential for heat resistance. In this study, we have elucidated the molecular characteristics and heat response properties of the Hsp70 gene family in P. bournei, revealing the mechanisms behind its heat stress response. Our work provides a reference for stress breeding in P. bournei and a theoretical basis for the exploration of heat tolerance in woody plants.

1. Introduction

The heat shock transcription factor (HSF) family responds to biotic and abiotic stresses, enhancing plants resistance and supporting normal growth and development [1]. Temperature is a fundamental environmental factor influencing plant growth and development. It strongly affects physiological and metabolic processes in plants; therefore, extensive research efforts have focused on elucidating the adaptive mechanisms of plants under thermal stress [2,3]. Thermotropic stress induced through heat shock treatment activates plants’ endogenous proteinaceous defense networks, significantly upregulating the expression of heat shock proteins (Hsps), which are key components of the cellular stress response mechanism [4]. Based on the protein size (60, 70, 90, and 100 kDa), Hsps are categorized into subgroups, namely the Hsp60, Hsp70, Hsp90, and Hsp100 gene families [5]. Among these heat shock protein families, Hsp70 is known as the major heat shock protein and consists of two functional domains, the nucleotide-binding domain (NBD) and the substrate-binding domain (SBD) [6]. Hsp70 is highly conserved and plays a crucial role in sustaining plant growth homeostasis under heat stress at sublethal temperatures [7,8,9]. Hsp70 acts as a molecular chaperone in the presence of temperature stress by assisting in restoring proper protein folding and repairing denatured proteins to achieve plant protection [10]. The Hsp70 molecular chaperone system has shown significant gene expansion during plants’ evolution [11]. Genome-wide analyses have revealed substantial interspecies variation in the number of family members; in particular, Arabidopsis thaliana (17 genes), Oryza sativa (26 genes), Capsicum annuum L. (21 genes), and Glycine max (L.) Merr. (61 genes) have been systematically characterized [9,12]. In A. thaliana, Hsp70 loss-of-function mutant plants exhibited stunted growth and an abnormal leaf morphology [13], and double-allele knockout experiments have confirmed the critical regulatory role of Hsp70 in gametophyte development [14]. In addition, Hsp70 proteins located in the cytoplasm and nucleus play key regulatory roles in A. thaliana plant development under abiotic stress, such as salt damage and drought [15,16].
Phoebe bournei is a rare evergreen tree species that is endemic to China; it is classified as a key protected wild plant species due to the high economic and cultural value of its timber. However, with global warming, high-temperature stress has become a key environmental issue threatening the survival of P. bournei populations [17,18]. Studies have shown that P. bournei, which is naturally distributed in subtropical humid climate zones, is unable to adapt to extremely high temperatures. High-temperature stress inhibits photosynthesis, destroys the cell membrane system, and accelerates the accumulation of reactive oxygen species, leading to growth inhibition and even seeding mortality [19,20]. In this context, it is crucial to analyze the regulation mechanism of the Hsp70 gene family expression in P. bournei under heat stress [21,22]. However, to date, a systematic genome-wide survey and comprehensive functional analysis of this gene family in P. bournei remain unexplored.
In this study, we present the first genome-wide investigation of the Hsp70 gene family in P. bournei. Through comprehensive bioinformatics analyses, we identified gene family members, reconstructed their phylogenetic relationships and collinearity patterns, and predicted their protein structures using established computational tools [23]. In addition, the expression of the proteins was analyzed via real-time fluorescence quantitative PCR (RT-qPCR) to ascertain their reactions to heat shock stress in P. bournei [24]. This study aims to provide important genetic information for the Hsp70 gene family of P. bournei and offer high-quality reference genes for the genetic engineering and breeding of P. bournei. This, in turn, will provide important support for improvements in the stress tolerance of rare tree species.

2. Materials and Methods

2.1. Data Acquisition and Sample Collection

The whole-genome data of P. bournei (CNSA: CNP0002030) were obtained from the China National GeneBank Database (CNSA, accessed on 17 January2025) [25]. The genome sequence files of A. thaliana and P. trichocarpa were acquired from the Arabidopsis Information Resource (TAIR, https://www.arabidopsis.org/, accessed on 17 January 2025) and Phytozome v13 (https://phytozome-next.jgi.doe.gov/, accessed on 17 January 2025) [26,27]. After plant material preparation and sampling, 1-year-old tissue-cultured P. bournei seedlings cultivated in artificial climate chambers were selected as the experimental materials. Seedlings that exhibited uniform growth were divided into experimental groups and control groups and subjected to stress treatments. Each treatment consists of three biological replicates, following standardized protocols for plant material collection. We ensured that all plants were in the same growth state and under the same ecological conditions. The instruments were sterilized and disinfected. Three to five healthy leaf slices were randomly selected from each P. bournei plant. The samples were rinsed three times with pure water, and the surface water was blotted with sterile filter paper. Following treatment, leaf samples were cryo-preserved through rapid immersion in liquid nitrogen and subsequently stored at −80 °C to preserve RNA integrity prior to extraction.

2.2. Characterization and Functional Analysis of Hsp70 Gene Family

The amino acid sequence of the Hsp70 protein from A. thaliana was used as a probe to perform a local BLAST search, followed by the reverse BLAST comparison of the obtained sequences using NCBI (https://www.ncbi.nlm.nih.gov/, accessed on 20 January 2025) [28]. To further identify Hsp70 in P. bournei, we used a Hidden Markov Model (HMM) profile of Hsp70 (PF00012) from the Pfam 37.2 database (accessed on 20 January 2025) for analysis, using HMMER-3.2.1 (http://hmmer.org/download.html, accessed on 20 January 2025) with an e-value < 10−5 and other parameters set to default values [29]. We then utilized ExPASy 3.0 (https://www.expasy.org/, accessed on 21 January 2025) for the evaluation of the protein attributes [30]. A protein is classified as basic when its isoelectric point (pI) exceeds 7, whereas acidic characterization occurs when the pI falls below this threshold [31]. The instability index less than 40 indicates that the protein is stable [32]. Moreover, a comprehensive analysis of the potential subcellular localization of the Hsp70 proteins in P. bournei through WoLF PSORT (https://wolfpsort.hgc.jp/, accessed on 22 January 2025) facilitates better exploration of the functions of these proteins [33].

2.3. Phylogenetic Analysis of Hsp70

The Hsp70 protein sequences from A. thaliana, P. bournei, and Populus trichocarpa were aligned using the Muscle program. Subsequently, a phylogenetic tree was constructed using the IQ-TREE software (https://iqtree.github.io/, accessed on 23 January 2025) to elucidate their evolutionary relationships [34,35]. We constructed phylogenetic trees using the maximum likelihood (ML) method through the Muscle program, with the default settings [36]. The bootstrap method was performed with 1000 replicates. The iTOL online platform (https://itol.embl.de/, accessed on 23 January 2025) was used to visualize and annotate the phylogenetic trees to enhance clarity and interpretability [37].

2.4. Motifs and Gene Structures Analysis

The NCBI’s CDD tool was used to predict the inherent conserved structural domains of the Hsp70 family in P. bournei [38]. In addition, the conserved motifs of the Hsp70 family in P. bournei, A. thaliana, and P. trichocarpa were analyzed using the MEME 5.5.7 (https://meme-suite.org/meme/tools/meme, accessed on 23 January 2025) [39]. The MEME analysis was performed using the default settings, adjusting the maximum number of motifs to 10. Sequentially, the generated output was used to construct an overall comparative map including the ML phylogenetic tree. The phylogenetic trees, motif conservation profiles, and gene structural annotations were computationally integrated and visually rendered.

2.5. Chromosomes Localization and Collinearity Analysis of Hsp70s

The gene sequence and annotation data of P. bournei were used to visualize the Hsp70 family’s chromosome positions using the TBtools v2.210 software [40]. The genomic information of P. bournei was obtained from the NCBI database, and its Hsp70 gene family was analyzed for collinearity. For the collinearity analysis, we utilized the MCScanX from TBtools software [41].

2.6. Cis-Acting Elements Analysis of Hsp70

To investigate the transcriptional regulation of the Hsp70 family in P. bournei, we extracted the 2000 bp upstream sequence of the Hsp70 promoter and subsequently analyzed this region using PlantCARE (https://planttfdb.gao-lab.org/index.php?sp=Ath, accessed on 25 January 2025) to predict the occurrence of cis-elements [42]. After screening and classification, Cytoscape 3.10.3 was applied to visualize the data [43].

2.7. Analysis of Expression, RNA Extraction and RT-qPCR

We used the FastPure Plant Total RNA Isolation Kit (for polysaccharide- and polyphenol-rich tissue) (Vazyme Biotech Co., Ltd., Nanjing, China) to extract RNA from differently treated P. bournei leaves. Using the RSEM v1.2.8 tool, the gene expression levels of individual samples were quantified with high precision through computational analysis. From this, we obtained the fragments per kilobase of transcripts per million fragments (FPKM) values [44]. Based on the calculated FPKM values, detailed heatmaps were generated using TBtools software to visualize the gene expression levels and make the results clearer and more concise [40].
Using the First-Strand cDNA Synthesis Mix#F022 (Beijing Lablead, Beijing, China), reverse transcription was carried out using a method designed to prevent potential genomic DNA contamination and improve cDNA synthesis efficiency. The 2x Realab Green PCR Fast Mixture R0202 was used for the RT-qPCR analysis. Each sample was analyzed with three replicates. The experimental setup consisted of a 96-well plate with 20 µL of the reaction system per well, consisting of 10 µL Taq SYBR® Green qPCR Premix, Beijing, China, 0.4 µL each of the positive and negative primers, 2 µL cDNA template, and 7.2 µL nuclease-free water. The reference gene primers were designed based on previously published studies [45]. PbEF1α was selected as the reference gene. The primer design and the synthesis of the target gene were completed by Sangon Biotech (Shanghai) Co., Ltd., Shanghai, China. The PCR amplification was executed using a four-step thermal cycling protocol. Forty reaction cycles were performed. The relative expression levels of the target genes were evaluated through the implementation of the 2−ΔΔCT method and the GraphPad Prism 7.0 software. Table S1 shows the qRT-PCR primers.

3. Results

3.1. Identification and Analysis of Hsp70 Proteins

The Hsp70 proteins of P. bournei were identified using BLAST and HMMER-3.2.1 (https://blast.ncbi.nlm.nih.gov/Blast.cgi; http://hmmer.org/download.html, accessed on 20 January 2025). In total, 45 PbHsp70 proteins were identified sequentially from top to bottom in P. bournei using the chromosomal positions. The amino acid (AA) count varied from 114 aa (PbHsp70-24) to 1358 aa (PbHsp70-42), with an average length of 457 aa. The grand average of hydropathy (GRAVY) of the Hsp70 family ranged from −1.119 (PbHsp70-10) to −0.306 (PbHsp70-21), indicating that the GRAVY scores for the entire family were below 0, suggesting that all Hsp70 proteins were hydrophilic. The theoretical isoelectric point (pI) ranged from 4.65 (PbHsp70-43) to 9.75 (PbHsp70-37). The isoelectric point (pI) values of 28 Hsp70 proteins were less than 7.0, indicating acidity, while the remaining 17 had pl values above 7.0, indicating basic isoelectric points. The molecular weights (MWs) of the 45 Hsp70 proteins ranged from 12.93 kDa (PbHsp70-21) to 150.81 kDa (PbHsp70-42), with an average MW of 50.92 kDa. The aliphatic index (AI) ranged from 67.72 (PbHsp70-24) to 103.21 (PbHsp70-19). The instability index (II) ranged from 23.18 (PbHsp70-35) to 56.09 (PbHsp70-11), indicating that most Hsp70 proteins were unstable. Moreover, subcellular localization predictions showed that the Hsp70 proteins in P. bournei were mainly localized to the cytoplasm (Table 1).

3.2. Phylogeny and Classification of Hsp70s

Based on the ML method, the phylogenetic relationship was constructed based on a total of 97 Hsp70 protein sequences from P. bournei, P. trichocarpa, and A. thaliana (Figure 1). Compared to the AtHsp70 family in A. thaliana, based on the overall morphology of the evolutionary tree, the Hsp70 gene family in P. bournei showed a more distinct branching structure, which was roughly divided into four major regions (I–IV), with subfamily I having the largest number of members (34 species) and family IV having the smallest (15 species). This may reflect the different evolutionary branches or the functional differentiation of gene families during the evolutionary process. Gene members within each region are closely related, while genes between different regions are more divergent. The distribution of the Hsp70 genes in all regions of P. bournei indicates that the Hsp70 family in this species is highly diverse and may have undergone gene exchange with the Hsp70 genes of other species, or they may have had shared ancestors during the evolutionary process. Compared with other regions, subfamily I is relatively independent in its gene composition and may represent a relatively unique evolutionary branch of the Hsp70 gene family in P. bournei. The Hsp70 genes of A. thaliana and P. trichocarpa were clustered with some genes of P. bournei, indicating that these plants are evolutionarily related, and the Hsp70 gene family may have conserved certain structural and functional elements among different plant species in response to similar biological processes, such as cellular stress responses. From the branching of the evolutionary tree, it was observed that some genes appeared in clusters, which may indicate gene duplication events. After gene duplication, the newly generated copies may experience different evolutionary pressures, leading to functional divergence. In some branches, the genes may gradually adapt to different environmental conditions or cellular physiological demands, leading to the evolution of Hsp70 proteins with different properties, being able to engage in biological processes including critical processes like protein biosynthesis and quality control mechanisms that maintain cellular homeostasis.

3.3. Hsp70 Structure and Motif Analysis

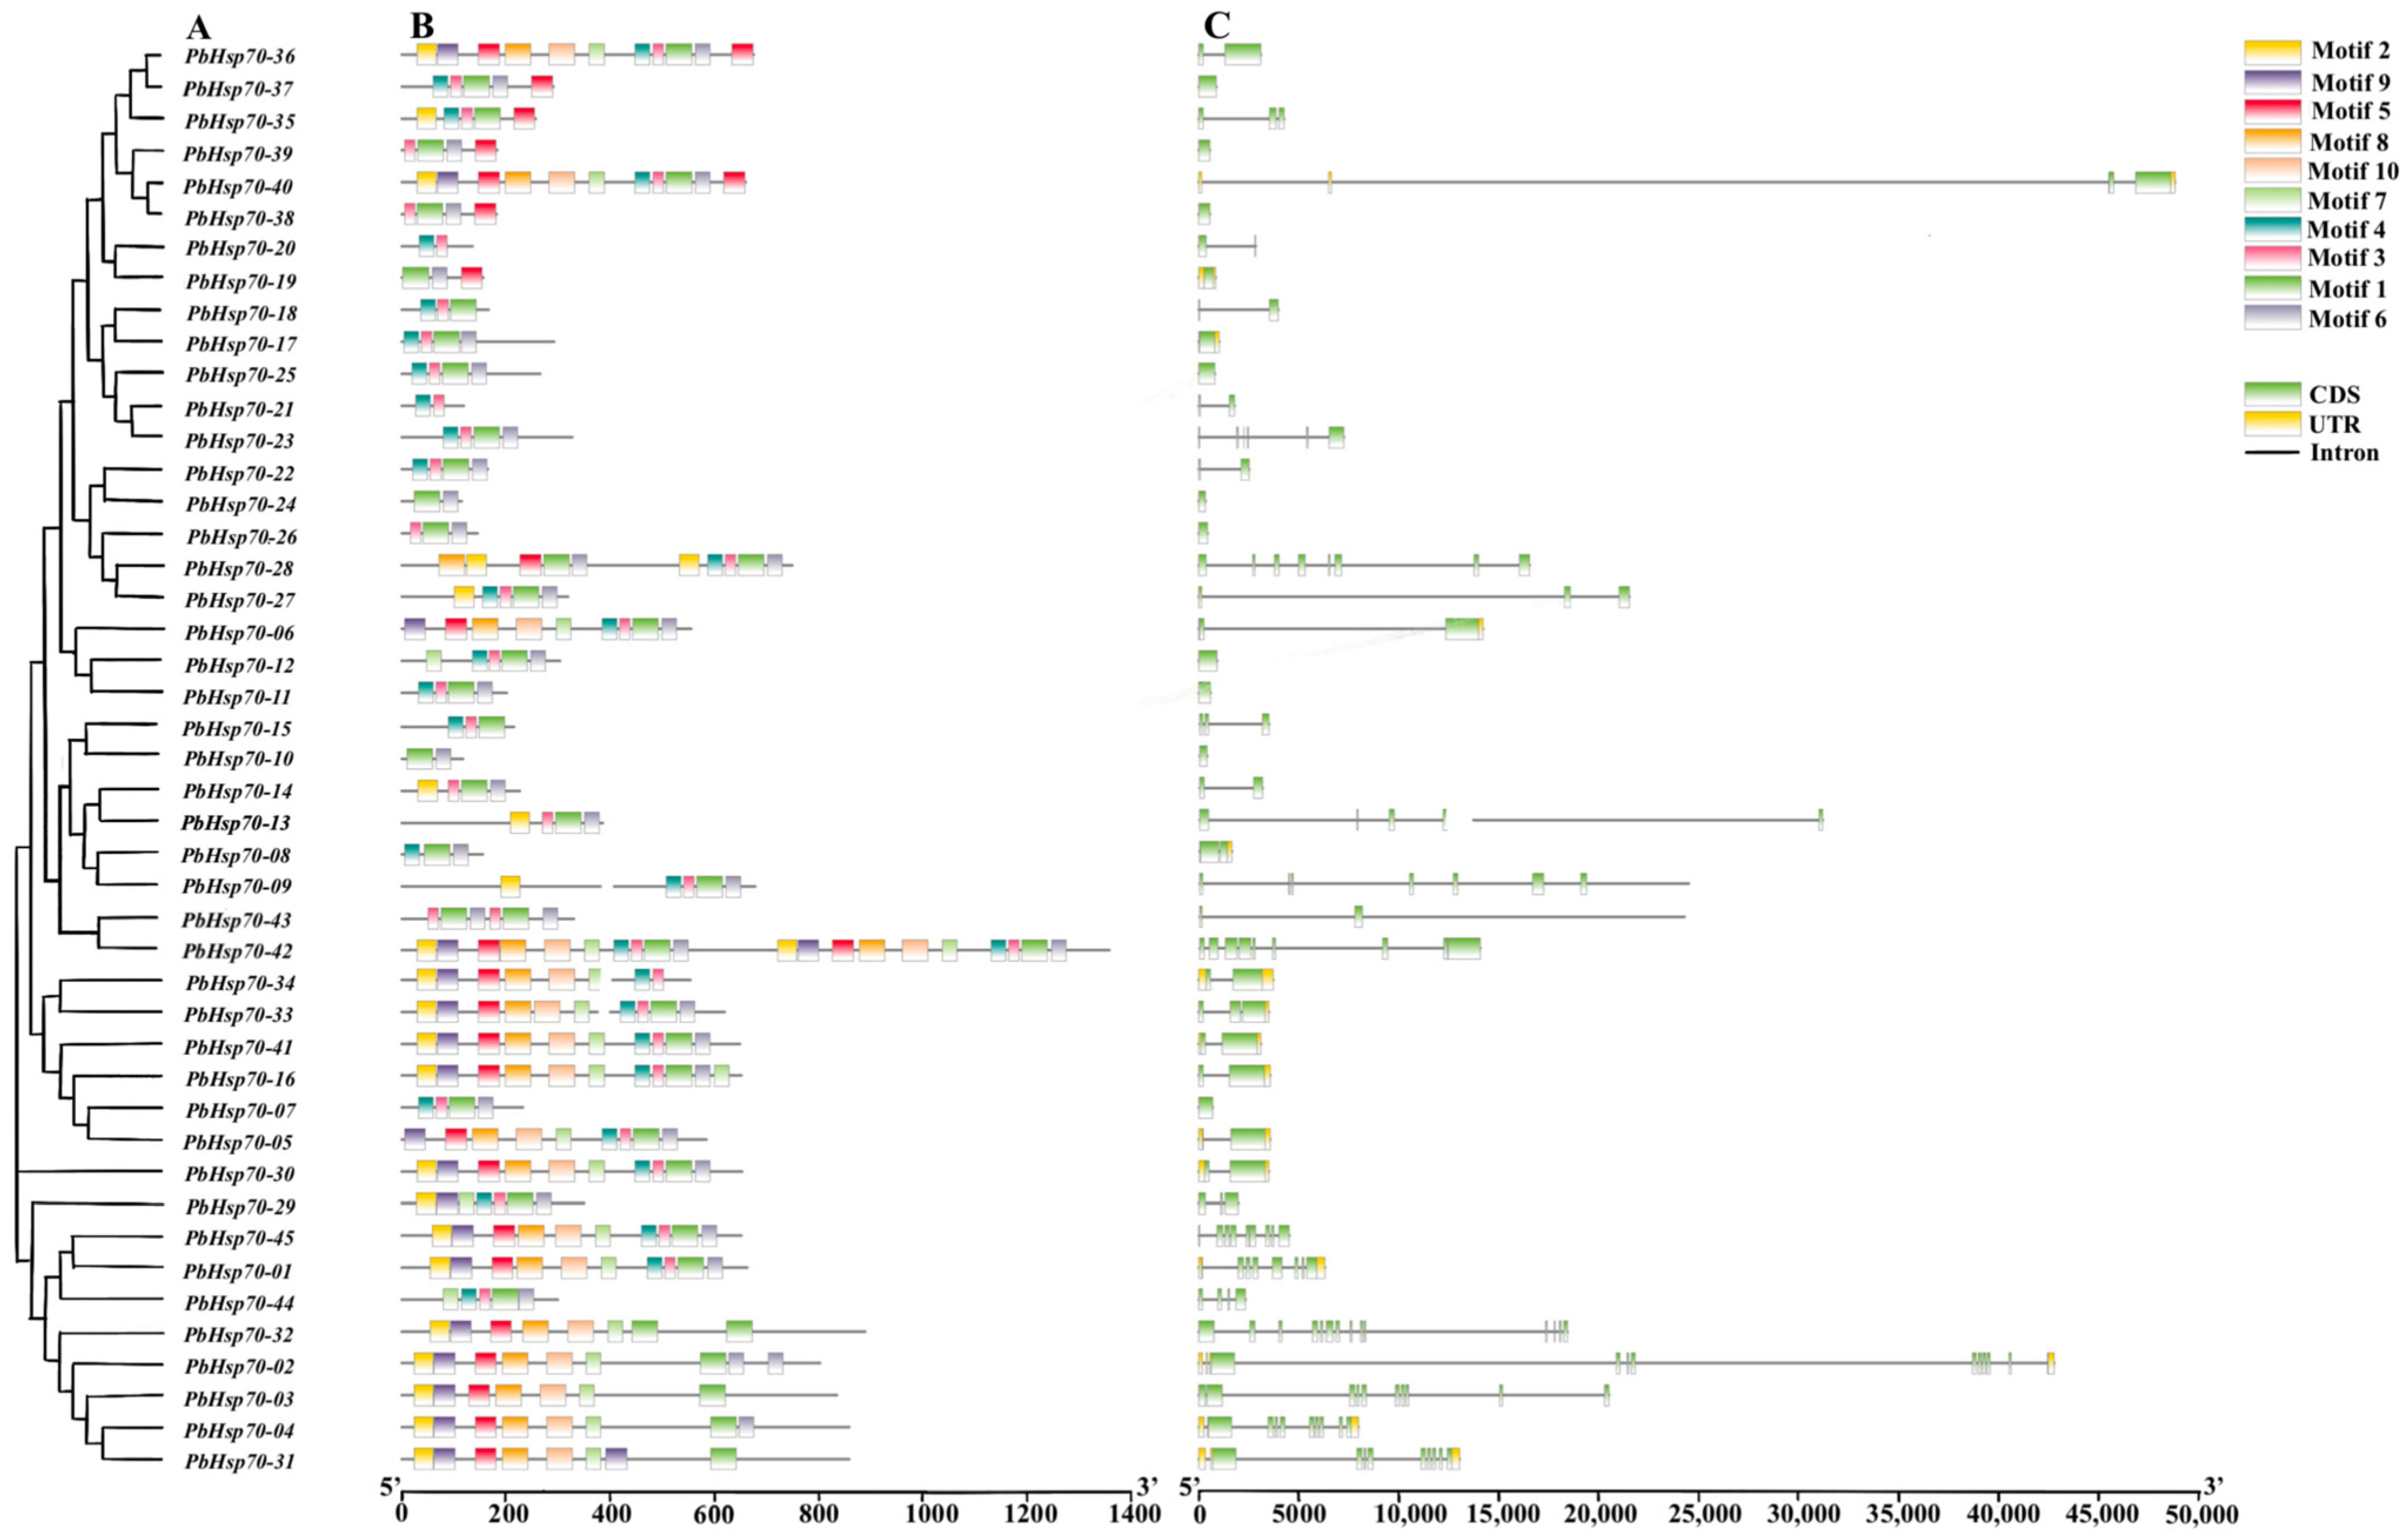
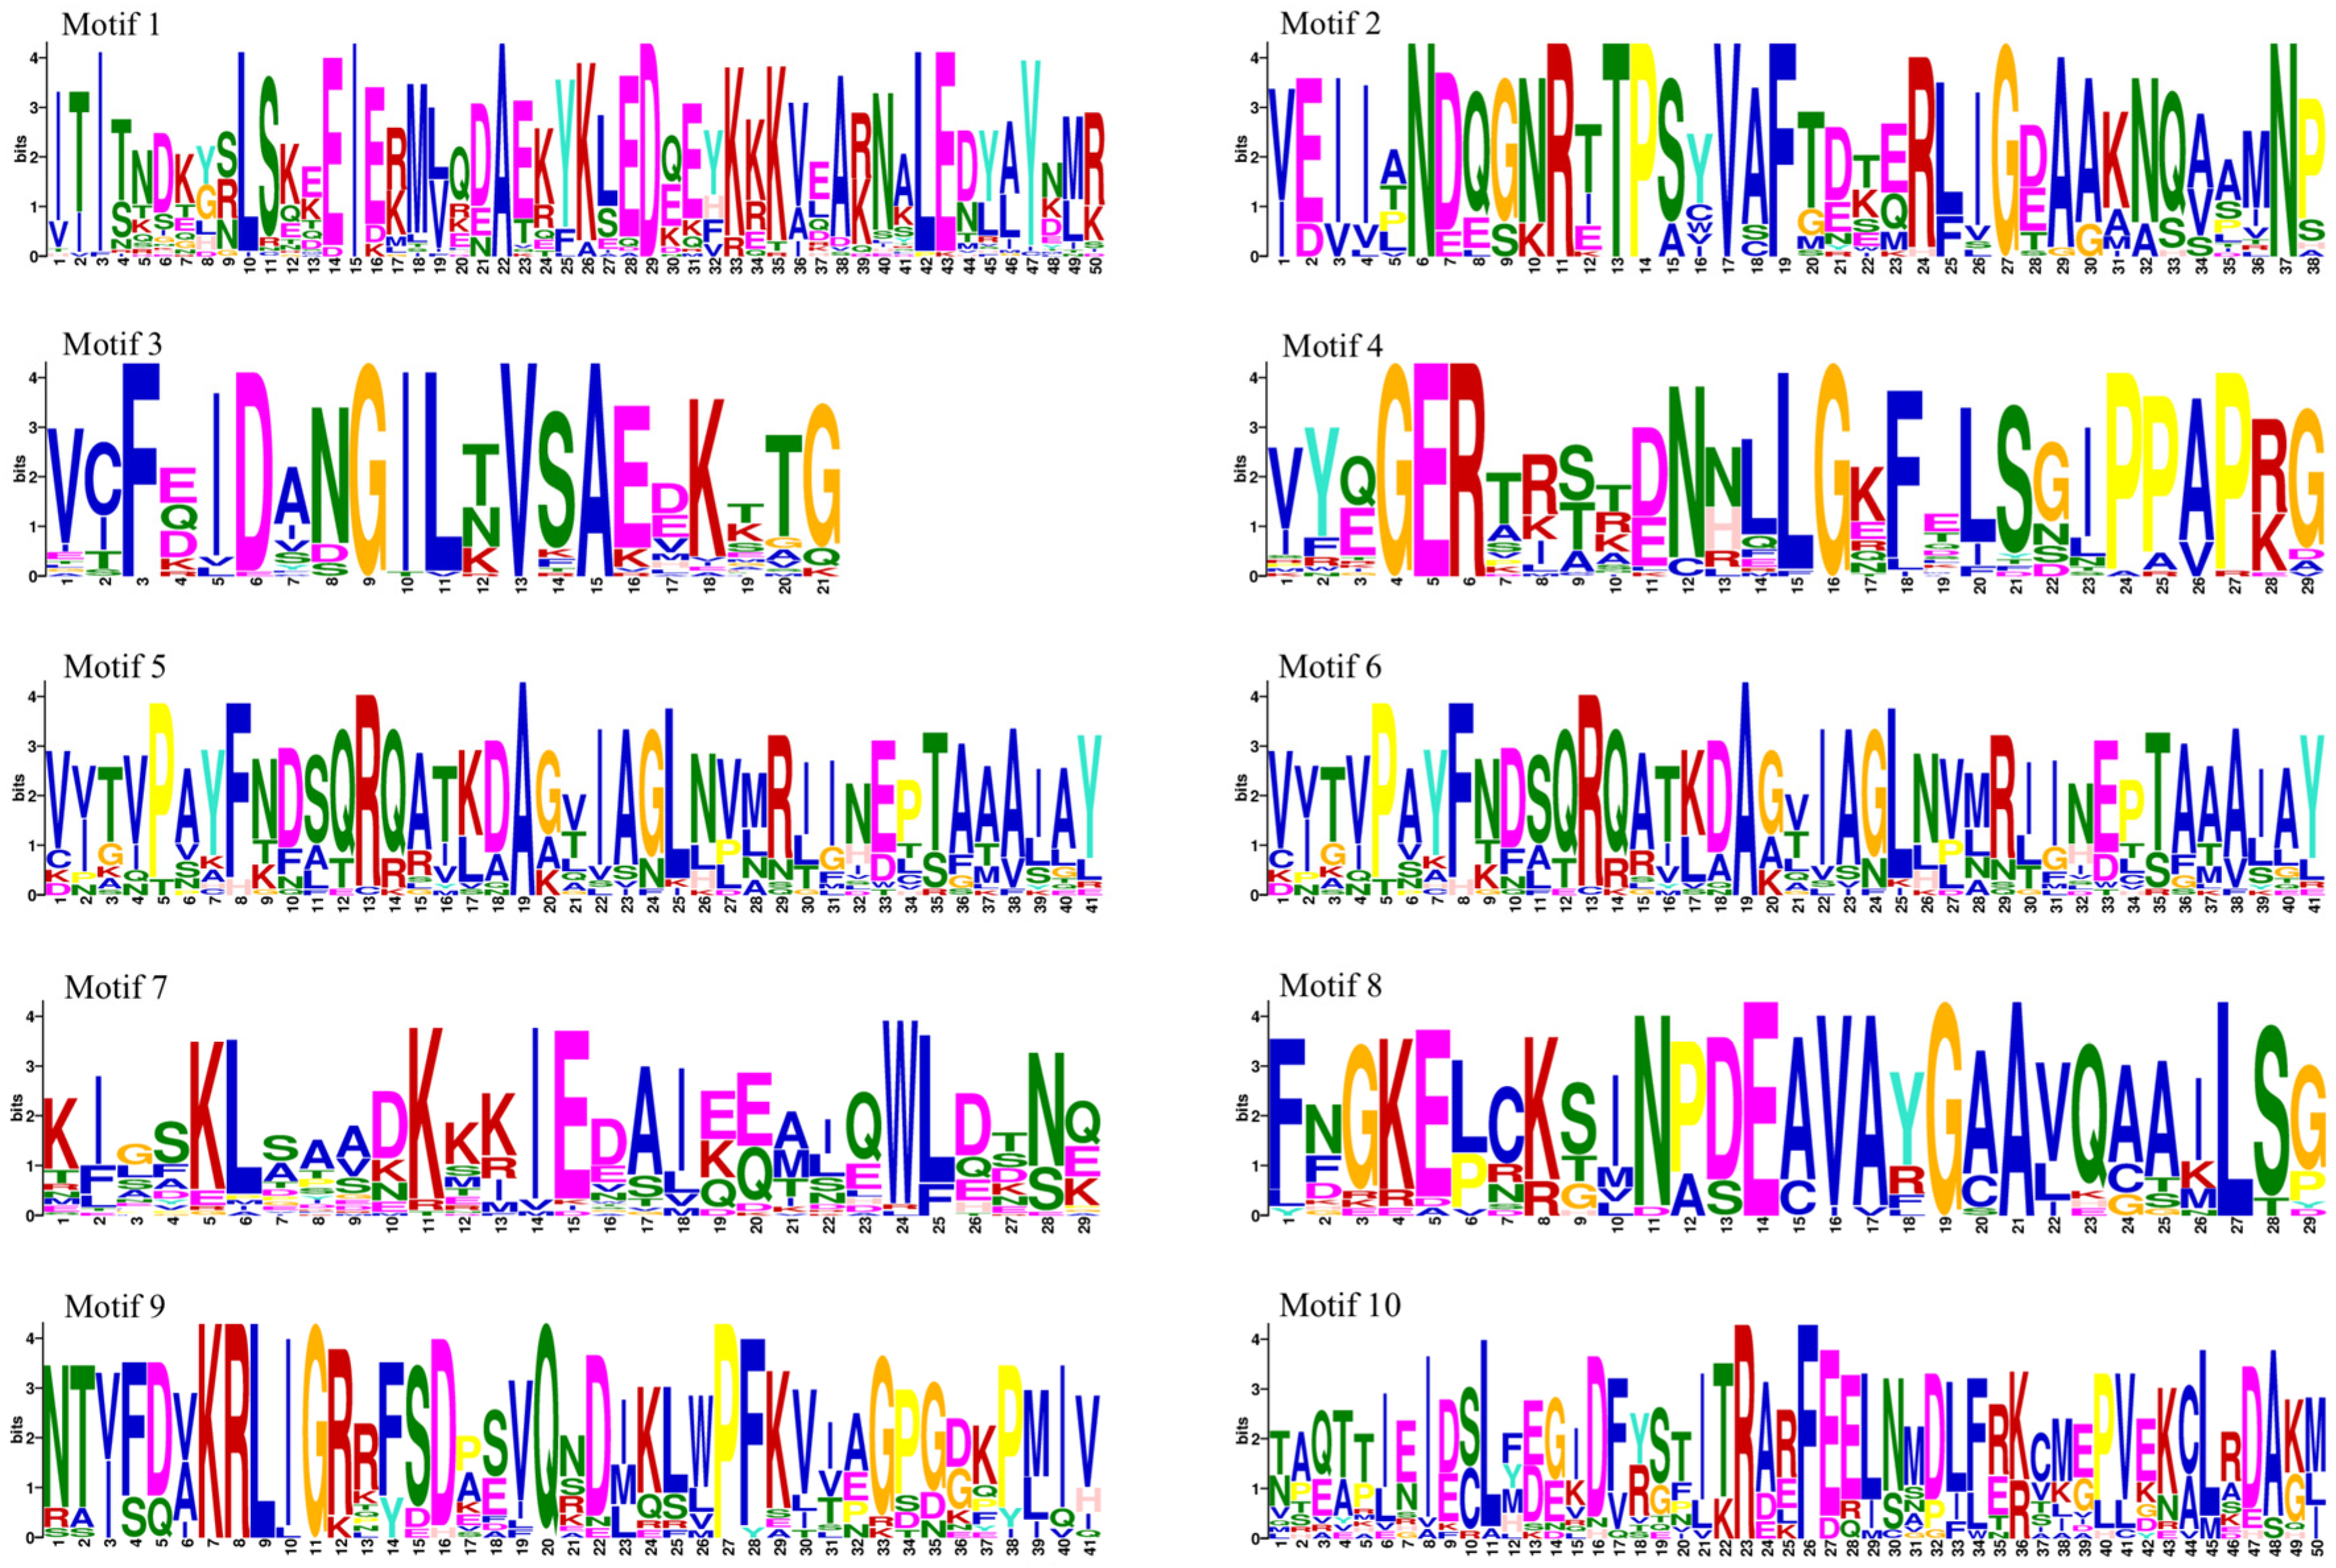
The results indicated that most of the conserved motifs were found in the C-terminal structural domain, which participates in protein biosynthesis and functional regulation, and the sequence of the designated motifs started from 2, followed by 9, 5, 8, 10, 7, 4, 3, 1 and, finally, 6 (Figure 2B). Motif 7 was present in all Hsp70 proteins within the structural domain; thus, it may be the active region responsible for the gene’s function (Figure 2C). The conserved motifs within the same subfamily were similar, and motifs 3 and 4 were not present in subfamily IV. In addition, a complex analysis of the intron–exon structure of the Hsp70 genes was performed to aid in their characterization. Among the 45 Hsp70 genes, most of them contained introns (77.8%), with some having between one and five (Figure 2C). A total of 13.3% of Hsp70 genes had two exons and one intron. A survey of the 45 Hsp70 proteins revealed that the number of introns varied between 0 and 13, while the number of exons ranged from 1 to 14. Figure 3 shows the details of sequences 1–10, respectively.

3.4. Chromosomal Localization, Collinearity Analysis, and Promoter Analysis of Hsp70s

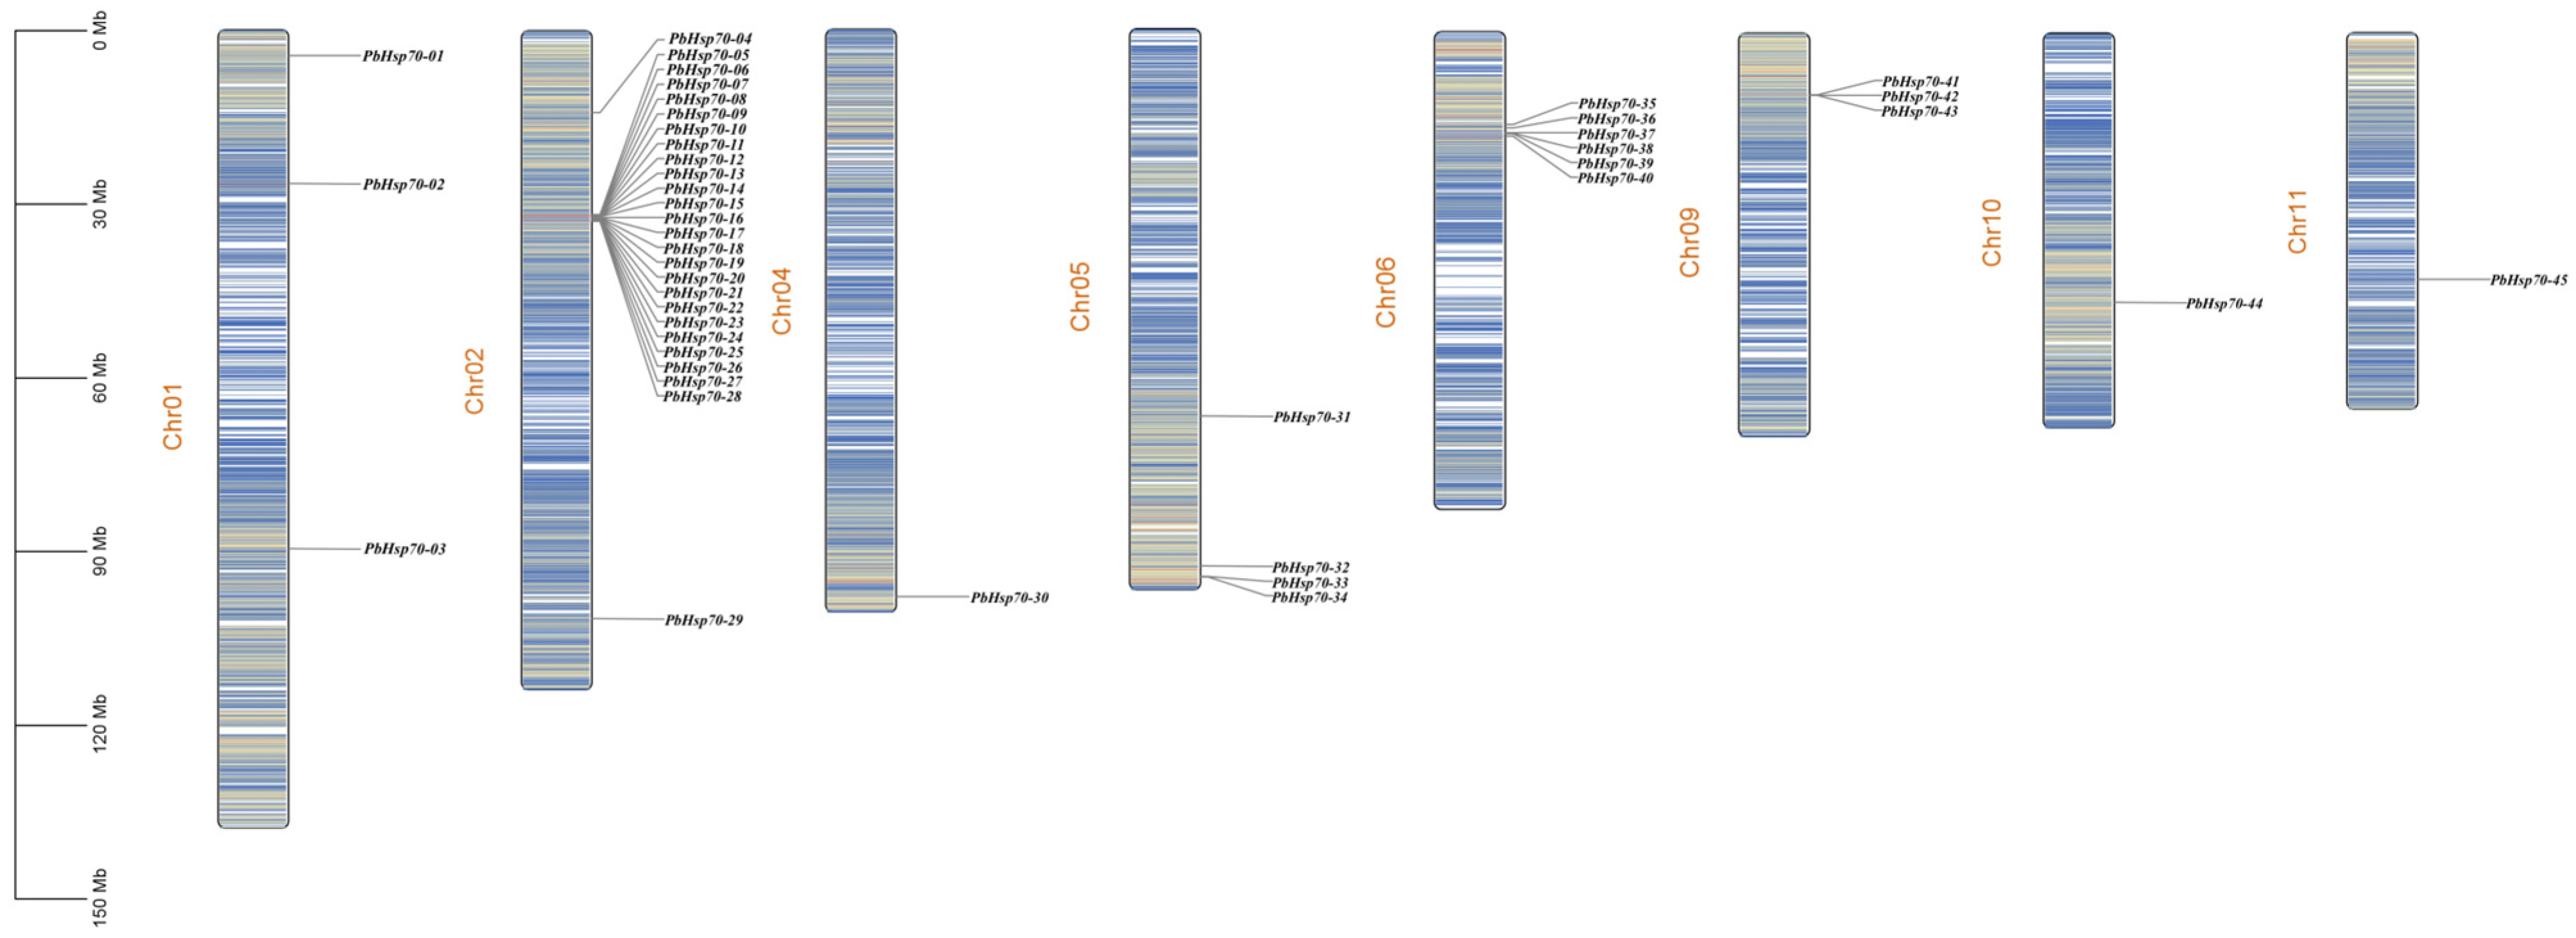
The chromosomal localization analysis found that the 45 Hsp70 genes were located on eight chromosomes, and the largest number of Hsp70 genes was distributed on chromosome 2, with a total of 25 genes, followed by a total of six in Chr06 (Figure 4). Moreover, 12 pairs of tandem duplicated genes were identified in the chromosomes. These were close to each other in the chromosomes and formed clusters on the phylogenetic tree, suggesting that they share similar functions.
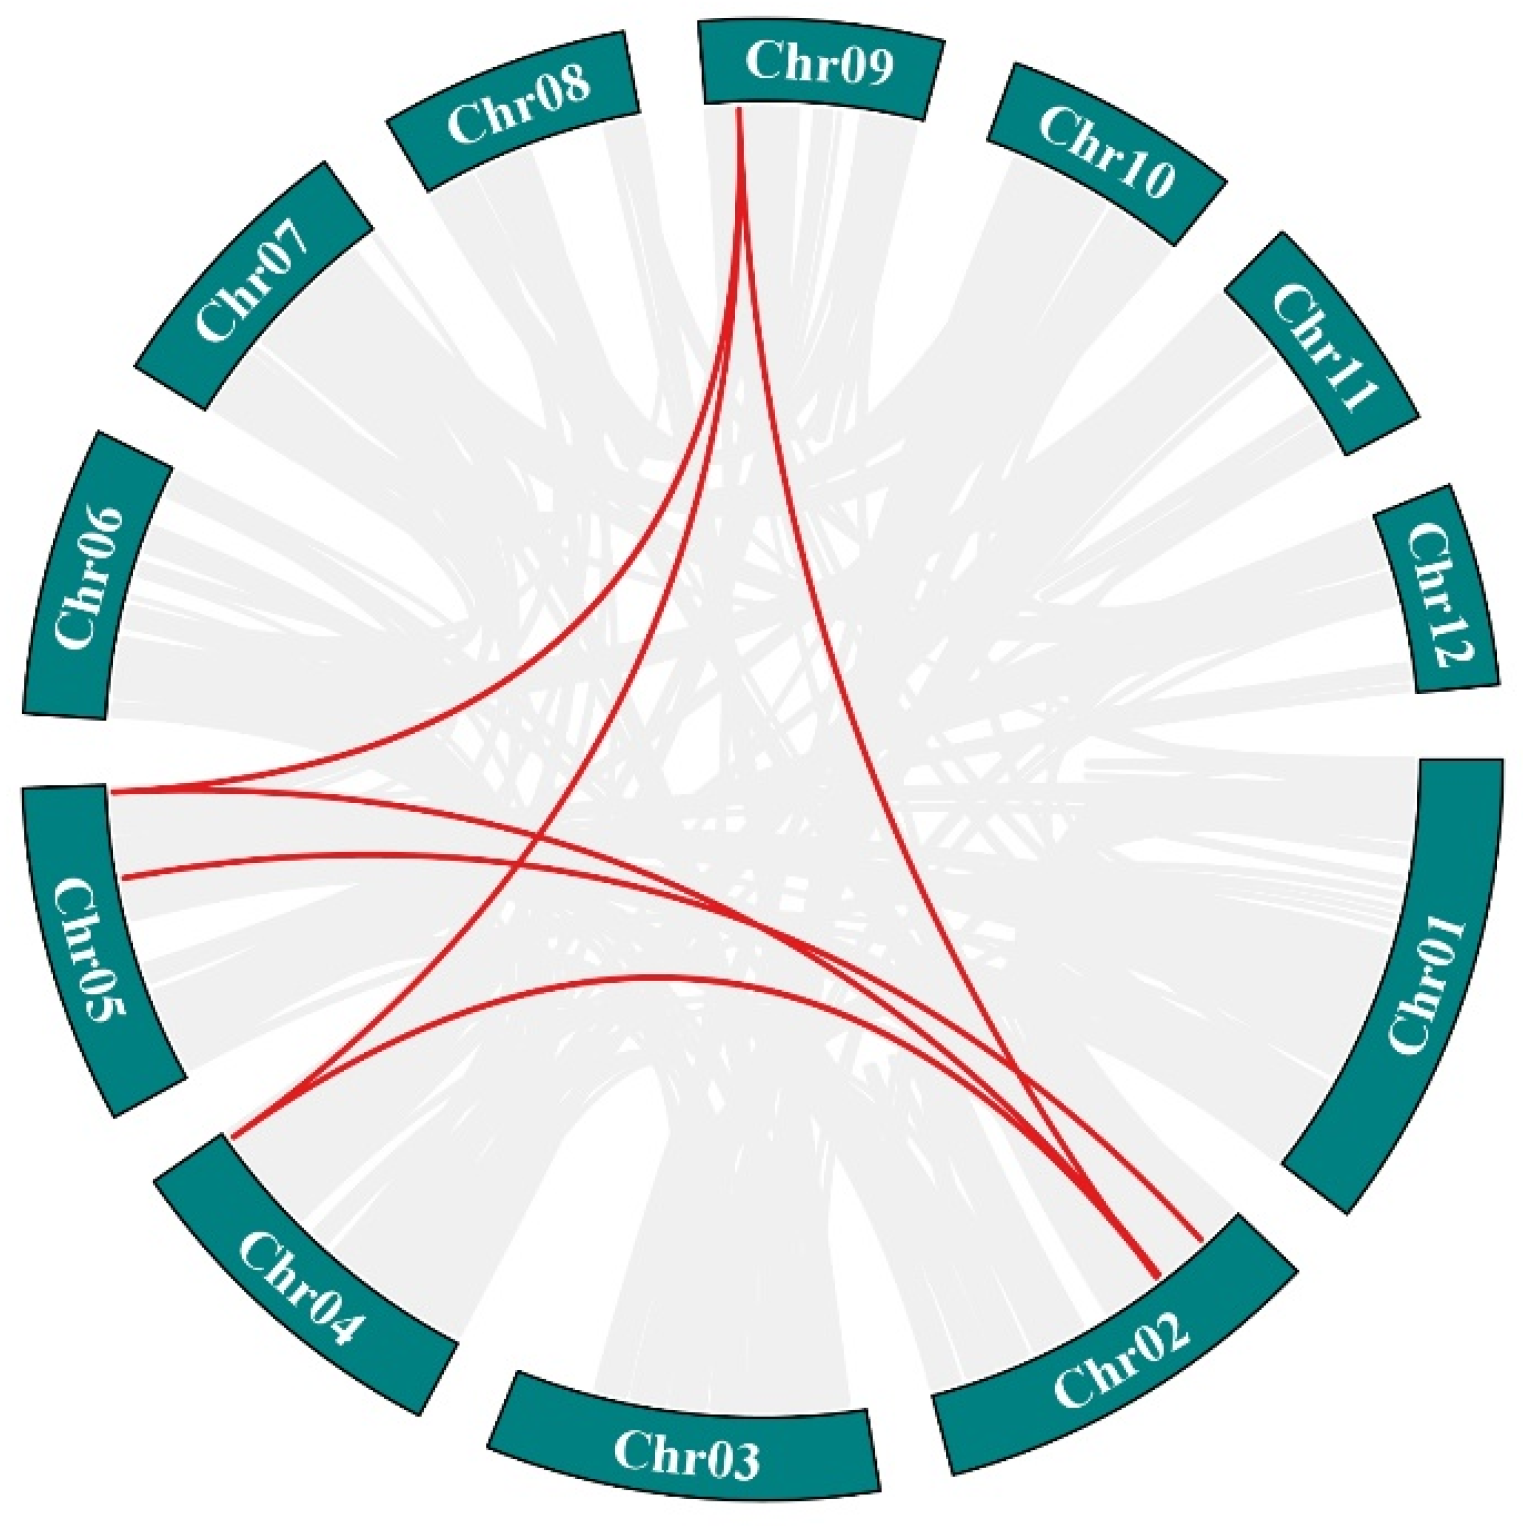
The intraspecific collinearity of the Hsp70 gene sequence in P. bournei was studied, and it was found that there were six pairs of fragments repeat genes in the genome (Figure 5). The collinearity analysis of the Hsp70 genes from the three plants showed that a total of four AtHsp70s were colocalized with PbHsp70s, and a total of 11 PtHsp70s were colocalized with PbHsp70s. The relationship between the Hsp70 genes and PtHsp70s was closer than that between the Hsp70 genes and AtHsp70s in P. bournei (Figure 6).
Two-thousand base-pairs sequences upstream of the coding regions were extracted from the coding regions of all 45 Hsp70 genes to determine cis-acting regulatory elements (GRES) and to predicate a possible regulatory function of the Hsp70 genes in P. bournei (Figure 7). The Hsp70 gene family contains multiple types of cis-acting elements that have been implicated in plant hormone responses, growth and development, and abiotic stress responses. Further analysis showed that hormone responsiveness accounted for 34.0%, growth and development accounted for 41.7%, and stress responsiveness accounted for 24.3% of the PbHsp70 genes. Thus, the cis-responsive elements related to plant growth and development appeared with the highest frequency. This indicates that the Hsp70 genes play a significant role in plant growth and development under stress conditions. ln addition, the MeJA (methyl jasmonate)-signaling pathway’s responsiveness accounted for 15.0%. MeJA components can have significant effects on plants under heat stress through a variety of pathways [46]. For example, MeJA signaling can activate the expression of genes related to heat-stimulated proteins (Hsps); moreover, by affecting the related protein modification process or interacting with other signaling pathways, MeJA signaling enhances the function of Hsps under heat stress conditions and maintains intracellular protein homeostasis. Thus, it alleviates the cellular damage caused by high temperatures [47]. High-temperature stress leads to the accumulation of reactive oxygen species (ROS) in plants, which can cause oxidative damage to plant cells. The MeJA signaling pathway can induce the expression of various antioxidant enzyme genes, which scavenge excessive ROS in the organism and maintain intracellular redox homeostasis. ABA (Abscisic Acid) is an important adversity hormone that also plays a significant role in the response to heat stress in plants. There is a synergistic effect between the MeJA- and ABA-signaling pathways, which jointly regulate the response to heat stress in plants [48].

3.5. Expression Pattern of Hsp70s in P. bournei

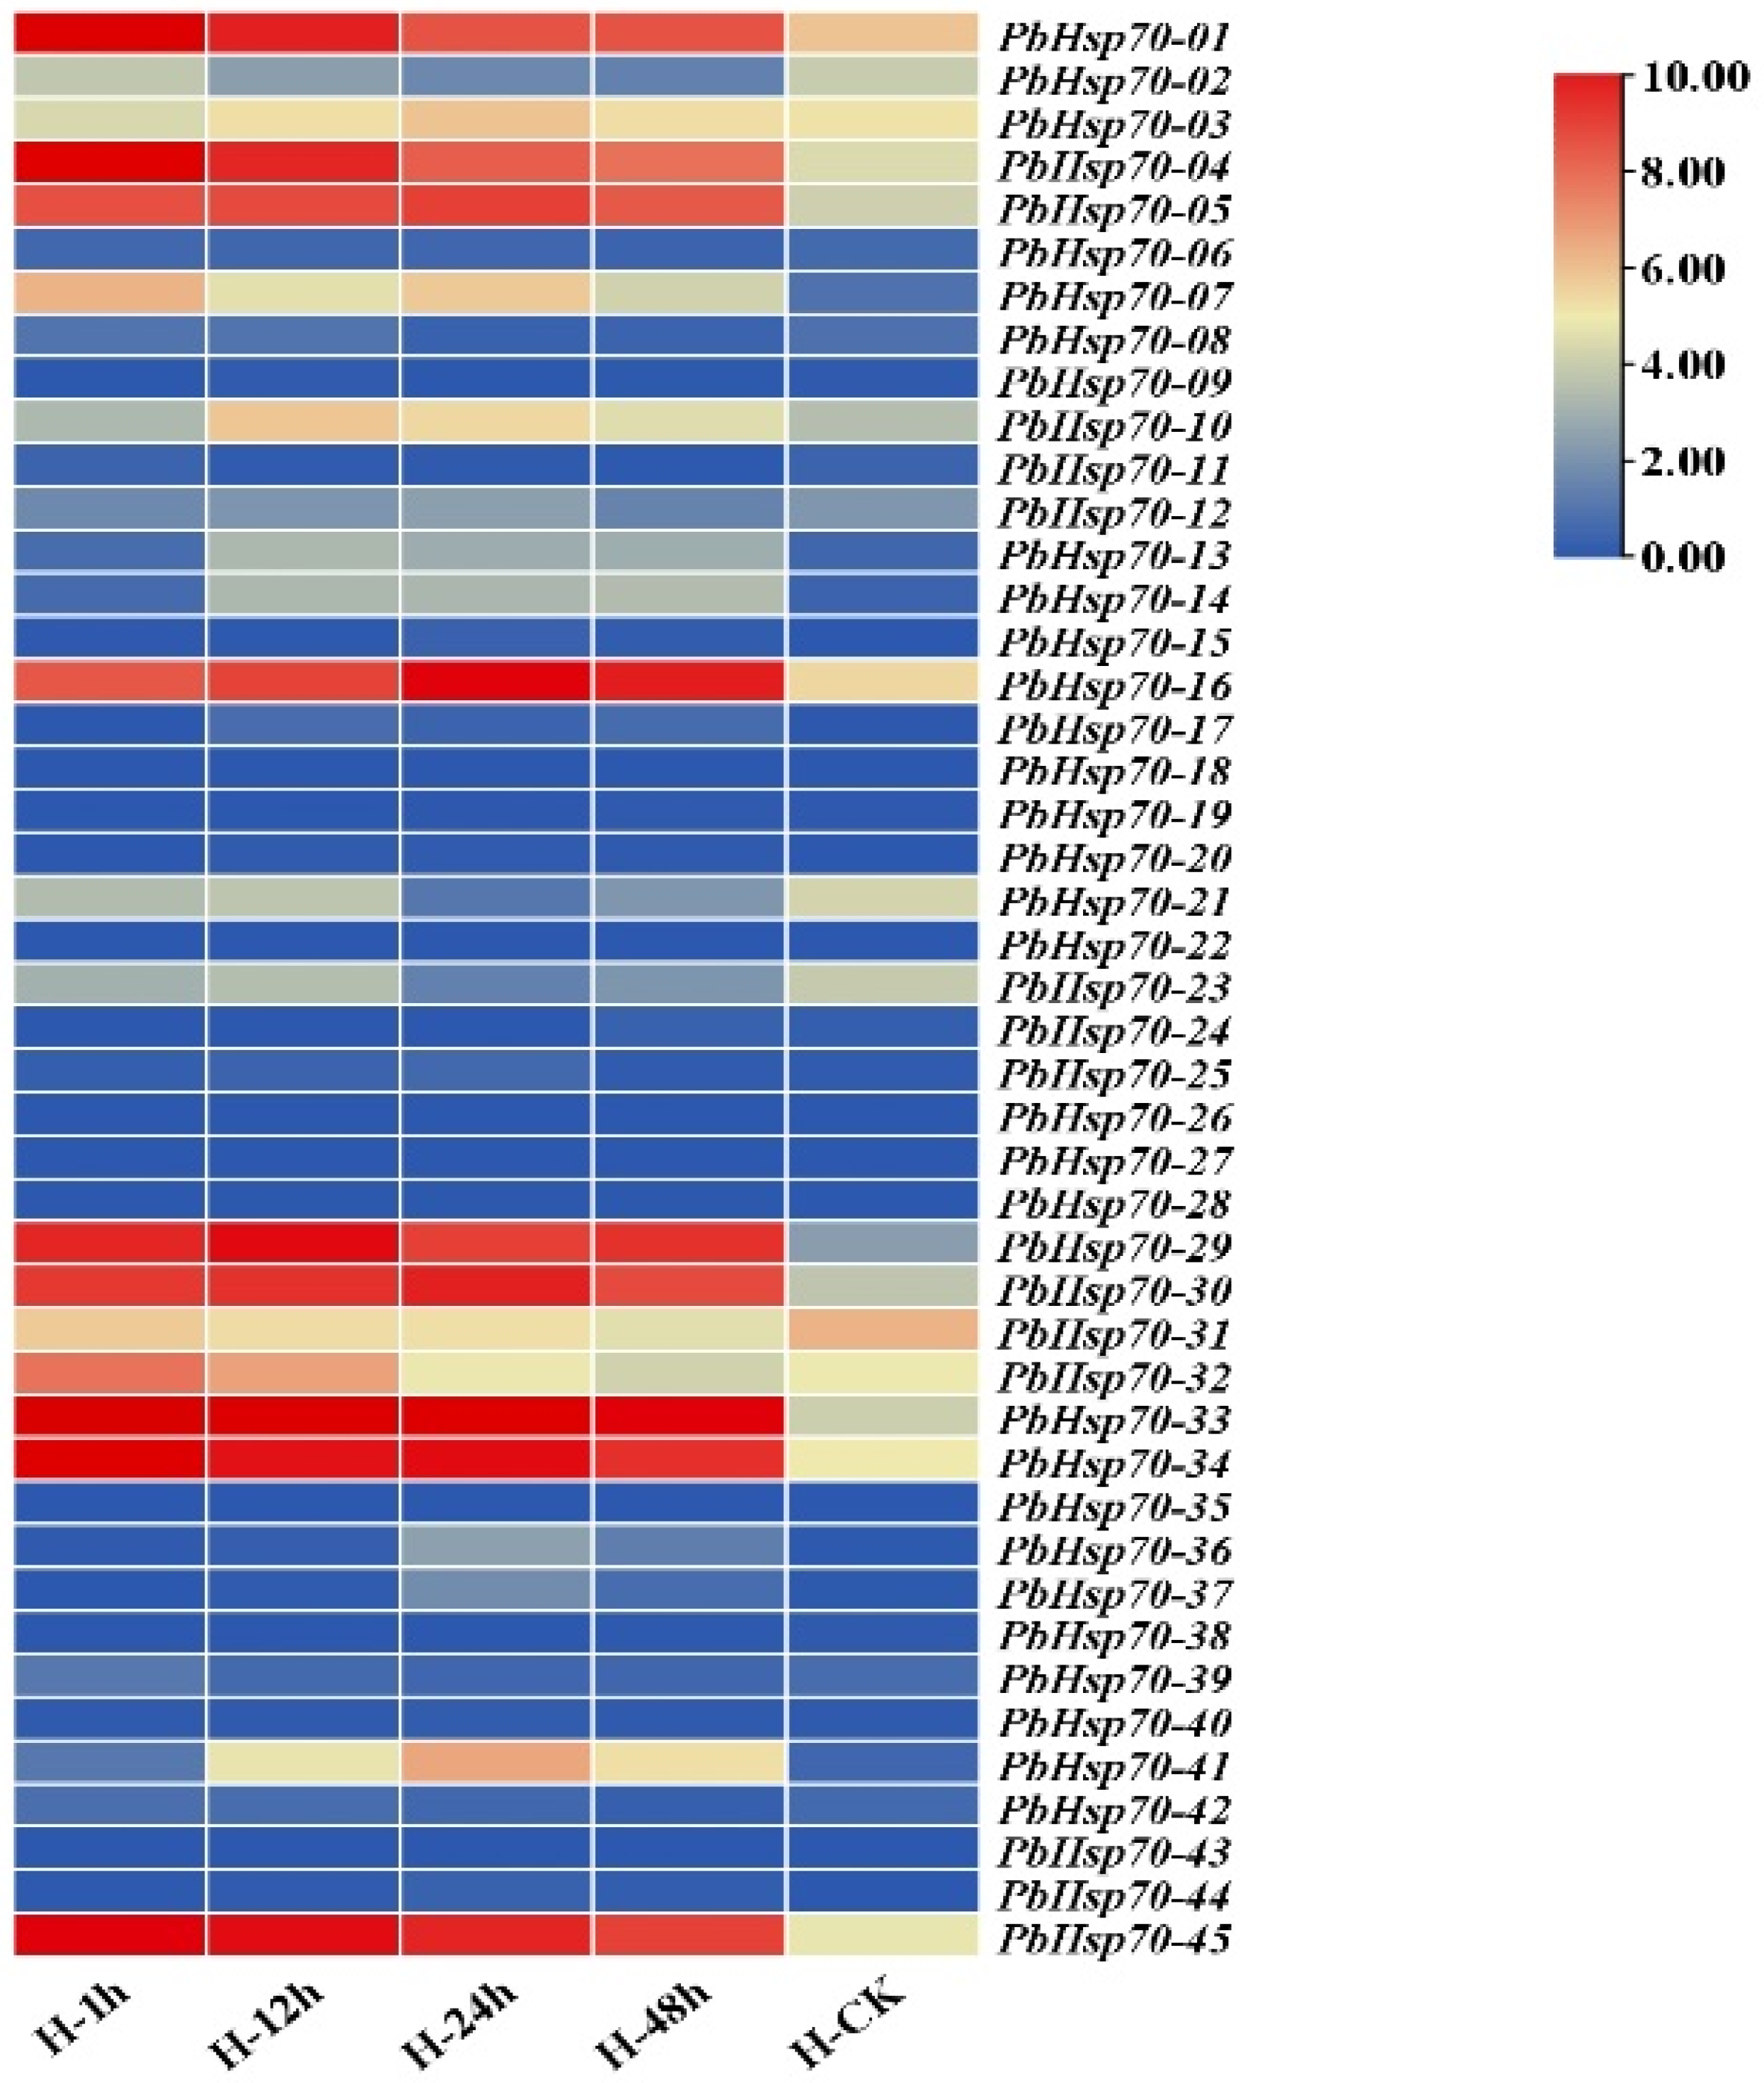
A heatmap of the PbHsp70 family was constructed based on the FPKM values (Figure 8). It showed that the PbHsp70 family was highly expressed at 12 h. In addition, we found that genes belonging to the same subfamily had resemblance in their expression patterns, with identical expression patterns observed in all three genes of the second subfamily and functionally conserved patterns in the genes of the third subfamily. Over time, the expression of PbHsp70-45 continued to increase. According to the transcriptome data, genes such as PbHsp70-33 and PbHsp70-45 were consistently highly expressed in several samples. Meanwhile, genes such as PbHsp70-21 and PbHsp70-23 were highly expressed in the control (H-CK) but significantly downregulated in other samples. These are stress-specific genes, and their expression is precisely regulated by the temperature or other environmental signals. Genes such as PbHsp70-09 and PbHsp70-24 were not expressed in most samples. Table S2 shows the FPKM values of PbHsp70 in the leaves.

3.6. RT-qPCR Analysis of Hsp70s in P. bournei

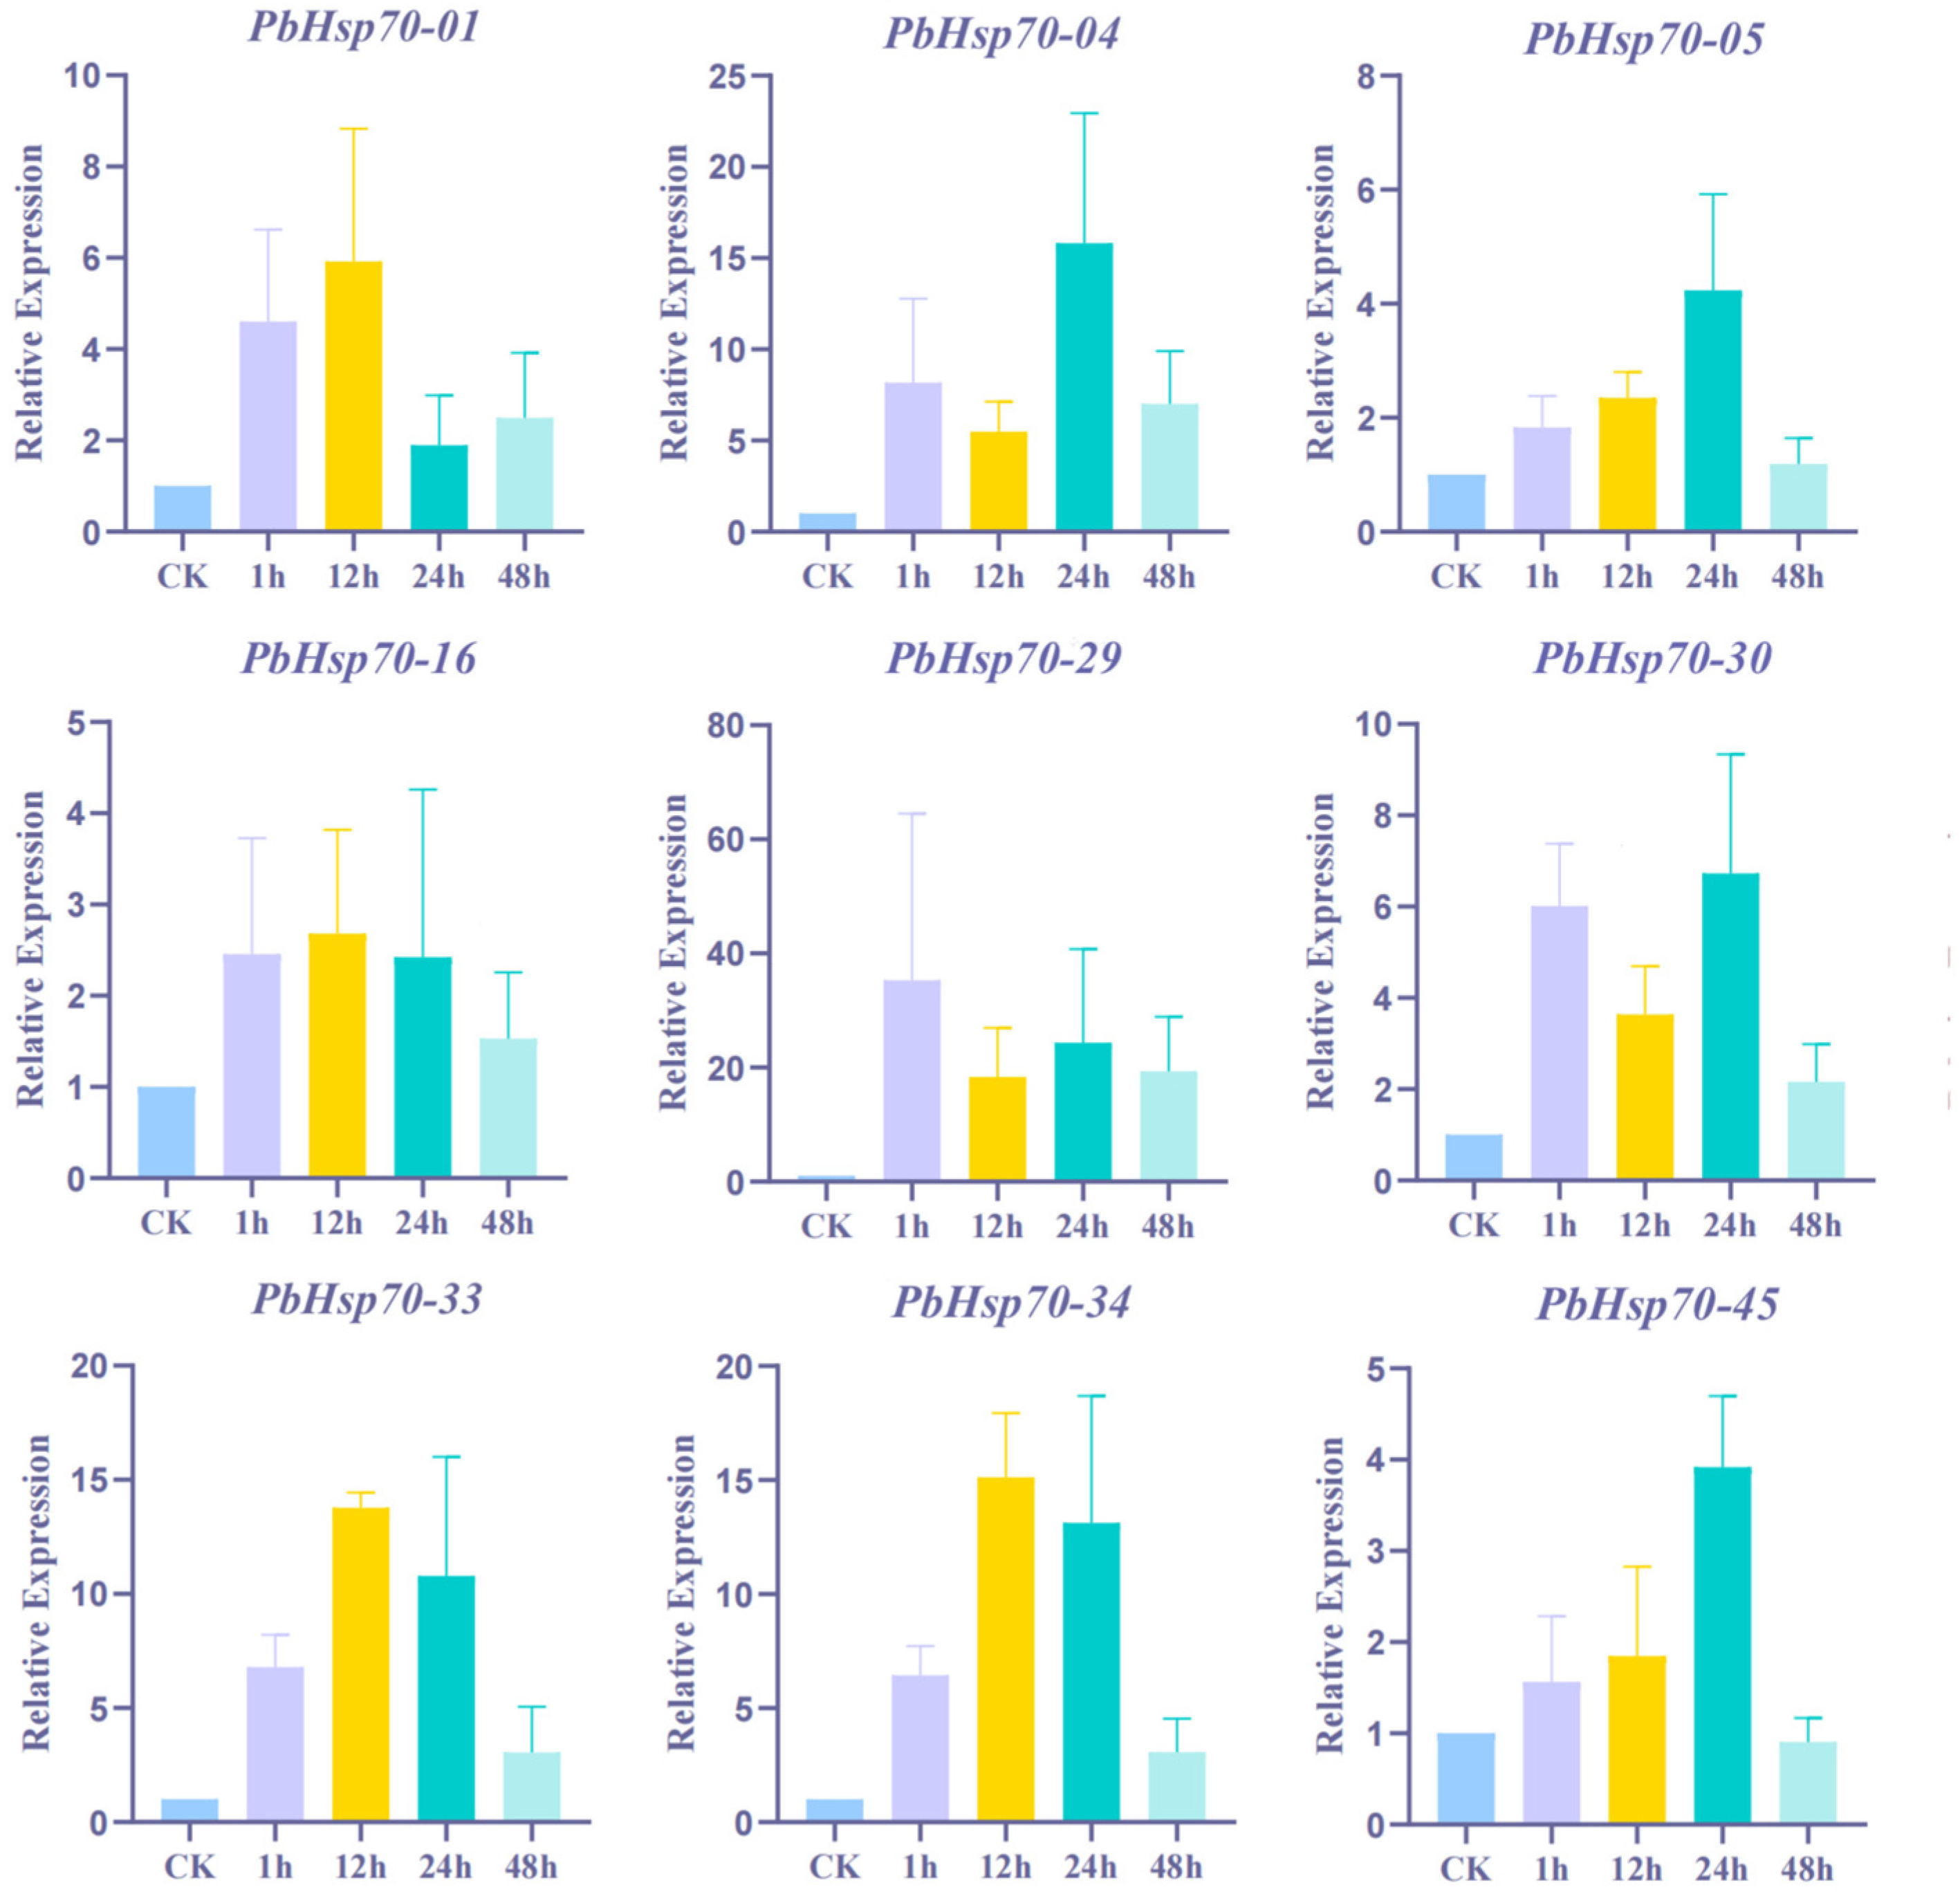
To verify the reliability of the transcriptome data and further investigate the expression patterns of the Hsp70 genes under heat stress, we selected nine Hsp70 genes with high expression in P. bournei leaves for RT-qPCR analysis. The expression profiles of the nine different genes revealed different degrees of responsiveness to high temperatures (Figure 9). The expression of most genes started to rise after one hour of heat stress, peaked at 24 h and declined again at 48 h, which is consistent with the typical response pattern of heat stress proteins in plants. After undergoing a 24 h period of exposure to elevated temperatures, the samples known as PbHsp70-04, PbHsp70-05, PbHsp70-30, and PbHsp70-45 demonstrated peak levels of expression; then, their levels all decreased to different degrees within 24 h. PbHsp70-01, PbHsp70-16, PbHsp70-33, and PbHsp70-34 were significantly upregulated only in the middle of the pre-stress period, before the initiation of 12 h high-temperature stress. The level of PbHsp70-29, which peaked at 24 h, was significantly higher than those of the other genes, and it maintained a high level even at 48 h. However, the expression of PbHsp70-05 was significantly lower than that of the other members at all time points (Figure 9).

4. Discussion

In this study, 45 Hsp70 members were identified in P. bournei, which is a greater number than in A. thaliana and P. trichocarpa. This may be attributed to the fact that P. bournei belongs to the family Lauraceae, which has experienced two WGD events and a more complex evolutionary process, and also undergoing a species-specific genome-wide duplication event [49,50]. Gene duplication has significantly contributed to the evolutionary diversity and ecological adaptation of plants, driving phenotypic innovation and functional differentiation [51]. Chromosome segmental duplication and localized tandem duplication constitute two major modes of gene family expansion: the former generates structural variation in chromosomes through non-homologous recombination, and the latter relies on the amplification of neighboring duplication units to form gene clusters [52]. These two replication strategies not only provide plants with the material basis for genetic innovation but also enhance the genome’s capacity to resist stress; this represents an essential force driving the evolution of species [53]. Regarding P. bournei, tandem repeat sequence amplification may significantly enhance the plant’s capacity to adapt to environmental fluctuations. It not only provides evolutionary flexibility for gene expression regulation but also serves as an important buffering mechanism to maintain the genetic stability of populations under the pressure of environmental selection [54]. Further studies are necessary to uncover the functions of these duplicated genes and their contributions to phenotypic adaptation in P. bournei.
The phylogenetic tree and multiple sequence alignment analysis showed that the Hsp70 gene family of P. bournei could be divided into four subfamilies, I, II, III, and IV, consistent with the classification of the Hsp70 genes in mosaic bamboo and Ziziphus jujuba [55]. The number of genes in subfamily I varies greatly from the number of other subfamilies. It has been shown that the distribution patterns of the motifs among subfamily members correlate with their functional annotation results [56]. An analysis of the conserved motifs present in the Hsp70 family proteins showed that, despite the significant differences in the conserved motifs between subfamilies, many similar conserved motifs occurred within the same subfamily. This suggests that, despite the variability within this gene family, a certain degree of conservation exists [57]. According to intron-related studies, intron-containing gene architectures exhibit significantly increased sequence lengths and more complex biological function profiles. Such gene architectures may have adaptive advantages during species evolution, especially regarding genome recombination events and the emergence of novel functional genes that show higher plasticity [58,59]. In this study, 77.8% of the genes contained introns, indicating that the Hsp70 gene family in P. bournei retained the typical eukaryotic gene structure during evolution. This intron-rich structure likely represents an evolutionary strategy aimed at balancing functional innovation with genomic stability.
Promoters are the core elements of gene expression regulation; thus, the systematic study of their transcriptional activation properties, epigenetic modification patterns, and environmental response mechanisms is of great theoretical value in revealing cell-specific expression patterns and understanding the mechanisms of gene–environment interactions during the formation of complex traits [60,61]. An array of functional cis-elements were identified in the Hsp70 promoter of P. bournei, including different categories related to plant growth and development and to light, phytohormones, and stress response factors [62]. Abscisic acid response elements (ABREs) receive abscisic acid molecular signals, thereby regulating the expression of related genes to enhance plants’ resistance to low temperatures, high temperatures, and other types of stress [63,64]. Methyl jasmonate (MeJA) plays an active role in mediating plants’ defense and regulatory responses to stress [65,66]. In this study, for the 45 Hsp70 genes, we identified several stress-related cis-acting elements in the upstream 2000 bp promoter region. These included abscisic acid response elements, methyl jasmonate response elements, and MYB-binding sites (MYB refers to Myeloblastosis; in plants, MYB transcription factors are proteins that bind to specific DNA sequences and regulate gene expression involved in a wide range of processes), suggesting that the PbHSP70 family plays an important role in the response to high-temperature stress. It has likely improved the adaptability of P. bournei to abiotic stress and significantly contributed to the adaptability and survival of this species in subtropical mountainous climatic zones [67,68].
There is evidence that the Hsp70 gene family serves critical functions in mediating plants’ thermotolerance mechanisms. For example, in Tausch’s goat grass (Aegilops tauschii), under high-temperature stress, members of the HSP70 gene family enabled enhanced heat tolerance by regulating the antioxidant enzyme system (e.g., Ascorbate Peroxidase (APX) and Superoxide Dismutase (SODase) activity) and chlorophyll synthesis and metabolism, maintaining cell membrane stability and reducing reactive oxygen species accumulation [69]. Meanwhile, in Beta vulgaris, the BvHSP70 gene family was significantly upregulated under high-temperature stress, and its promoter region was enriched with cis-acting elements related to hormone responses, such as abscisic acid and methyl jasmonate response elements, suggesting that this gene family is involved in stress adaptation through hormone-signaling pathways [70]. In this study, we observed the differential response characteristics of the Hsp70 gene family in P. bournei under heat stress. The expression levels of most of the PbHsp70 family were significantly increased, suggesting that the PbHsp70 genes are responsive to high-temperature stress, and that high temperatures induced the expression of some of them, while repressing their expression. According to the expression profile of the PbHsp70 genes, genes with high expression may be responsible for basal stress tolerance and serve as constitutive stress tolerance genes. Some genes were not expressed in all samples; these may be pseudogenes or redundant backup genes that were retained in evolution but are activated only under extreme conditions [71]. According to the transcriptome data, PbHsp70-29 may be a key gene in the response to high-temperature stress in P. bournei. This gene is responsible for coordinating the co-expression of other stress-resistant genes. Its high expression may be related to the substrate-binding ability or stability [72]. Meanwhile, the expression level of PbHsp70-05 was significantly lower than that of other members at all time points. This may be a redundant gene or a functional differentiation gene that plays a role in specific stress types but is not activated under high-temperature stress. Further analysis revealed that most of the genes that were upregulated under high-temperature stress belonged to subfamily II rather than subfamily III. The members of this subfamily maintained high expression after sustained high-temperature exposure, suggesting that they may be involved in the regulation of cellular thermal homeostasis through the mechanisms of conformational stability and the maintenance of ATPase activity. This indicates that these two families have strong potential for heat tolerance [73]. In conclusion, this study highlights the differential expression and potential roles of the PbHsp70 gene family in response to high-temperature stress in P. bournei. The findings provide valuable insights into this family’s regulatory mechanisms and several key genes involved in heat tolerance. In future studies, we will clarify whether Hsp70 is a hub gene by studying the synergistic response pattern of the Hsp70 family under combined stress, which may contribute to breeding programs aimed at enhancing plants’ heat stress resistance.

5. Conclusions

In this research, the Hsp70 gene family of P. bournei was characterized. For the first time, a total of 45 PbHsp70 genes were identified and analyzed with respect to their physicochemical properties, conserved motifs, and exon–intron structures. These Hsp70 genes were found to be highly conserved. We also analyzed the chromosomal localization of P. bournei and performed an interspecific covariance analysis of its Hsp70 genes and those of A. thaliana and P. tremula, providing valuable biological information about the evolutionary relationships of P. bournei. The process of identifying cis-acting elements within the promoter region of the Hsp70 genes contributes to revealing the pathways involved in P. bournei’s response to abiotic stress. The expression of the Hsp70 genes was investigated at five high-temperature stages, and the expression patterns in the leaves were verified. It was found that eight Hsp70 genes (PbHsp70-01, PbHsp70-04, PbHsp70-05, PbHsp70-29, PbHsp70-30, PbHsp70-33, PbHsp70-34, and PbHsp70-45) have potential roles in the heat stress response. These observations not only deepen our knowledge of the functional roles of this gene family but also provide a theoretical basis for the study of stress tolerance in this plant species.

Supplementary Materials

The following supporting information can be downloaded at: https://www.mdpi.com/article/10.3390/biology14060602/s1, Table S1. qRT-PCR primers. Table S2. The FPKM values of PbHsp70 in the leaves.

Author Contributions

Y.L. finalized and integrated the opinions of other authors, Y.J. and Z.L. analyzed the data, Y.N., C.G., and X.H. provided the data, and S.C. (Shipin Chen) and S.C. (Shijiang Cao) conceived the study, coordinated with all co-authors, and supervised the entire project. All authors have read and agreed to the published version of the manuscript.

Funding

This work supported by the Forestry Science and Technology Projects in Fujian Province (ZMGG-0708); Forestry Peak Discipline Construction Project of Fujian Agriculture and Forestry University (72202200205); The 8th Project of Forest Seeding Breaking in Fujian Province ([2–22]357).

Institutional Review Board Statement

Not applicable.

Informed Consent Statement

Not applicable.

Data Availability Statement

The original data presented in the study are openly available in the. National Center for Biotechnology Information (NCBI, https://www.ncbi.nlm.nih.gov/, accessed on 18 January 2025) genome database.

Conflicts of Interest

The authors declare no conflicts of interest.

References

  1. Guo, M.; Liu, J.H.; Ma, X.; Zhai, Y.F.; Gong, Z.H.; Lu, M.H. Genome-wide analysis of the Hsp70 family genes in pepper (Capsicum annuum L.) and functional identification of CaHsp70-2 involvement in heat stress. Plant Sci. 2016, 252, 246–256. [Google Scholar] [CrossRef] [PubMed]
  2. Chinnusamy, V.; Zhu, J.; Zhu, J.K. Cold stress regulation of gene expression in plants. Trends Plant Sci. 2007, 12, 444–451. [Google Scholar] [CrossRef] [PubMed]
  3. Kotak, S.; Larkindale, J.; Lee, U.; von Koskull-Döring, P.; Vierling, E.; Scharf, K.D. Complexity of the heat stress response in plants. Curr. Opin. Plant Biol. 2007, 10, 310–316. [Google Scholar] [CrossRef] [PubMed]
  4. Maimbo, M.; Ohnishi, K.; Hikichi, Y.; Yoshioka, H.; Kiba, A. Induction of a small heat shock protein and its functional roles in Nicotiana plants in the defense response against Ralstonia solanacearum. Plant Physiol. 2007, 145, 1588–1599. [Google Scholar] [CrossRef]
  5. Miemyk, J. The 70 kDa stress-related proteins as molecular chaperones. Trends Plant Sci. 1997, 2, 180–187. [Google Scholar] [CrossRef]
  6. Burdon, R.H. The heat shock proteins. Endeavour 1988, 12, 133–138. [Google Scholar] [CrossRef]
  7. Radons, J. The human HSP70 family of chaperones: Where do we stand? Cell Stress Chaperones 2016, 21, 379–404. [Google Scholar] [CrossRef]
  8. Seguí-Simarro, J.M.; Testillano, P.S.; Risueño, M.C. Hsp70 and Hsp90 change their expression and subcellular localization after microspore embryogenesis induction in Brassica napus L. J. Struct. Biol. 2003, 142, 379–391. [Google Scholar] [CrossRef]
  9. Sung, D.Y.; Vierling, E.; Guy, C.L. Comprehensive expression profile analysis of the Arabidopsis Hsp70 gene family. Plant Physiol. 2001, 126, 789–800. [Google Scholar] [CrossRef]
  10. Hartl, F.U. Molecular chaperones in cellular protein folding. Nature 1996, 381, 571–579. [Google Scholar] [CrossRef]
  11. Sun, X.T.; Li, B.; Zhou, G.M.; Tang, W.Q.; Bai, J.; Sun, D.Y.; Zhou, R.G. Binding of the maize cytosolic Hsp70 to calmodulin, and identification of calmodulin-binding site in Hsp70. Plant Cell Physiol. 2000, 41, 804–810. [Google Scholar] [CrossRef] [PubMed]
  12. Jung, K.H.; Gho, H.J.; Nguyen, M.X.; Kim, S.R.; An, G. Genome-wide expression analysis of HSP70 family genes in rice and identification of a cytosolic HSP70 gene highly induced under heat stress. Funct. Integr. Genom. 2013, 13, 391–402. [Google Scholar] [CrossRef] [PubMed]
  13. Jungkunz, I.; Link, K.; Vogel, F.; Voll, L.M.; Sonnewald, S.; Sonnewald, U. AtHsp70-15-deficient Arabidopsis plants are characterized by reduced growth, a constitutive cytosolic protein response and enhanced resistance to TuMV. Plant J. 2011, 66, 983–995. [Google Scholar] [CrossRef]
  14. Su, P.-H.; Li, H.-M. Arabidopsis stromal 70-kD heat shock proteins are essential for plant development and important for thermotolerance of germinating seeds. Plant Physiol. 2008, 146, 1231–1241. [Google Scholar] [CrossRef]
  15. Leng, L.; Liang, Q.; Jiang, J.; Zhang, C.; Hao, Y.; Wang, X.; Su, W. A subclass of HSP70s regulate development and abiotic stress responses in Arabidopsis thaliana. J. Plant Res. 2017, 130, 349–363. [Google Scholar] [CrossRef] [PubMed]
  16. Marshall, J.S.; DeRocher, A.E.; Keegstra, K.; Vierling, E. Identification of heat shock protein hsp70 homologues in chloroplasts. Proc. Natl. Acad. Sci. USA 1990, 87, 374–378. [Google Scholar] [CrossRef]
  17. Ge, Y.J.; He, X.Y.; Wang, J.F.; Jiang, B.; Ye, R.H.; Lin, X.C. Physiological and biochemical responses of Phoebe bournei seedlings to water stress and recovery. Acta Physiol. Plant. 2014, 36, 1241–1250. [Google Scholar] [CrossRef]
  18. Li, X.; Liu, L.L.; Sun, S.X.; Li, Y.M.; Jia, L.; Ye, S.L.; Yu, Y.X.; Dossa, K.; Luan, Y.P. Leaf-transcriptome profiles of Phoebe bournei provide insights into temporal drought stress responses. Front. Plant Sci. 2022, 13, 1010314. [Google Scholar] [CrossRef]
  19. Wang, F.; Dong, Q.; Jiang, H.; Zhu, S.; Chen, B.; Xiang, Y. Genome-wide analysis of the heat shock transcription factors in Populus trichocarpa and Medicago truncatula. Mol. Biol. Rep. 2012, 39, 1877–1886. [Google Scholar] [CrossRef]
  20. Tang, X.L.; Jiang, J.; Jin, H.P.; Zhou, C.; Liu, G.Z.; Yang, H. Effects of shading on chlorophyll content and photosynthetic characteristics in leaves of Phoebe bournei. Yingyong Shengtai Xuebao 2019, 30, 2941–2948. [Google Scholar] [CrossRef]
  21. Han, X.; Zhang, J.; Han, S.; Chong, S.L.; Meng, G.; Song, M.; Wang, Y.; Zhou, S.; Liu, C.; Lou, L. Chromosome-Scale Genome Phoebe bournei reveals contrasting fates of terpene synthase (TPS)-a and TPS-b subfamilies. Plant Commun. 2022, 3, 100410. [Google Scholar] [CrossRef] [PubMed]
  22. Bukau, B.; Horwich, A.L. The Hsp70 and Hsp60 chaperone machines. Cell 1998, 92, 351–366. [Google Scholar] [CrossRef]
  23. He, X.; Zhao, X.W.; Zheng, Q.Y.; Zhang, M.M.; Huang, Y.; Liu, Z.J.; Lan, S.R. Whole-Genome Analysis of ZF-HD Genes Among Three Dendrobium Species and Expression Patterns in Dendrobium chrysotoxum. Horticulturae 2024, 10, 610. [Google Scholar] [CrossRef]
  24. Bennett, J.; Hondred, D.; Register, J.C. Keeping qRT-PCR rigorous and biologically relevant. Plant Cell Rep. 2015, 34, 1–3. [Google Scholar] [CrossRef] [PubMed]
  25. Chen, F.Z.; You, L.J.; Yang, F.; Wang, L.N.; Guo, X.Q.; Gao, F.; Hua, C.; Tan, C.; Fang, L.; Shan, R.Q.; et al. CNGBdb: China National GeneBank DataBase. Hereditas 2020, 42, 799–809. [Google Scholar] [CrossRef]
  26. Lamesch, P.; Berardini, T.Z.; Li, D.H.; Swarbreck, D.; Wilks, C.; Sasidharan, R.; Muller, R.; Dreher, K.; Alexander, D.L.; Garcia-Hernandez, M.; et al. The Arabidopsis Information Resource (TAIR): Improved gene annotation and new tools. Nucleic Acids Res. 2012, 40, D1202–D1210. [Google Scholar] [CrossRef]
  27. Goodstein, D.M.; Shu, S.Q.; Howson, R.; Neupane, R.; Hayes, R.D.; Fazo, J.; Mitros, T.; Dirks, W.; Hellsten, U.; Putnam, N.; et al. Phytozome: A comparative platform for green plant genomics. Nucleic Acids Res. 2012, 40, D1178–D1186. [Google Scholar] [CrossRef]
  28. Cox, E.; Tsuchiya, M.T.N.; Ciufo, S.; Torcivia, J.; Falk, R.; Anderson, W.R.; Holmes, J.B.; Hem, V.; Breen, L.; Davis, E.; et al. NCBI taxonomy: Enhanced access via NCBI datasets. Nucleic Acids Res. 2024, 53, D1711–D1715. [Google Scholar] [CrossRef] [PubMed]
  29. Finn, R.D.; Clements, J.; Arndt, W.; Miller, B.L.; Wheeler, T.J.; Schreiber, F.; Bateman, A.; Eddy, S.R. HMMER web server: 2015 update. Nucleic Acids Res. 2015, 43, W30–W38. [Google Scholar] [CrossRef]
  30. Artimo, P.; Jonnalagedda, M.; Arnold, K.; Baratin, D.; Csardi, G.; de Castro, E.; Duvaud, S.; Flegel, V.; Fortier, A.; Gasteiger, E.; et al. ExPASy: SIB bioinformatics resource portal. Nucleic Acids Res. 2012, 40, W597–W603. [Google Scholar] [CrossRef]
  31. Chasovnikova, L.V.; Matveeva, N.A.; Lavrent’ev, V.V. Relation between surface denaturation of immunoglobulin G in monolayers and the pH of the solution. Biofizika 1980, 25, 984–988. [Google Scholar]
  32. Alabbas, A.B. Integrativesubtractive proteomics, immunoinformatics, docking, and simulation approaches reveal candidate vaccine against Sin Nombre orthohantavirus. Front. Immunol. 2022, 13, 1022159. [Google Scholar] [CrossRef]
  33. Horton, P.; Park, K.J.; Obayashi, T.; Fujita, N.; Harada, H.; Adams-Collier, C.J.; Nakai, K. WoLF PSORT: Protein localization predictor. Nucleic Acids Res. 2007, 35, W585–W587. [Google Scholar] [CrossRef]
  34. Bacon, D.J.; Anderson, W.F. Multiple sequence alignment. J. Mol. Biol. 1986, 191, 153–161. [Google Scholar] [CrossRef]
  35. Nguyen, L.T.; Schmidt, H.A.; von Haeseler, A.; Minh, B.Q. IQ-TREE: A Fast and Effective Stochastic Algorithm for Estimating Maximum-Likelihood Phylogenies. Mol. Biol. Evol. 2015, 32, 268–274. [Google Scholar] [CrossRef]
  36. Guindon, S.; Gascuel, O. A simple, fast, and accurate algorithm to estimate large phylogenies by maximum likelihood. Syst. Biol. 2003, 52, 696–704. [Google Scholar] [CrossRef]
  37. Zhou, T.; Xu, K.D.; Zhao, F.; Liu, W.Y.; Li, L.Z.; Hua, Z.Y.; Zhou, X. Itol.toolkit accelerates working with iTOL (Interactive Tree of Life) by an automated generation of annotation files. Bioinformatics 2023, 39, btad339. [Google Scholar] [CrossRef]
  38. Song, J.S.; Gonzales, N.R.; Yamashita, R.A.; Marchler-Bauer, A.; Bryant, S.H. Evolutionary, structural, and functional insights into the seven-transmembrane GPCR superfamily through NCBI’s Conserved Domain Database. Cancer Res. 2015, 75, 1090. [Google Scholar] [CrossRef]
  39. Li, X.; Ma, L.N.; Mei, X.Y.; Liu, Y.X.; Huang, H.C. ggmotif: An R Package for the extraction and visualization of motifs from MEME software. PLoS ONE 2022, 17, e0276979. [Google Scholar] [CrossRef]
  40. Chen, C.J.; Chen, H.; Zhang, Y.; Thomas, H.R.; Frank, M.H.; He, Y.H.; Xia, R. TBtools: An Integrative Toolkit Developed for Interactive Analyses of Big Biological Data. Mol. Plant 2020, 13, 1194–1202. [Google Scholar] [CrossRef]
  41. Wang, Y.P.; Tang, H.B.; DeBarry, J.D.; Tan, X.; Li, J.P.; Wang, X.Y.; Lee, T.H.; Jin, H.Z.; Marler, B.; Guo, H.; et al. MCScanX: A toolkit for detection and evolutionary analysis of gene synteny and collinearity. Nucleic Acids Res. 2012, 40, e49. [Google Scholar] [CrossRef]
  42. Rombauts, S.; Dehais, P.; Van Montagu, M.; Rouze, P. PlantCARE, a plant cis-acting regulatory element database. Nucleic Acids Res. 1999, 27, 295–296. [Google Scholar] [CrossRef]
  43. Lotia, S.; Montojo, J.; Dong, Y.; Bader, G.D.; Pico, A.R. Cytoscape App Store. Bioinformatics 2013, 29, 1350–1351. [Google Scholar] [CrossRef]
  44. Cheung, D.K.B.; Brunke, A.J.; Akkari, N.; Souza, C.M.; Pape, T. Rotational Scanning Electron Micrographs (rSEM): A novel and accessible tool to visualize and communicate complex morphology. Zookeys 2013, 328, 47–57. [Google Scholar] [CrossRef]
  45. Fu, N.N.; Wang, L.; Sun, Q.L.; Wang, Q.G.; Zhang, Y.T.; Han, X.; Yang, Q.; Ma, W.J.; Tong, Z.K.; Zhang, J.H. Genome-wide identification of the bHLH transcription factor family and the regulatory roles of PbbHLH74 in response to drought stress in Phoebe bournei. Int. J. Biol. Macromol. 2024, 283, 137760. [Google Scholar] [CrossRef]
  46. Nakagawa, T.; Kawaguchi, M. Shoot-applied MeJA suppresses root nodulation in Lotus japonicus. Plant Cell Physiol. 2006, 47, 176–180. [Google Scholar] [CrossRef]
  47. Cao, S.F.; Cai, Y.T.; Yang, Z.F.; Zheng, Y.H. MeJA induces chilling tolerance in loquat fruit by regulating proline and γ-aminobutyric acid contents. Food Chem. 2012, 133, 1466–1470. [Google Scholar] [CrossRef]
  48. Fung, R.W.M.; Wang, C.Y.; Smith, D.L.; Gross, K.C.; Tian, M.S. MeSA and MeJA increase steady-state transcript levels of alternative oxidase and resistance against chilling injury in sweet peppers (Capsicum annuum L.). Plant Sci. 2004, 166, 711–719. [Google Scholar] [CrossRef]
  49. Bowers, J.E.; Chapman, B.A.; Rong, J.K.; Paterson, A.H. Unravelling angiosperm genome evolution by phylogenetic analysis of chromosomal duplication events. Nature 2003, 422, 433–438. [Google Scholar] [CrossRef] [PubMed]
  50. Chen, S.-P.; Sun, W.-H.; Xiong, Y.-F.; Jiang, Y.-T.; Liu, X.-D.; Liao, X.-Y.; Zhang, D.-Y.; Jiang, S.-Z.; Li, Y.; Liu, B.; et al. The Phoebe genome sheds light on the evolution of magnoliids. Hortic. Res. 2020, 7, 146. [Google Scholar] [CrossRef] [PubMed]
  51. Maher, C.; Stein, L.; Ware, D. Evolution of Arabidopsis microRNA families through duplication events. Genome Res. 2006, 16, 510–519. [Google Scholar] [CrossRef] [PubMed]
  52. Yu, C.; Danilova, T.; Zhang, J.; Birchler, J.; Peterson, T. Constructing Defined Chromosome Segmental Duplications in Maize. Cytogenet. Genome Res. 2010, 129, 72–81. [Google Scholar] [CrossRef] [PubMed]
  53. Yu, J.; Ke, T.; Tehrim, S.; Sun, F.; Liao, B.; Hua, W. PTGBase: An integrated database to study tandem duplicated genes in plants. Database J. Biol. Databases Curation 2015, 2015, bav017. [Google Scholar] [CrossRef]
  54. Rakoczy-Trojanowska, M.; Bolibok, H. Characteristics and a comparison of three classes of microsatellite-based markers and their application in plants. Cell. Mol. Biol. Lett. 2004, 9, 221–238. [Google Scholar] [CrossRef]
  55. Panzade, K.P.; Kale, S.S.; Chavan, N.R.; Hatzade, B. Genome-wide analysis of Hsp70 and Hsp100 gene families in Ziziphus jujuba. Cell Stress. Chaperones 2021, 26, 341–353. [Google Scholar] [CrossRef] [PubMed]
  56. Khatiwada, A.; Yilmaz, A.S.; Wolf, B.J.; Pietrzak, M.; Chung, D.J.; Li, M.Y. multi-GPA-Tree: Statistical approach for pleiotropy informed and functional annotation tree guided prioritization of GWAS results. PLoS Comput. Biol. 2023, 19, e1011686. [Google Scholar] [CrossRef]
  57. Nakashima, K.; Yamaguchi-Shinozaki, K. Regulons involved in osmotic stress-responsive and cold stress-responsive gene expression in plants. Physiol. Plant. 2006, 126, 62–71. [Google Scholar] [CrossRef]
  58. Colleaux, L.; Michel-Wolwertz, M.R.; Matagne, R.F.; Dujon, B. The apocytochrome b gene of Chlamydomonas smithii contains a mobile intron related to both Saccharomyces and Neurospora introns. Mol. Gen. Genet. 1990, 223, 288–296. [Google Scholar] [CrossRef]
  59. Foury, F.; Roganti, T.; Lecrenier, N.; Purnelle, B. The complete sequence of the mitochondrial genome of Saccharomyces cerevisiae. FEBS Lett. 1998, 440, 325–331. [Google Scholar] [CrossRef]
  60. Hernandez-Garcia, C.M.; Finer, J.J. Identification and validation of promoters and cis-acting regulatory elements. Plant Sci. 2014, 217, 109–119. [Google Scholar] [CrossRef]
  61. Jeong, H.J.; Jung, K.H. Rice tissue-specific promoters and condition-dependent promoters for effective translational application. J. Integr. Plant Biol. 2015, 57, 913–924. [Google Scholar] [CrossRef]
  62. Arguello-Astorga, G.; Herrera-Estrella, L. Evolution of light-regulated plant promoters. Annu. Rev. Plant Physiol. Plant Mol. Biol. 1998, 49, 525–555. [Google Scholar] [CrossRef]
  63. Guiltinan, M.J.; Marcotte, W.R., Jr.; Quatrano, R.S. A plant leucine zipper protein that recognizes an abscisic acid response element. Science 1990, 250, 267–271. [Google Scholar] [CrossRef] [PubMed]
  64. Hattori, T.; Totsuka, M.; Hobo, T.; Kagaya, Y.; Yamamoto-Toyoda, A. Experimentally determined sequence requirement of ACGT-containing abscisic acid response element. Plant Cell Physiol. 2002, 43, 136–140. [Google Scholar] [CrossRef] [PubMed]
  65. Rohwer, C.L.; Erwin, J.E. Irradiance and photoperiod effects on methyl jasmonate synthesis in Artemisia spp. In Proceedings of the 5th International Symposium on Artificial Lighting in Horticulture, Lillehammer, Norway, 21–24 June 2005; pp. 375–380. [Google Scholar]
  66. Avdiushko, S.; Croft, K.P.; Brown, G.C.; Jackson, D.M.; Hamilton-Kemp, T.R.; Hildebrand, D. Effect of volatile methyl jasmonate on the oxylipin pathway in tobacco, cucumber, and arabidopsis. Plant Physiol. 1995, 109, 1227–1230. [Google Scholar] [CrossRef] [PubMed]
  67. Nicolaides, N.C.; Gualdi, R.; Casadevall, C.; Manzella, L.; Calabretta, B. Positive autoregulation of c-myb expression via Myb binding sites in the 5’ flanking region of the human c-myb gene. Mol. Cell. Biol. 1991, 11, 6166–6176. [Google Scholar] [CrossRef]
  68. Ku, D.H.; Wen, S.C.; Engelhard, A.; Nicolaides, N.C.; Lipson, K.E.; Marino, T.A.; Calabretta, B. c-myb transactivates cdc2 expression via Myb binding sites in the 5’-flanking region of the human cdc2 gene. J. Biol. Chem. 1993, 268, 2255–2259. [Google Scholar] [CrossRef]
  69. Xu, Y.M.; Liu, Y.; Yi, Y.J.; Liu, J.J. Genome-Wide Identification and Characterization of HSP70 Gene Family in Tausch’s Goatgrass (Aegilops tauschii). Genes 2025, 16, 19. [Google Scholar] [CrossRef]
  70. Alam, P.; Al Balawi, T.; Manzoor, M.A.; Sabir, I.A. Genome-wide analysis of HSP70 gene family in Beta vulgaris and in-silico expression under environmental stress. BMC Plant Biol. 2025, 25, 214. [Google Scholar] [CrossRef]
  71. Harrison, R.; Papp, B.; Pál, C.; Oliver, S.G.; Delneri, D. Plasticity of genetic interactions in metabolic networks of yeast. Proc. Natl. Acad. Sci. USA 2007, 104, 2307–2312. [Google Scholar] [CrossRef]
  72. Henderson, S.T.; Johnson, T.E. daf-16 integrates developmental and environmental inputs to mediate aging in the nematode Caenorhabditis elegans. Curr. Biol. 2001, 11, 1975–1980. [Google Scholar] [CrossRef] [PubMed]
  73. Desalvo, M.K.; Voolstra, C.R.; Sunagawa, S.; Schwarz, J.A.; Stillman, J.H.; Coffroth, M.A.; Szmant, A.M.; Medina, M. Differential gene expression during thermal stress and bleaching in the Caribbean coral Montastraea faveolata. Mol. Ecol. 2008, 17, 3952–3971. [Google Scholar] [CrossRef] [PubMed]
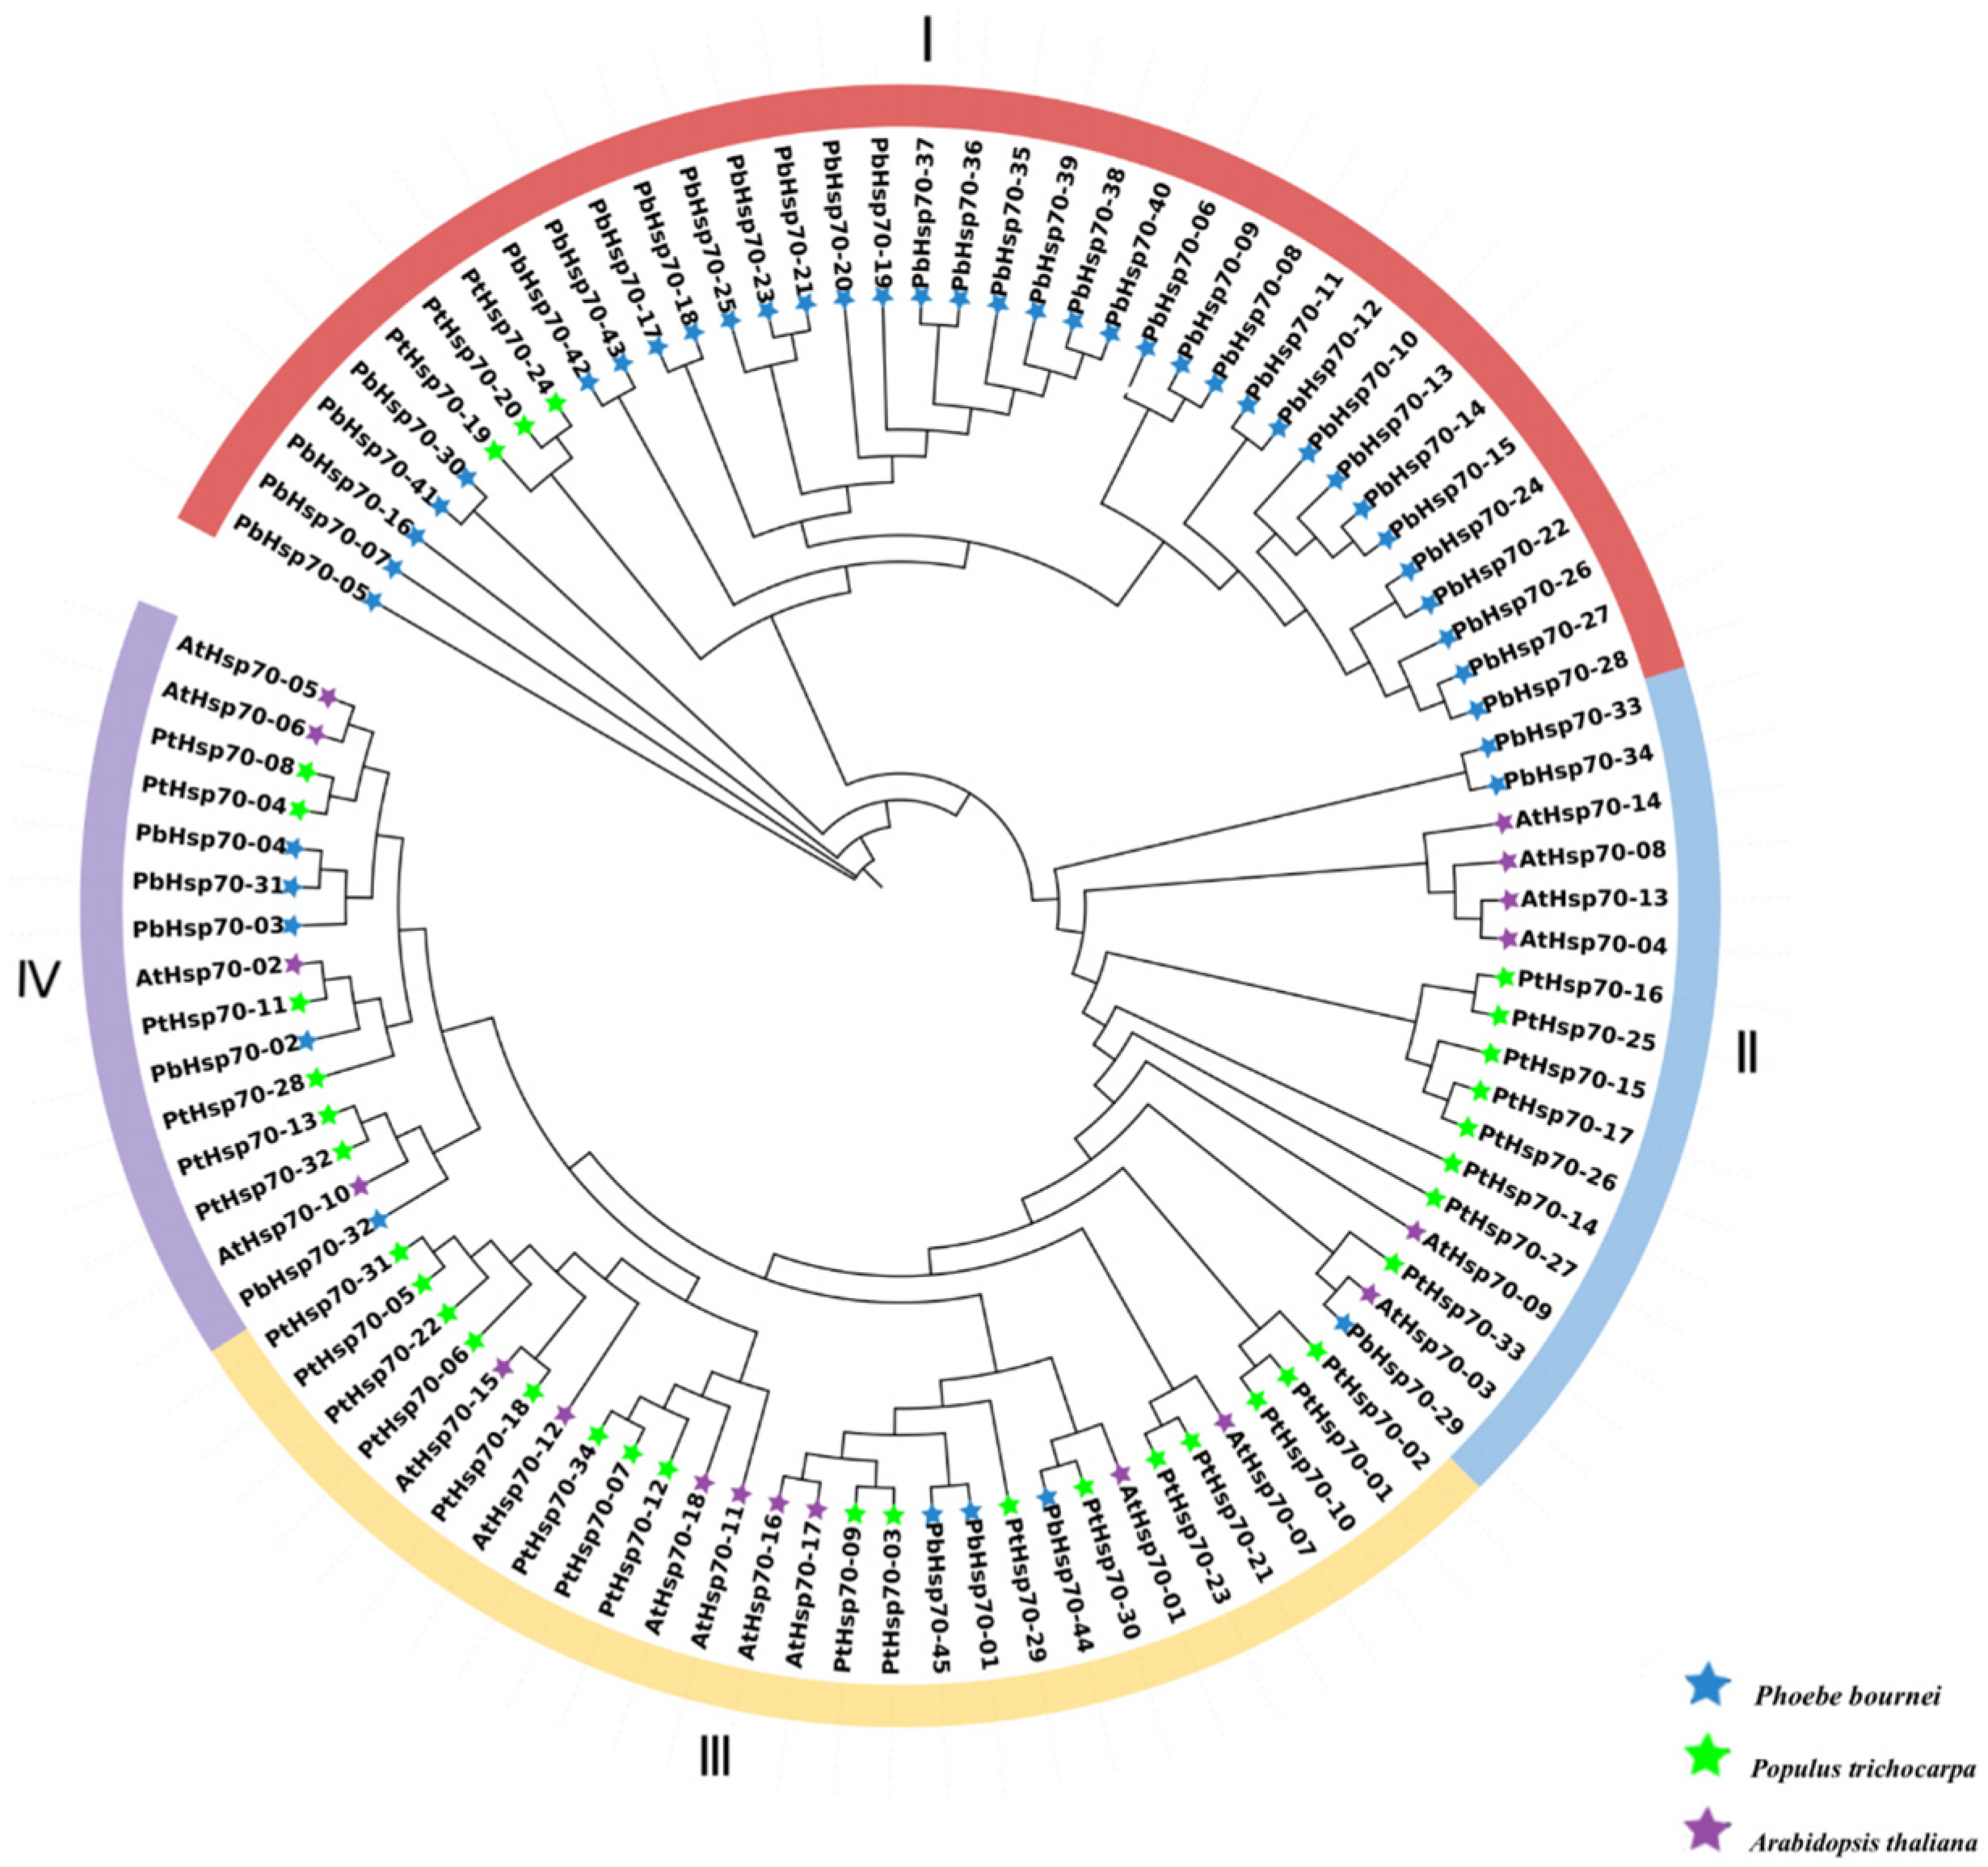
Figure 1. Phylogenetic tree generated for 97 Hsp70 proteins retrieved from P. bournei, A. thaliana, and P. trichocarpa. The phylogeny test was performed using the bootstrap method with 1000 replications.
Biology 14 00602 g001
Figure 2. P. bournei Hsp70 gene family motif and gene structure analysis. (A) Phylogenetic relationship of 45 Hsp70 genes; (B) conserved motifs of Hsp70 proteins; (C) structure of Hsp70 proteins. Comparative mapping of phylogenetic trees and conserved protein motifs.
Biology 14 00602 g002
Figure 3. Sequence information for base sequences 1 to 10. The conserved sequence patterns of the Hsp70 gene were analyzed using the MEME 5.5.7 Suite online software.
Biology 14 00602 g003
Figure 4. Distribution of Hsp70 on the chromosomes of P. bournei. Chromosome names are labeled in orange, and black indicates allelic locus names.
Biology 14 00602 g004
Figure 5. Interspecific covariance in P. bournei. Red lines represent segmental duplicate gene pairs.
Biology 14 00602 g005
Figure 6. Interspecific covariance among P. bournei, A. thaliana, and P. trichocarpa. Blue lines depict Hsp70 genes that exhibit covariance across species.
Biology 14 00602 g006
Figure 7. Promoter analysis of the Hsp70 genes of P. bournei.
Biology 14 00602 g007
Figure 8. Expression profiles of 45 PbHsp70 genes. Different colors are used to indicate the expression levels, with the expression values on the right.
Biology 14 00602 g008
Figure 9. Real-time reverse transcription quantitative PCR (RT-qPCR) validation of nine Hsp70 genes under high-temperature stress. The y-axis indicates the relative expression value (2−∆∆CT) and the x-axis indicates the duration of high-temperature stress. The analysis examined the status of control samples at 0 h before high-temperature stress and then recorded their responses after 1, 12, 24, and 48 h of high-temperature stress. A total of three biological replicates were used in the experiment, each with three technical replicates.
Biology 14 00602 g009
Table 1. Physicochemical properties of Hsp70 proteins from P. bournei.
MemberAmino Acid (aa)Grand Average of
Hydrophobicity
Theoretical pIMolecular WeightAliphatic IndexInstability IndexSubcellular Localization
PbHsp70-01663−0.4565.1273,265.187.9527.01E.R.
PbHsp70-02803−0.4285.689,802.3579.4451.6nucl
PbHsp70-03835−0.4415.2492,764.0578.1249.06cyto
PbHsp70-04859−0.4545.3395,252.1677.5344.57chlo
PbHsp70-05585−0.4165.1164,506.3184.7235.09cyto
PbHsp70-06555−0.3265.6762,187.2693.6436.96cyto
PbHsp70-07232−0.7824.7425,677.7874.4832.83mito
PbHsp70-08155−0.7945.2917,910.2280.5844.47nucl
PbHsp70-09678−0.5928.9775,778.1480.7453.8nucl
PbHsp70-10117−1.1196.1913,829.6973.549.48cyto
PbHsp70-11201−0.7916.8622,829.876.2756.09cyto
PbHsp70-12304−0.4365.9634,209.2590.7630.39cyto
PbHsp70-13407−0.3798.7346,087.0883.6934.91chlo
PbHsp70-14226−0.6485.0825,399.7282.9231.63cysk
PbHsp70-15215−0.3968.5624,200.8783.4932.97chlo
PbHsp70-16651−0.4145.0571,339.7183.0132.89cyto
PbHsp70-17292−0.4466.9832,504.1290.8635.27cyto
PbHsp70-18166−0.7439.0618,816.2778.836.09nucl
PbHsp70-19156−0.4016.1618,000.74103.2130.24cyto/nucl
PbHsp70-20135−0.4575.8715,406.690.9643.72cyto/nucl
PbHsp70-21119−0.3069.2512,926.887.5629.35cyto
PbHsp70-22165−0.5209.4918,538.5788.7940.07mito
PbHsp70-23327−0.3857.6936,460.5487.6830.26chlo
PbHsp70-24114−1.0119.7113,319.3467.7246.18nucl
PbHsp70-25580−0.4815.3965,468.4888.9327.88golg
PbHsp70-26146−0.5466.1816,641.1291.5842.02cyto
PbHsp70-27319−0.6099.5635,633.6375.8635.61chlo
PbHsp70-28750−0.3089.1885,255.6389.3642vacu
PbHsp70-29366−0.6134.9539,992.9575.9632.29cyto
PbHsp70-30653−0.3975.1371,554.0983.5232.98cyto
PbHsp70-31858−0.4145.2394,470.9979.6942.68chlo
PbHsp70-32889−0.4175.4898,969.2887.5338.38E.R.
PbHsp70-33620−0.3844.967,770.7384.1833.81cyto
PbHsp70-34554−0.3928.7861,513.1583.5939.59cyto
PbHsp70-35257−0.5266.3628,915.6883.1923.18cyto
PbHsp70-36676−0.3659.2576,069.6392.7232.83cyto
PbHsp70-37291−0.4779.7533,607.1999.1427.06cyto
PbHsp70-38182−0.4179.321,032.39101.8725.20cyto
PbHsp70-39183−0.4559.1921,087.38100.7723.37cyto
PbHsp70-40660−0.3217.1873,827.4693.9532.84cyto
PbHsp70-41649−0.4065.1471,262.9382.9733.84cyto
PbHsp70-421358−0.3087.94150,806.9286.4838.61chlo
PbHsp70-43515−0.7524.6557,613.7374.0842.83cyto
PbHsp70-44425−0.7704.8147,137.0676.6641.63cyto
PbHsp70-45652−0.4945.2671,897.4986.0127.7golg
Note: E.R: Endoplasmic reticulum; nucl: Nucleus; cyto: Cytoplasmic; chlo: Chloroplast; mito: Mitochondrial; cysk: cytoskeleton; golg: Golgi body; vacu: Vacuole.
Disclaimer/Publisher’s Note: The statements, opinions and data contained in all publications are solely those of the individual author(s) and contributor(s) and not of MDPI and/or the editor(s). MDPI and/or the editor(s) disclaim responsibility for any injury to people or property resulting from any ideas, methods, instructions or products referred to in the content.