
Comprehensive Analysis Reveals the Molecular Features and Immune Infiltration of PANoptosis-Related Genes in Metabolic Dysfunction-Associated Steatotic Liver Disease

Simple Summary
Abstract
1. Introduction
2. Materials and Methods
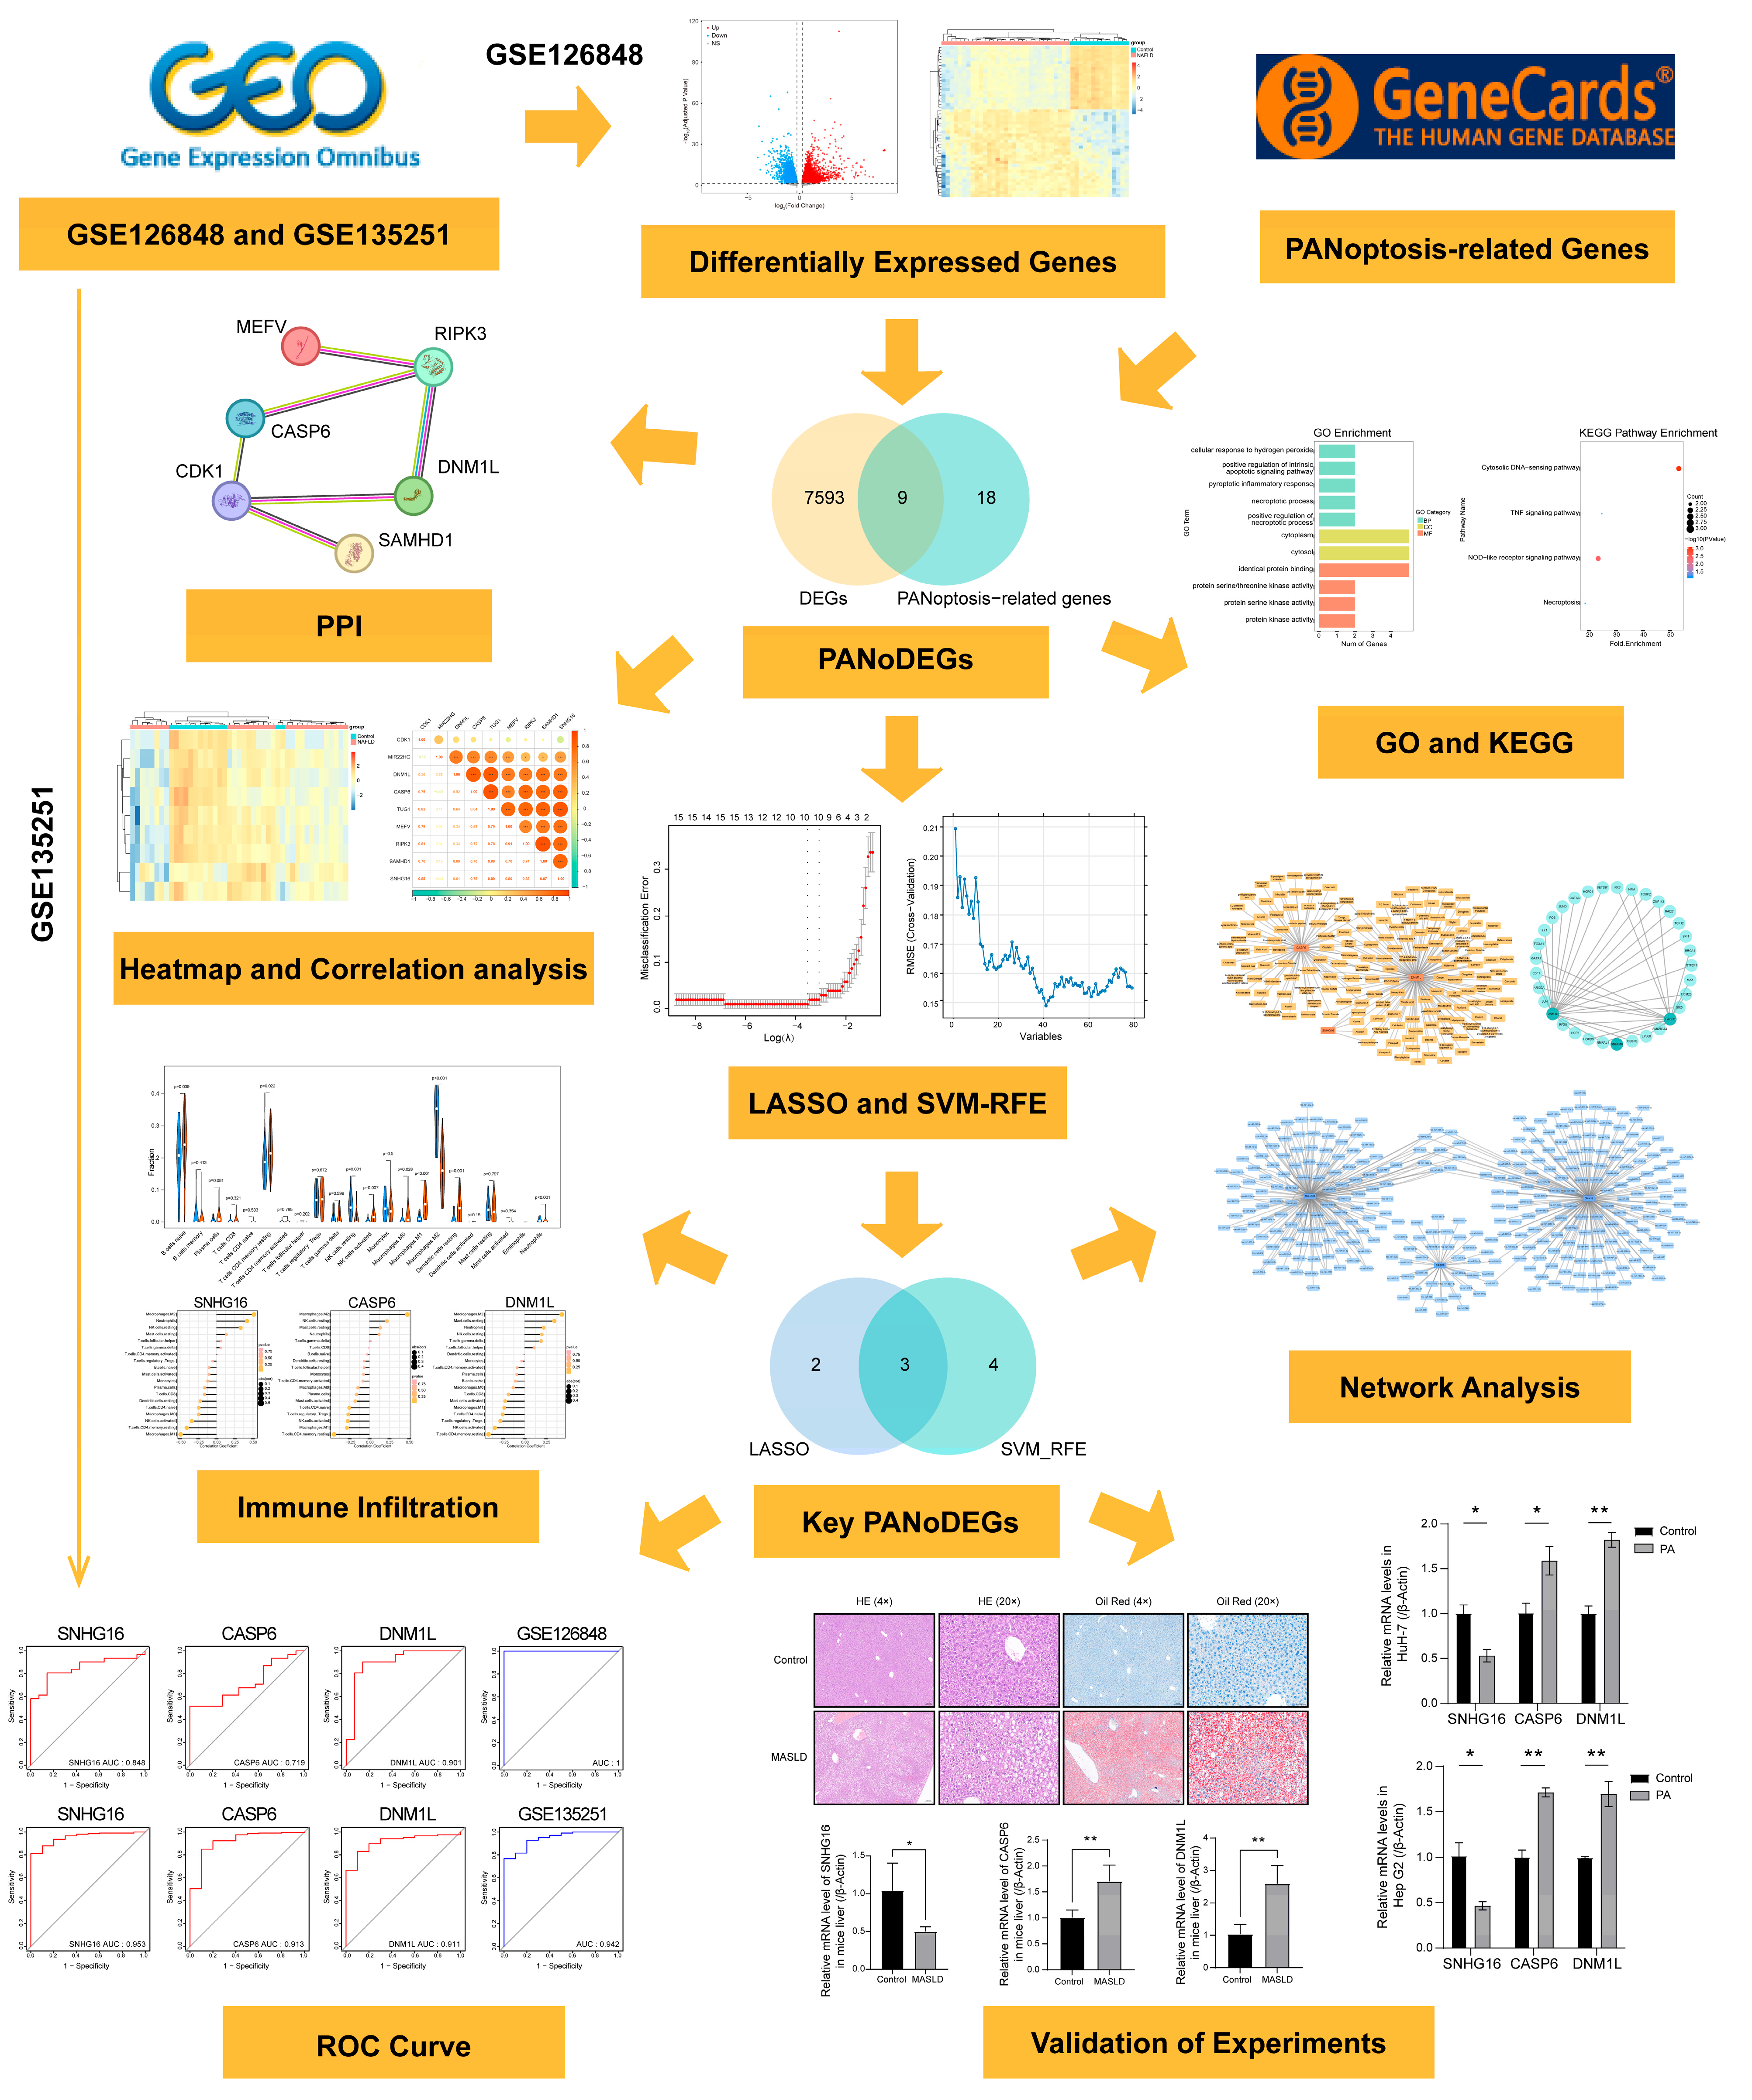
2.1. Data Acquisition
2.2. Identification of Differentially Expressed Genes (DEGs)
2.3. PANoDEGs Identification
2.4. Functional Enrichment Analysis
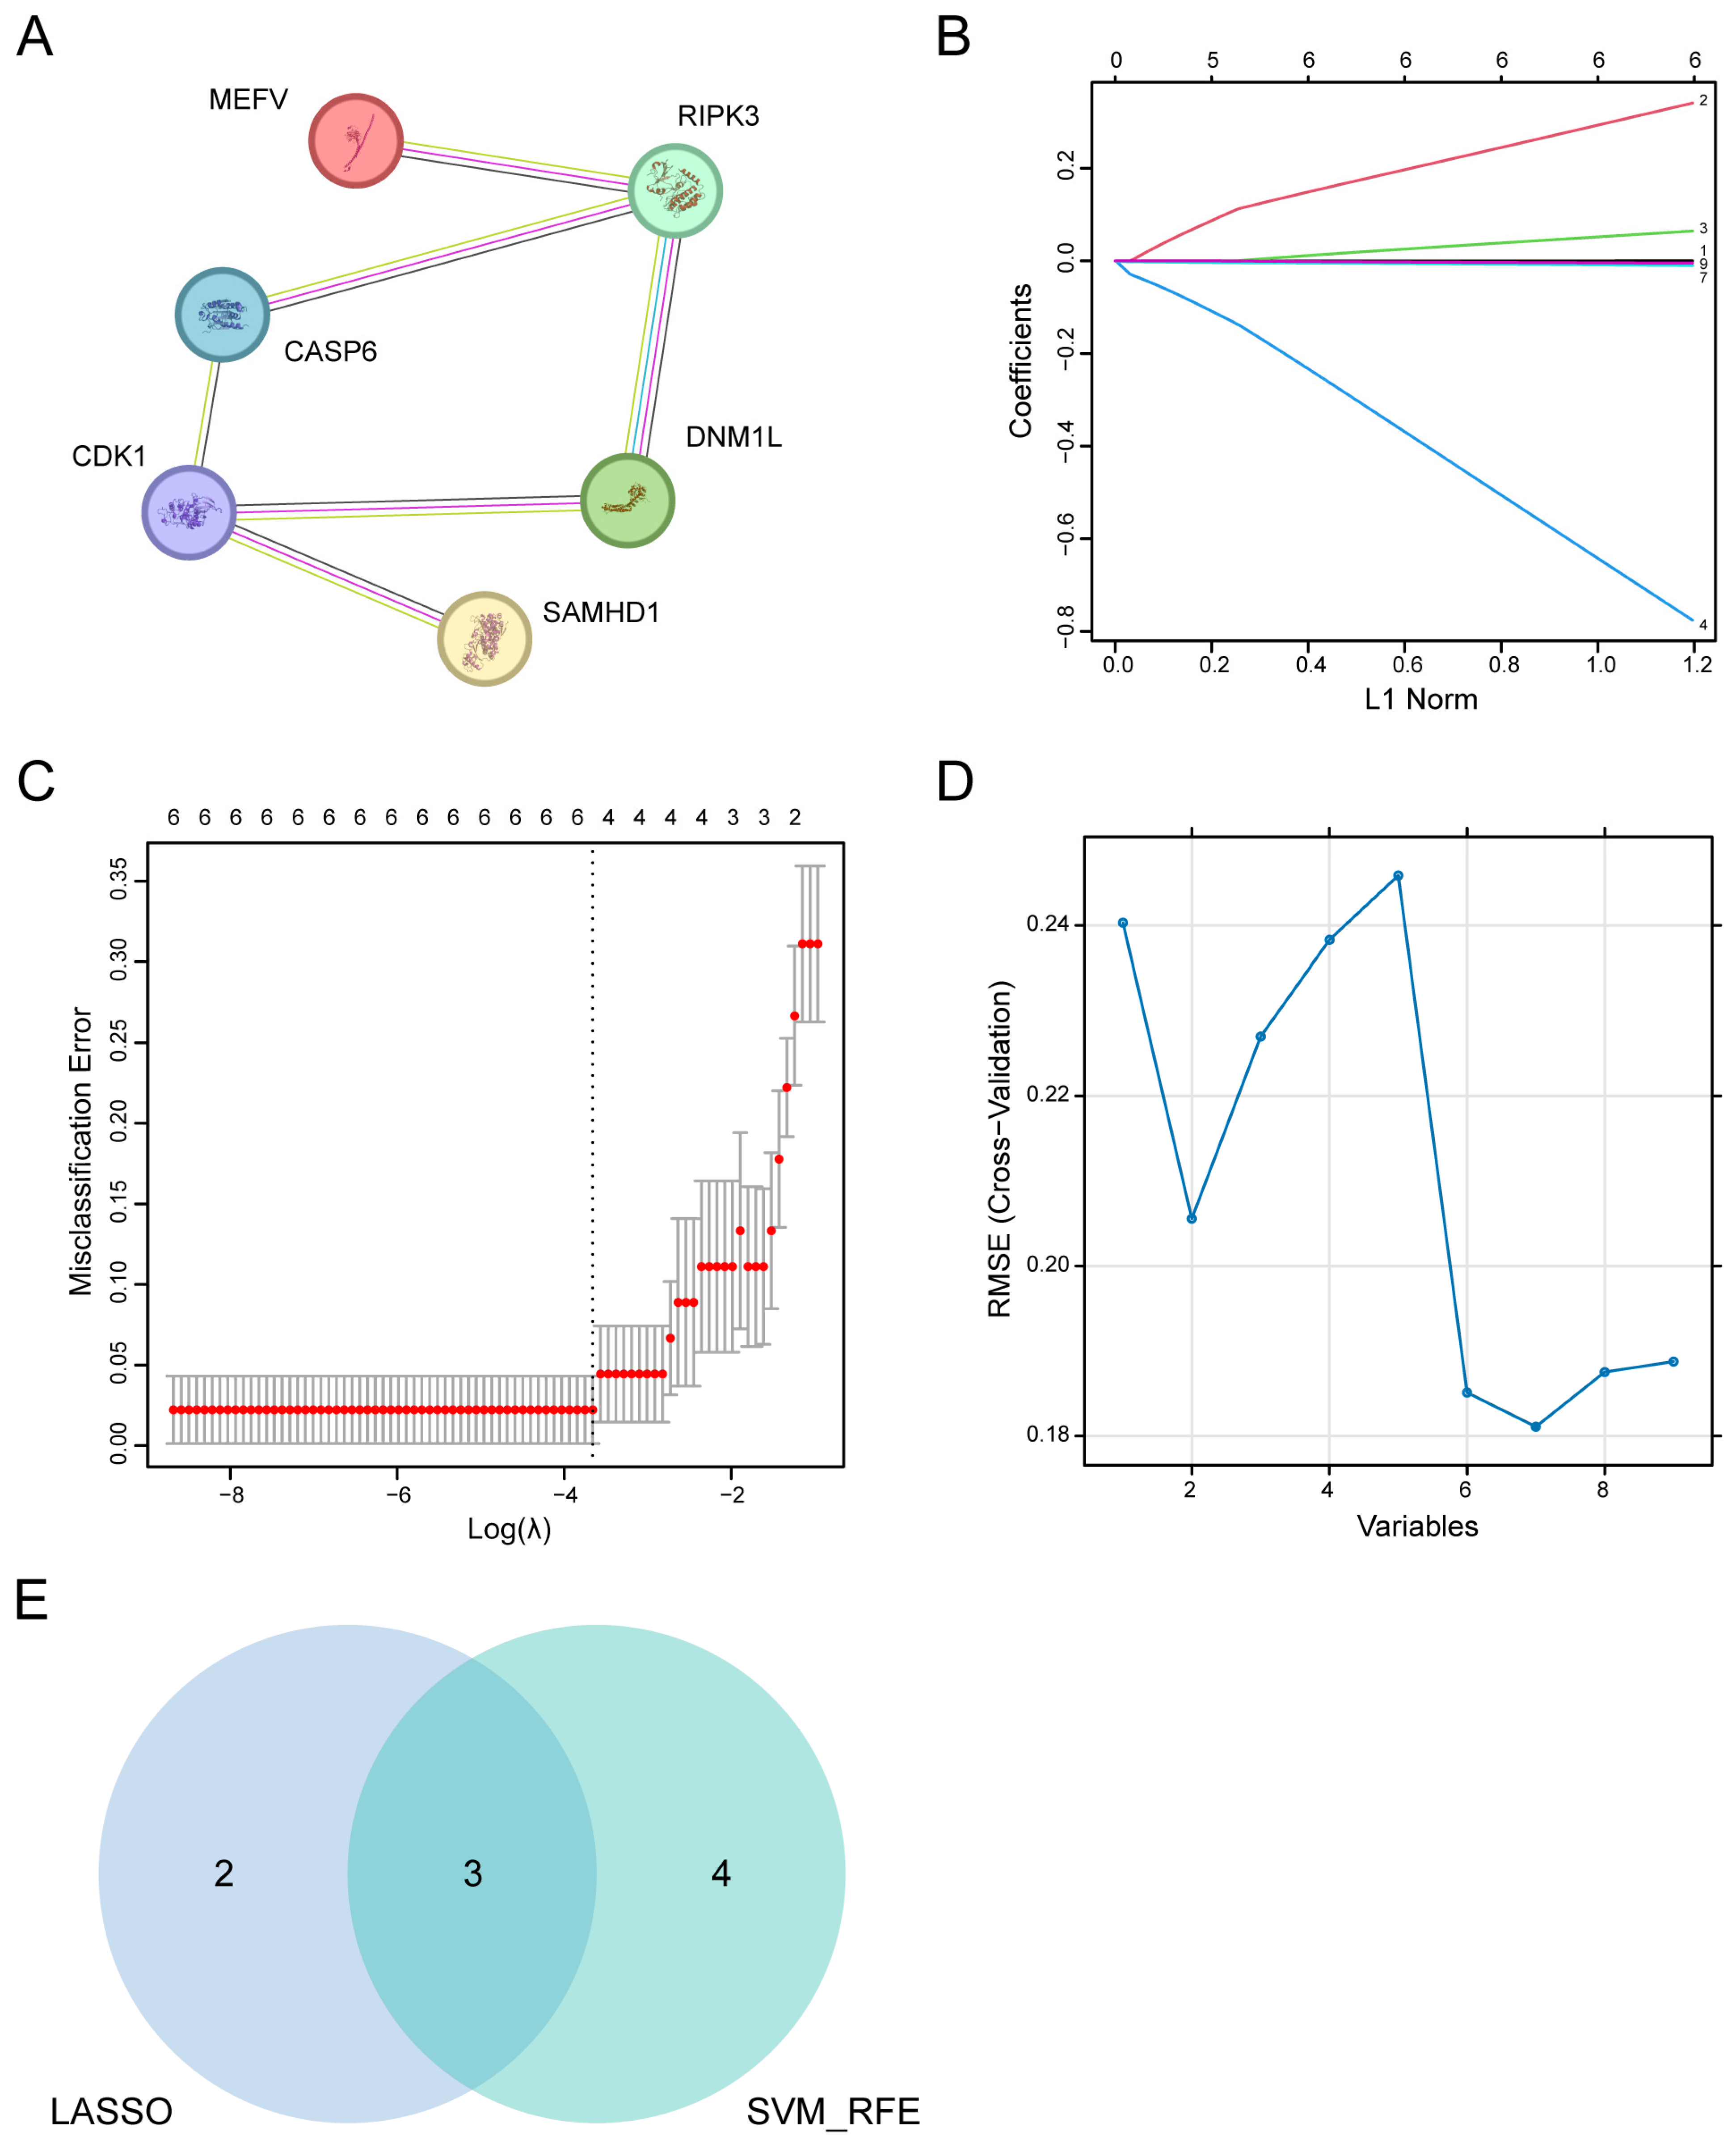
2.5. Protein–Protein Interaction (PPI) Network Construction and Identification of Key PANoDEGs
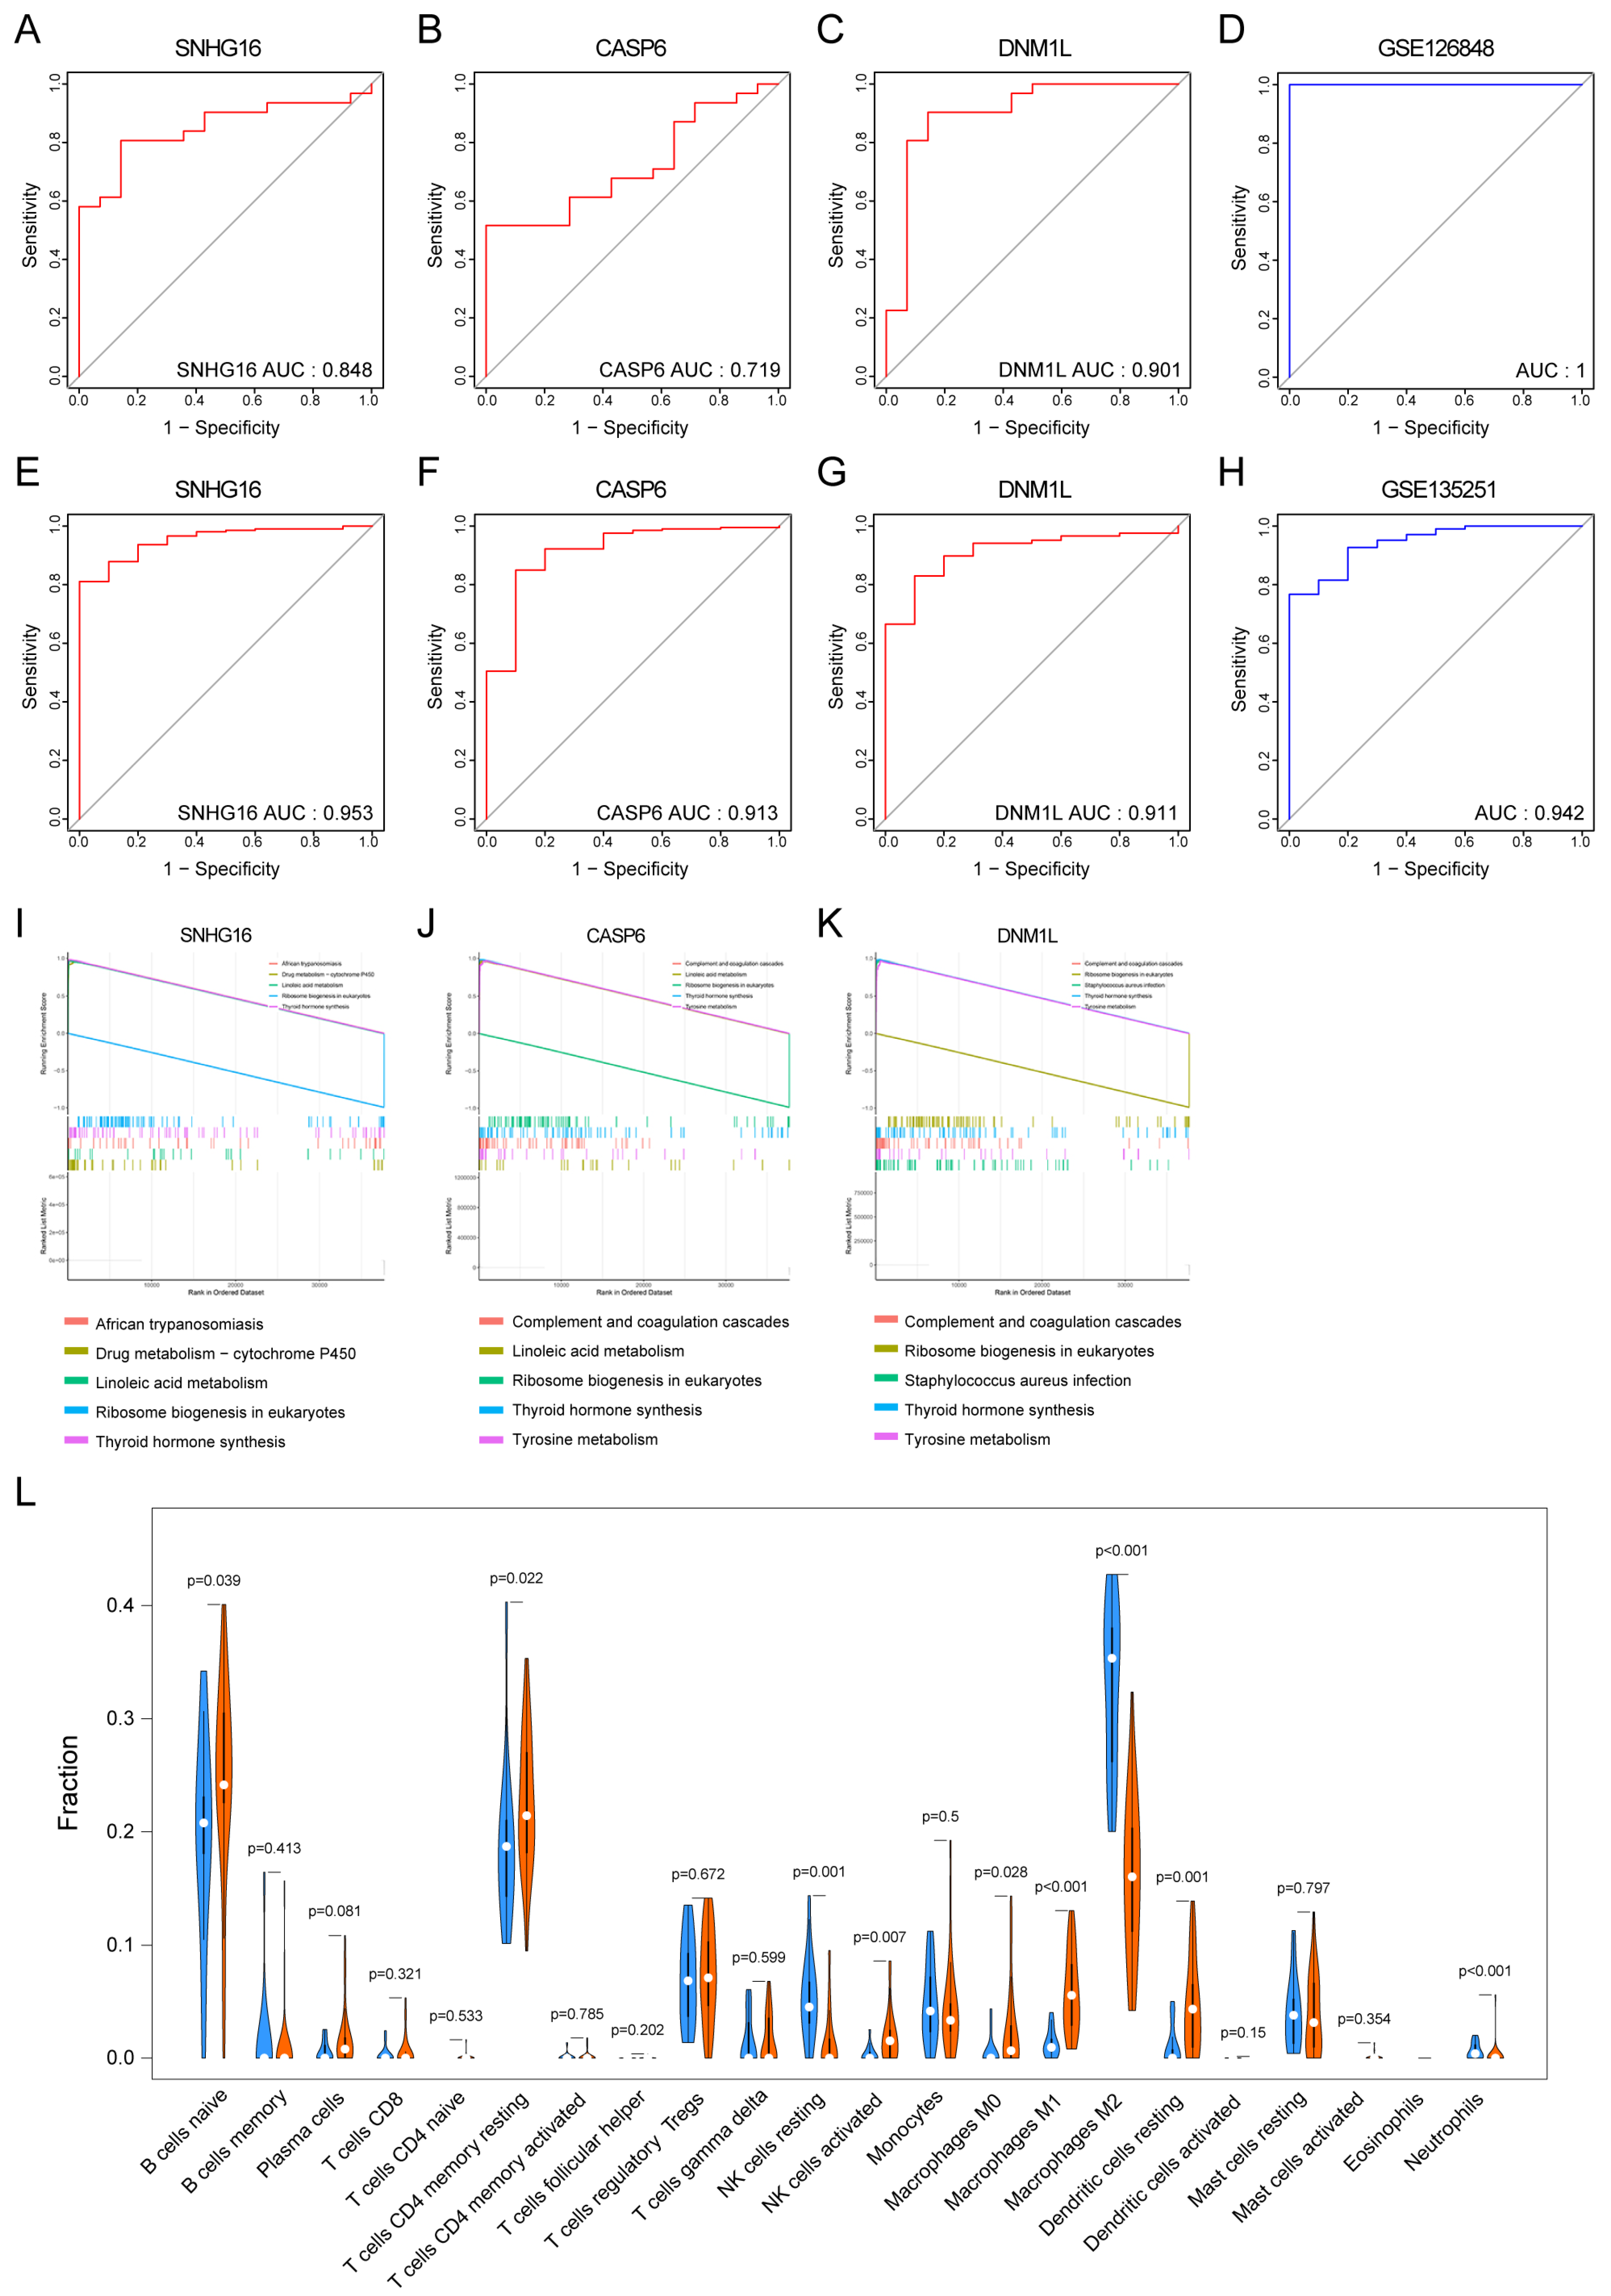
2.6. Diagnostic Values of the Key PANoDEGs in MASLD
2.7. Gene Set Enrichment Analysis (GSEA) for Key PANoDEGs
2.8. Immune Infiltration Analysis
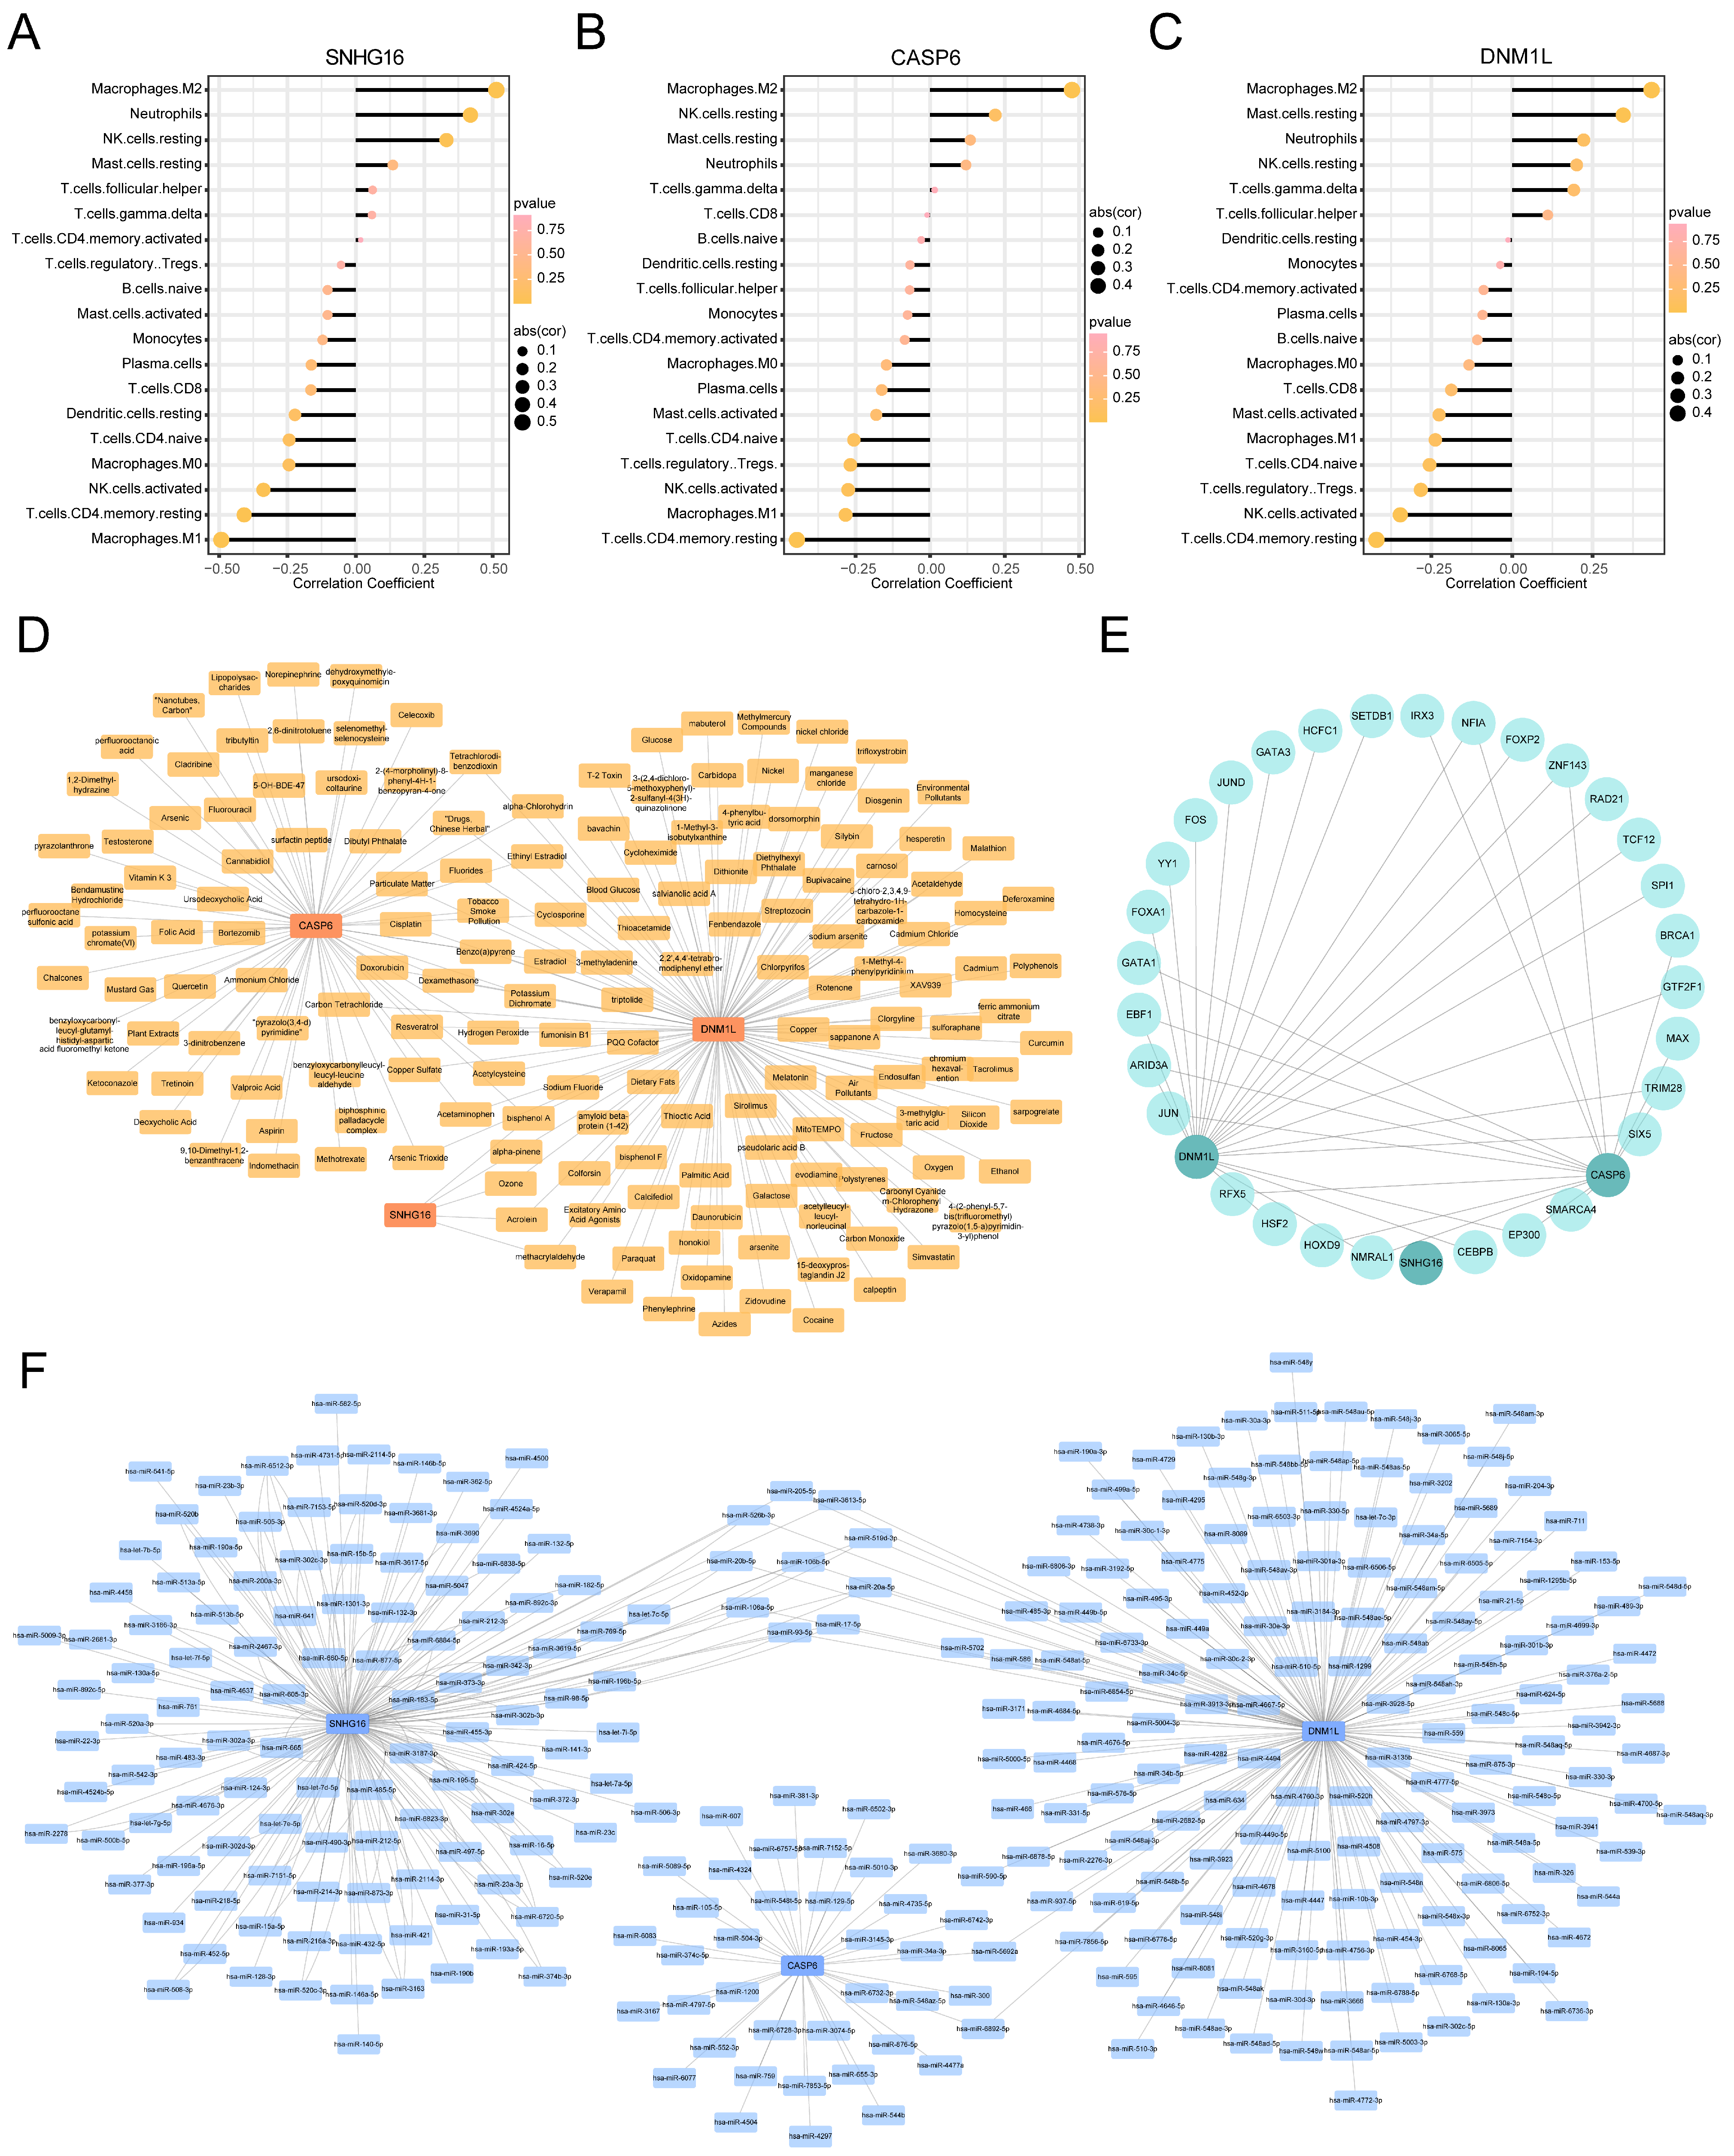
2.9. Network Analysis of the Key Genes
2.10. Cell Culture and Treatment
2.11. Construction of an MASLD Animal Model
2.12. Tissue Staining
2.13. Clinical Samples Collected from MASLD Patients and Controls
2.14. RNA Extraction and Quantitative Real-Time PCR (RT-qPCR)
2.15. Statistical Analysis
3. Results
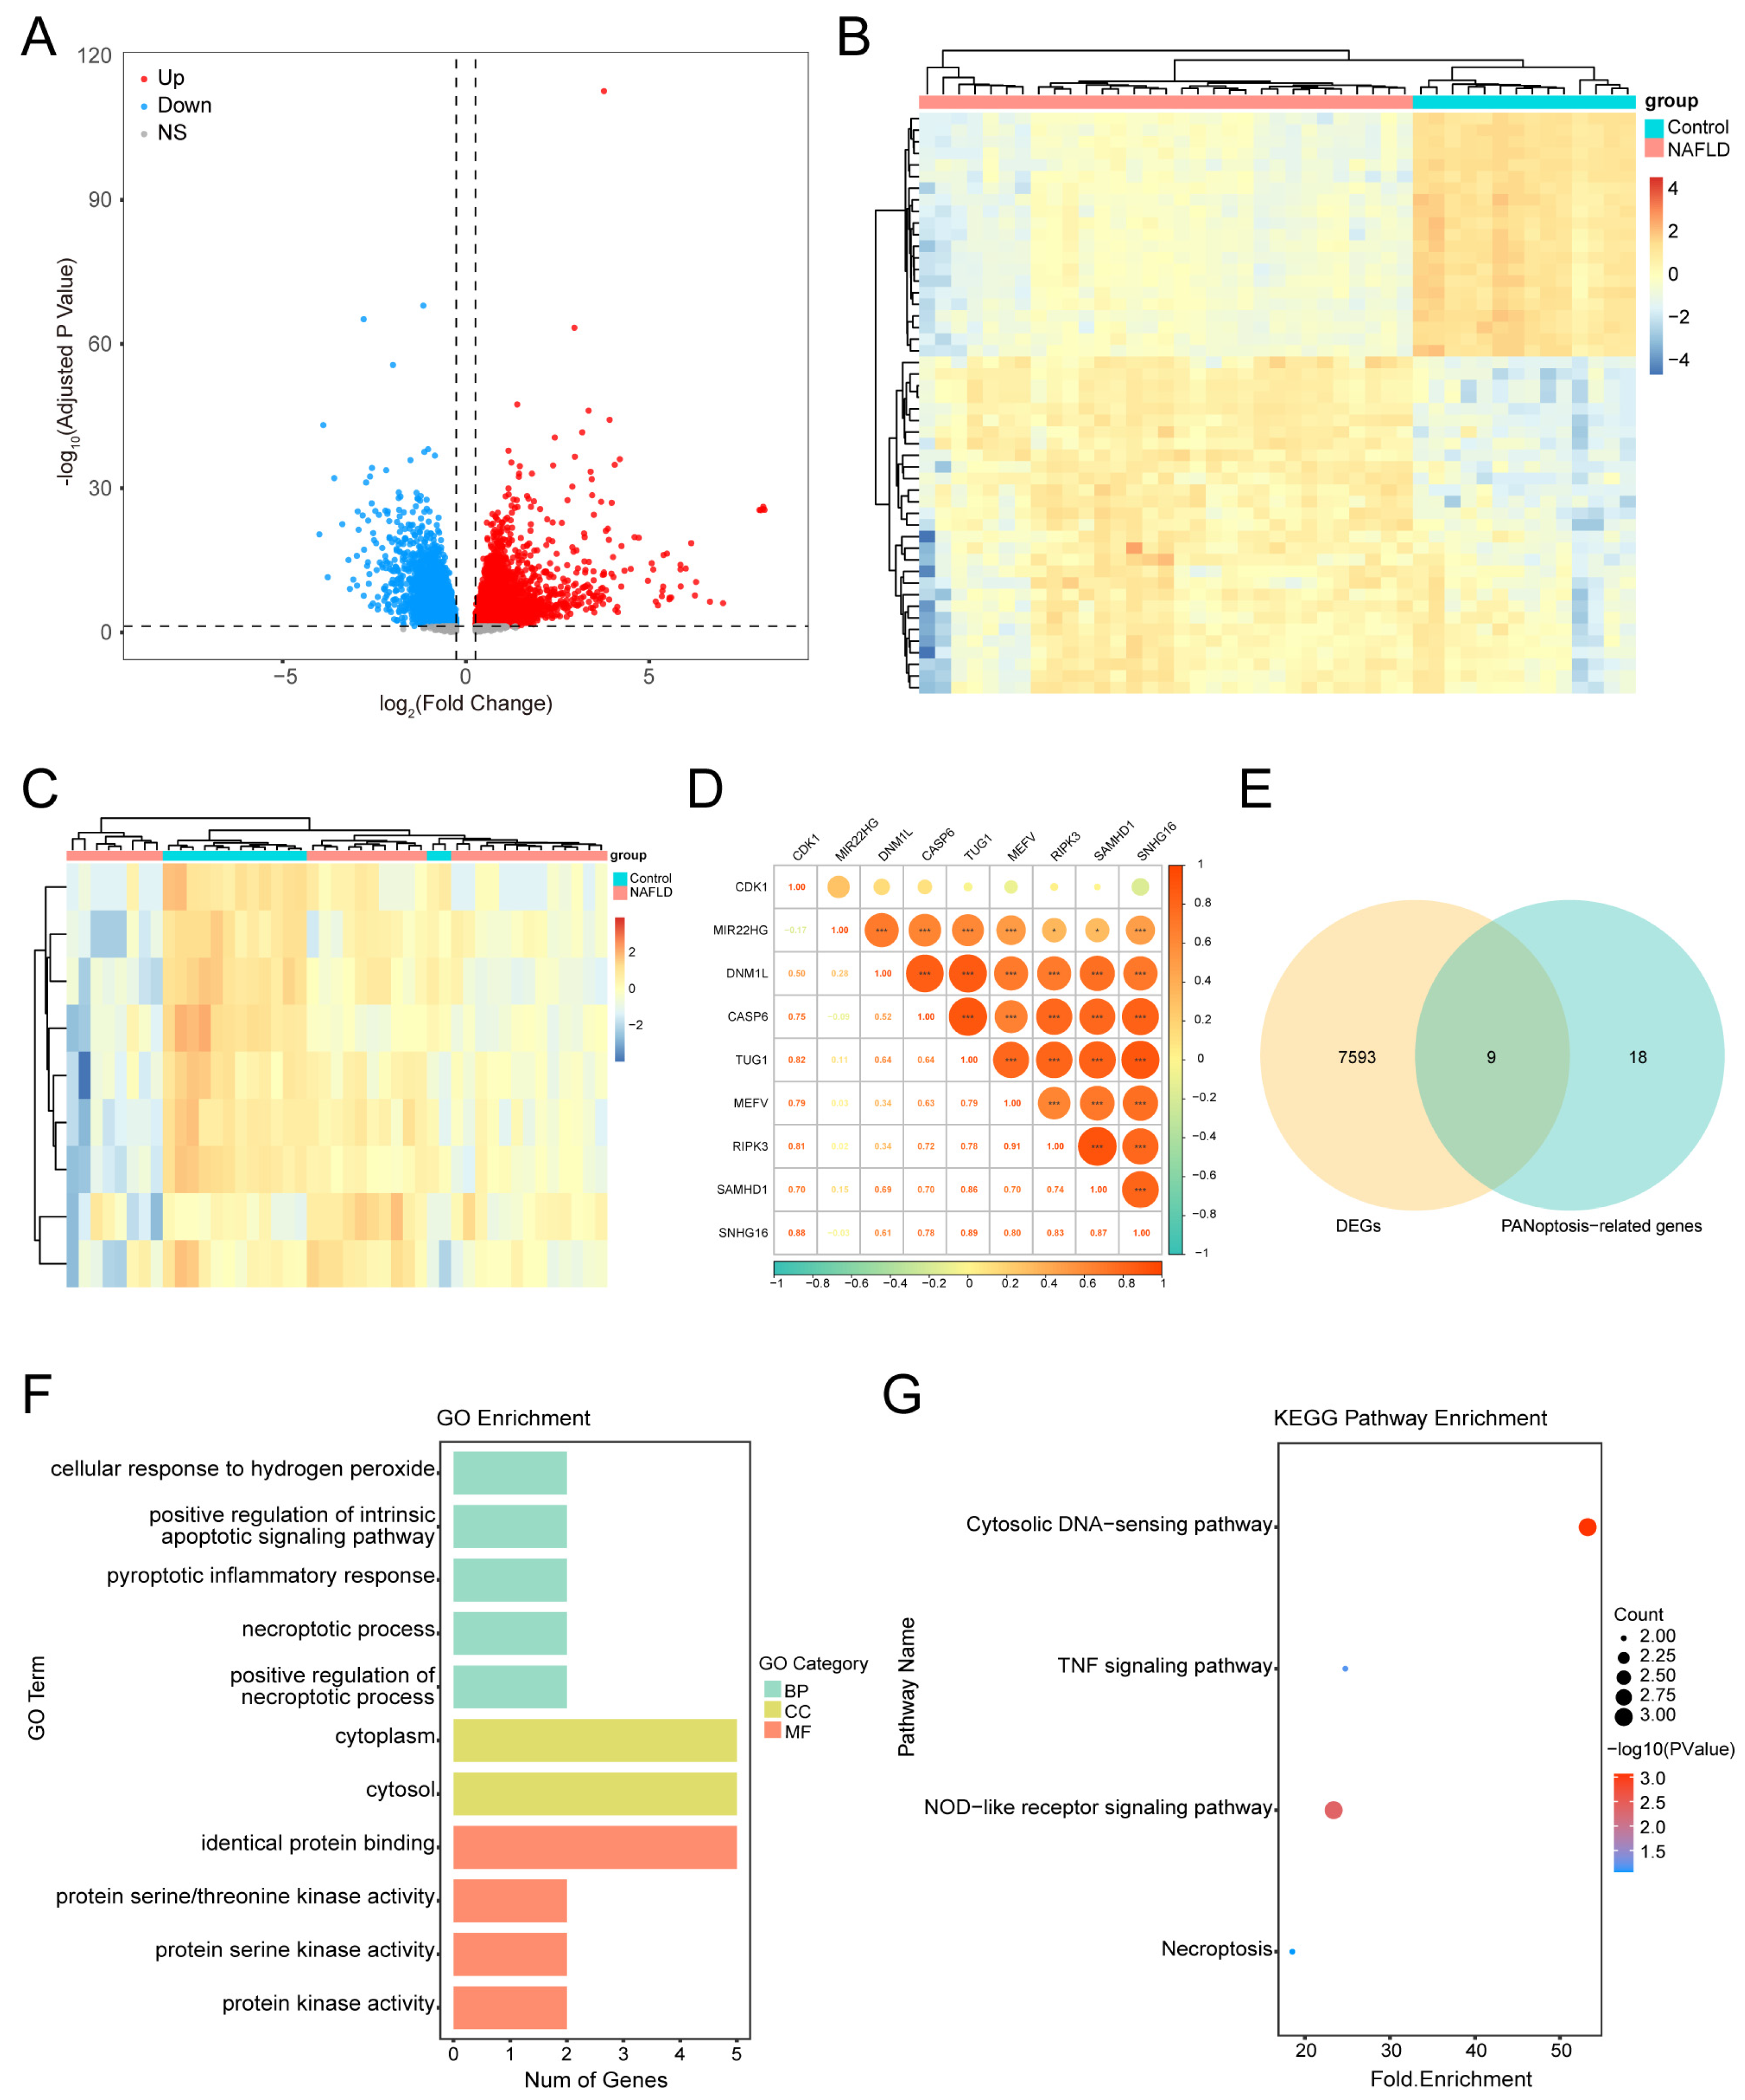
3.1. DEGs in MASLD
3.2. Identifying PANoDEGs and Their Correlation
3.3. Functional Enrichment Analysis of the PANoDEGs
3.4. PPI Network Analysis and Leveraging Machine Learning Identification of Key PANoDEGs
3.5. Clinical Diagnostic Significance of Key PANoDEGs for MASLD
3.6. The GSEA of the Key PANoDEGs
3.7. Immune Infiltration Analysis for MASLD
3.8. Targeted Drug Prediction for the Key PANoDEGs
3.9. TFs and miRNA Network Analysis of the Key PANoDEGs
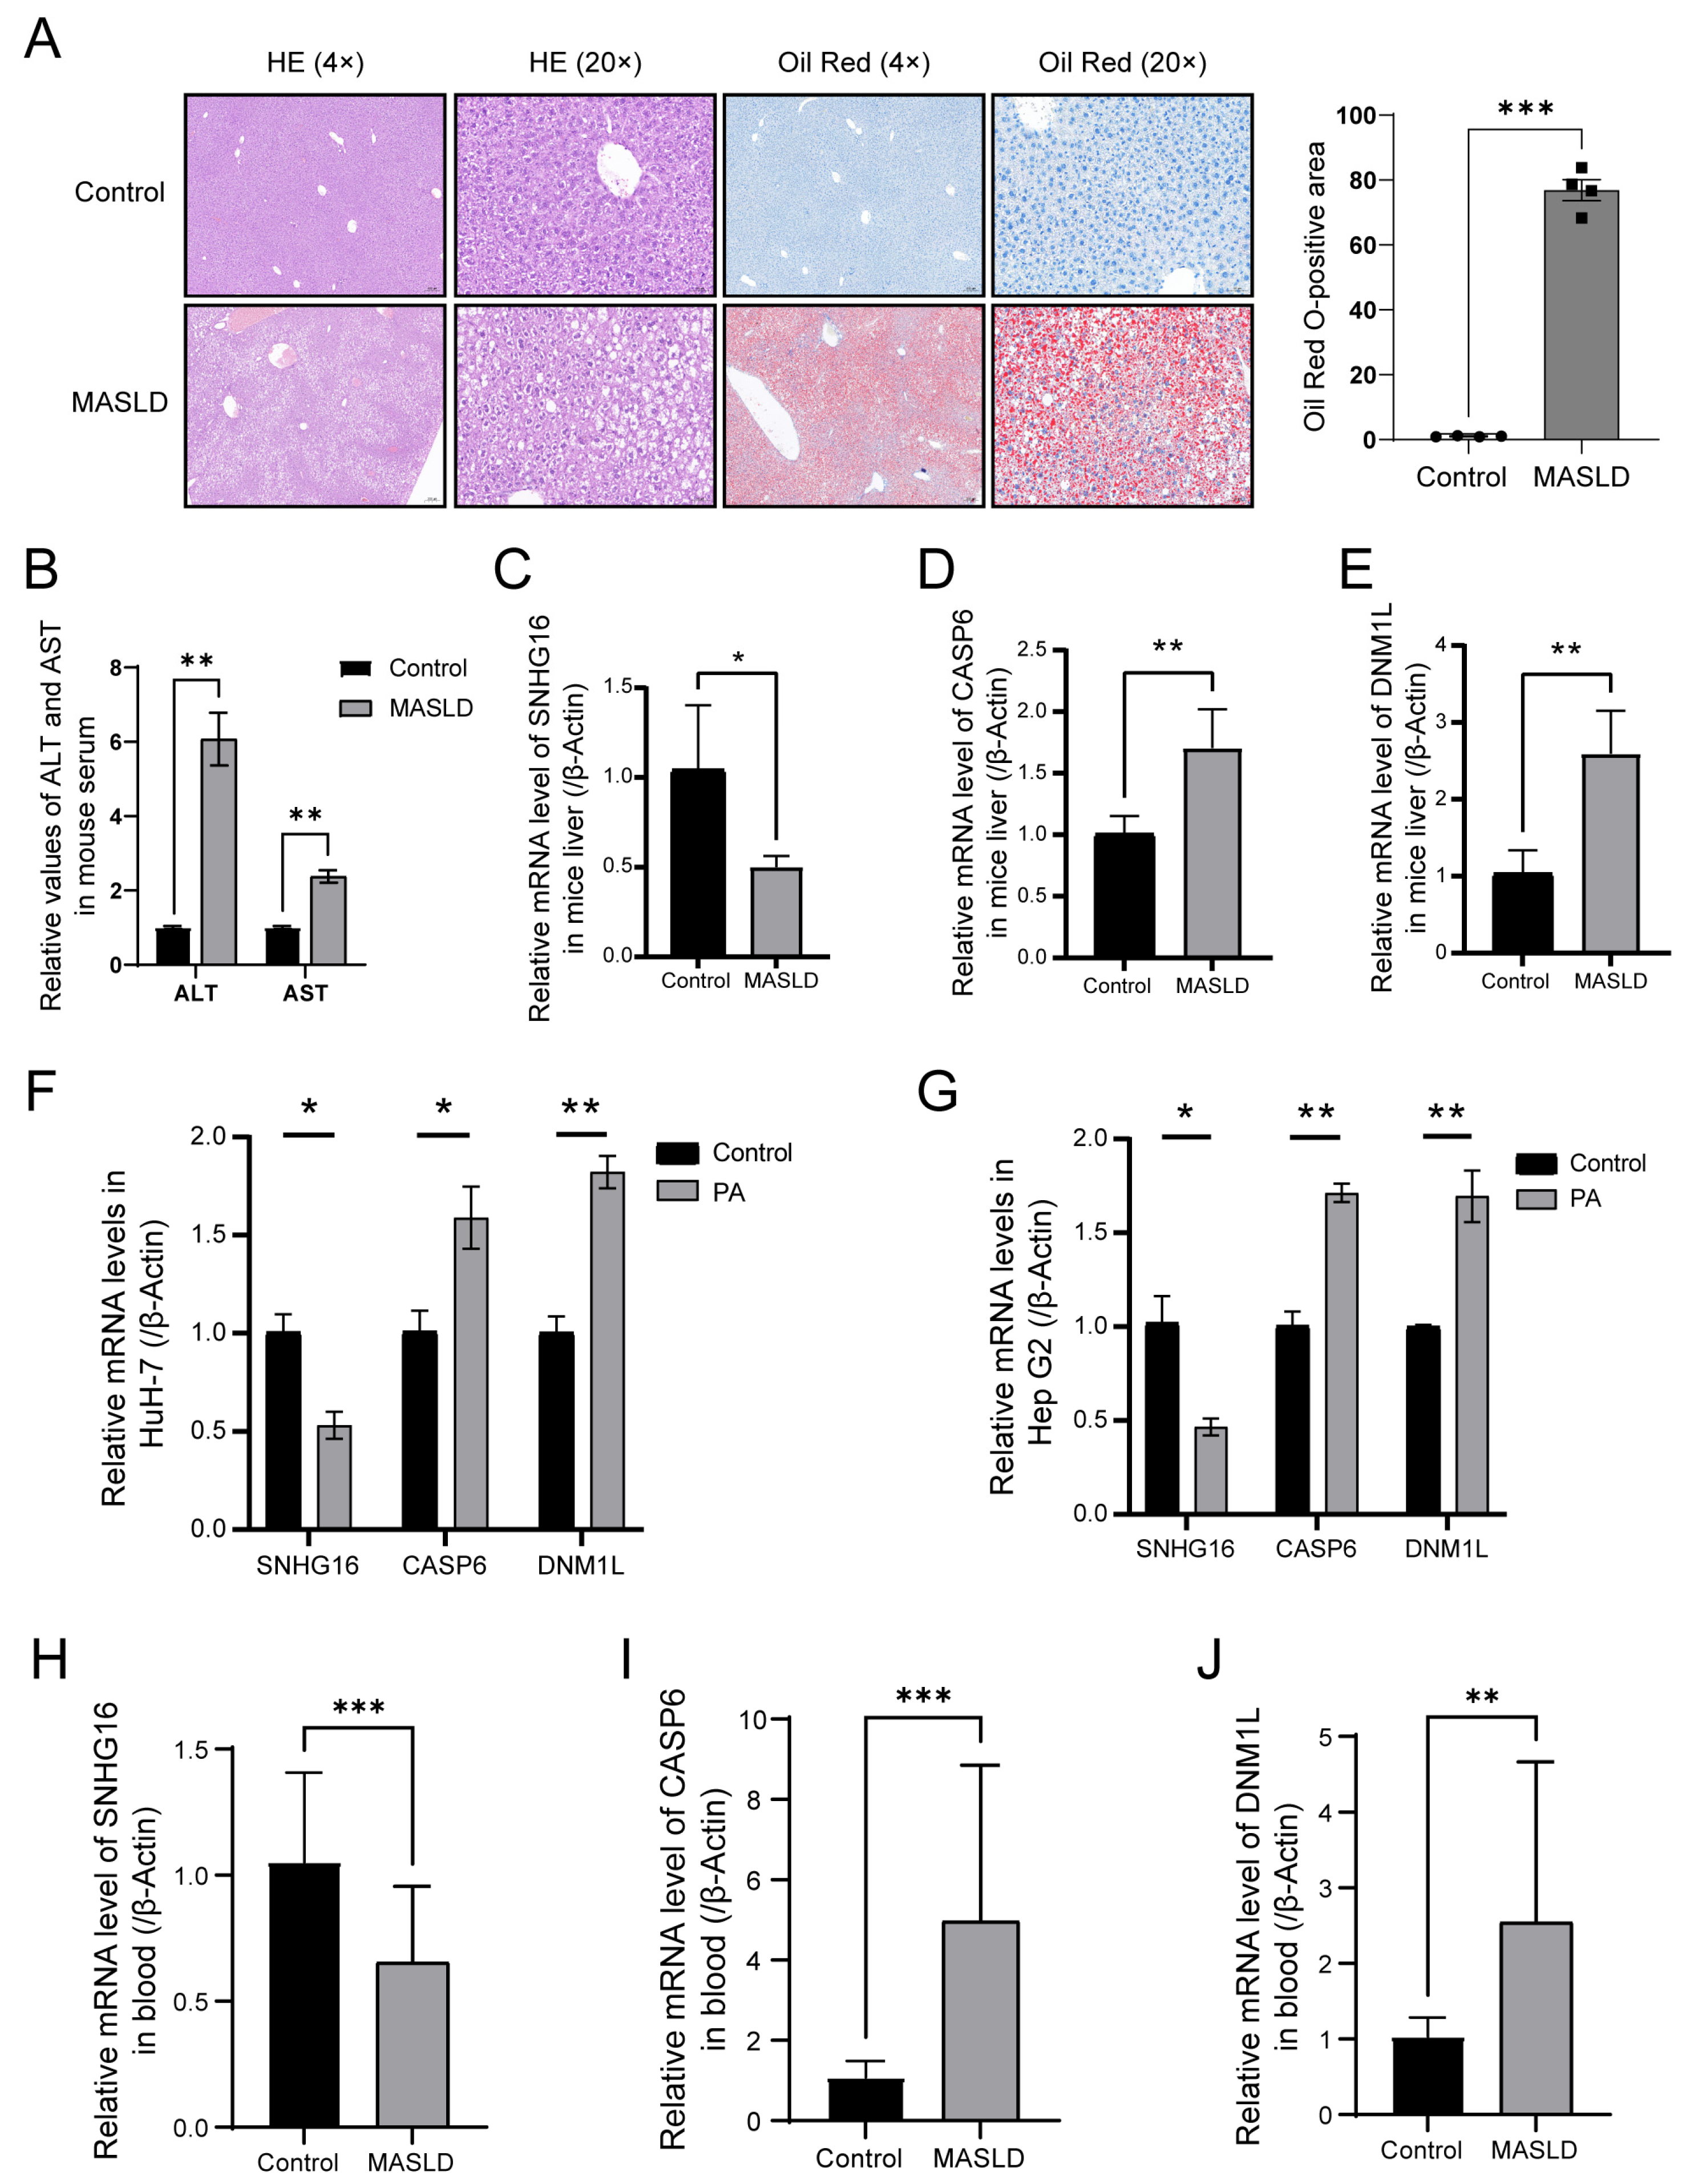
3.10. Experimental Validation of the Critical PANoDEGs
4. Discussion
5. Conclusions
Supplementary Materials
Author Contributions
Funding
Institutional Review Board Statement
Informed Consent Statement
Data Availability Statement
Acknowledgments
Conflicts of Interest
Abbreviations
| MASLD | metabolic dysfunction-associated steatotic liver disease |
| NAFLD | non-alcoholic fatty liver disease |
| MASH | metabolic dysfunction-associated steatohepatitis |
| NASH | previously known as nonalcoholic steatohepatitis |
| PCD | programmed cell death |
| AIM2 | absent in melanoma 2 |
| ZBP1 | Z-nucleic-acid binding domain protein 1 |
| ASC | apoptosis-associated speck-like protein containing a C-terminal CARD |
| RIPK3 | receptor-interacting serine/threonine-protein kinase 3 |
| mtDNA | mitochondrial DNA |
| DEGs | differentially expressed genes |
| PANoDEGs | differentially expressed genes associated with PANoptosis |
| ROC | receiver operating characteristic |
| GEO | gene expression omnibus |
| LASSO | least absolute shrinkage and selector operation |
| SVM-RFE | support vector machine–recursive feature elimination |
| Limma | Linear Model of Microarray Data |
| PPI | protein–protein interaction |
| GO | Gene Ontology |
| KEGG | Kyoto Encyclopedia of Genes and Genomes |
| BP | biological process |
| CC | cellular component |
| MF | molecular function |
| STRING | Search Tool for the Retrieval of Interacting Genes |
| AUC | area under curve |
| GSEA | gene set enrichment analysis |
| CTD | comparative toxicogenomics database |
| TFs | transcription factors |
| RT-qPCR | real-time quantitative polymerase chain reaction |
| SNHG16 | small nucleolar RNA host gene 16 |
| CASP6 | Caspase-6 |
| DNM1L | Dynamin-1-like protein |
| DRP1 | Dynamin-related protein 1 |
| PA | palmitic acid |
References
- Lonardo, A.; Byrne, C.D.; Caldwell, S.H.; Cortez-Pinto, H.; Targher, G. Global epidemiology of nonalcoholic fatty liver disease: Meta-analytic assessment of prevalence, incidence, and outcomes. Hepatology 2016, 64, 1388–1389. [Google Scholar] [CrossRef] [PubMed]
- Powell, E.E.; Wong, V.W.; Rinella, M. Non-alcoholic fatty liver disease. Lancet 2021, 397, 2212–2224. [Google Scholar] [CrossRef]
- Chen, V.L.; Kuppa, A.; Oliveri, A.; Chen, Y.; Ponnandy, P.; Patel, P.B.; Palmer, N.D.; Speliotes, E.K. Human genetics of metabolic dysfunction-associated steatotic liver disease: From variants to cause to precision treatment. J. Clin. Investig. 2025, 135, e186424. [Google Scholar] [CrossRef]
- Huang, D.Q.; Wong, V.W.S.; Rinella, M.E.; Boursier, J.; Lazarus, J.V.; Yki-Jarvinen, H.; Loomba, R. Metabolic dysfunction-associated steatotic liver disease in adults. Nat. Rev. Dis. Primers 2025, 11, 14. [Google Scholar] [CrossRef] [PubMed]
- Xu, B.; Jiang, M.; Chu, Y.; Wang, W.; Chen, D.; Li, X.; Zhang, Z.; Zhang, D.; Fan, D.; Nie, Y.; et al. Gasdermin D plays a key role as a pyroptosis executor of non-alcoholic steatohepatitis in humans and mice. J. Hepatol. 2018, 68, 773–782. [Google Scholar] [CrossRef]
- Schwabe, R.F.; Luedde, T. Apoptosis and necroptosis in the liver: A matter of life and death. Nat. Rev. Gastroenterol. Hepatol. 2018, 15, 738–752. [Google Scholar] [CrossRef]
- Pipitone, R.M.; Malvestiti, F.; Pennisi, G.; Jamialahmadi, O.; Dongiovanni, P.; Bertolazzi, G.; Pihlajamäki, J.; Yki-Järvinen, H.; Vespasiani-Gentilucci, U.; Tavaglione, F.; et al. Programmed cell death 1 genetic variant and liver damage in nonalcoholic fatty liver disease. Liver Int. 2023, 43, 1761–1771. [Google Scholar] [CrossRef] [PubMed]
- Wu, X.; Poulsen, K.L.; Sanz-Garcia, C.; Huang, E.; McMullen, M.R.; Roychowdhury, S.; Dasarathy, S.; Nagy, L.E. MLKL-dependent signaling regulates autophagic flux in a murine model of non-alcohol-associated fatty liver and steatohepatitis. J. Hepatol. 2020, 73, 616–627. [Google Scholar] [CrossRef] [PubMed]
- Gao, L.; Shay, C.; Teng, Y. Cell death shapes cancer immunity: Spotlighting PANoptosis. J. Exp. Clin. Cancer Res. 2024, 43, 168. [Google Scholar] [CrossRef]
- Xiang, Q.; Geng, Z.X.; Yi, X.; Wei, X.; Zhu, X.H.; Jiang, D.S. PANoptosis: A novel target for cardiovascular diseases. Trends Pharmacol. Sci. 2024, 45, 739–756. [Google Scholar] [CrossRef]
- Malireddi, R.K.S.; Kesavardhana, S.; Kanneganti, T.D. ZBP1 and TAK1: Master Regulators of NLRP3 Inflammasome/Pyroptosis, Apoptosis, and Necroptosis (PAN-optosis). Front. Cell. Infect. Microbiol. 2019, 9, 406. [Google Scholar] [CrossRef] [PubMed]
- Wang, Y.; Kanneganti, T.D. From pyroptosis, apoptosis and necroptosis to PANoptosis: A mechanistic compendium of programmed cell death pathways. Comput. Struct. Biotechnol. J. 2021, 19, 4641–4657. [Google Scholar] [CrossRef] [PubMed]
- Lee, S.; Karki, R.; Wang, Y.; Nguyen, L.N.; Kalathur, R.C.; Kanneganti, T.D. AIM2 forms a complex with pyrin and ZBP1 to drive PANoptosis and host defence. Nature 2021, 597, 415–419. [Google Scholar] [CrossRef] [PubMed]
- Xu, L.; Zhou, J.; Che, J.; Wang, H.; Yang, W.; Zhou, W.; Zhao, H. Mitochondrial DNA enables AIM2 inflammasome activation and hepatocyte pyroptosis in nonalcoholic fatty liver disease. Am. J. Physiol. Gastrointest. Liver Physiol. 2021, 320, G1034–G1044. [Google Scholar] [CrossRef]
- de Carvalho Ribeiro, M.; Szabo, G. Role of the Inflammasome in Liver Disease. Annu. Rev. Pathol. 2022, 17, 345–365. [Google Scholar] [CrossRef]
- Kaufmann, B.; Kui, L.; Reca, A.; Leszczynska, A.; Kim, A.D.; Booshehri, L.M.; Wree, A.; Friess, H.; Hartmann, D.; Broderick, L.; et al. Cell-specific Deletion of NLRP3 Inflammasome Identifies Myeloid Cells as Key Drivers of Liver Inflammation and Fibrosis in Murine Steatohepatitis. Cell. Mol. Gastroenterol. Hepatol. 2022, 14, 751–767. [Google Scholar] [CrossRef]
- Afonso, M.B.; Rodrigues, P.M.; Mateus-Pinheiro, M.; Simão, A.L.; Gaspar, M.M.; Majdi, A.; Arretxe, E.; Alonso, C.; Santos-Laso, A.; Jimenez-Agüero, R.; et al. RIPK3 acts as a lipid metabolism regulator contributing to inflammation and carcinogenesis in non-alcoholic fatty liver disease. Gut 2021, 70, 2359–2372. [Google Scholar] [CrossRef]
- Reyes-Avendaño, I.; Villaseñor-Altamirano, A.B.; Reyes-Jimenez, E.; Velazquez-Enriquez, J.M.; Baltiérrez-Hoyos, R.; Piña-Vázquez, C.; Muriel, P.; Villa-Treviño, S.; Arellanes-Robledo, J.; Vásquez-Garzón, V.R. Identification of key markers for the stages of nonalcoholic fatty liver disease: An integrated bioinformatics analysis and experimental validation. Dig. Liver Dis. 2024, 56, 1887–1896. [Google Scholar] [CrossRef]
- Zheng, Z.; Li, K.; Yang, Z.; Wang, X.; Shen, C.; Zhang, Y.; Lu, H.; Yin, Z.; Sha, M.; Ye, J.; et al. Transcriptomic analysis reveals molecular characterization and immune landscape of PANoptosis-related genes in atherosclerosis. Inflamm. Res. 2024, 73, 961–978. [Google Scholar] [CrossRef]
- Stefan, N.; Haring, H.U.; Cusi, K. Non-alcoholic fatty liver disease: Causes, diagnosis, cardiometabolic consequences, and treatment strategies. Lancet Diabetes Endocrinol. 2019, 7, 313–324. [Google Scholar] [CrossRef]
- Cao, Y.; Deng, Y.; Wang, J.; Zhao, H.; Zhang, J.; Xie, W. The association between NAFLD and risk of chronic kidney disease: A cross-sectional study. Ther. Adv. Chronic Dis. 2021, 12, 20406223211048649. [Google Scholar] [CrossRef] [PubMed]
- Kim, K.S.; Hong, S.; Han, K.; Park, C.Y. Association of non-alcoholic fatty liver disease with cardiovascular disease and all cause death in patients with type 2 diabetes mellitus: Nationwide population based study. BMJ 2024, 384, e076388. [Google Scholar] [CrossRef] [PubMed]
- Le, M.H.; Le, D.M.; Baez, T.C.; Dang, H.; Nguyen, V.H.; Lee, K.; Stave, C.D.; Ito, T.; Wu, Y.; Yeo, Y.H.; et al. Global incidence of adverse clinical events in non-alcoholic fatty liver disease: A systematic review and meta-analysis. Clin. Mol. Hepatol. 2024, 30, 235–246. [Google Scholar] [CrossRef]
- Ma, Z.; Xie, K.; Xue, X.; Li, J.; Yang, Y.; Wu, J.; Li, Y.; Li, X. Si-Wu-Tang attenuates hepatocyte PANoptosis and M1 polarization of macrophages in non-alcoholic fatty liver disease by influencing the intercellular transfer of mtDNA. J. Ethnopharmacol. 2024, 328, 118057. [Google Scholar] [CrossRef] [PubMed]
- Tan, P.; Xu, M.; Nie, J.; Qin, J.; Liu, X.; Sun, H.; Wang, S.; Pan, Y. LncRNA SNHG16 promotes colorectal cancer proliferation by regulating ABCB1 expression through sponging miR-214-3p. J. Biomed. Res. 2022, 36, 231–241. [Google Scholar] [CrossRef]
- Xu, Z.; Sun, Y.; Wang, D.; Sun, H.; Liu, X. SNHG16 promotes tumorigenesis and cisplatin resistance by regulating miR-338-3p/PLK4 pathway in neuroblastoma cells. Cancer Cell Int. 2020, 20, 236. [Google Scholar] [CrossRef]
- Cheng, T.; Gu, M.L.; Xu, W.Q.; Ye, D.W.; Zha, Z.Y.; Fang, W.G.; Mao, L.K.; Ning, J.; Hu, X.B.; Ding, Y.H. Mechanism of lncRNA SNHG16 on kidney clear cell carcinoma cells by targeting miR-506-3p/ETS1/RAS/ERK molecular axis. Heliyon 2024, 10, e30388. [Google Scholar] [CrossRef]
- Xiao, X.; Jiang, G.; Zhang, S.; Hu, S.; Fan, Y.; Li, G.; Yu, H.; He, S. LncRNA SNHG16 contributes to osteosarcoma progression by acting as a ceRNA of miR-1285-3p. BMC Cancer 2021, 21, 355. [Google Scholar] [CrossRef]
- Lin, Q.; Zheng, H.; Xu, J.; Zhang, F.; Pan, H. LncRNA SNHG16 aggravates tumorigenesis and development of hepatocellular carcinoma by sponging miR-4500 and targeting STAT3. J. Cell. Biochem. 2019, 120, 11604–11615. [Google Scholar] [CrossRef]
- Zhong, J.H.; Xiang, X.; Wang, Y.Y.; Liu, X.; Qi, L.N.; Luo, C.P.; Wei, W.E.; You, X.M.; Ma, L.; Xiang, B.D.; et al. The lncRNA SNHG16 affects prognosis in hepatocellular carcinoma by regulating p62 expression. J. Cell. Physiol. 2020, 235, 1090–1102. [Google Scholar] [CrossRef]
- Hu, Y.L.; Feng, Y.; Chen, Y.Y.; Liu, J.Z.; Su, Y.; Li, P.; Huang, H.; Mao, Q.S.; Xue, W.J. SNHG16/miR-605-3p/TRAF6/NF-κB feedback loop regulates hepatocellular carcinoma metastasis. J. Cell. Mol. Med. 2020, 24, 7637–7651. [Google Scholar] [CrossRef] [PubMed]
- Jing, Z.; Ye, X.; Ma, X.; Hu, X.; Yang, W.; Shi, J.; Chen, G.; Gong, L. SNGH16 regulates cell autophagy to promote Sorafenib Resistance through suppressing miR-23b-3p via sponging EGR1 in hepatocellular carcinoma. Cancer Med. 2020, 9, 4324–4338. [Google Scholar] [CrossRef]
- Ye, J.; Zhang, R.; Du, X.; Chai, W.; Zhou, Q. Long noncoding RNA SNHG16 induces sorafenib resistance in hepatocellular carcinoma cells through sponging miR-140-5p. OncoTargets Ther. 2019, 12, 415–422. [Google Scholar] [CrossRef] [PubMed]
- Qi, L.; Wang, L.; Jin, M.; Jiang, M.; Li, L.; Li, Y. Caspase-6 is a key regulator of cross-talk signal way in PANoptosis in cancer. Immunology 2023, 169, 245–259. [Google Scholar] [CrossRef] [PubMed]
- Zheng, M.; Karki, R.; Vogel, P.; Kanneganti, T.D. Caspase-6 Is a Key Regulator of Innate Immunity, Inflammasome Activation, and Host Defense. Cell 2020, 181, 674–687.e13. [Google Scholar] [CrossRef]
- Wang, L.; Dong, W.; Gao, H.; Chen, C.; Liang, S.; Ye, X.; Liu, Y.; Hou, Y.; Fan, L.; Pan, T.; et al. A non-mitogenic FGF4 analog alleviates non-alcoholic steatohepatitis through an AMPK-dependent pathway. Biochim. Et Biophys. Acta Mol. Basis Dis. 2022, 1868, 166560. [Google Scholar] [CrossRef]
- Li, J.; Chen, C.; Zhang, W.; Bi, J.; Yang, G.; Li, E. Salsalate reverses metabolic disorders in a mouse model of non-alcoholic fatty liver disease through AMPK activation and caspase-6 activity inhibition. Basic Clin. Pharmacol. Toxicol. 2021, 128, 394–409. [Google Scholar] [CrossRef]
- Zeng, Z.; You, M.; Fan, C.; Rong, R.; Li, H.; Xia, X. Pathologically high intraocular pressure induces mitochondrial dysfunction through Drp1 and leads to retinal ganglion cell PANoptosis in glaucoma. Redox Biol. 2023, 62, 102687. [Google Scholar] [CrossRef]
- Steffen, J.; Ngo, J.; Wang, S.P.; Williams, K.; Kramer, H.F.; Ho, G.; Rodriguez, C.; Yekkala, K.; Amuzie, C.; Bialecki, R.; et al. The mitochondrial fission protein Drp1 in liver is required to mitigate NASH and prevents the activation of the mitochondrial ISR. Mol. Metab. 2022, 64, 101566. [Google Scholar] [CrossRef]
- Zhang, L.; Xie, X.; Tao, J.; Wang, S.; Hu, M.; Wang, X.; Yu, Z.; Xu, L.; Lin, Y.; Wu, W.; et al. Mystery of bisphenol F-induced nonalcoholic fatty liver disease-like changes: Roles of Drp1-mediated abnormal mitochondrial fission in lipid droplet deposition. Sci. Total Environ. 2023, 904, 166831. [Google Scholar] [CrossRef]
- Zhong, Y.; Li, Z.; Jin, R.; Yao, Y.; He, S.; Lei, M.; Wang, X.; Shi, C.; Gao, L.; Peng, X. Diosgenin Ameliorated Type II Diabetes-Associated Nonalcoholic Fatty Liver Disease through Inhibiting De Novo Lipogenesis and Improving Fatty Acid Oxidation and Mitochondrial Function in Rats. Nutrients 2022, 14, 4994. [Google Scholar] [CrossRef] [PubMed]
- Hu, Z.; Zhang, H.; Wang, Y.; Li, B.; Liu, K.; Ran, J.; Li, L. Exercise activates Sirt1-mediated Drp1 acetylation and inhibits hepatocyte apoptosis to improve nonalcoholic fatty liver disease. Lipids Health Dis. 2023, 22, 33. [Google Scholar] [CrossRef] [PubMed]
- Huby, T.; Gautier, E.L. Immune cell-mediated features of non-alcoholic steatohepatitis. Nat. Rev. Immunol. 2022, 22, 429–443. [Google Scholar] [CrossRef]
- Kazankov, K.; Jørgensen, S.M.D.; Thomsen, K.L.; Møller, H.J.; Vilstrup, H.; George, J.; Schuppan, D.; Grønbæk, H. The role of macrophages in nonalcoholic fatty liver disease and nonalcoholic steatohepatitis. Nat. Rev. Gastroenterol. Hepatol. 2019, 16, 145–159. [Google Scholar] [CrossRef] [PubMed]
- Loomba, R.; Friedman, S.L.; Shulman, G.I. Mechanisms and disease consequences of nonalcoholic fatty liver disease. Cell 2021, 184, 2537–2564. [Google Scholar] [CrossRef]
- Barreby, E.; Chen, P.; Aouadi, M. Macrophage functional diversity in NAFLD—More than inflammation. Nat. Rev. Endocrinol. 2022, 18, 461–472. [Google Scholar] [CrossRef]
- Li, Z.; Wang, S.; Xu, Q.; Su, X.; Wang, Y.; Wang, L.; Zhang, Y. The double roles of T cell-mediated immune response in the progression of MASLD. Biomed. Pharmacother.=Biomed. Pharmacother. 2024, 173, 116333. [Google Scholar] [CrossRef]
- Liu, J.; Ding, M.; Bai, J.; Luo, R.; Liu, R.; Qu, J.; Li, X. Decoding the role of immune T cells: A new territory for improvement of metabolic-associated fatty liver disease. iMeta 2023, 2, e76. [Google Scholar] [CrossRef]
- Ramadori, P.; Kam, S.; Heikenwalder, M. T cells: Friends and foes in NASH pathogenesis and hepatocarcinogenesis. Hepatology 2022, 75, 1038–1049. [Google Scholar] [CrossRef]
- Deng, C.J.; Lo, T.H.; Chan, K.Y.; Li, X.; Wu, M.Y.; Xiang, Z.; Wong, C.M. Role of B Lymphocytes in the Pathogenesis of NAFLD: A 2022 Update. Int. J. Mol. Sci. 2022, 23, 12376. [Google Scholar] [CrossRef]
- Barrow, F.; Khan, S.; Wang, H.; Revelo, X.S. The Emerging Role of B Cells in the Pathogenesis of NAFLD. Hepatology 2021, 74, 2277–2286. [Google Scholar] [CrossRef] [PubMed]
- Amer, J.; Salhab, A.; Noureddin, M.; Doron, S.; Abu-Tair, L.; Ghantous, R.; Mahamid, M.; Safadi, R. Insulin signaling as a potential natural killer cell checkpoint in fatty liver disease. Hepatol. Commun. 2018, 2, 285–298. [Google Scholar] [CrossRef] [PubMed]

| Gene | Species | Forward (5′–3′) | Reverse (5′–3′) | Gene Function (Brief Description) |
|---|---|---|---|---|
| SNHG16 | Human | AGAGACCAAGGAGGGACTGT | TACTGGCACGAGGACAAAGC | SNHG16 (Small Nucleolar RNA Host Gene 16) is a long non-coding RNA. It is involved in regulating gene expression and is associated with processes such as cell proliferation and apoptosis. It may play an important role in diseases like MASLD. |
| Mouse | ATCATGGAAAGGCGTGGTGG | ATCTGCCACTTAGCACACCC | ||
| CASP6 | Human | GCAGATGCCGATTGCTTTGT | GTCTCCTTTGAACAAGCCAGTTA | CASP6 (Caspase-6) is a cysteine protease. It plays a crucial role in apoptosis and the inflammatory response by cleaving specific substrate proteins, thereby promoting the process of programmed cell death. |
| Mouse | CATGACGTACCCGTGGTTCC | AGCCATTCACAGTTTCTCGGT | ||
| DNM1L | Human | AGTGGTGACTTGTCTTCTTCGTAA | TAGCCTGTTTCTCCTTTGTTCCT | DNM1L (Dynamin-1-like protein) participates in intracellular organelle dynamic changes such as mitochondrial fission. It is of great significance for maintaining the normal morphology and function of mitochondria within cells, and its abnormal function may be related to various diseases. |
| Mouse | CCATTATCCTCGCCGTCACT | GCATCAGTACCCGCATCCAT | ||
| β-Actin | Human | CATGTACGTTGCTATCCAGGC | CTCCTTAATGTCACGCACGAT | β-Actin is a constitutively expressed cytoskeletal protein. It is widely present in eukaryotic cells and is often used as an internal reference gene for gene expression analysis. It is involved in various physiological processes of cells, such as cell movement and shape maintenance. |
| Mouse | GGCTGTATTCCCCTCCATCG | CCAGTTGGTAACAATGCCATGT |
Disclaimer/Publisher’s Note: The statements, opinions and data contained in all publications are solely those of the individual author(s) and contributor(s) and not of MDPI and/or the editor(s). MDPI and/or the editor(s) disclaim responsibility for any injury to people or property resulting from any ideas, methods, instructions or products referred to in the content. |
© 2025 by the authors. Licensee MDPI, Basel, Switzerland. This article is an open access article distributed under the terms and conditions of the Creative Commons Attribution (CC BY) license (https://creativecommons.org/licenses/by/4.0/).
Share and Cite
Huang, Y.; Qian, J.; Luan, Z.; Han, J.; Tang, L. Comprehensive Analysis Reveals the Molecular Features and Immune Infiltration of PANoptosis-Related Genes in Metabolic Dysfunction-Associated Steatotic Liver Disease. Biology 2025, 14, 518. https://doi.org/10.3390/biology14050518
Huang Y, Qian J, Luan Z, Han J, Tang L. Comprehensive Analysis Reveals the Molecular Features and Immune Infiltration of PANoptosis-Related Genes in Metabolic Dysfunction-Associated Steatotic Liver Disease. Biology. 2025; 14(5):518. https://doi.org/10.3390/biology14050518
Chicago/Turabian StyleHuang, Yan, Jingyu Qian, Zhengyun Luan, Junling Han, and Limin Tang. 2025. "Comprehensive Analysis Reveals the Molecular Features and Immune Infiltration of PANoptosis-Related Genes in Metabolic Dysfunction-Associated Steatotic Liver Disease" Biology 14, no. 5: 518. https://doi.org/10.3390/biology14050518
APA StyleHuang, Y., Qian, J., Luan, Z., Han, J., & Tang, L. (2025). Comprehensive Analysis Reveals the Molecular Features and Immune Infiltration of PANoptosis-Related Genes in Metabolic Dysfunction-Associated Steatotic Liver Disease. Biology, 14(5), 518. https://doi.org/10.3390/biology14050518