High-Fidelity Transcriptome Reconstruction of Degraded RNA-Seq Samples Using Denoising Diffusion Models
Simple Summary
Abstract
1. Introduction
2. Materials and Methods
2.1. Datasets and Preprocessing
- PBMC3k and PBMC68k Datasets: These two datasets from 10x Genomics (Pleasanton, CA, United States) [11] contain single-cell expression profiles of peripheral blood mononuclear cells (PBMCs) from healthy human donors.
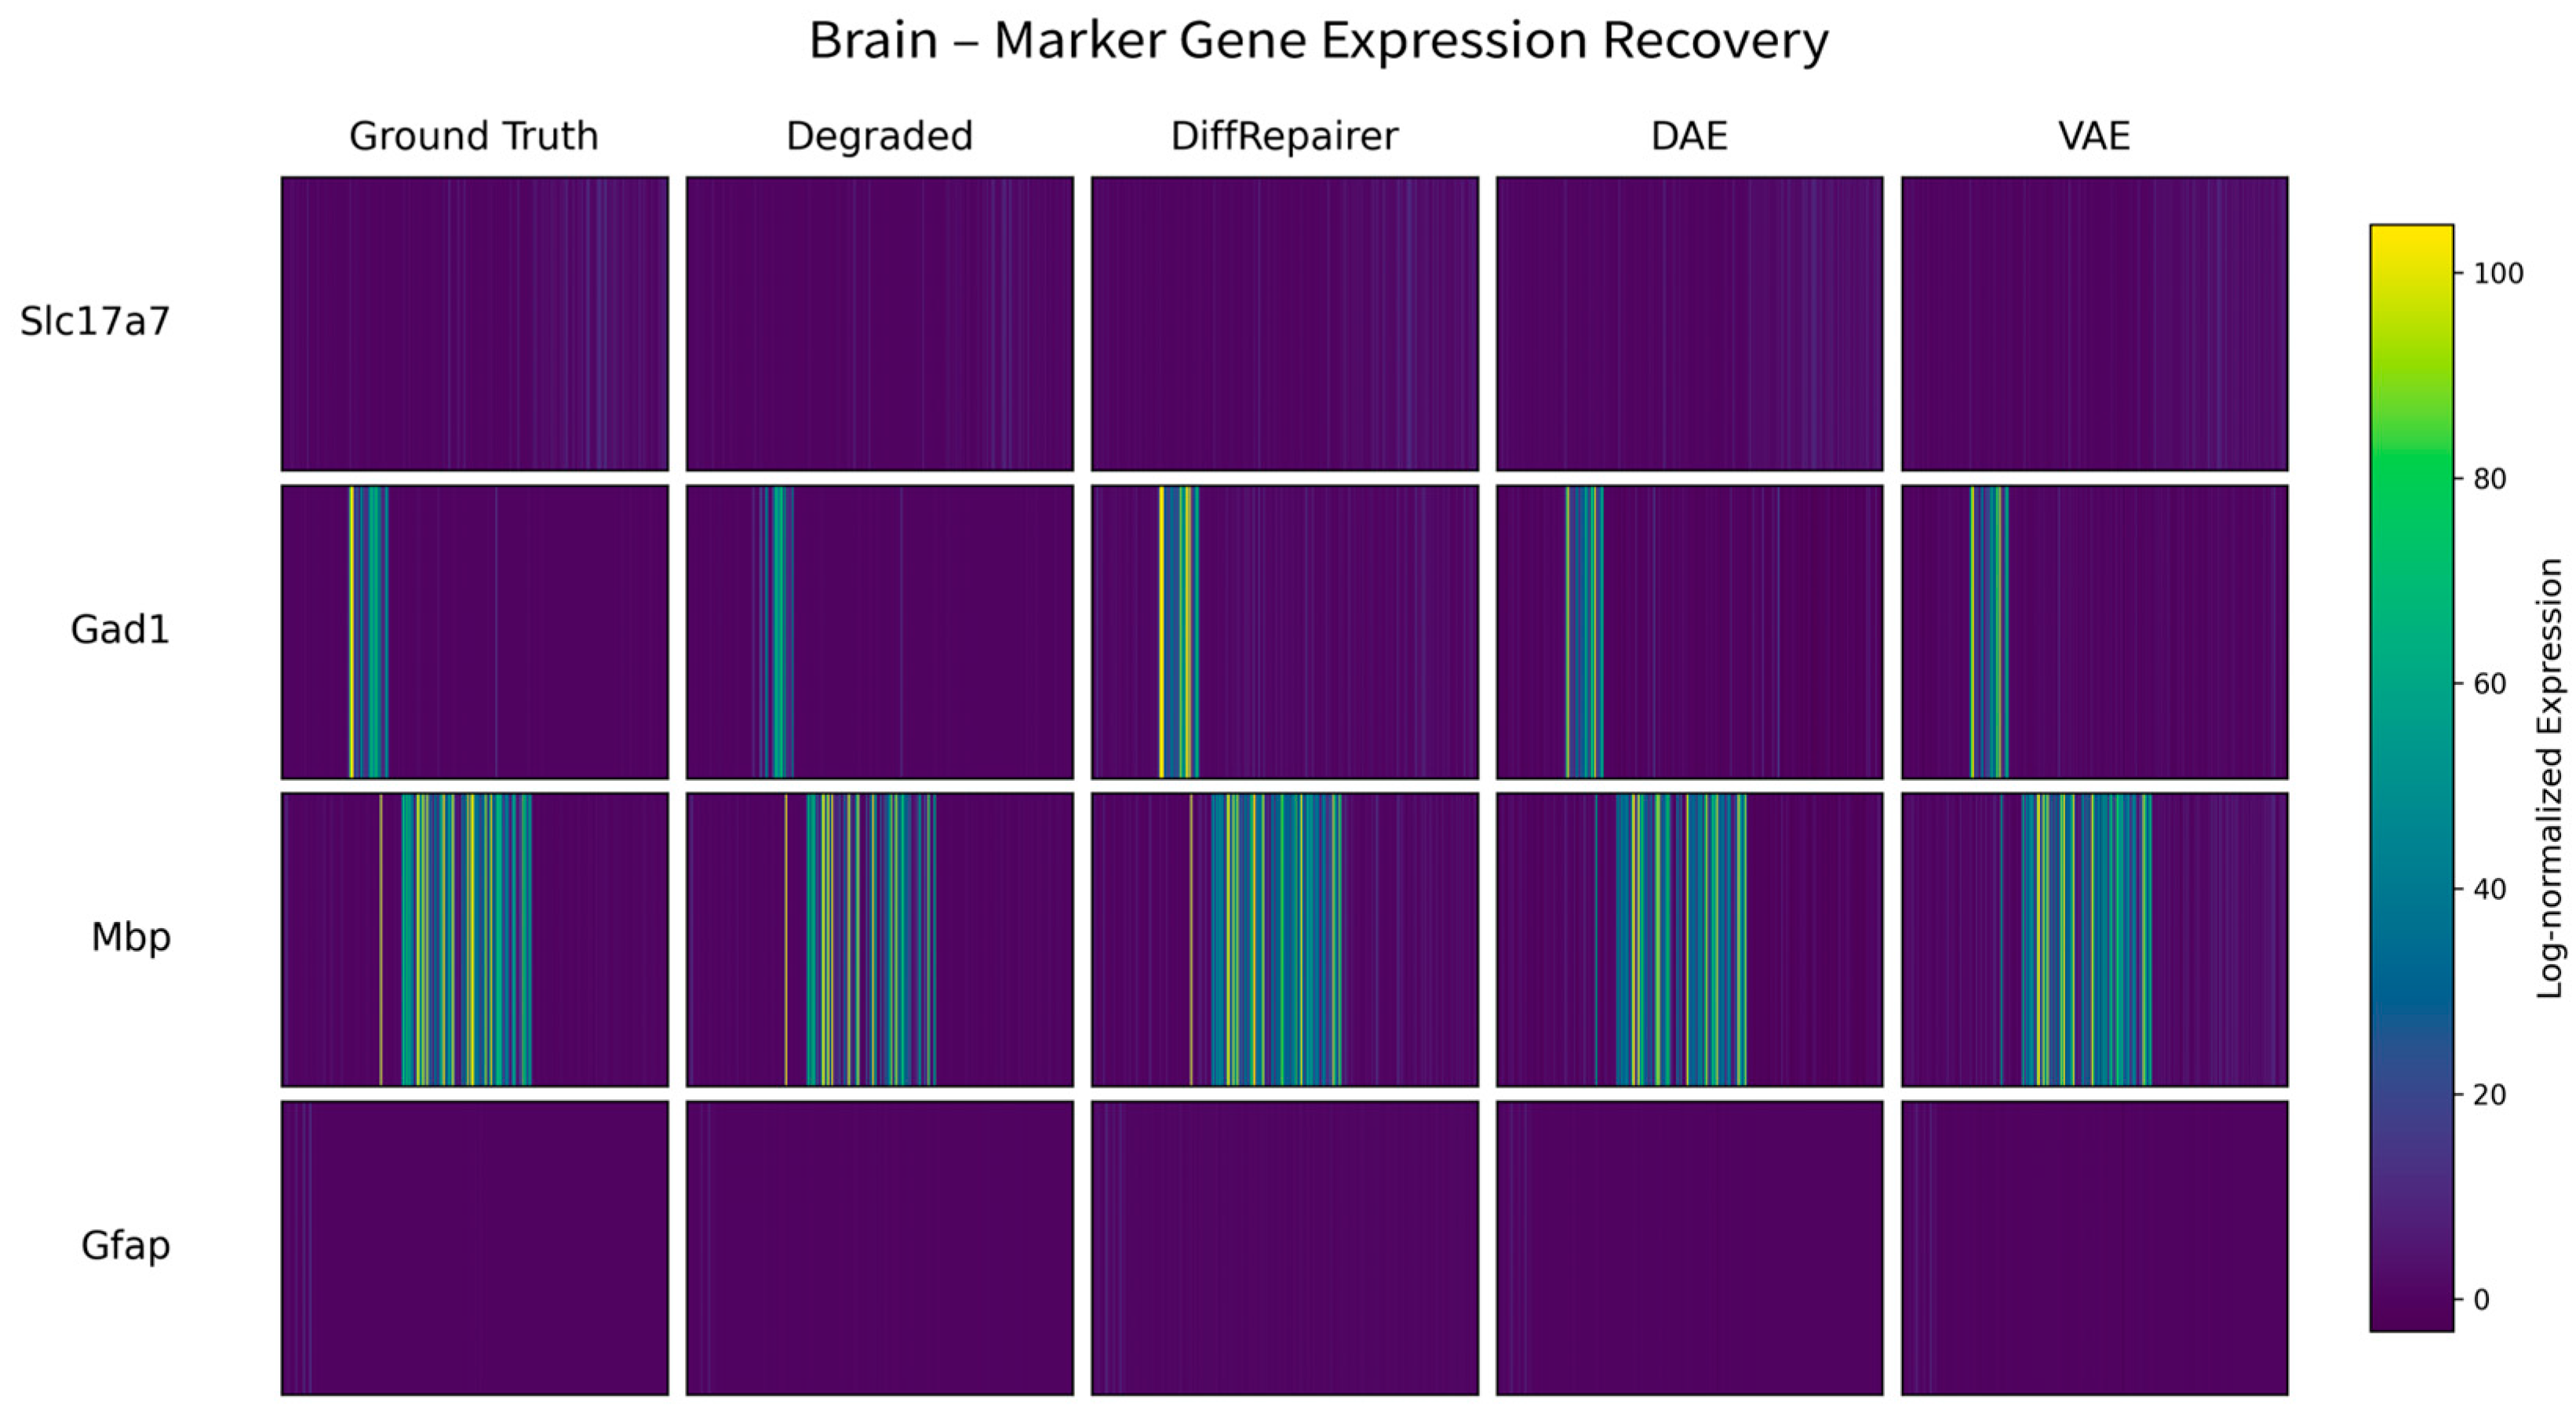
- Brain Dataset: This dataset, from a single-cell RNA-seq study of the mouse brain [12], provides the complex cellular heterogeneity of the nervous system.
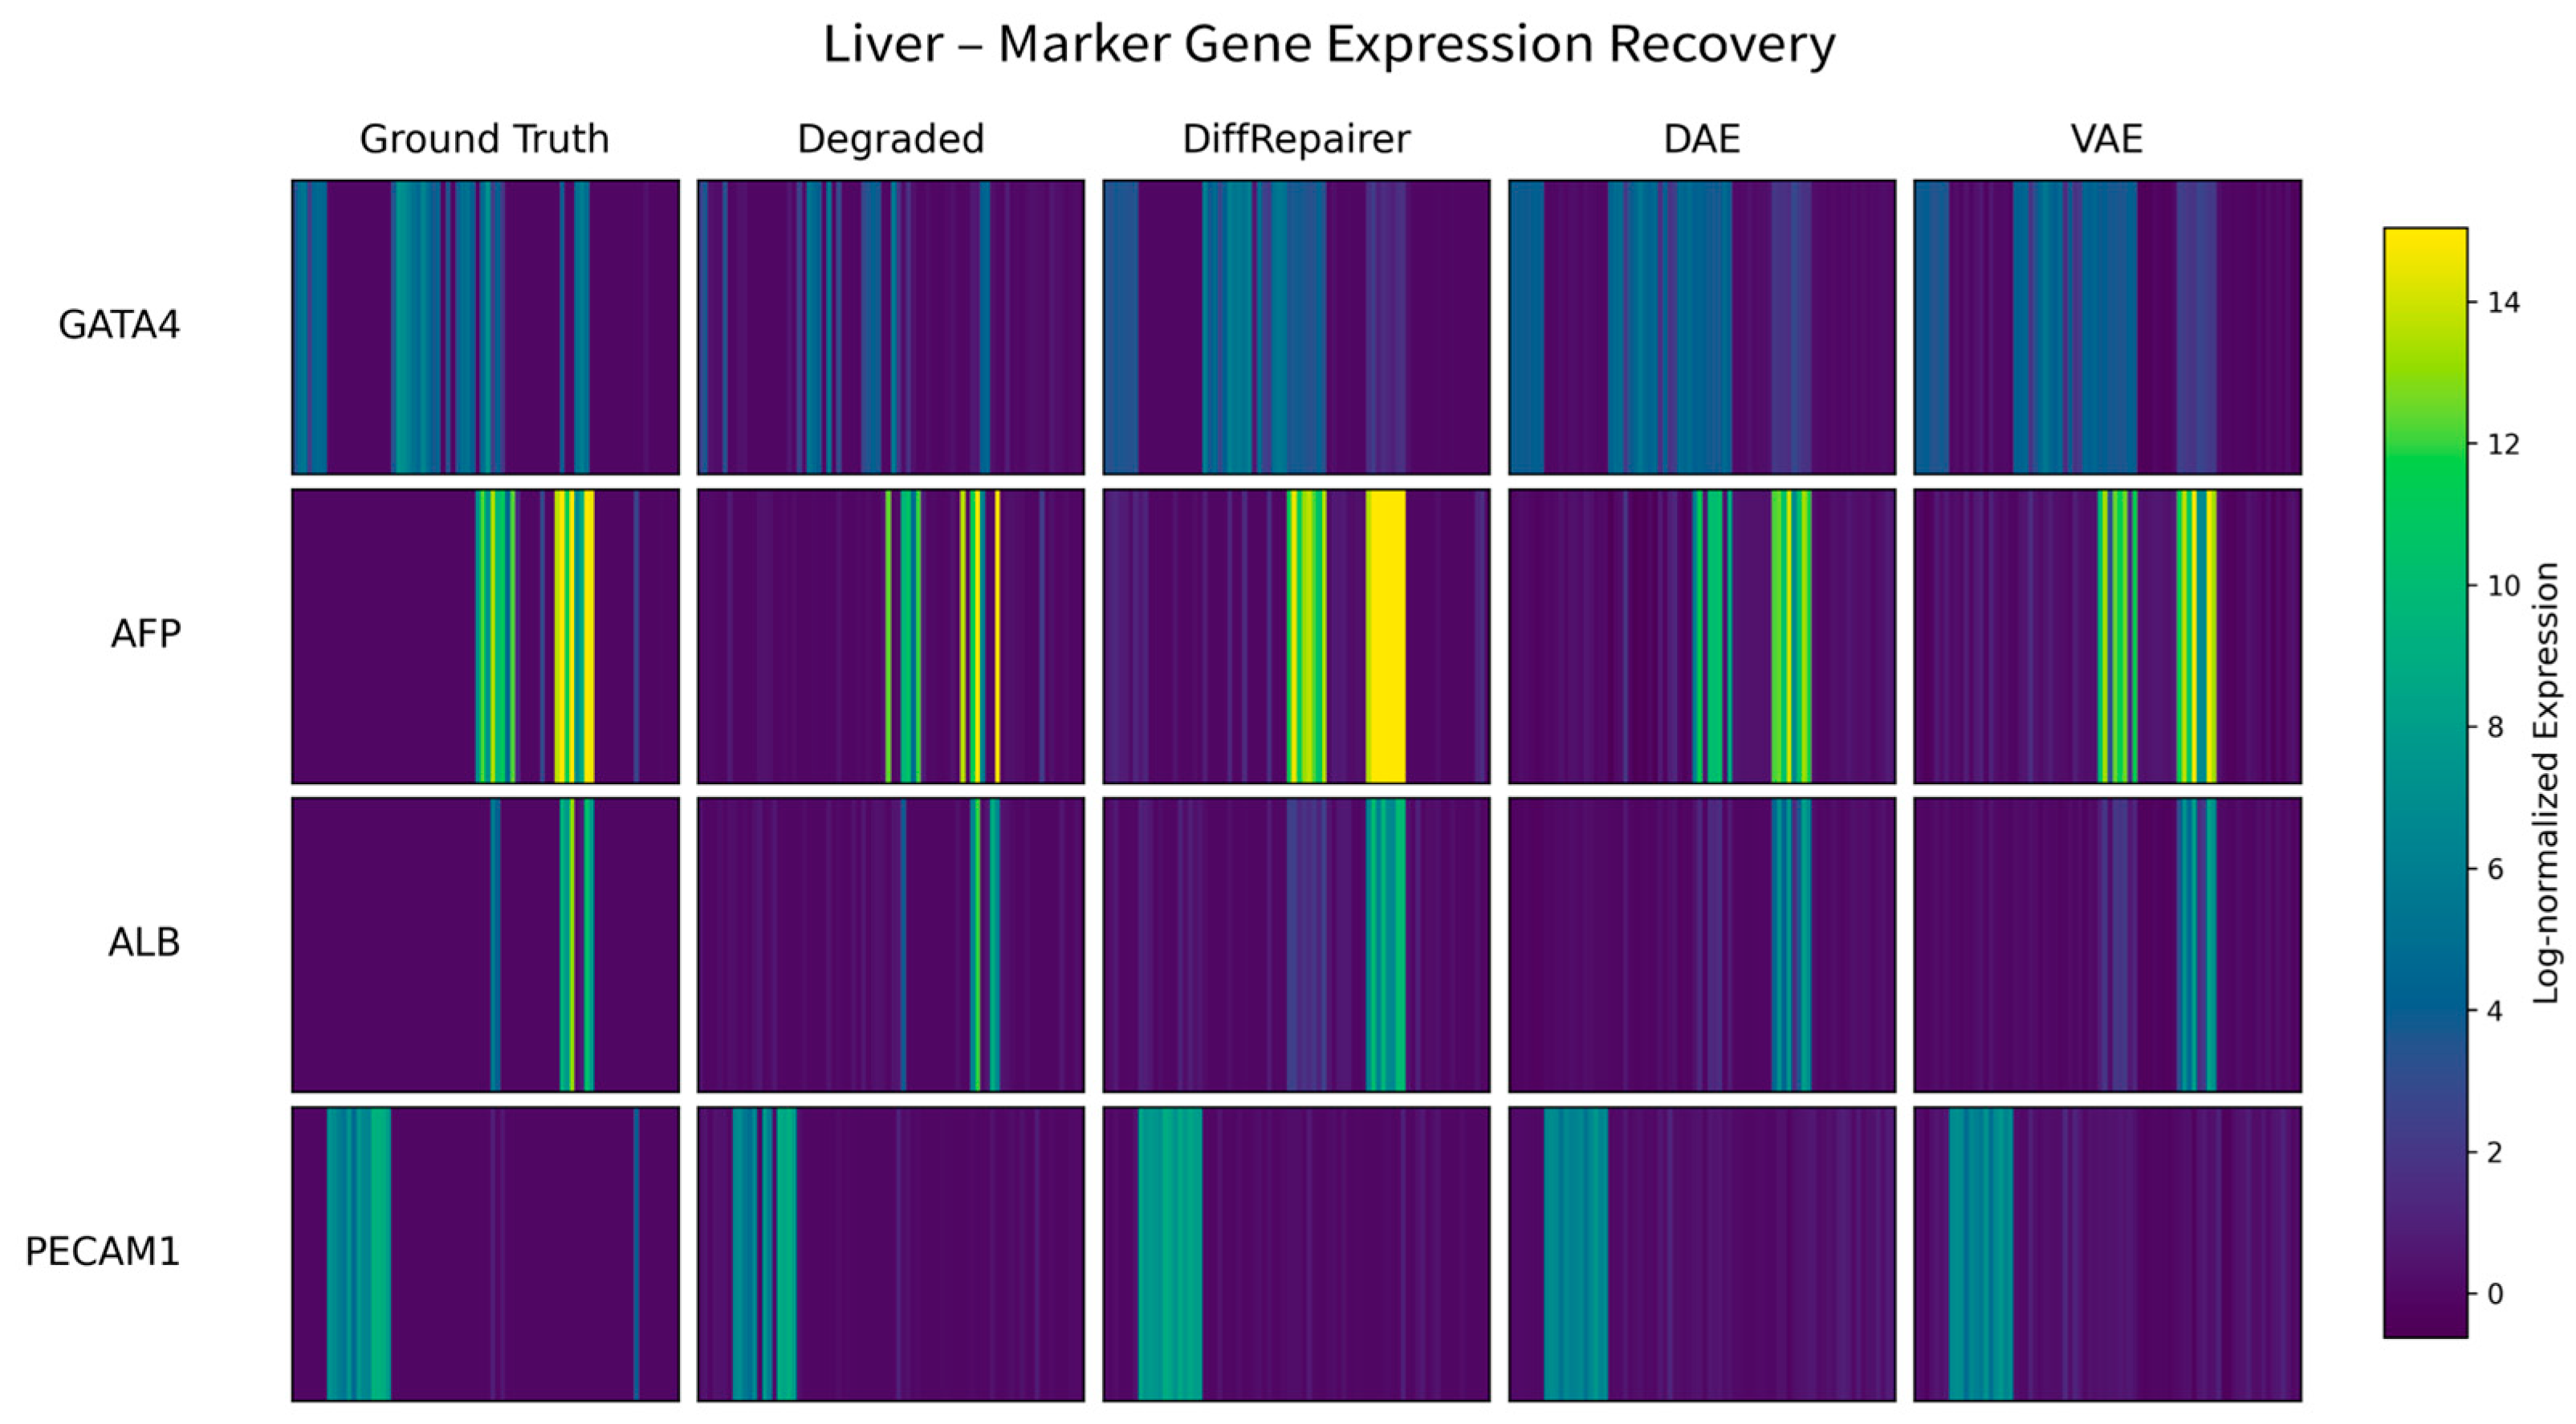
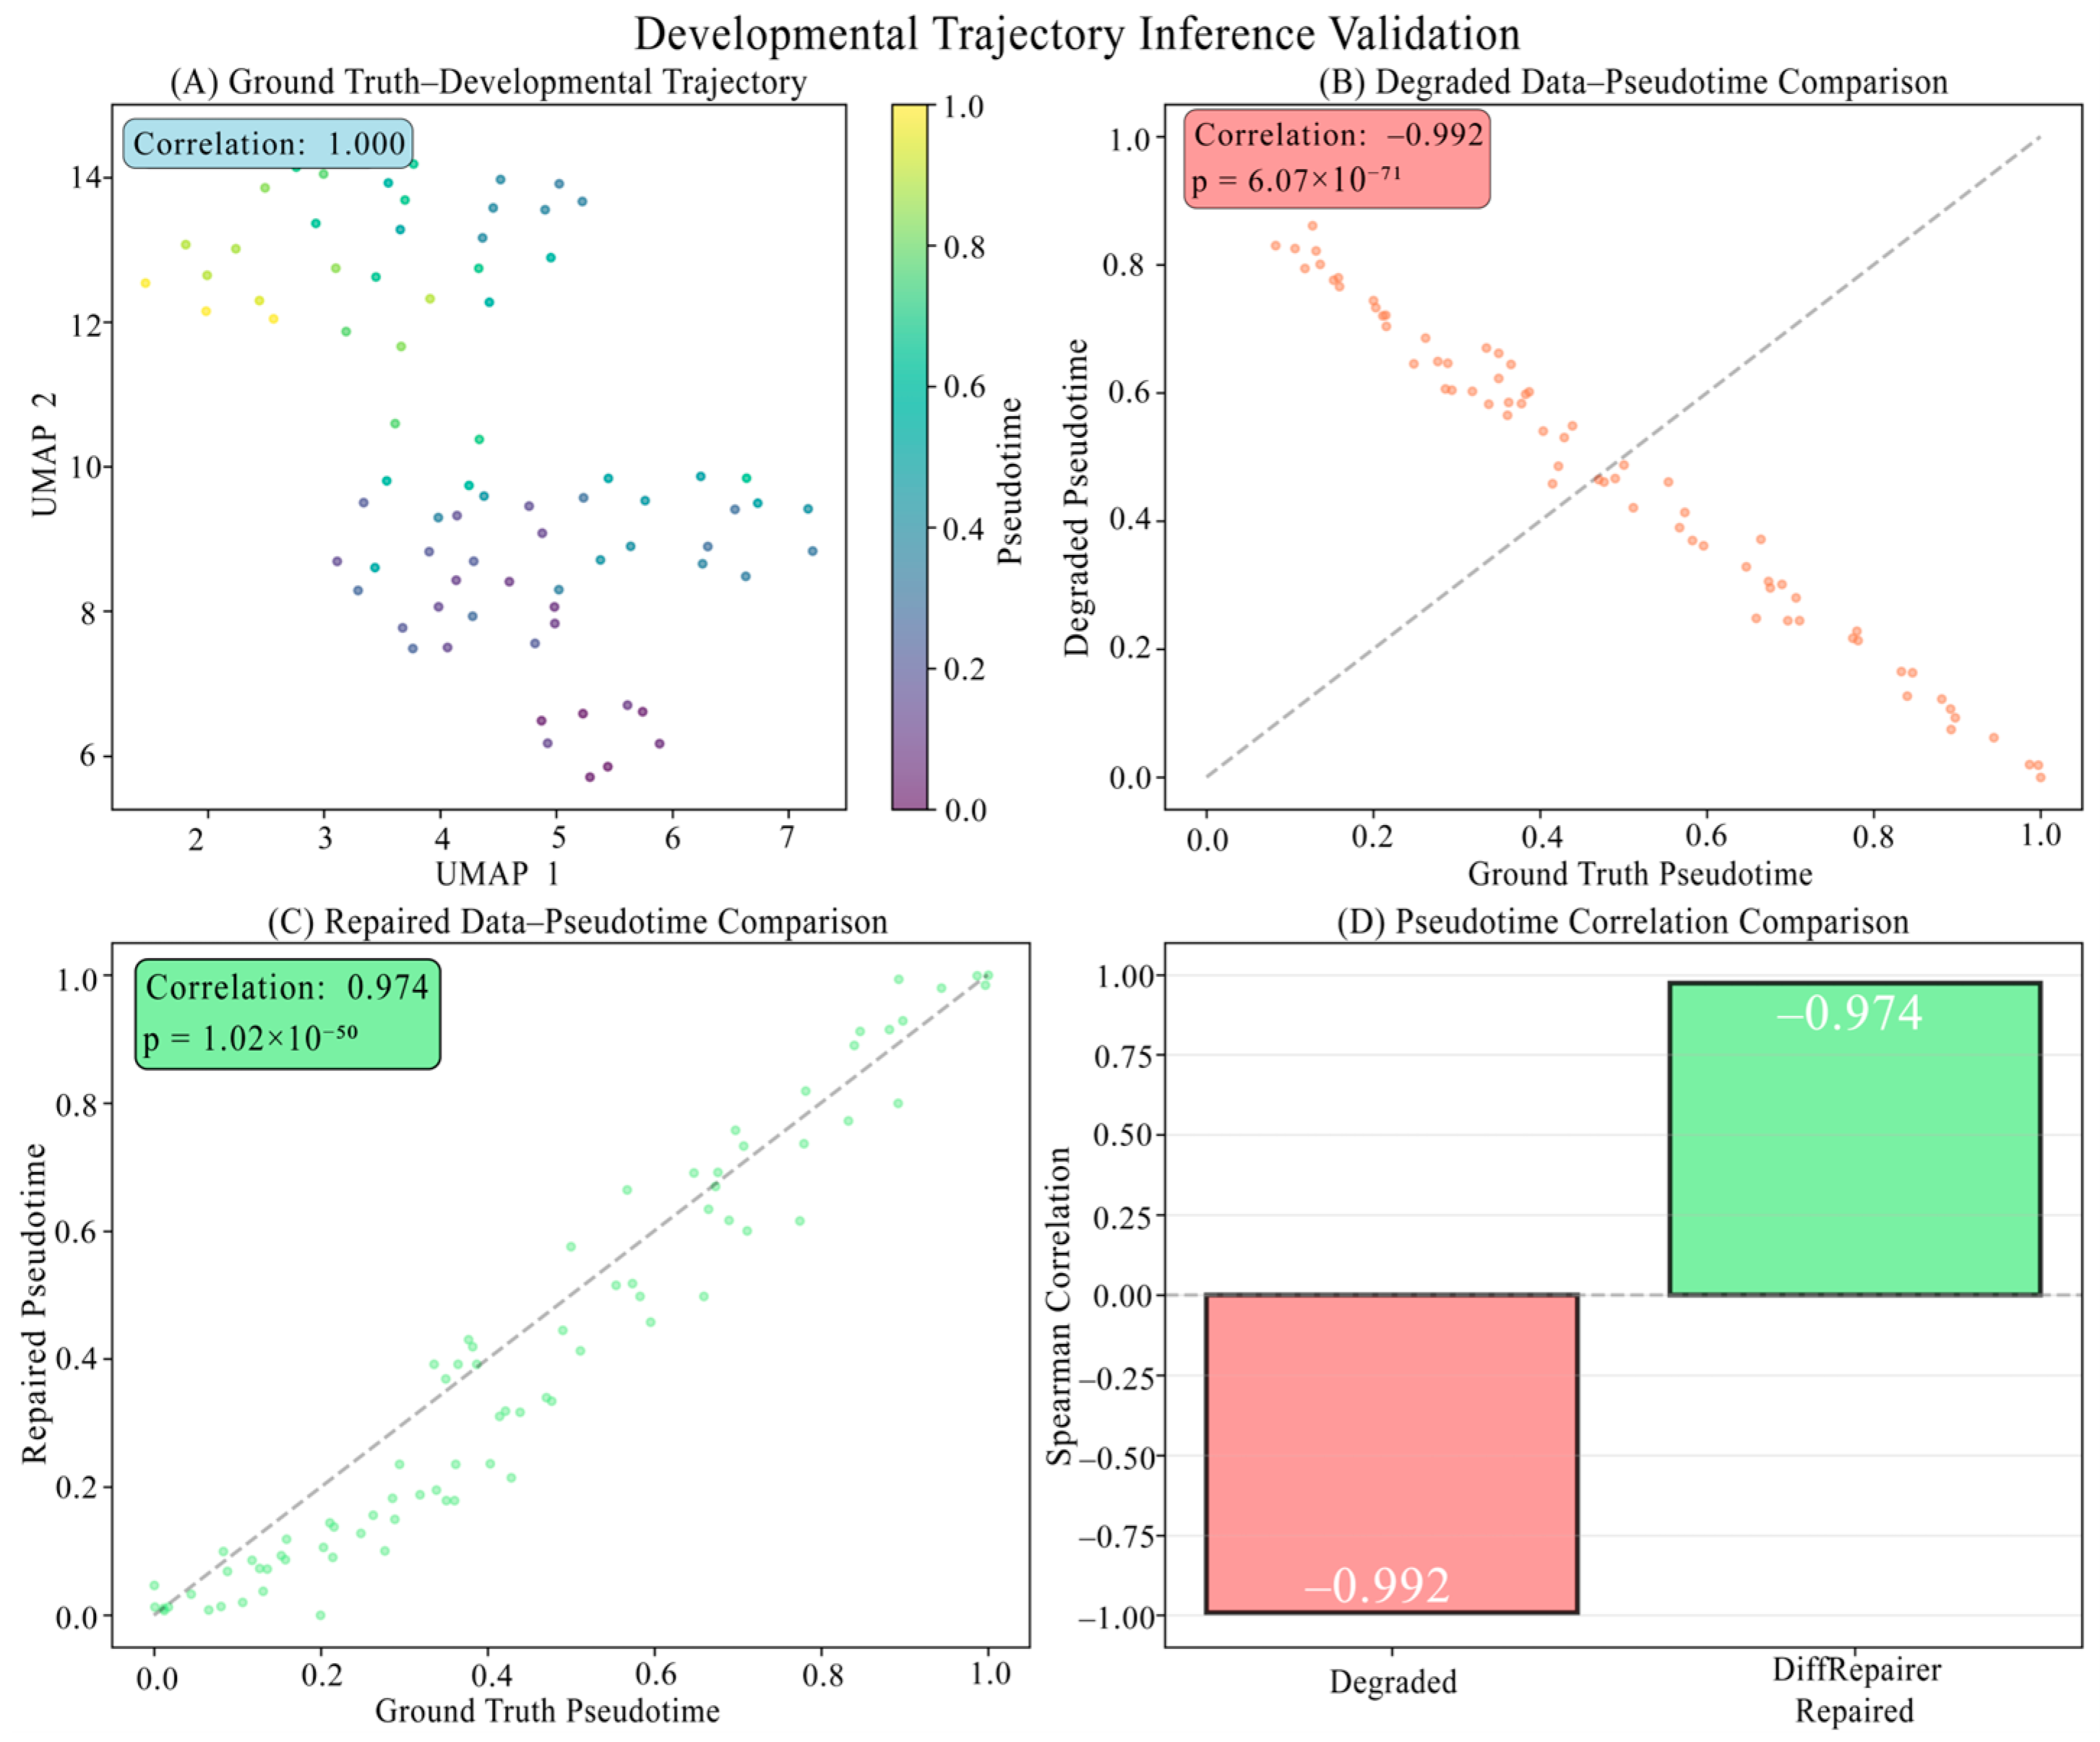
- Liver Dataset: This dataset from a study on the human liver offers high-quality transcriptome data of liver tissue [13].
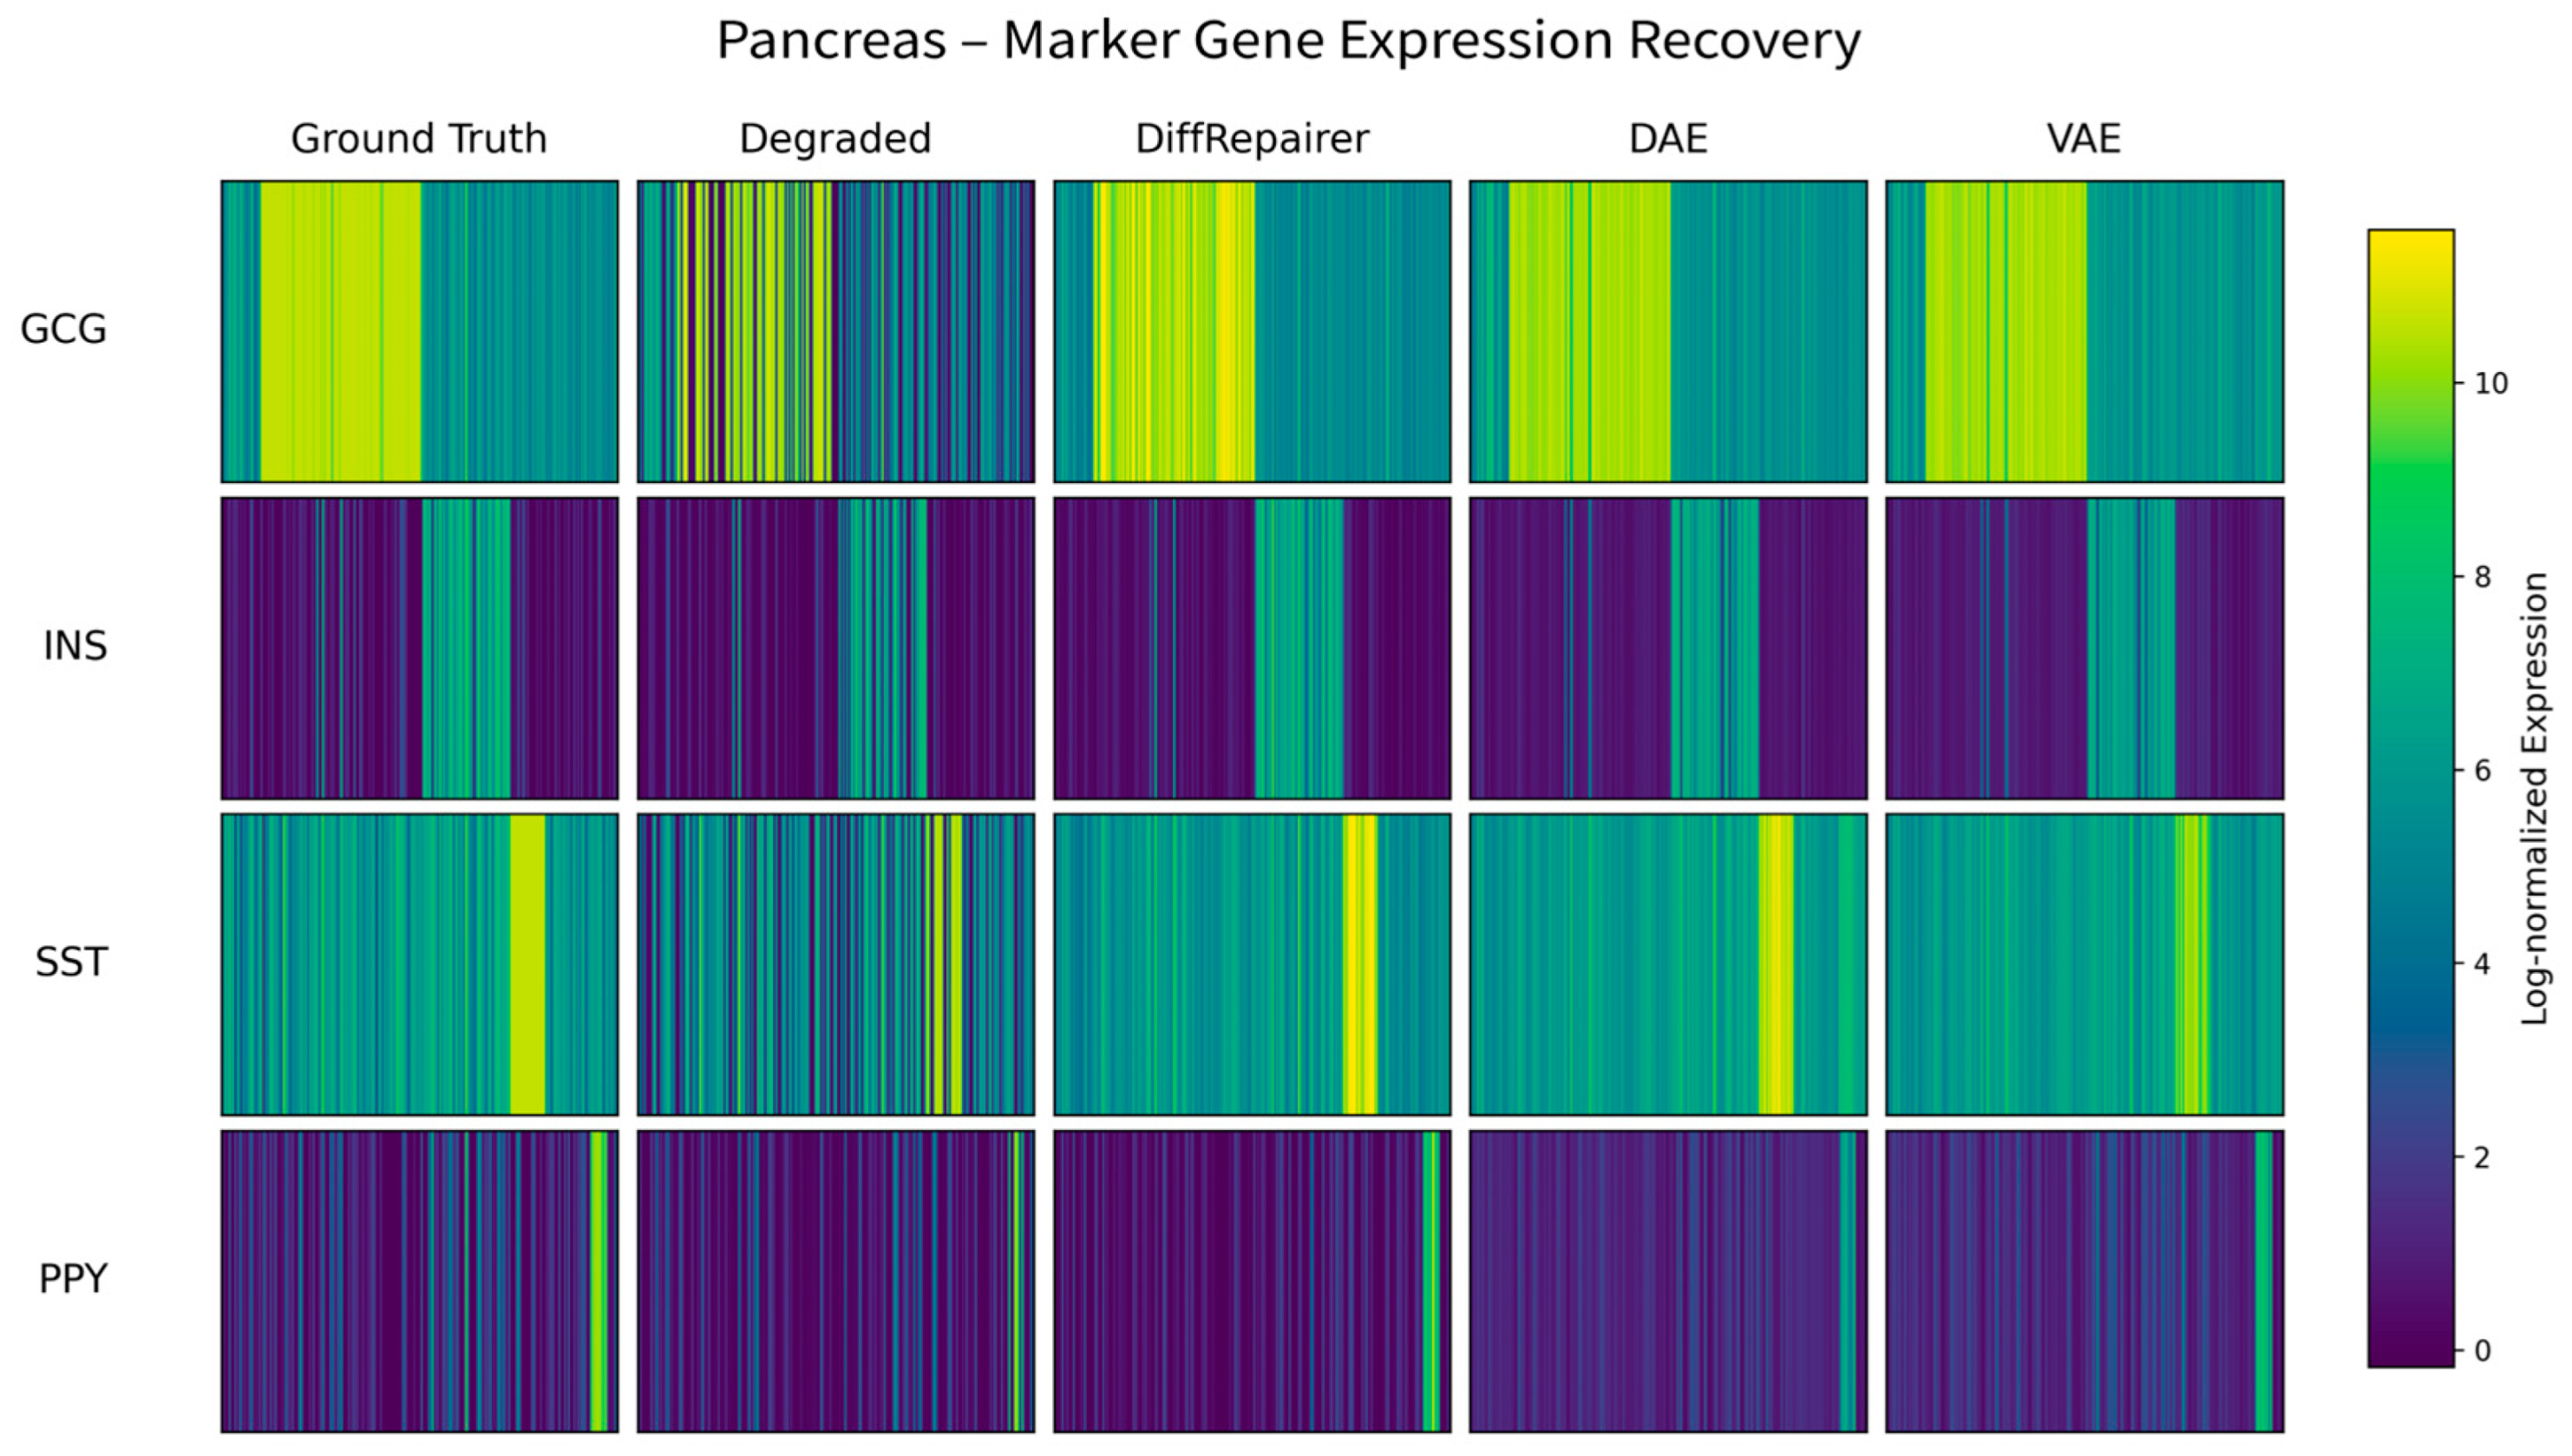
- Pancreas Dataset: This dataset from a study on human pancreatic tissue features a complex cellular composition [14].
- Quality Control (QC): We filtered out cells with too few or too many expressed genes, as well as cells with a high percentage of mitochondrial genes. Genes expressed in very few cells were also removed [15].
- Normalization and Transformation: Gene expression counts were normalized to counts per 10,000 (CP10k) and then log-transformed (log1p) [16].
- Feature Selection: For each dataset, we selected the top 5000 highly variable genes (HVGs) as input features for the model.
2.2. Pseudo-Degradation Data Simulation
- 3′ Bias: This effect is one of the most typical biases in archived samples like FFPE. It is modeled by a bias matrix M, which simulates the loss of 5′ transcript signal due to RNA fragmentation. Each element of the matrix M is calculated based on the degradation intensity parameter and gene length, disproportionately reducing the expression signals of longer transcripts.
- Gene Dropout: This is a common artifact in low-quality sequencing data, especially in single-cell data. It is modeled by a binary mask vector , where each element , with being the dropout rate. The mask is applied through element-wise multiplication with the expression vector, setting some gene expression values to zero with a certain probability.
- Technical Noise: This is simulated by additive Gaussian noise , where , and is the noise standard deviation. This component reproduces the random fluctuations introduced during sequencing and other technical steps, a standard practice in many data simulators.
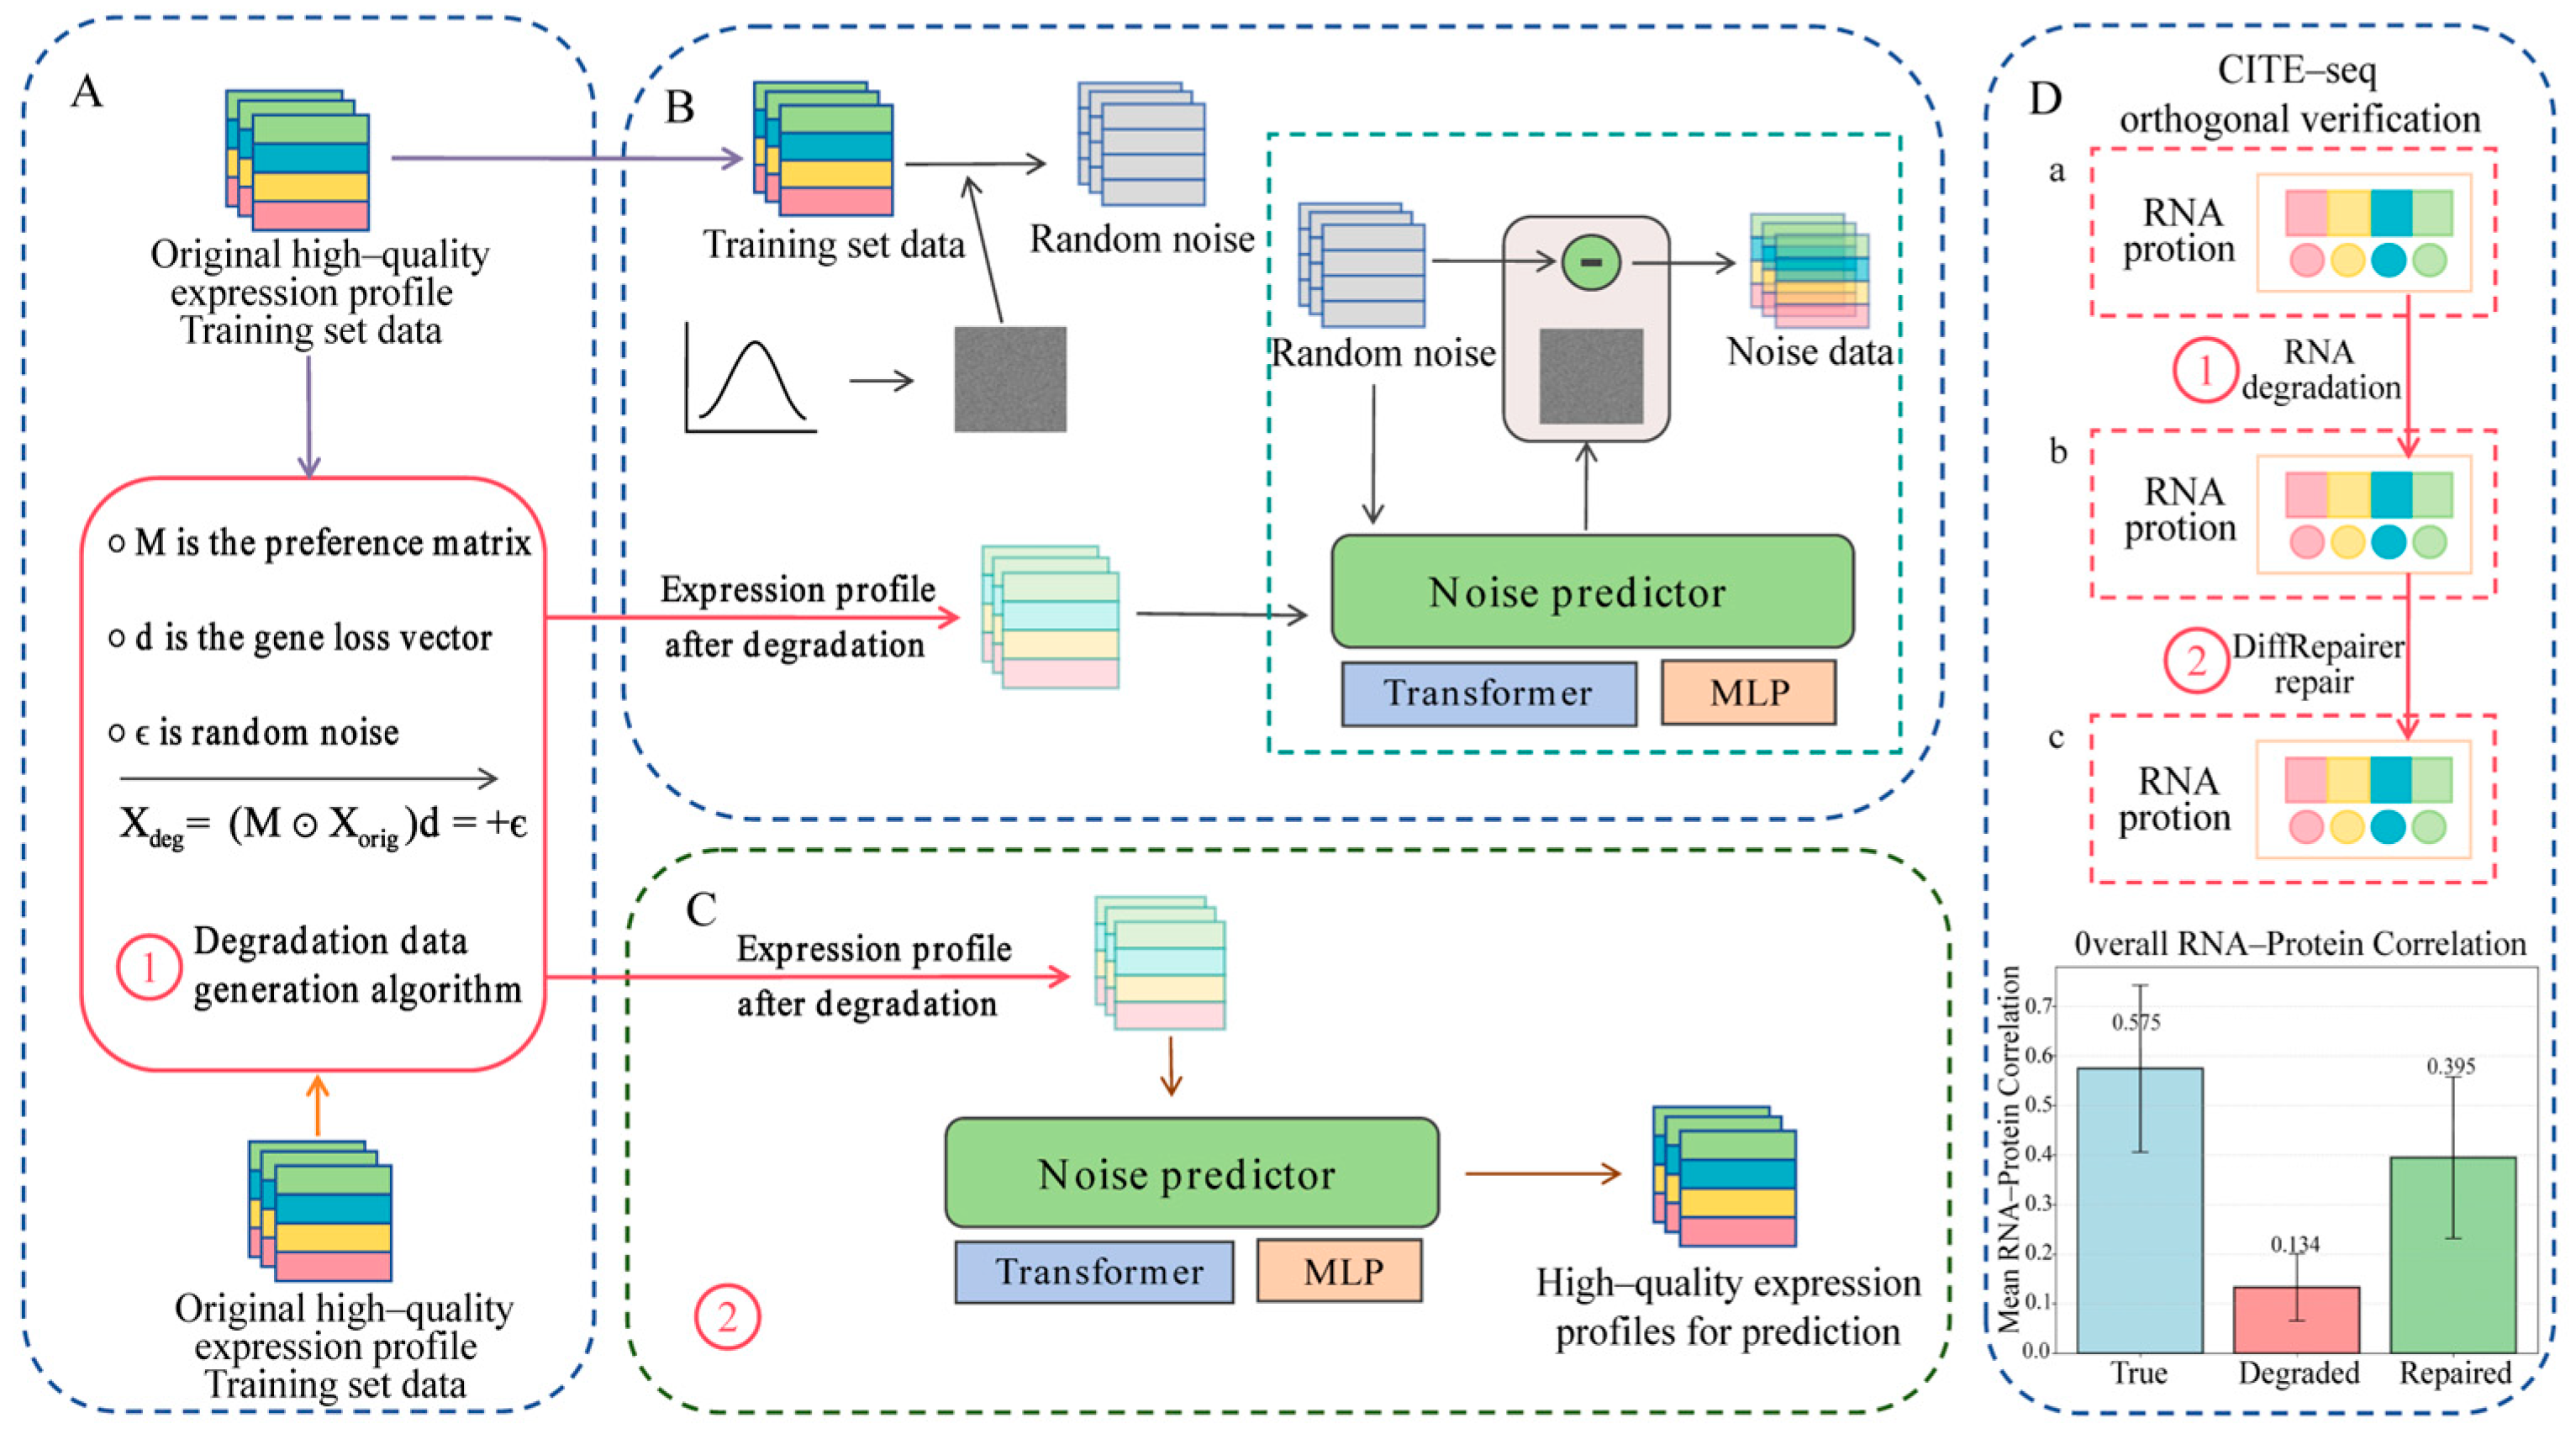
2.3. Orthogonal Validation of Degradation Simulation
2.4. DiffRepairer Model Architecture and Training
- Input Embedding: The degraded expression profile (dimension: 5000) is independently embedded into a 256-dimensional feature space via a linear layer, serving as the input sequence.
- Feature Fusion and Repair: This input sequence is fed into a 4-layer Transformer encoder. Through the multi-head self-attention mechanism, the model can dynamically compute the interdependencies among all gene features in the expression profile, enabling deep fusion of global information and context awareness.
- Output: The output features from the Transformer encoder (dimension: 256) are passed through a final linear projection layer to reconstruct the repaired high-quality expression profile (dimension: 5000).
2.5. Baseline Methods
- Denoising Autoencoder (DAE): A deep learning model that denoises by learning to compress input data into a low-dimensional representation and then reconstructing it [19].
- Variational Autoencoder (VAE): Similarly to a DAE, but it learns a probabilistic distribution of the data, making it a generative model and theoretically more robust [20].
- Conditional Quantile Normalization (CQN): A widely used statistical method for correcting technical biases in RNA-seq data, particularly GC content and gene length biases [21].
- MAGIC: A data imputation method based on a Markov affinity graph, often used to smooth technical zeros (dropouts) in single-cell RNA-seq data [4].
2.6. Model Training and Evaluation
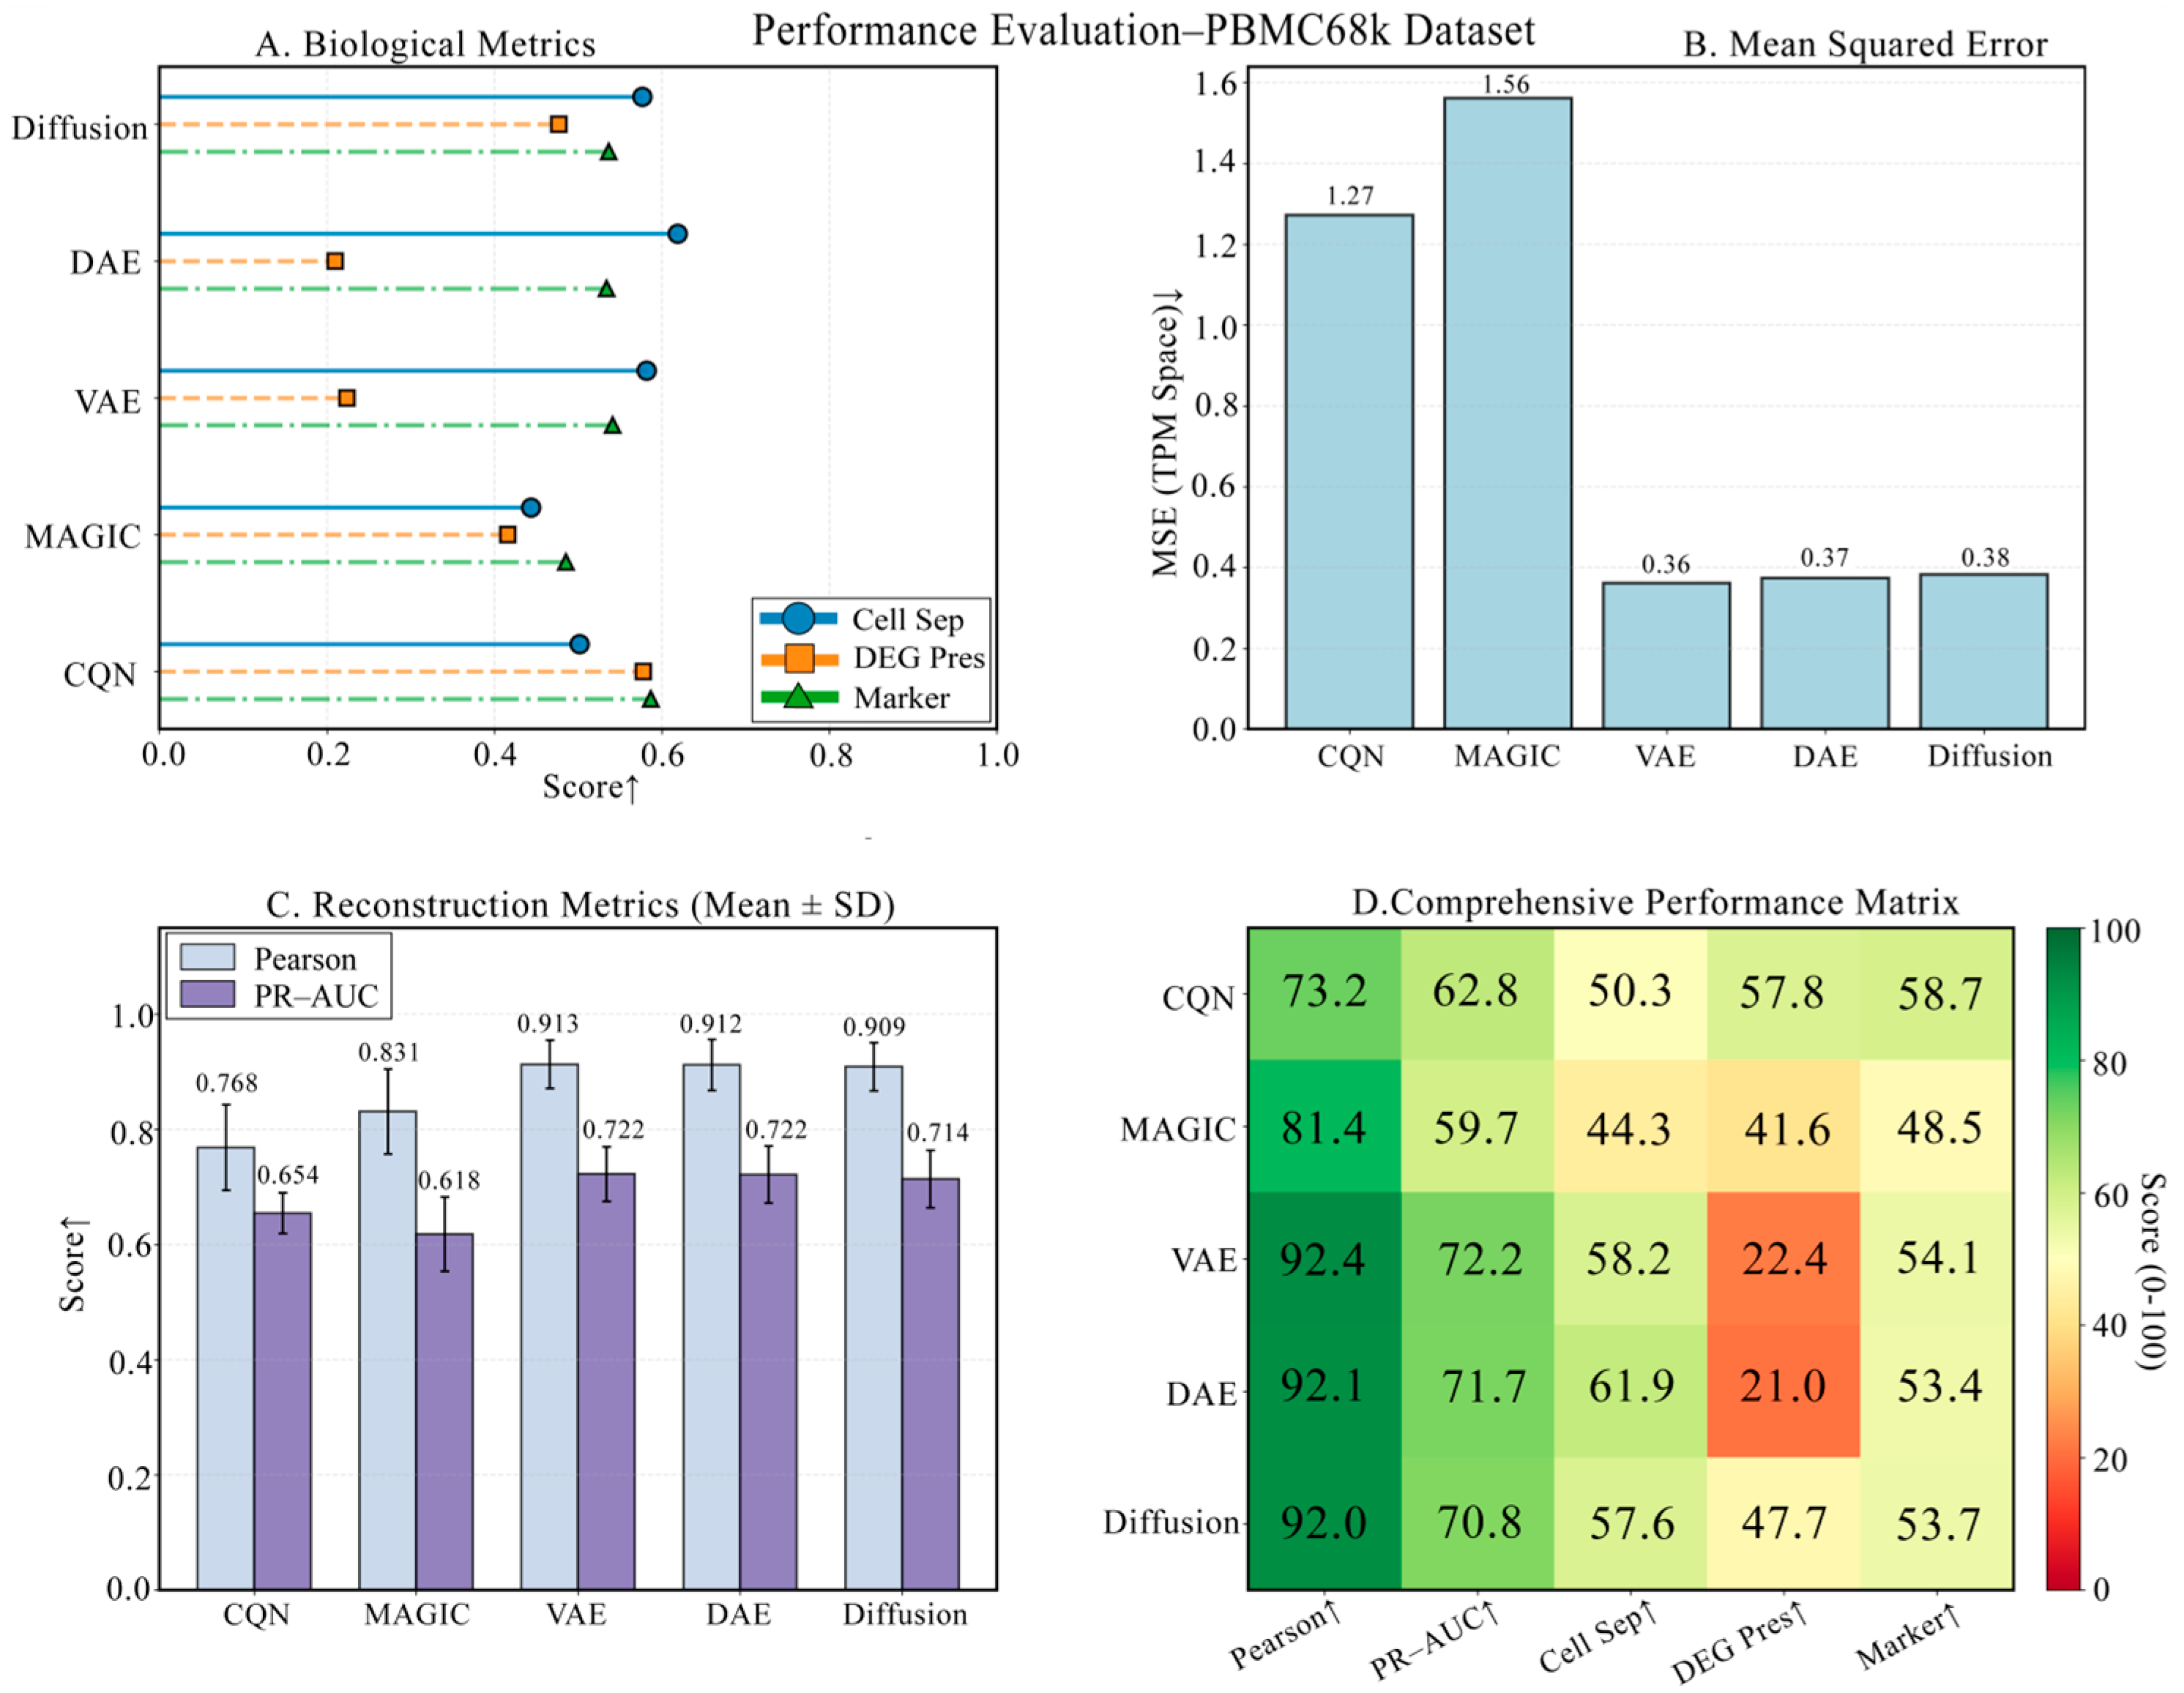
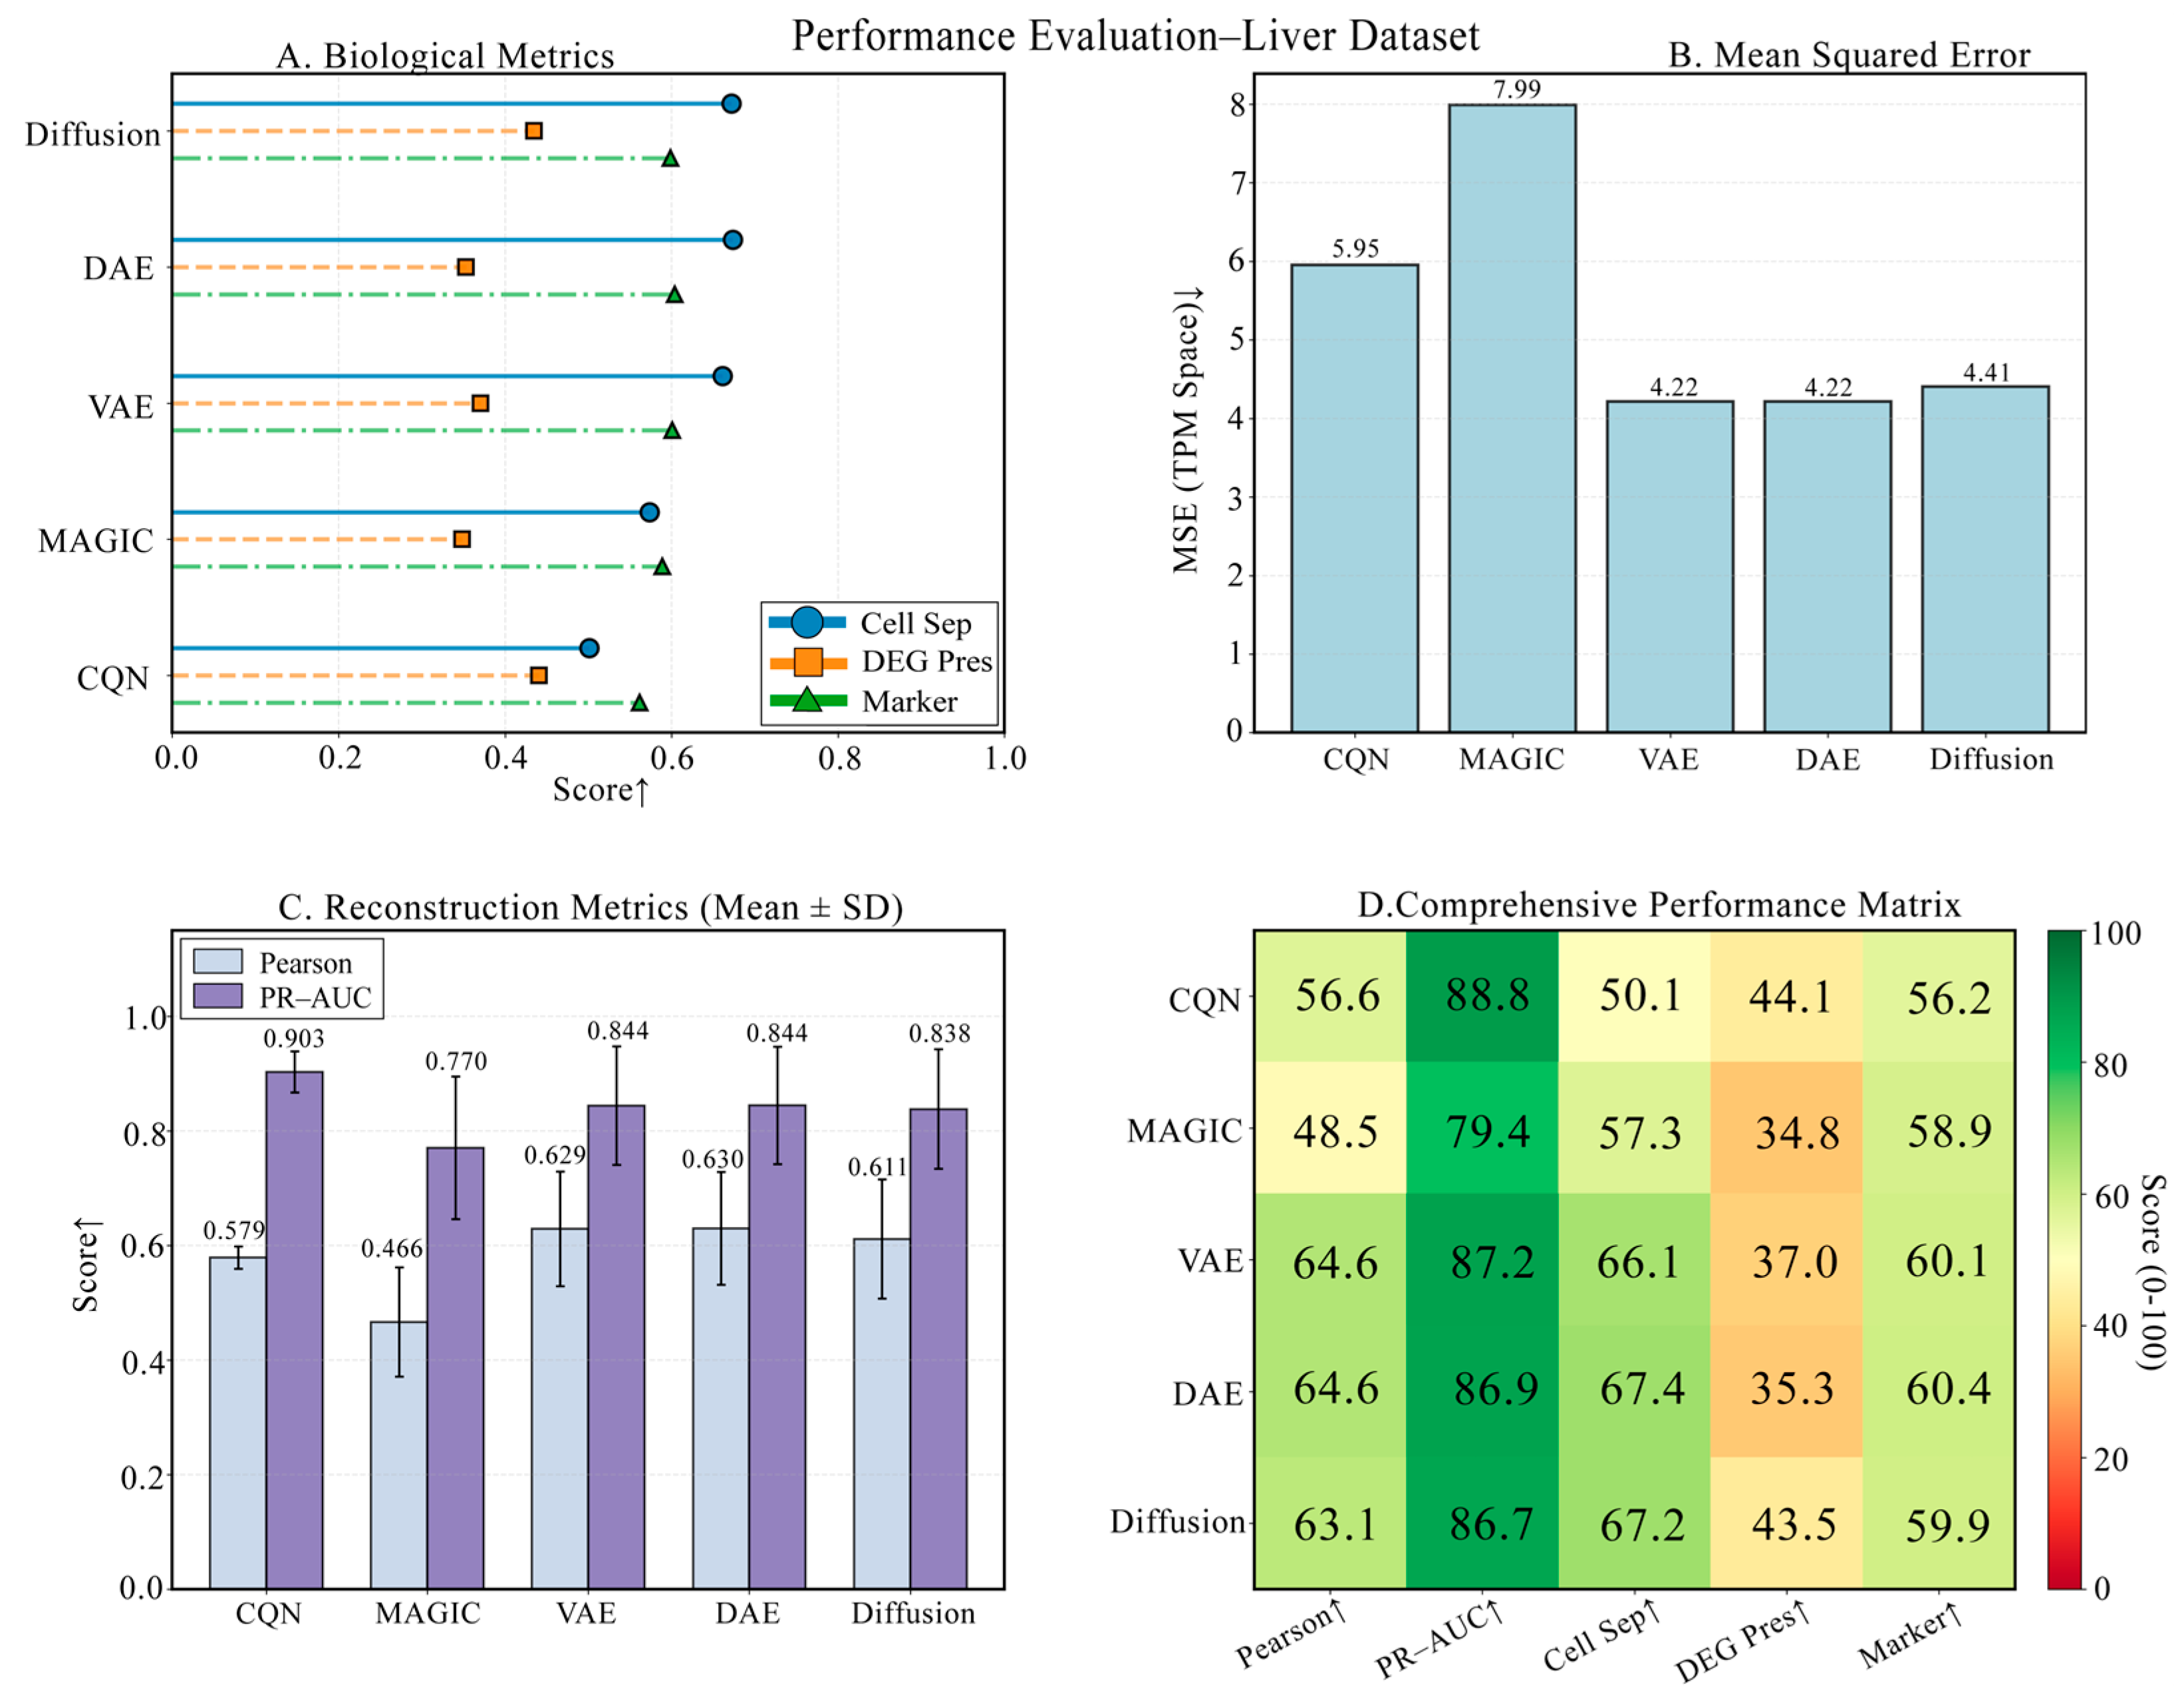
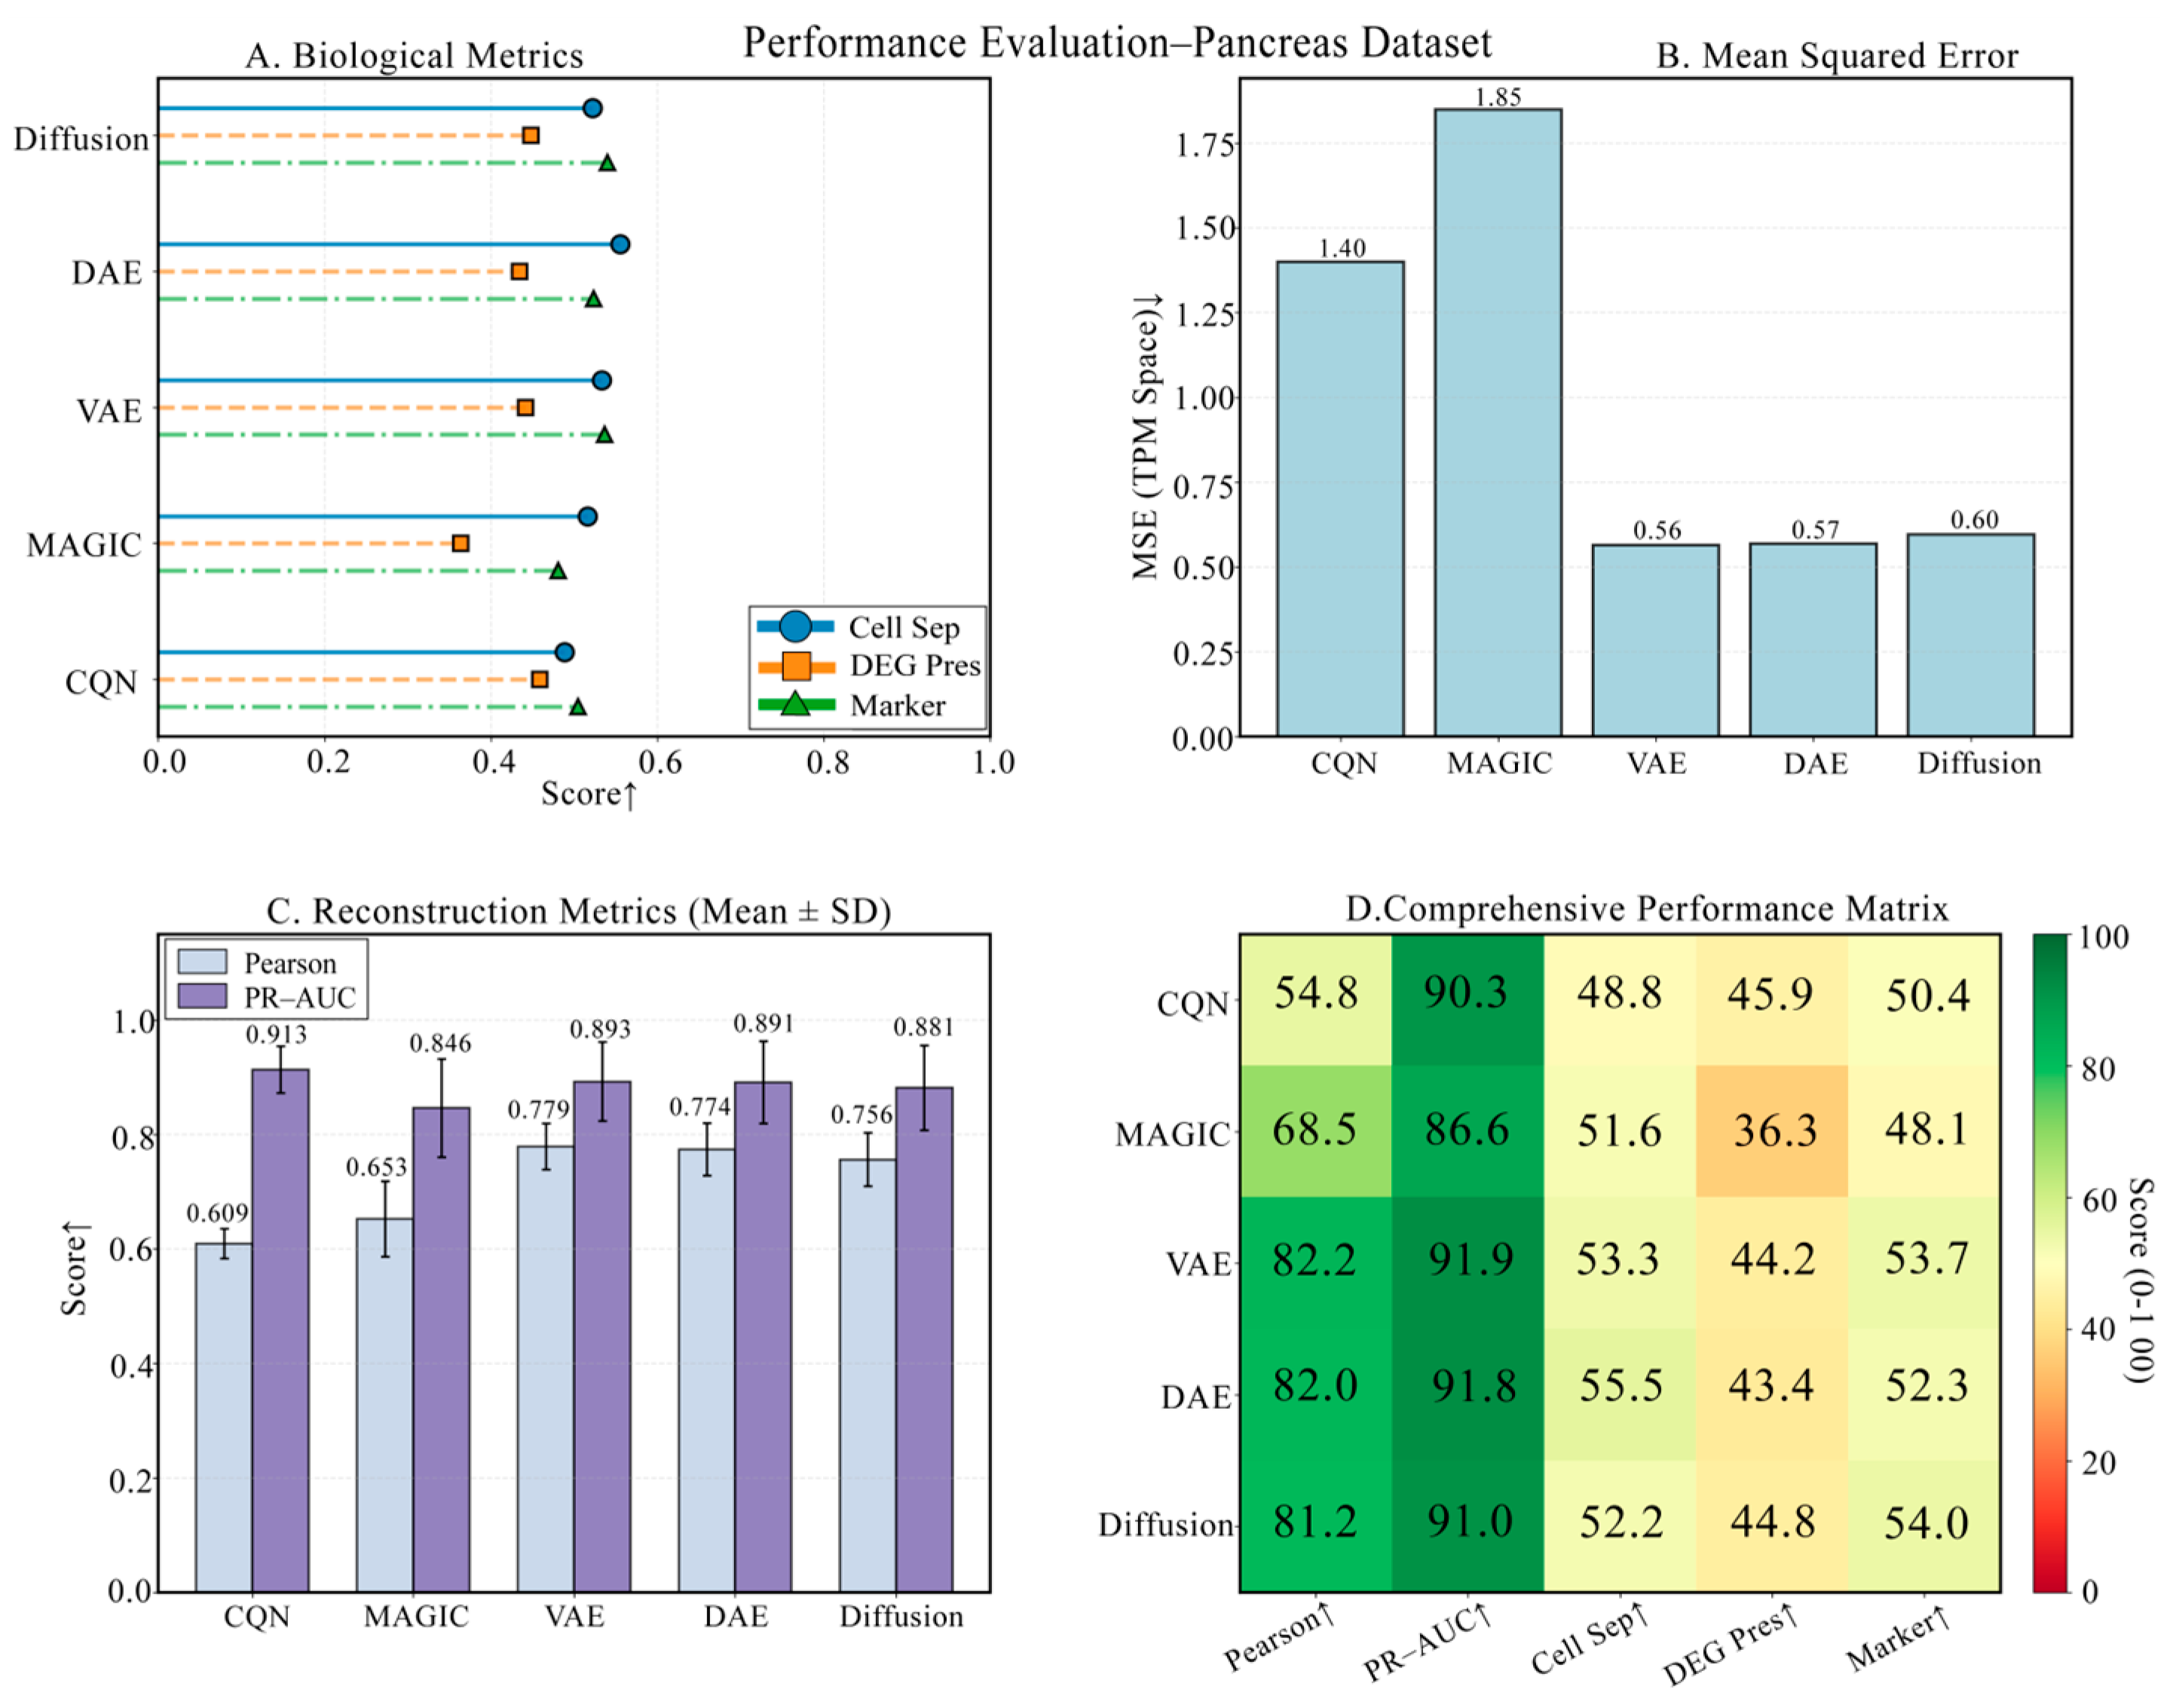
- Mean Squared Error (MSE): Measures the average of the squares of the differences between the predicted and true values. A lower value indicates higher absolute precision in the repair.
- Pearson Correlation Coefficient: Measures the linear relationship between the predicted and true values. A value closer to 1 indicates that the overall pattern of the repaired expression profile is more consistent with the original.
- Area Under the PR Curve (AUC-PR): The area under the Precision-Recall curve, effective for evaluating model performance on imbalanced data (e.g., distinguishing between expressed and non-expressed genes).
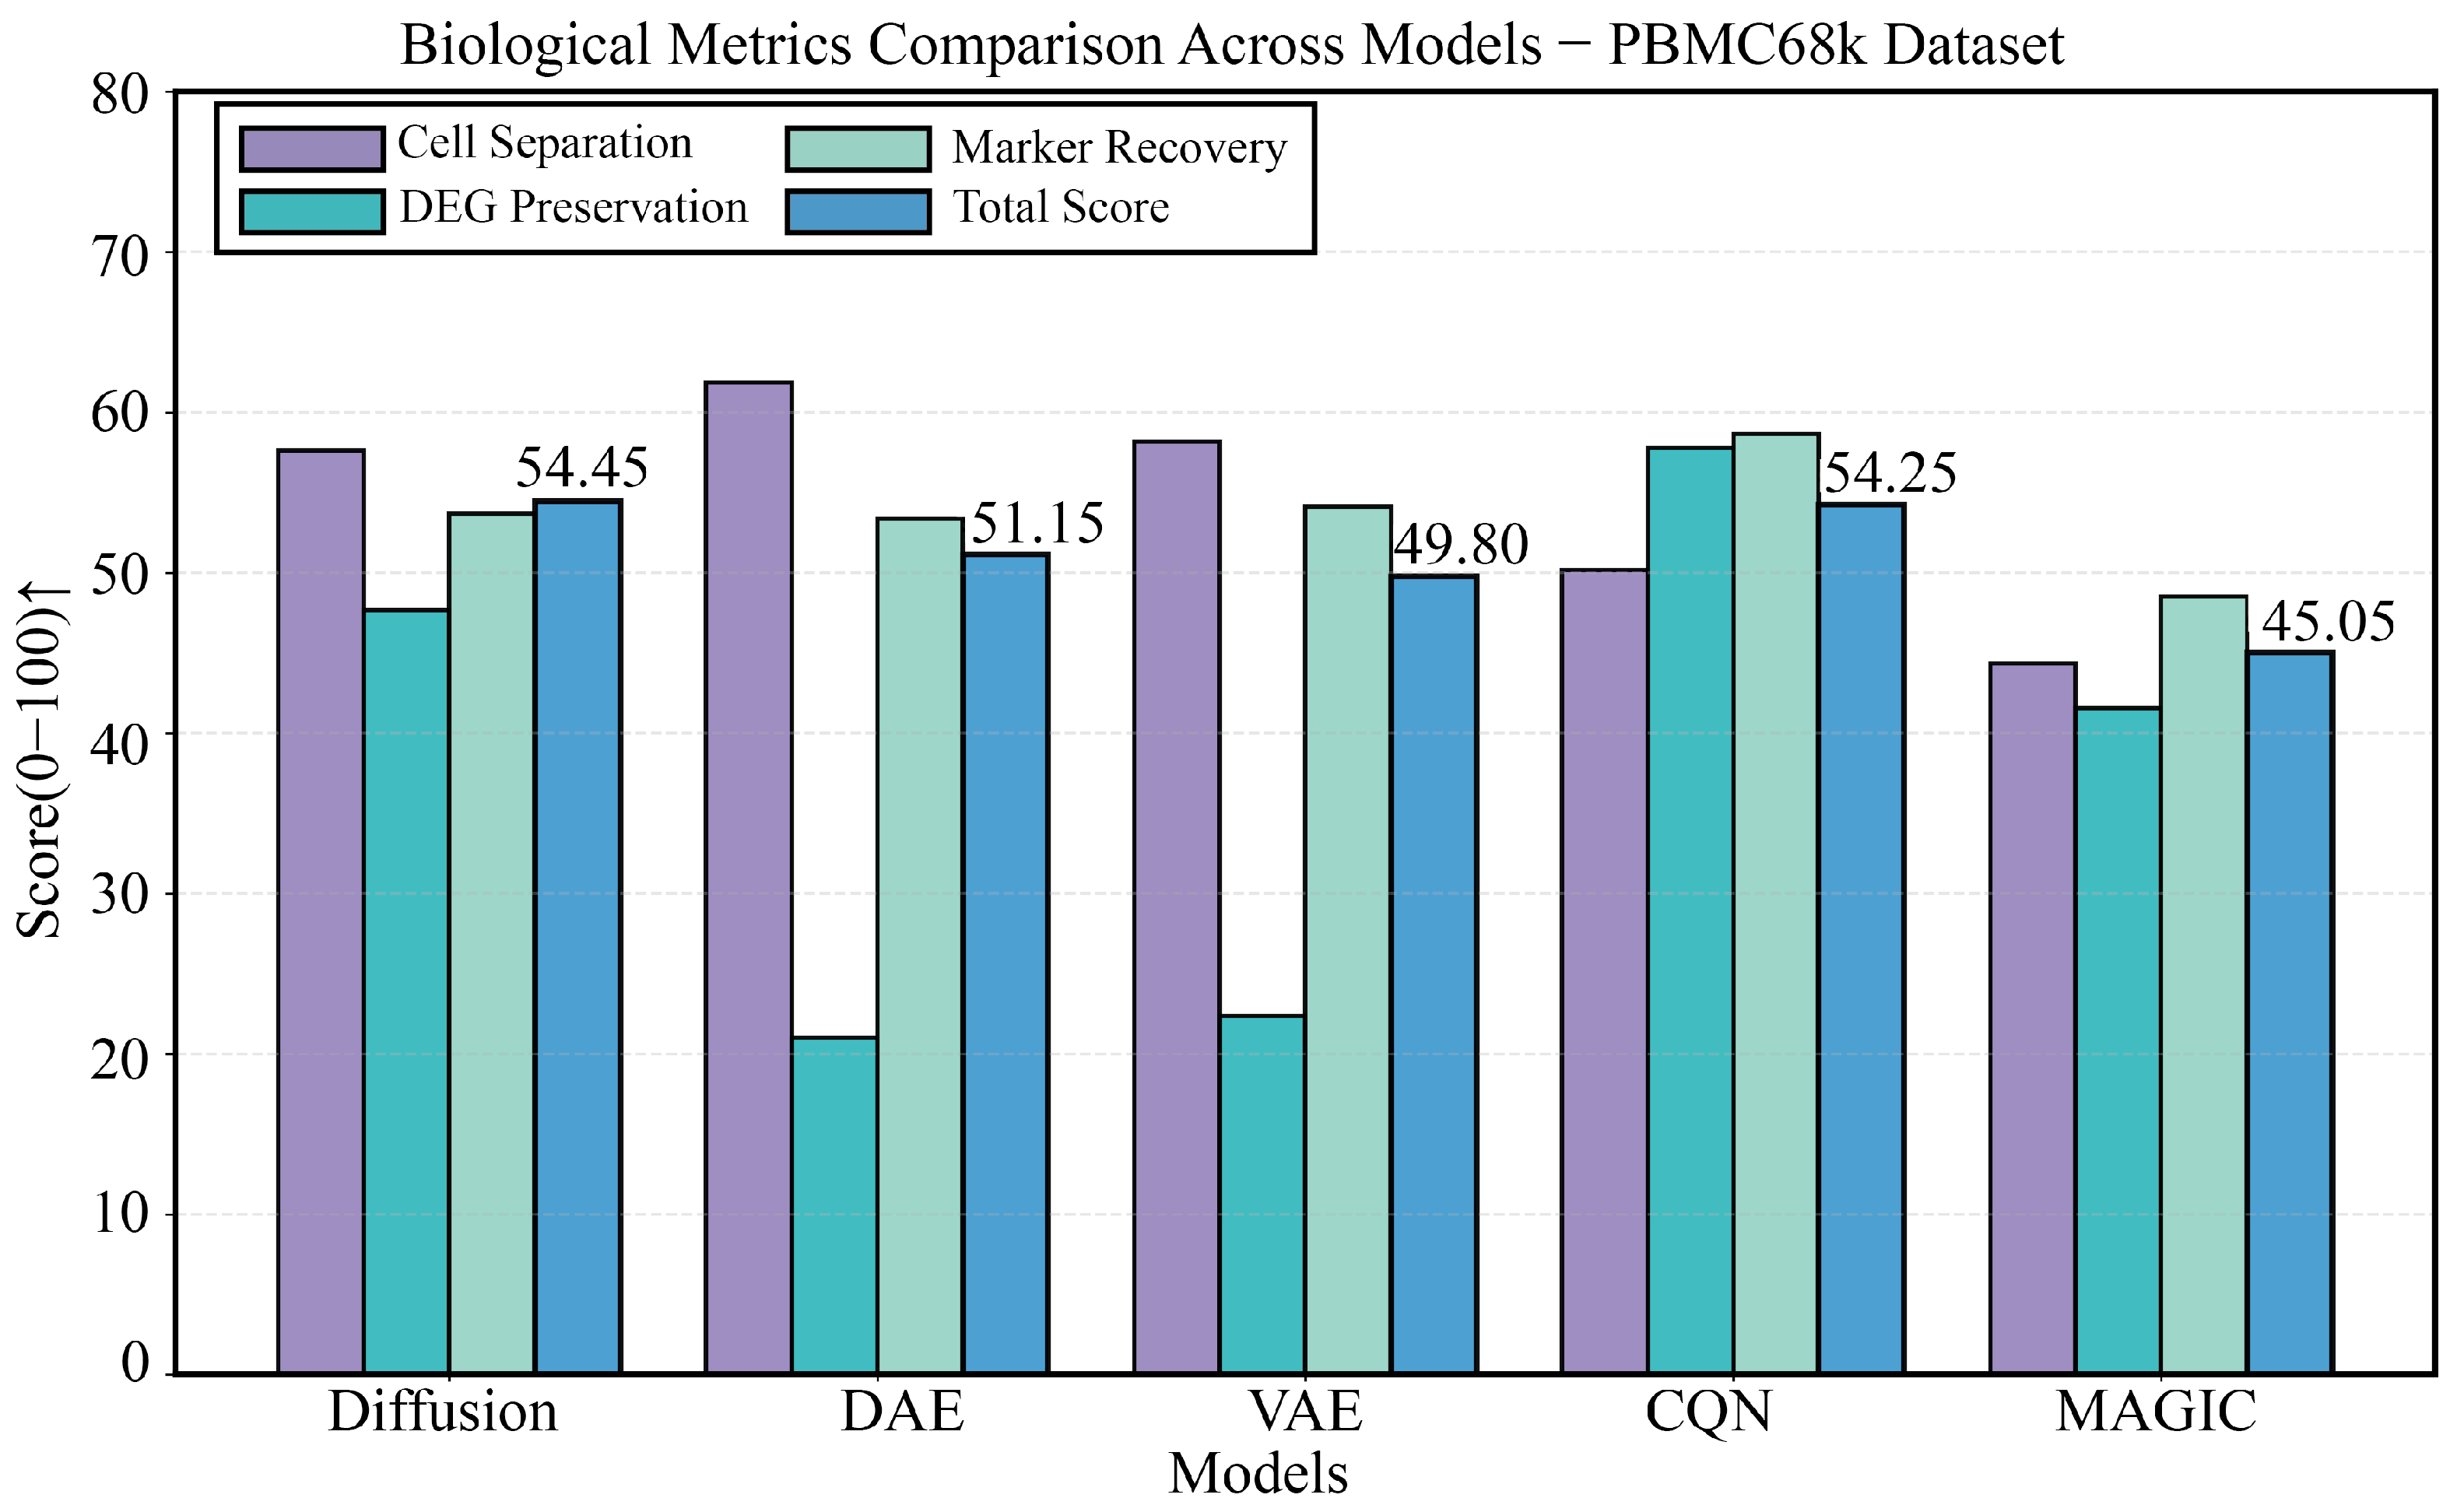
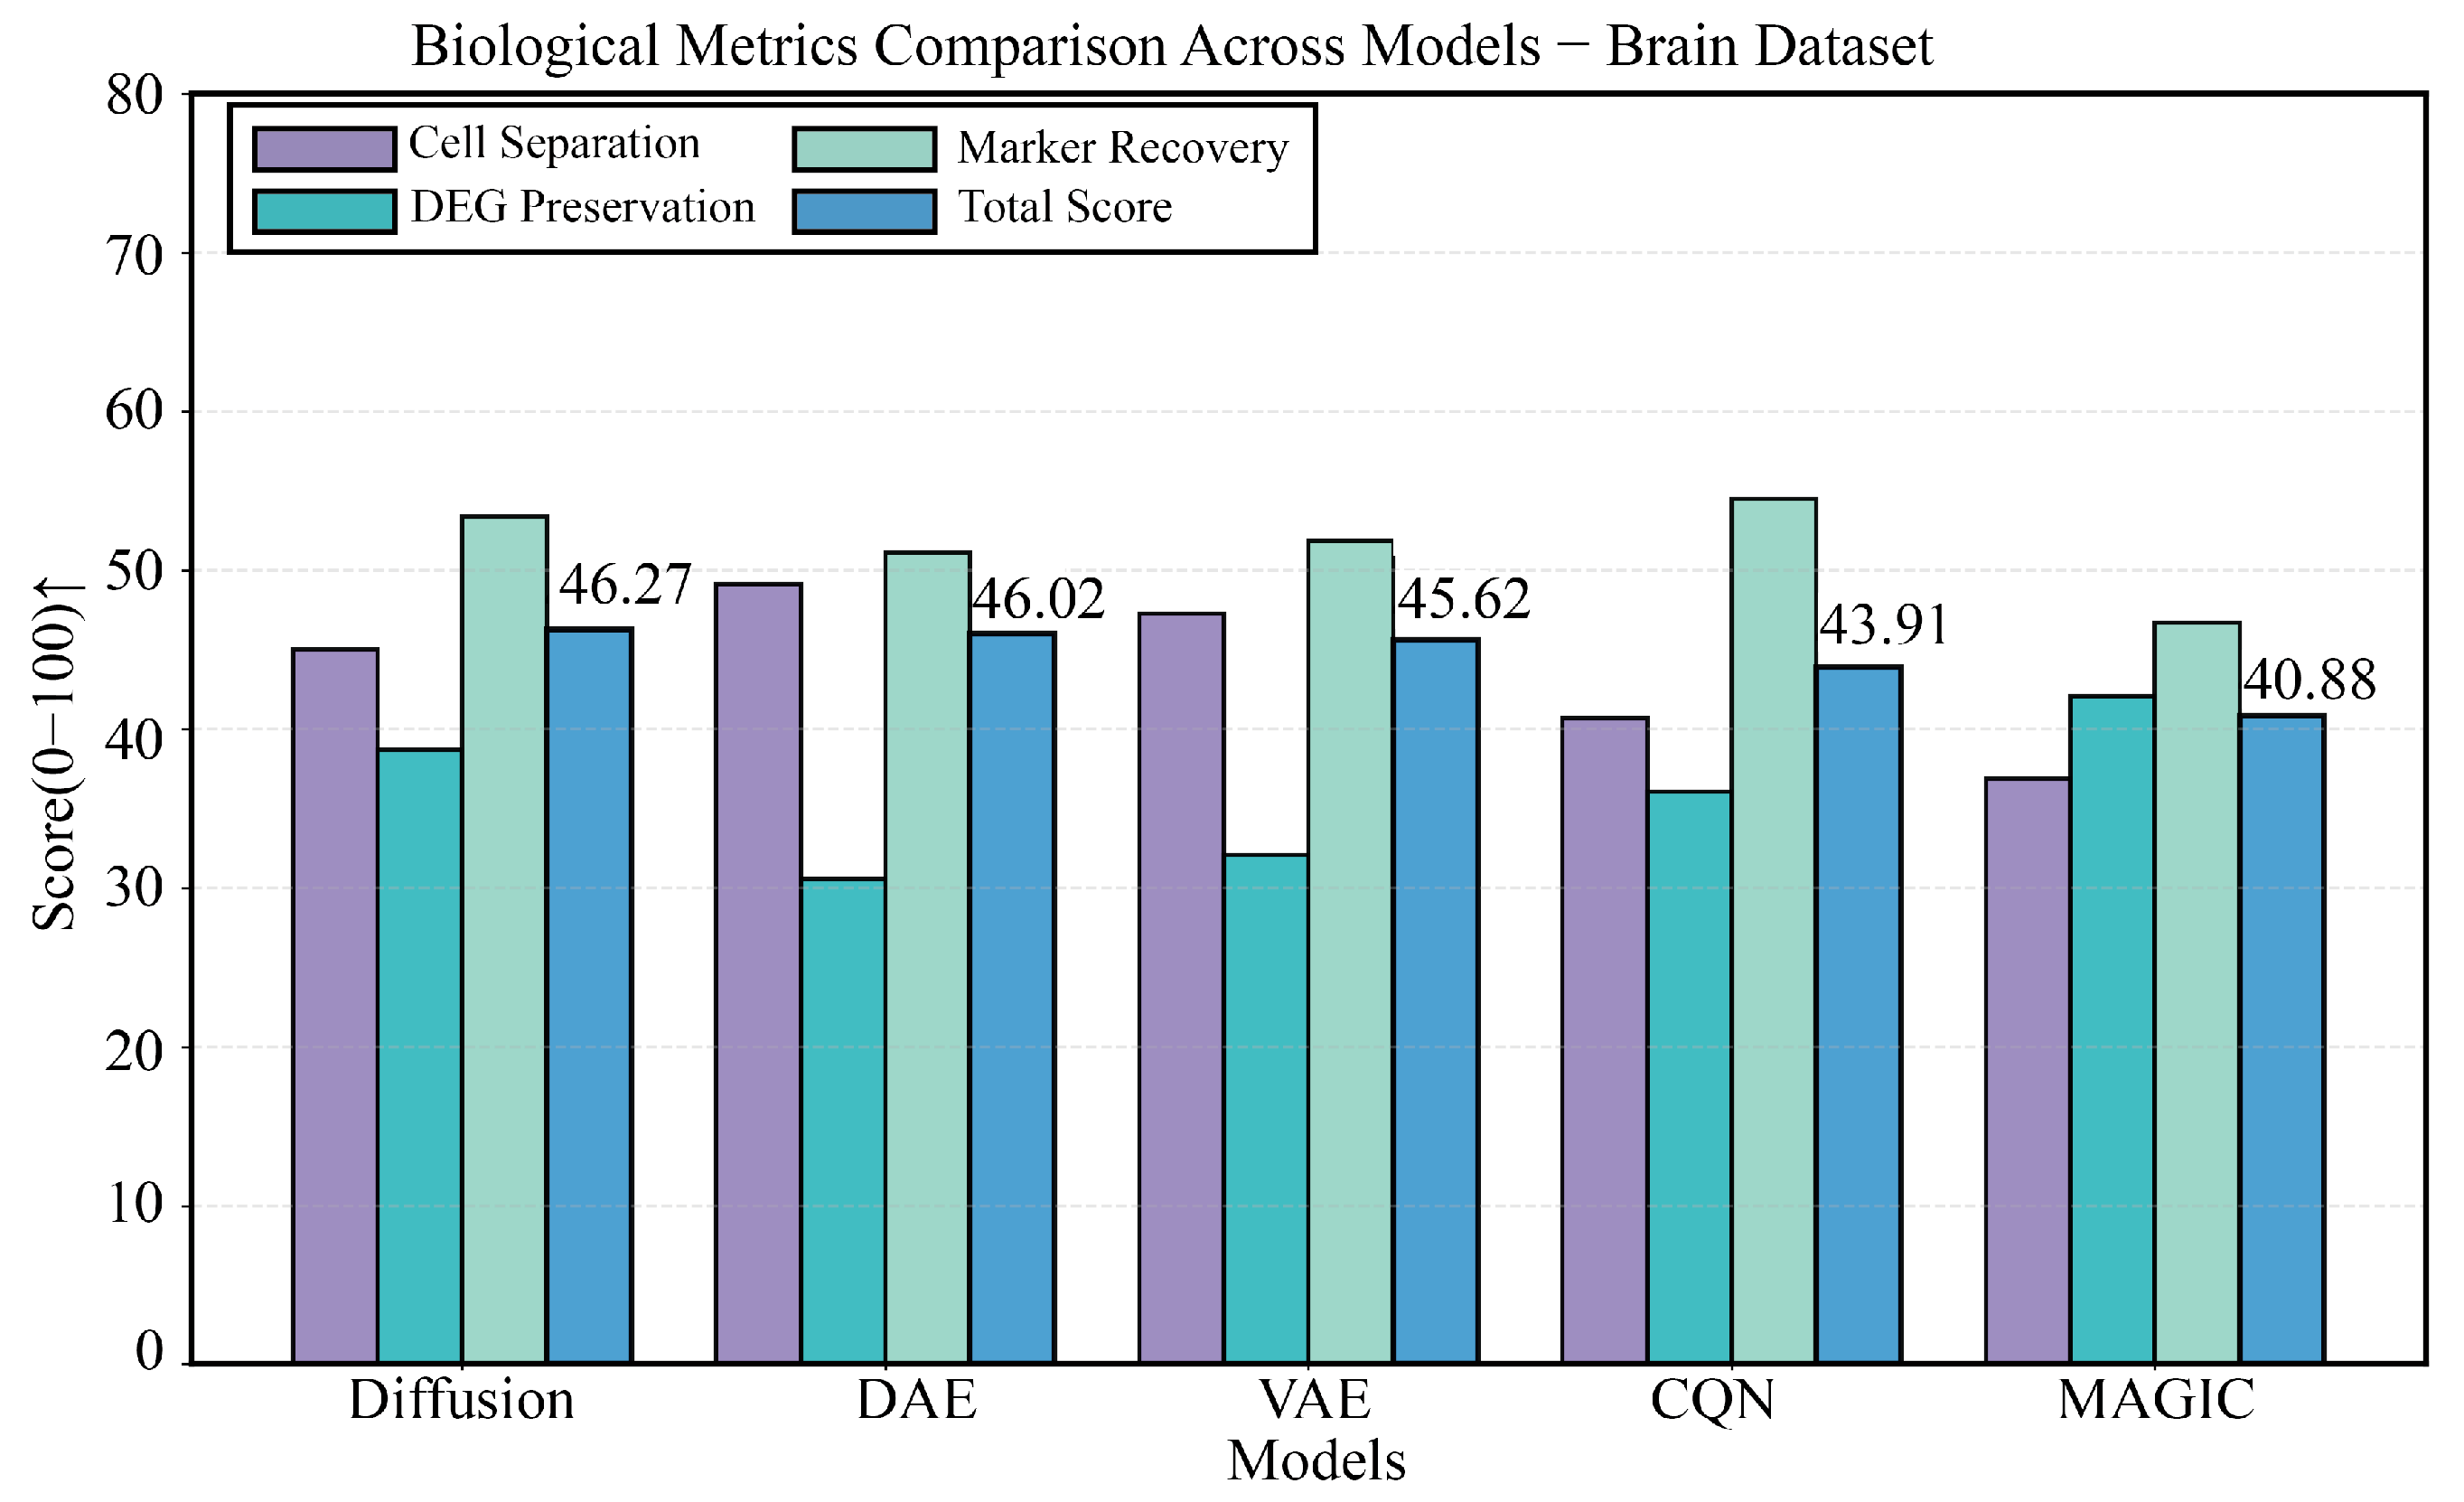
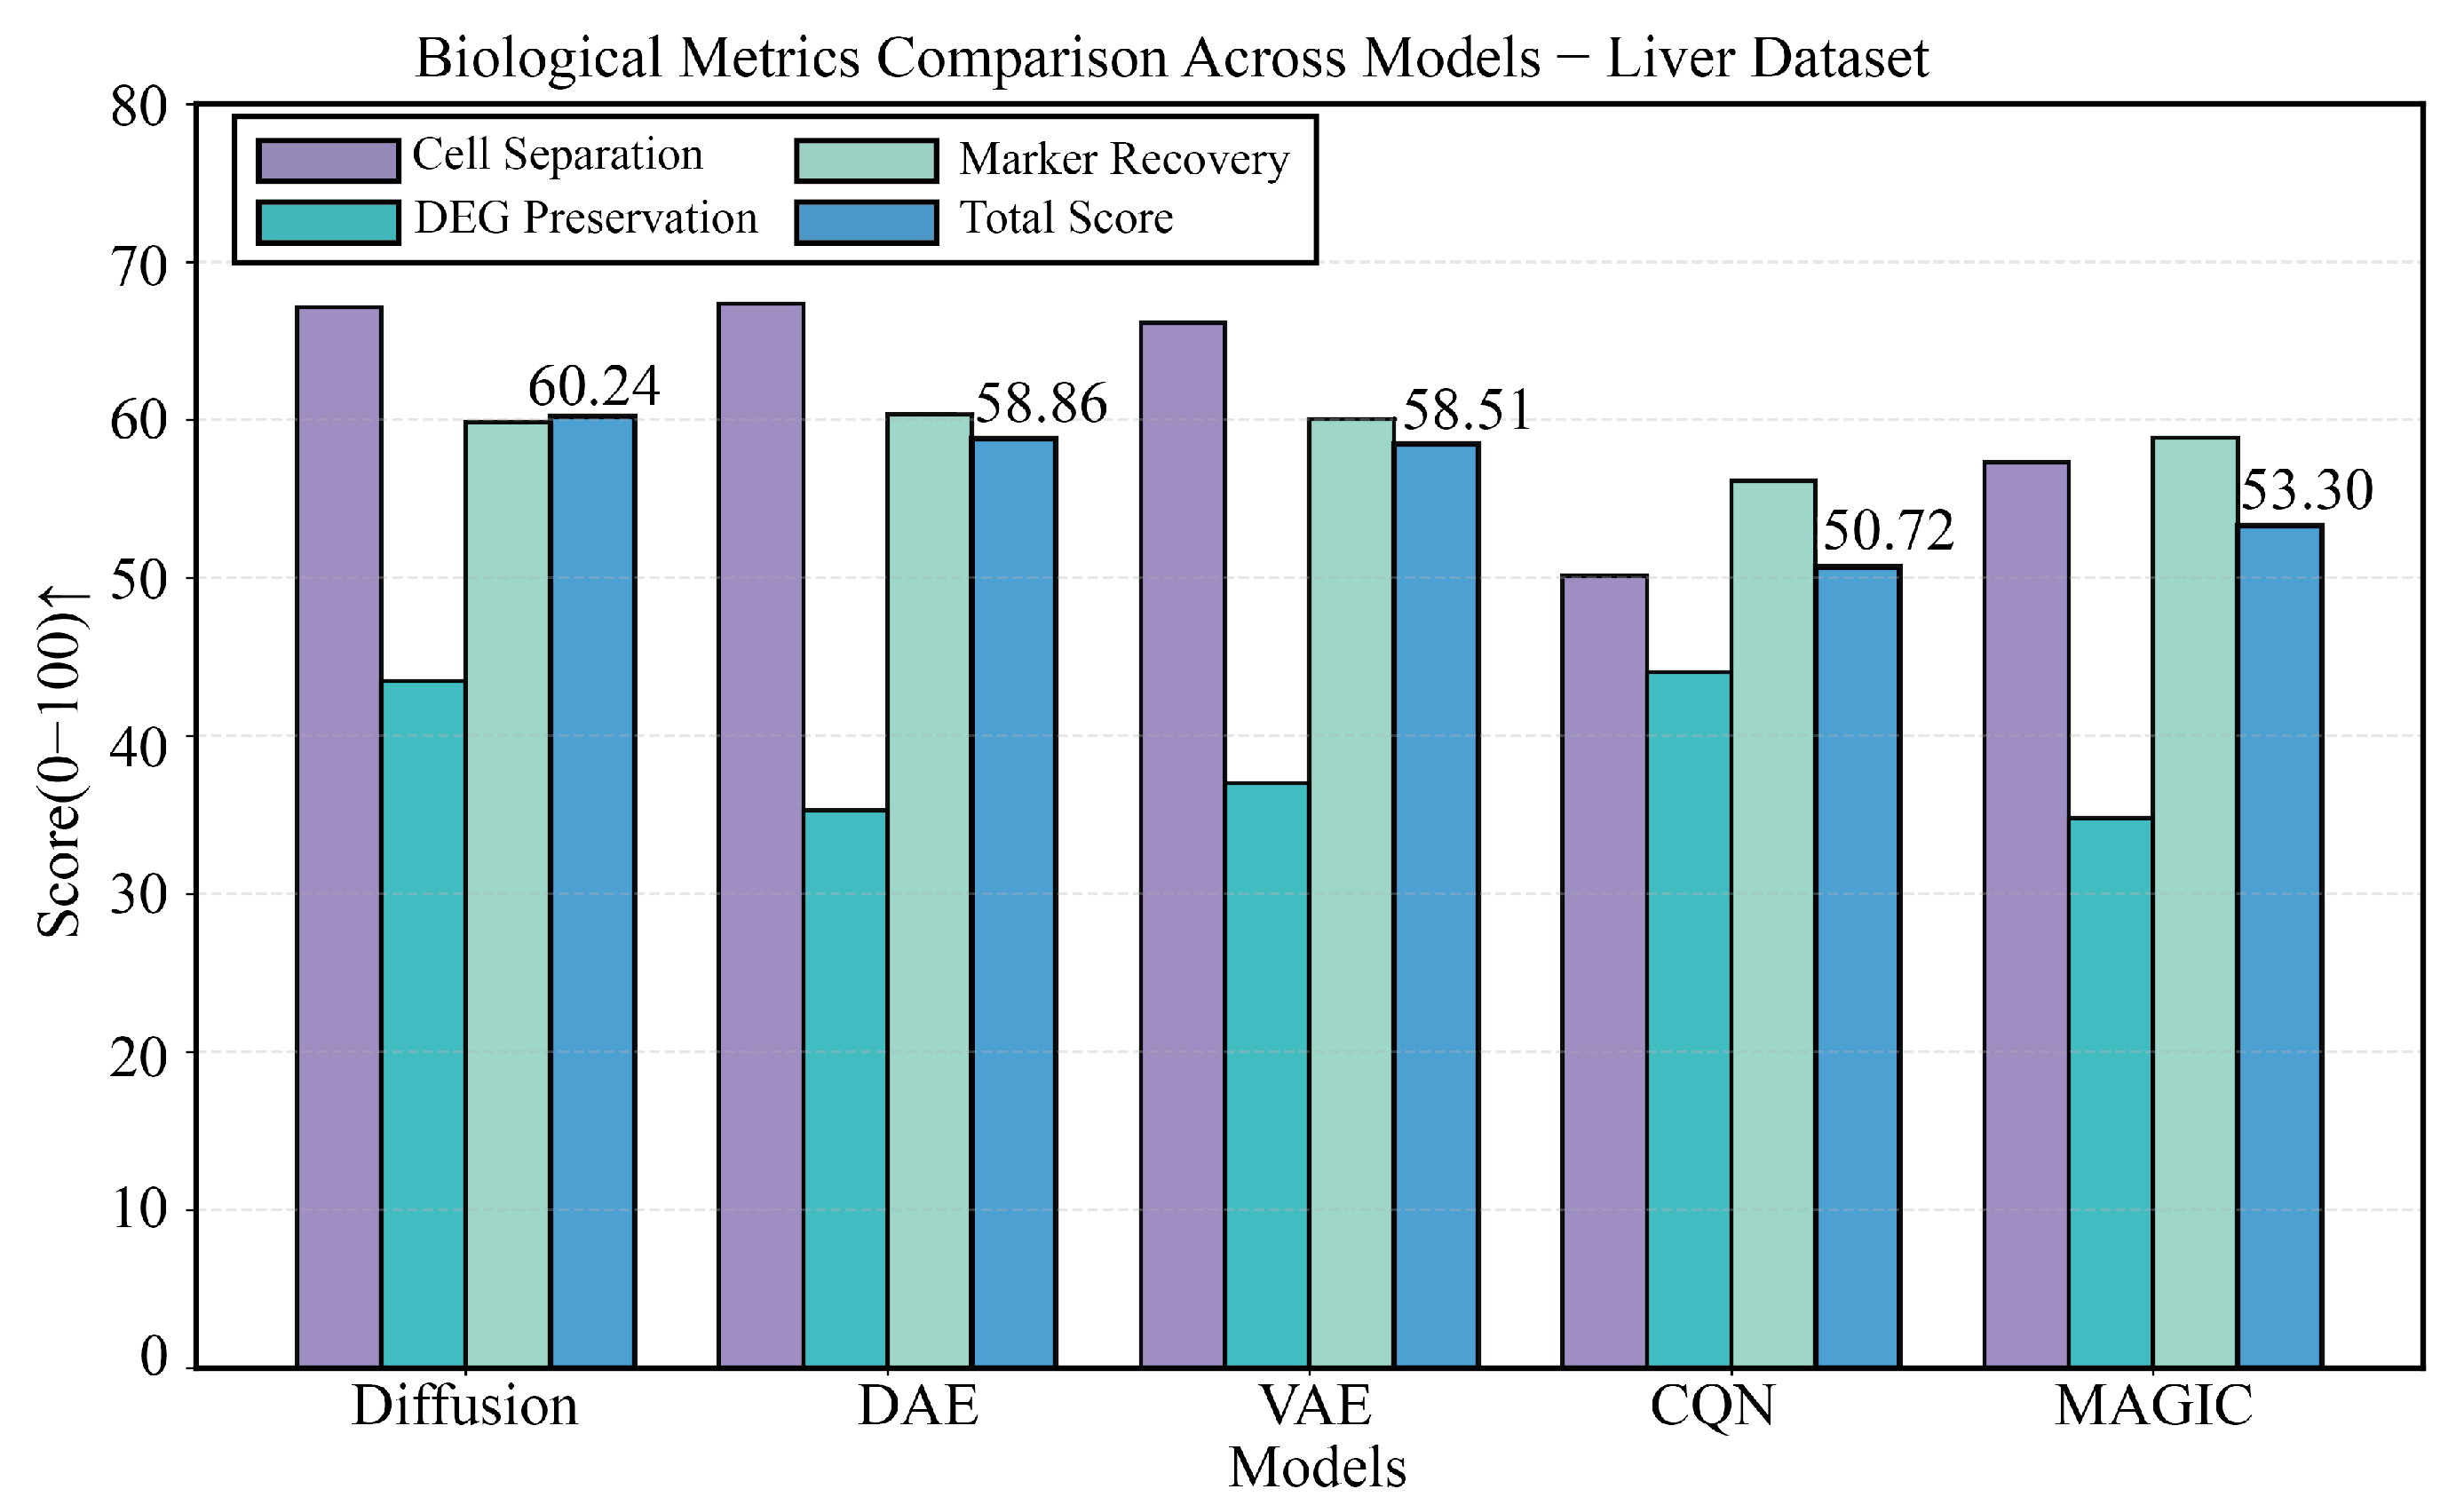
- Cell Type Separation: We use the **Silhouette Score** to evaluate whether the repaired data can better distinguish different cell types. This score measures the cohesion and separation of clusters, with higher values indicating clearer cell type structures.
- Differentially Expressed Gene (DEG) Preservation: We assess the model’s ability to retain key biological changes by calculating the Jaccard Index and F1-Score of the sets of top DEGs identified before and after repair.
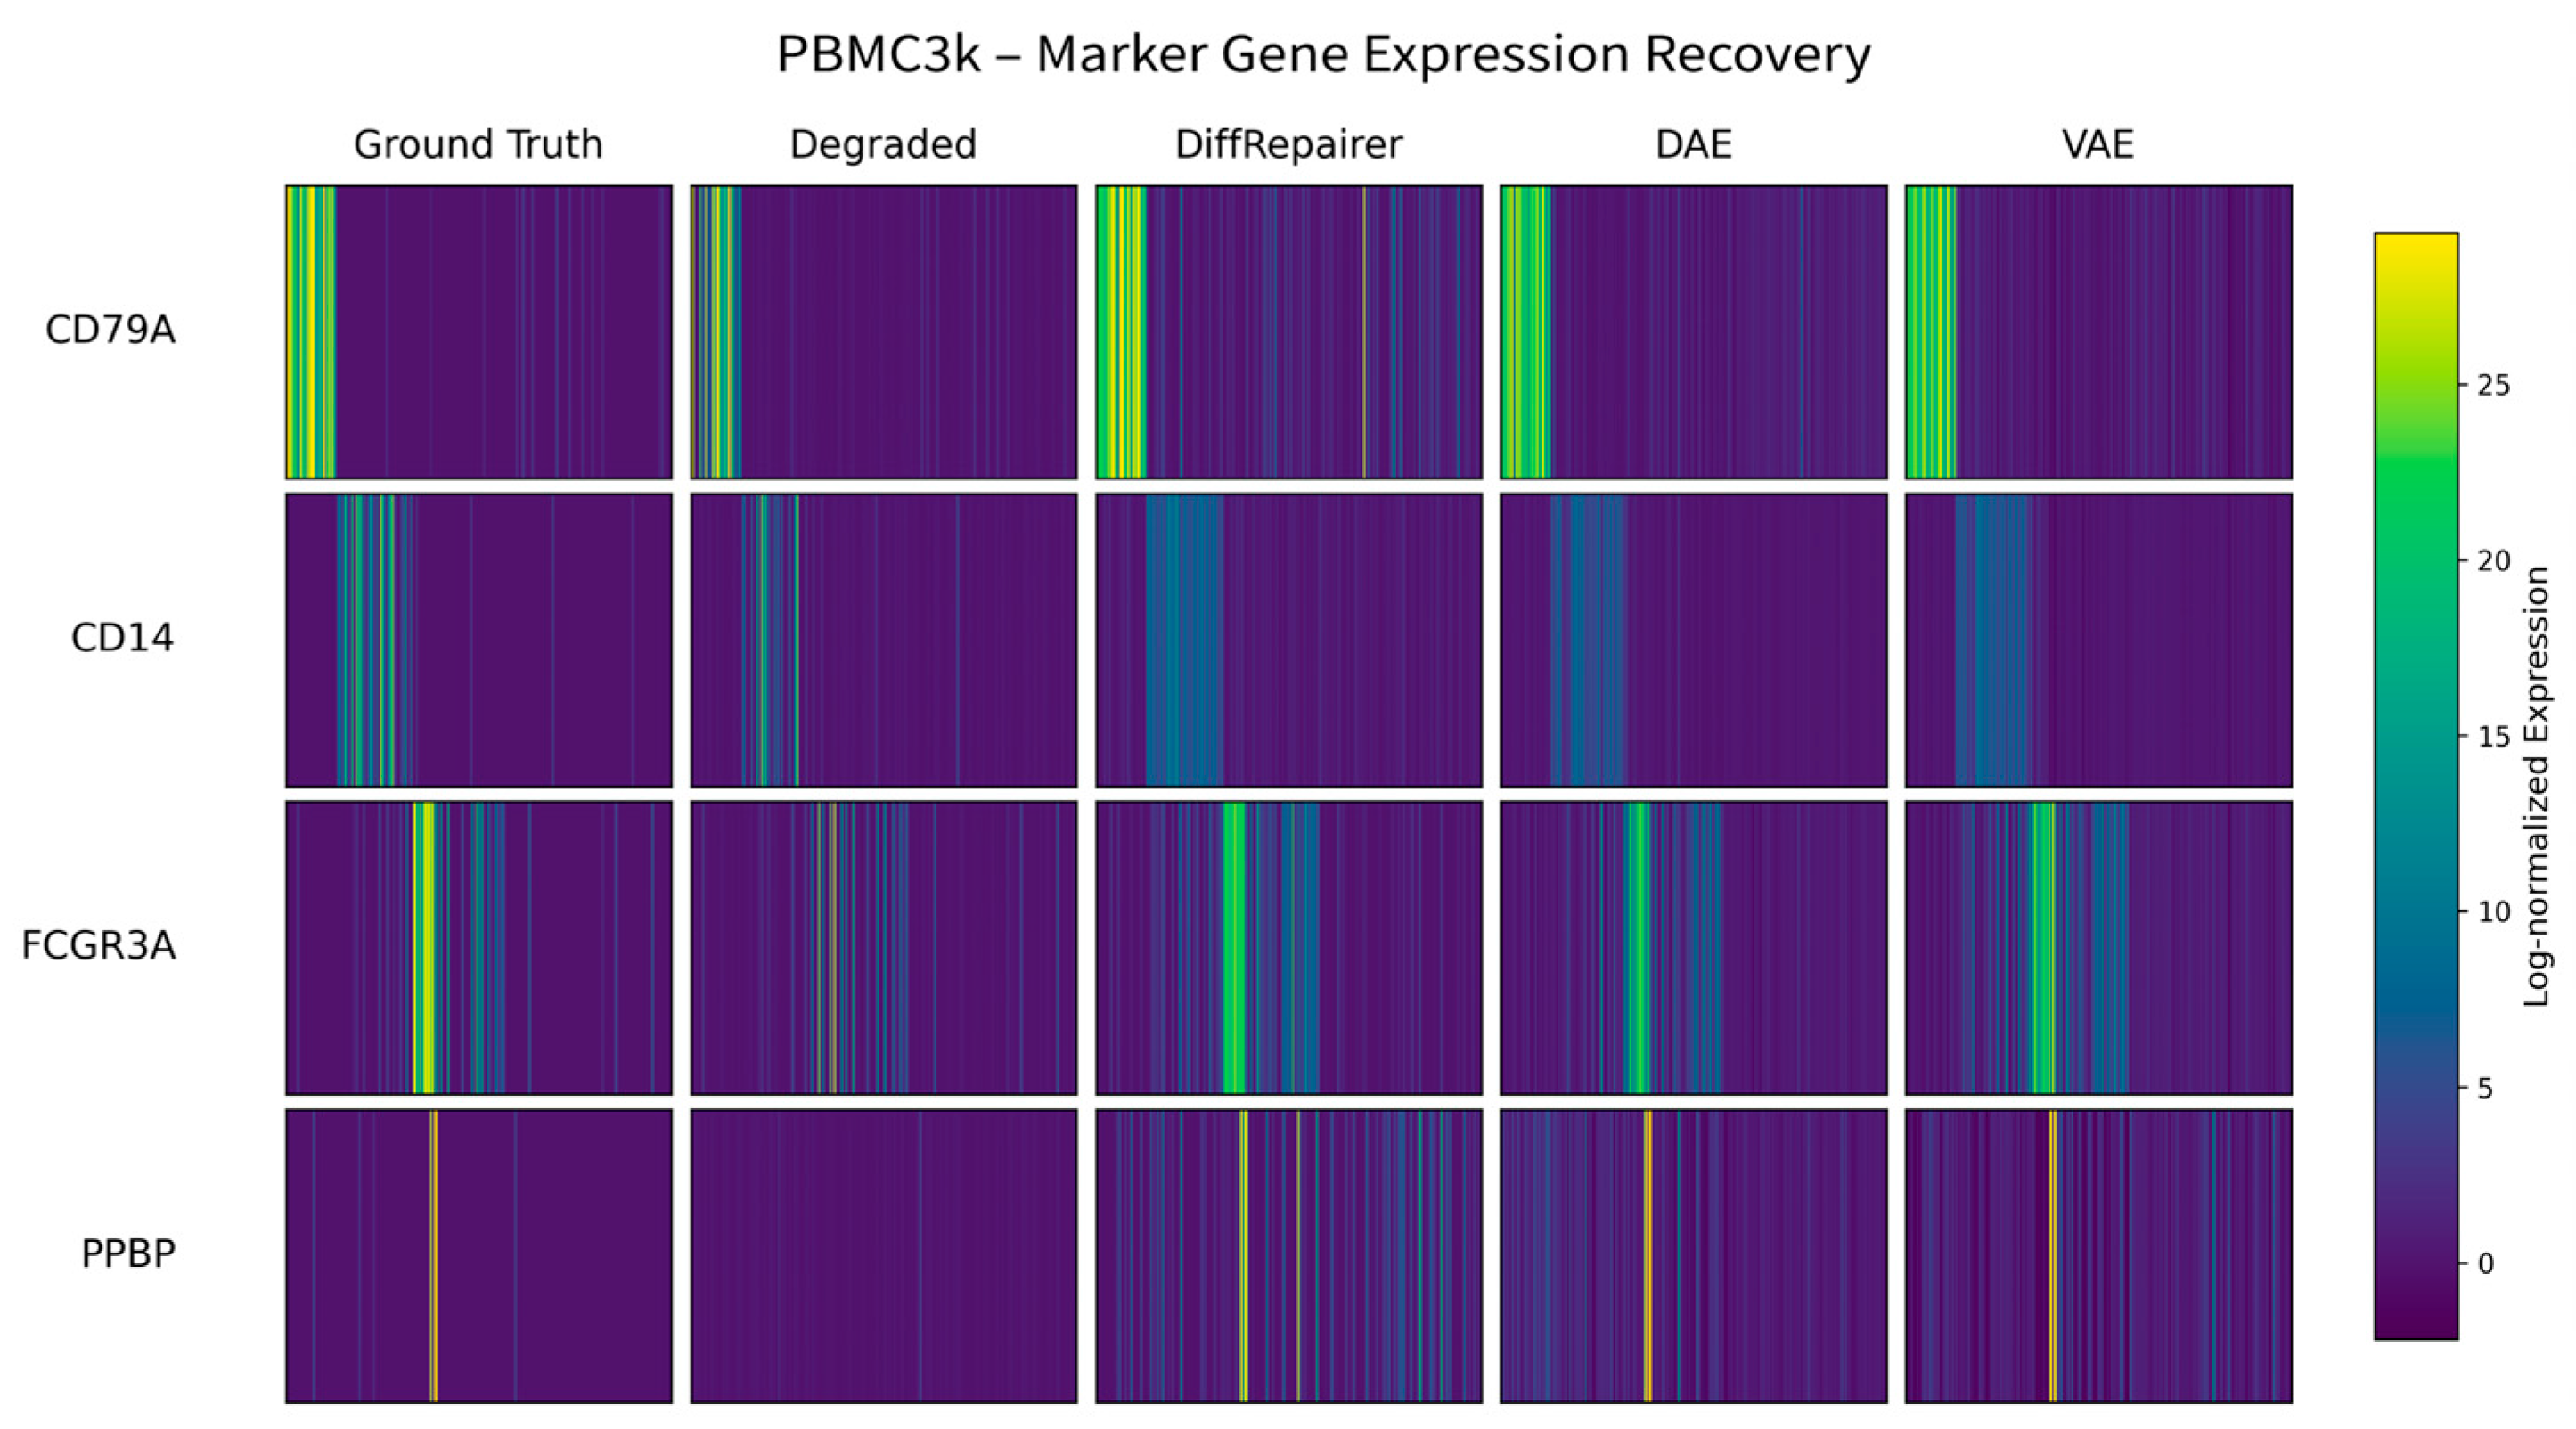
- Marker Gene Recovery: We calculate Spearman’s Correlation of known cell type marker genes before and after repair to measure the model’s ability to restore genes that define cell identity.
2.7. Ethics Statement
3. Results
3.1. DiffRepairer Shows Consistent Superiority in Overall Performance
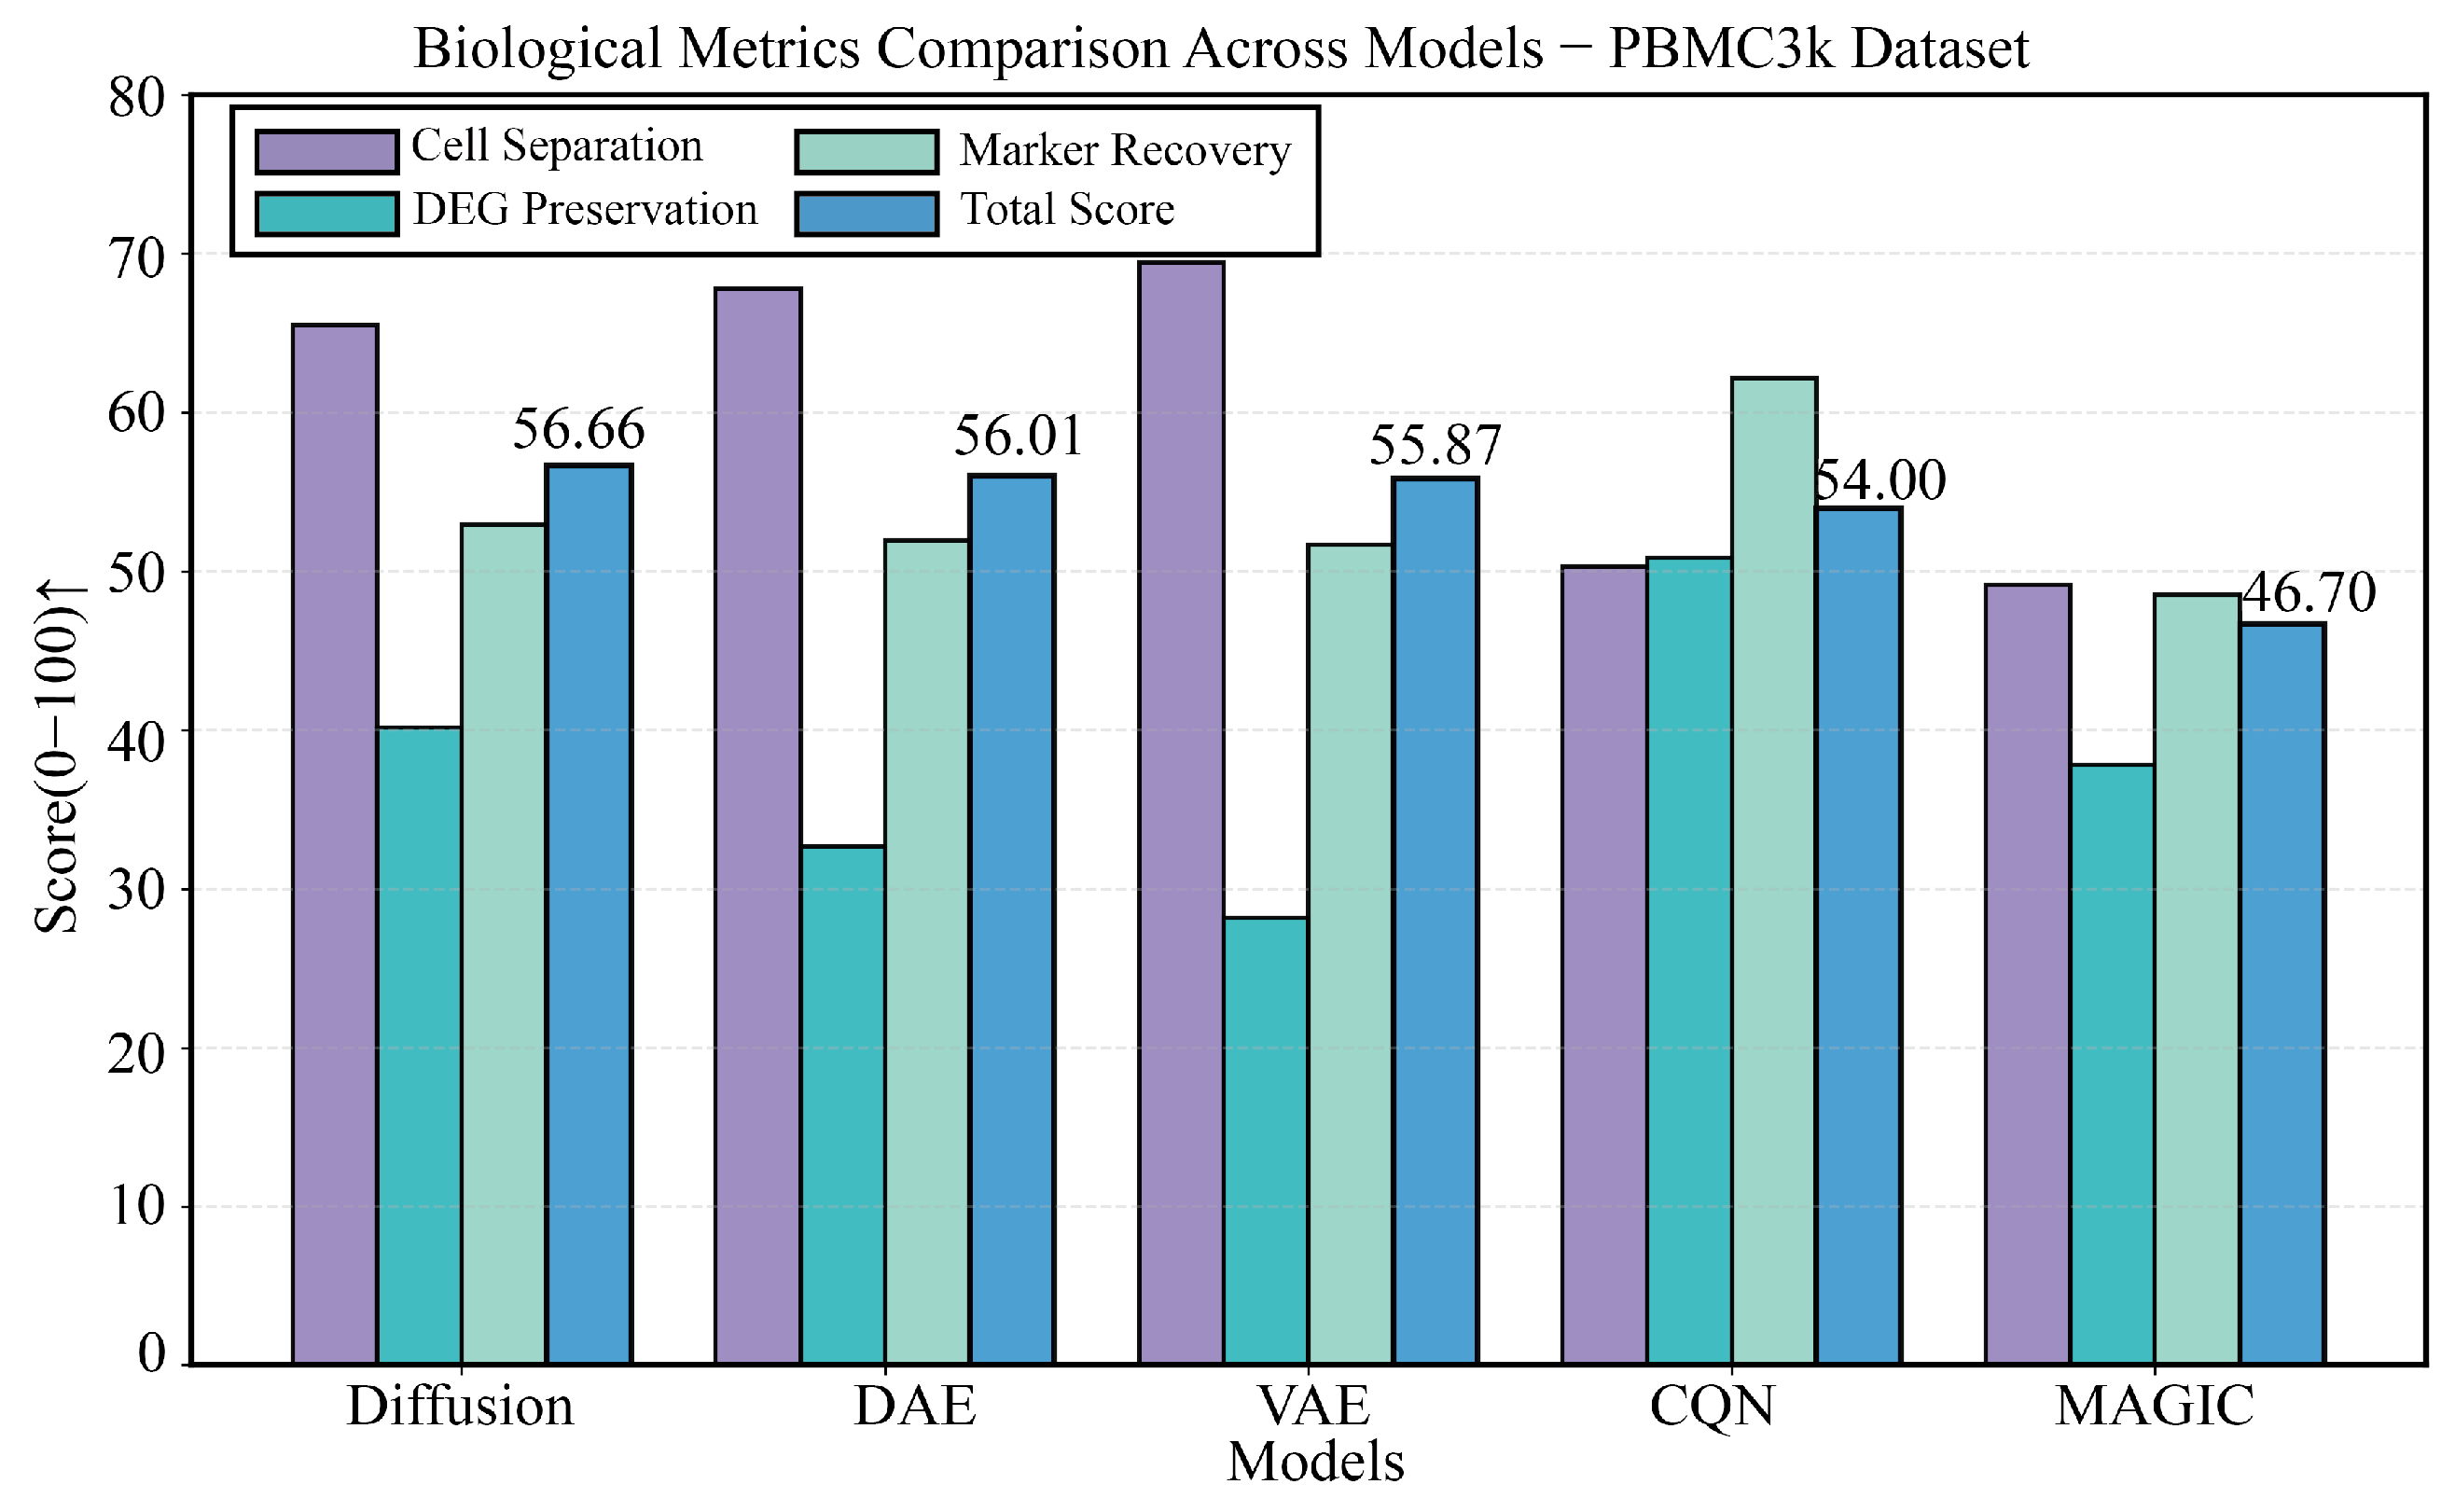
3.2. Baseline Performance Evaluation on the PBMC3k Benchmark Dataset
3.3. Robustness Validation on the PBMC68k Dataset
3.4. Performance Validation on a Highly Heterogeneous Brain Tissue Dataset
3.5. Performance Evaluation on a Liver Developmental Time-Series Dataset
3.6. Performance Challenge on a Pancreas Dataset with Rare Cells
3.7. Statistical Significance Analysis
3.8. Biological Interpretation: Mechanism of Signal Recovery
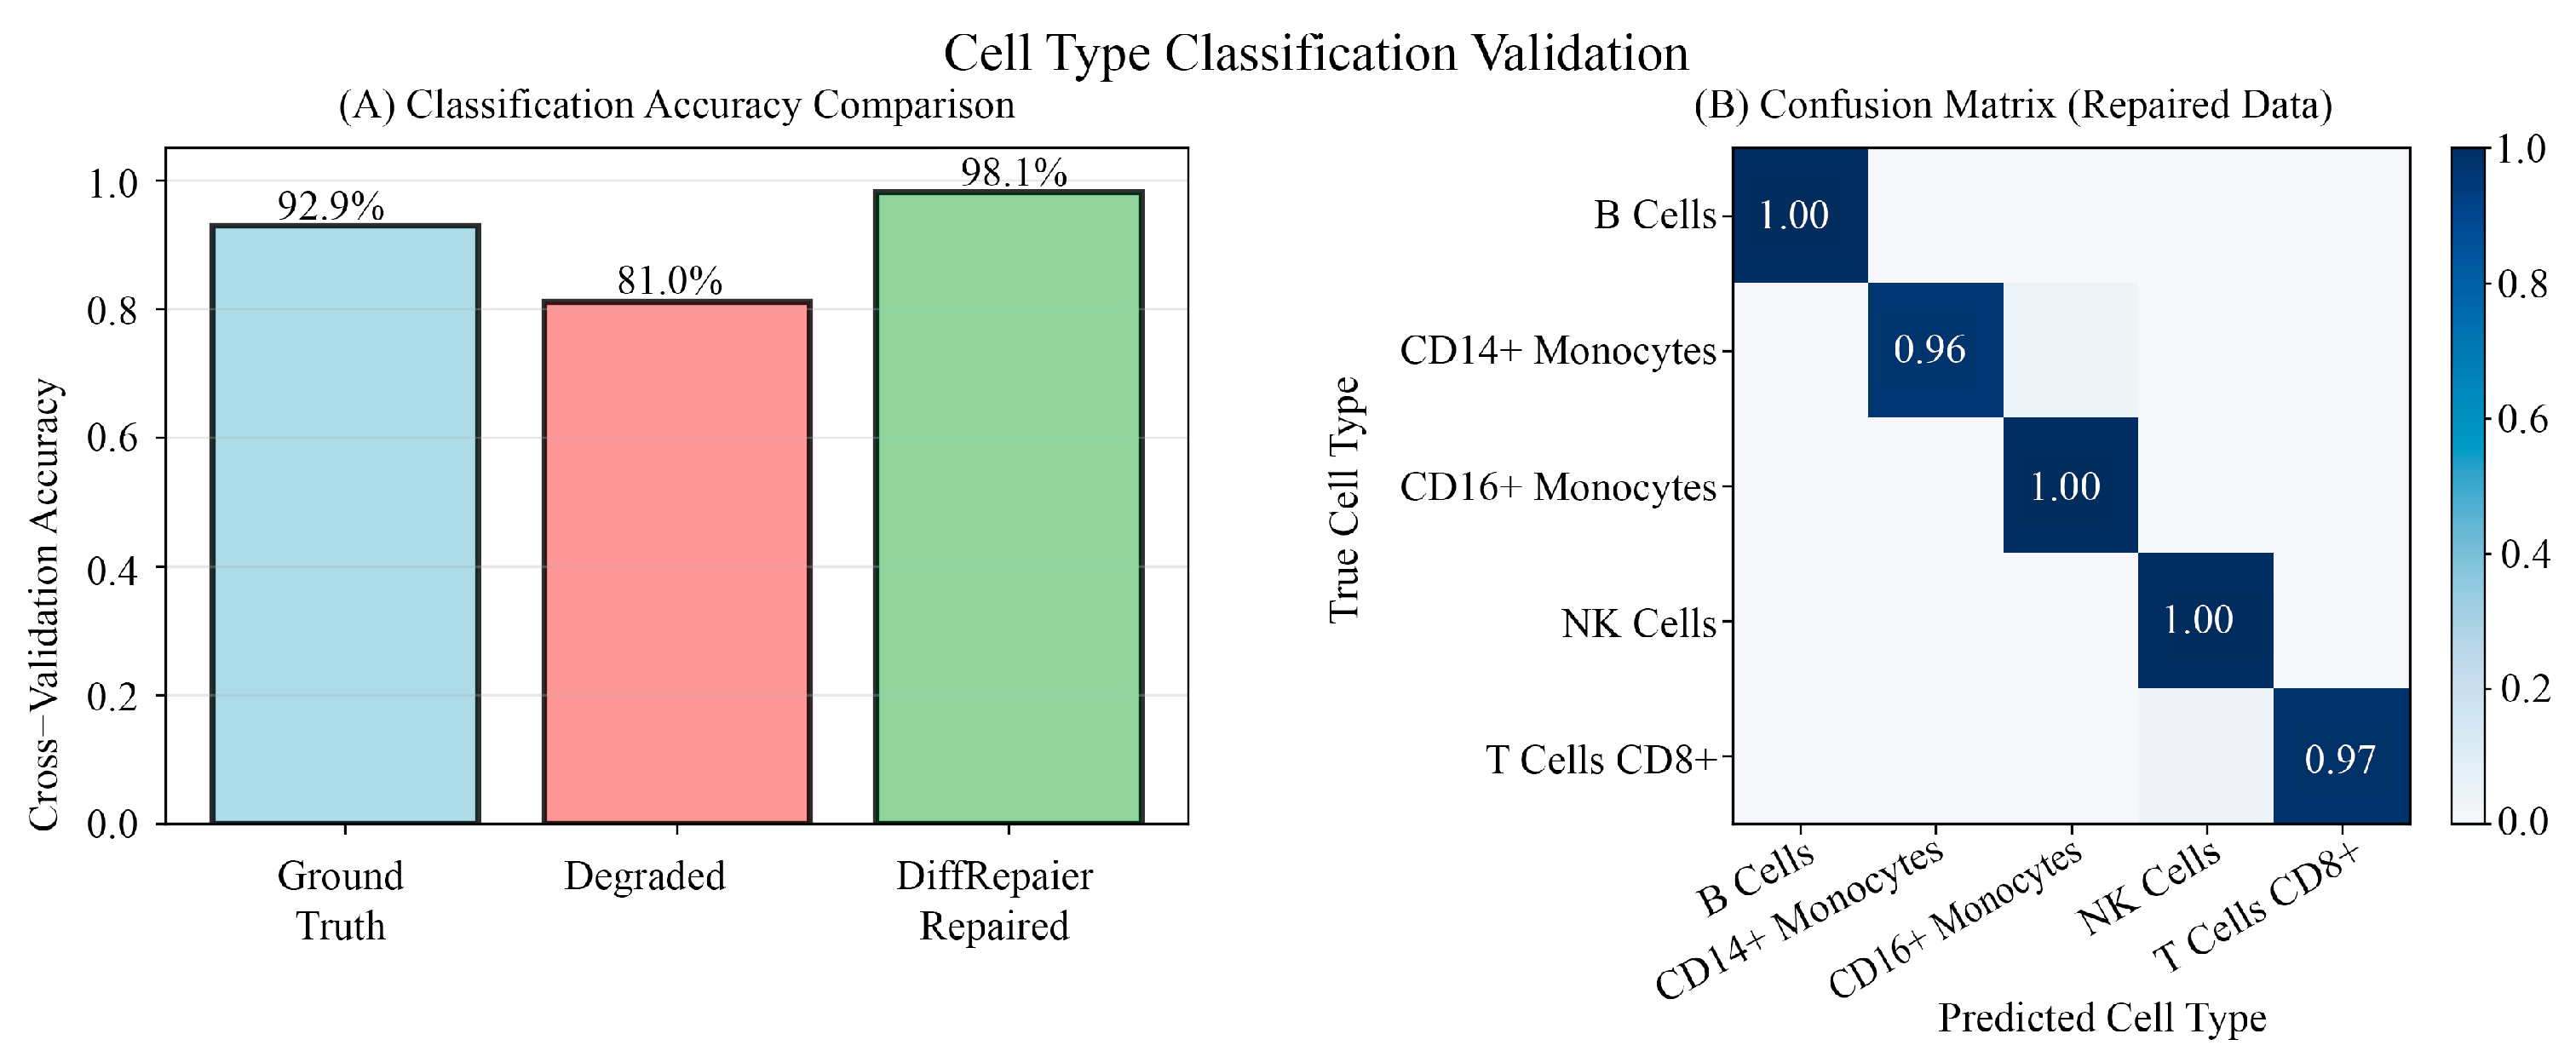
3.9. Downstream Application Validation: Performance Evaluation in Practical Biological Analysis Tasks
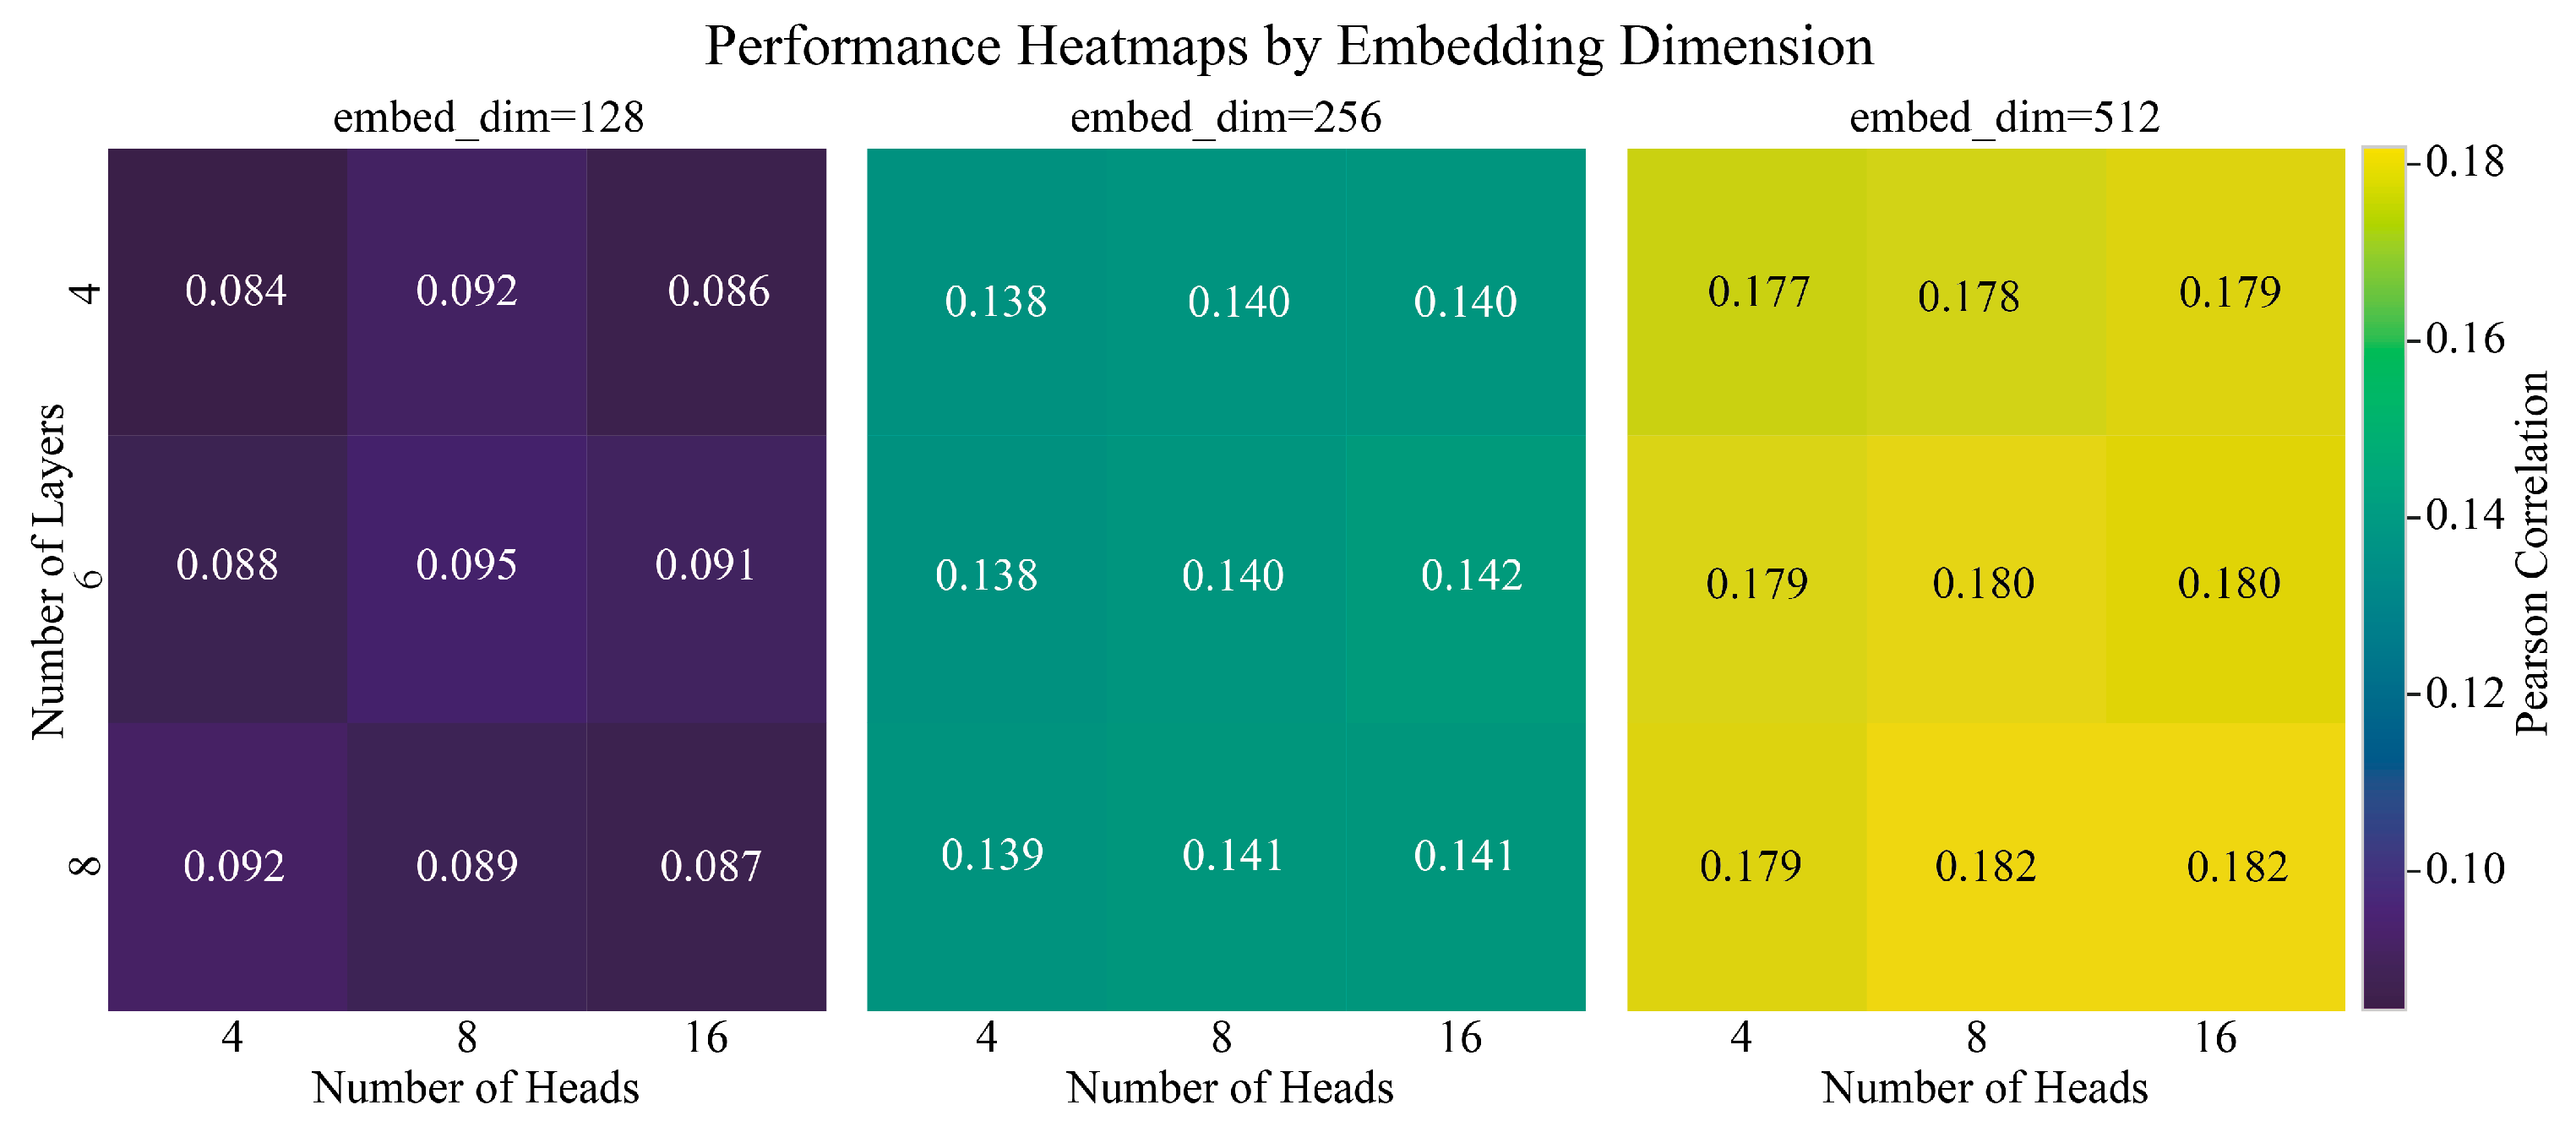
3.10. Model Robustness and Hyperparameter Sensitivity
4. Discussion
4.1. Synergy of Architecture, Paradigm, and Framework: The Key to DiffRepairer’s Success
4.2. Future Prospects of High-Fidelity Transcriptome Reconstruction in Biomedical Research
4.3. Limitations and Future Directions
5. Conclusions
Author Contributions
Funding
Institutional Review Board Statement
Data Availability Statement
Acknowledgments
Conflicts of Interest
Appendix A


Appendix B
| Gene | Cell_ID | Original | Degraded | Repaired |
|---|---|---|---|---|
| GNLY | Cell_142 | −0.235 | −0.232 | 1.927 |
| CD3D | Cell_142 | 2.581 | −0.639 | 1.185 |
| MS4A1 | Cell_142 | −0.314 | −0.314 | 0.362 |
| CD8A | Cell_142 | −0.307 | −0.307 | −0.486 |
| GNLY | Cell_99 | 3.891 | −0.227 | 1.325 |
| CD3D | Cell_99 | −0.177 | −0.162 | −0.432 |
| MS4A1 | Cell_99 | −0.314 | −0.291 | 0.447 |
| CD8A | Cell_99 | −0.307 | −0.129 | 0.278 |
| GNLY | Cell_100 | −0.235 | −0.231 | −0.337 |
| CD3D | Cell_100 | 1.265 | −0.639 | −0.211 |
| MS4A1 | Cell_100 | −0.314 | −0.275 | −0.341 |
| CD8A | Cell_100 | −0.307 | 0.307 | 0.501 |
References
- Hedegaard, J.; Thorsen, K.; Lund, M.K.; Hein, A.M.K.; Hamilton-Dutoit, S.J.; Vang, S.; Nordentoft, I.; Birkenkamp-Demtröder, K.; Kruhøffer, M.; Hager, H.; et al. Next-Generation Sequencing of RNA and DNA Isolated from Paired Fresh-Frozen and Formalin-Fixed Paraffin-Embedded Samples of Human Cancer and Normal Tissue. PLoS ONE 2014, 9, e98187. [Google Scholar] [CrossRef] [PubMed]
- Yi, P.C.; Zhuo, L.; Lin, J.; Chang, C.; Goddard, A.; Yoon, O.K. Impact of Delayed PBMC Processing on Functional and Genomic Assays. J. Immunol. Methods 2023, 519, 113514. [Google Scholar] [CrossRef] [PubMed]
- Barrett, T.; Wilhite, S.E.; Ledoux, P.; Evangelista, C.; Kim, I.F.; Tomashevsky, M.; Marshall, K.A.; Phillippy, K.H.; Sherman, P.M.; Holko, M.; et al. NCBI GEO: Archive for Functional Genomics Data Sets—Update. Nucleic Acids Res. 2013, 41, D991–D995. [Google Scholar] [CrossRef]
- van Dijk, D.; Sharma, R.; Nainys, J.; Yim, K.; Kathail, P.; Carr, A.J.; Burdziak, C.; Moon, K.R.; Chaffer, C.L.; Pattabiraman, D.; et al. Recovering Gene Interactions from Single-Cell Data Using Data Diffusion. Cell 2018, 174, 716–729.e27. [Google Scholar] [CrossRef]
- Ho, J.; Jain, A.; Abbeel, P. Denoising Diffusion Probabilistic Models. In Proceedings of the Advances in Neural Information Processing Systems, Virtual, 6–12 December 2020; Volume 2020-December. [Google Scholar]
- Cui, H.; Wang, C.; Maan, H.; Pang, K.; Luo, F.; Duan, N.; Wang, B. ScGPT: Toward Building a Foundation Model for Single-Cell Multi-Omics Using Generative AI. Nat. Methods 2024, 21, 1470–1480. [Google Scholar] [CrossRef] [PubMed]
- Song, D.; Wang, Q.; Yan, G.; Liu, T.; Li, J.J. A Unified Framework of Realistic in Silico Data Generation and Statistical Model Inference for Single-Cell and Spatial Omics. bioRxiv 2023. [Google Scholar] [CrossRef]
- Gayoso, A.; Lopez, R.; Xing, G.; Boyeau, P.; Wu, K.; Jayasuriya, M.; Melhman, E.; Langevin, M.; Liu, Y.; Samaran, J.; et al. Scvi-Tools: A Library for Deep Probabilistic Analysis of Single-Cell Omics Data. bioRxiv 2021. [Google Scholar] [CrossRef]
- Song, Y.; Dhariwal, P.; Chen, M.; Sutskever, I. Consistency Models. In Proceedings of the Machine Learning Research, Honolulu, HI, USA, 23–29 July 2023; Volume 202. [Google Scholar]
- Vaswani, A.; Shazeer, N.; Parmar, N.; Uszkoreit, J.; Jones, L.; Gomez, A.N.; Kaiser, Ł.; Polosukhin, I. Attention Is All You Need. In Proceedings of the Advances in Neural Information Processing Systems, Long Beach, CA, USA, 4–9 December 2017; Volume 2017. [Google Scholar]
- Zheng, G.X.Y.; Terry, J.M.; Belgrader, P.; Ryvkin, P.; Bent, Z.W.; Wilson, R.; Ziraldo, S.B.; Wheeler, T.D.; McDermott, G.P.; Zhu, J.; et al. Massively Parallel Digital Transcriptional Profiling of Single Cells. Nat. Commun. 2017, 8, 14049. [Google Scholar] [CrossRef]
- Zeisel, A.; Hochgerner, H.; Lönnerberg, P.; Johnsson, A.; Memic, F.; van der Zwan, J.; Häring, M.; Braun, E.; Borm, L.E.; La Manno, G.; et al. Molecular Architecture of the Mouse Nervous System. Cell 2018, 174, 999–1014.e22. [Google Scholar] [CrossRef]
- Camp, J.G.; Sekine, K.; Gerber, T.; Loeffler-Wirth, H.; Binder, H.; Gac, M.; Kanton, S.; Kageyama, J.; Damm, G.; Seehofer, D.; et al. Multilineage Communication Regulates Human Liver Bud Development from Pluripotency. Nature 2017, 546, 533–538. [Google Scholar] [CrossRef]
- Muraro, M.J.; Dharmadhikari, G.; Grün, D.; Groen, N.; Dielen, T.; Jansen, E.; van Gurp, L.; Engelse, M.A.; Carlotti, F.; de Koning, E.J.P.; et al. A Single-Cell Transcriptome Atlas of the Human Pancreas. Cell Syst. 2016, 3, 385–394.e3. [Google Scholar] [CrossRef]
- Villani, A.C.; Satija, R.; Reynolds, G.; Sarkizova, S.; Shekhar, K.; Fletcher, J.; Griesbeck, M.; Butler, A.; Zheng, S.; Lazo, S.; et al. Single-Cell RNA-Seq Reveals New Types of Human Blood Dendritic Cells, Monocytes, and Progenitors. Science 2017, 356, eaah4573. [Google Scholar] [CrossRef]
- Amezquita, R.A.; Lun, A.T.L.; Becht, E.; Carey, V.J.; Carpp, L.N.; Geistlinger, L.; Marini, F.; Rue-Albrecht, K.; Risso, D.; Soneson, C.; et al. Orchestrating Single-Cell Analysis with Bioconductor. Nat. Methods 2020, 17, 137–145. [Google Scholar] [CrossRef] [PubMed]
- Zappia, L.; Phipson, B.; Oshlack, A. Splatter: Simulation of Single-Cell RNA Sequencing Data. Genome Biol. 2017, 18, 174. [Google Scholar] [CrossRef] [PubMed]
- Stoeckius, M.; Hafemeister, C.; Stephenson, W.; Houck-Loomis, B.; Chattopadhyay, P.K.; Swerdlow, H.; Satija, R.; Smibert, P. Simultaneous Epitope and Transcriptome Measurement in Single Cells. Nat. Methods 2017, 14, 865–868. [Google Scholar] [CrossRef] [PubMed]
- Vincent, P.; Larochelle, H.; Lajoie, I.; Bengio, Y.; Manzagol, P.A. Stacked Denoising Autoencoders: Learning Useful Representations in a Deep Network with a Local Denoising Criterion. J. Mach. Learn. Res. 2010, 11, 3371–3408. [Google Scholar]
- Kingma, D.P.; Welling, M. Auto-Encoding Variational Bayes. In Proceedings of the 2nd International Conference on Learning Representations, ICLR 2014—Conference Track Proceedings, Banff, AB, Canada, 14–16 April 2014. [Google Scholar]
- Hansen, K.D.; Irizarry, R.A.; Wu, Z. Removing Technical Variability in RNA-Seq Data Using Conditional Quantile Normalization. Biostatistics 2012, 13, 204–216. [Google Scholar] [CrossRef]
- Deyneko, I.V. Guidelines on the Performance Evaluation of Motif Recognition Methods in Bioinformatics. Front. Genet. 2023, 14, 1135320. [Google Scholar] [CrossRef]
- Haghverdi, L.; Büttner, M.; Wolf, F.A.; Buettner, F.; Theis, F.J. Diffusion Pseudotime Robustly Reconstructs Lineage Branching. Nat. Methods 2016, 13, 845–848. [Google Scholar] [CrossRef]
- Dhariwal, P.; Nichol, A. Diffusion Models Beat GANs on Image Synthesis. In Proceedings of the Advances in Neural Information Processing Systems, Online, 6–14 December 2021; Volume 11. [Google Scholar]
- Fefferman, C.; Mitter, S.; Narayanan, H. Testing the Manifold Hypothesis. J. Am. Math. Soc. 2016, 29, 983–1049. [Google Scholar] [CrossRef]
- Leek, J.T.; Scharpf, R.B.; Bravo, H.C.; Simcha, D.; Langmead, B.; Johnson, W.E.; Geman, D.; Baggerly, K.; Irizarry, R.A. Tackling the Widespread and Critical Impact of Batch Effects in High-Throughput Data. Nat. Rev. Genet. 2010, 11, 733–739. [Google Scholar] [CrossRef] [PubMed]
- Lazar, C.; Meganck, S.; Taminau, J.; Steenhoff, D.; Coletta, A.; Molter, C.; Weiss-Solís, D.Y.; Duque, R.; Bersini, H.; Nowé, A. Batch Effect Removal Methods for Microarray Gene Expression Data Integration: A Survey. Brief. Bioinform. 2013, 14, 469–490. [Google Scholar] [CrossRef] [PubMed]
- Blow, N. Tissue Preparation: Tissue Issues. Nature 2007, 448, 959–960. [Google Scholar] [CrossRef] [PubMed]
- McGranahan, N.; Swanton, C. Clonal Heterogeneity and Tumor Evolution: Past, Present, and the Future. Cell 2017, 168, 613–628. [Google Scholar] [CrossRef]
- Eraslan, G.; Simon, L.M.; Mircea, M.; Mueller, N.S.; Theis, F.J. Single-Cell RNA-Seq Denoising Using a Deep Count Autoencoder. Nat. Commun. 2019, 10, 390. [Google Scholar] [CrossRef]
- Wiegreffe, S.; Pinter, Y. Attention Is Not Not Explanation. In Proceedings of the EMNLP-IJCNLP 2019—2019 Conference on Empirical Methods in Natural Language Processing and 9th International Joint Conference on Natural Language Processing, Proceedings of the Conference, Hong Kong, China, 3–7 November 2019. [Google Scholar]
- Theodoris, C.V.; Xiao, L.; Chopra, A.; Chaffin, M.D.; Al Sayed, Z.R.; Hill, M.C.; Mantineo, H.; Brydon, E.M.; Zeng, Z.; Liu, X.S.; et al. Transfer Learning Enables Predictions in Network Biology. Nature 2023, 618, 616–624. [Google Scholar] [CrossRef]
- Katharopoulos, A.; Vyas, A.; Pappas, N.; Fleuret, F. Transformers Are RNNs: Fast Autoregressive Transformers with Linear Attention. In Proceedings of the 37th International Conference on Machine Learning, ICML 2020, Vienna, Austria, 12–18 July 2020; Volume PartF168147-7. [Google Scholar]
- Gu, A.; Goel, K.; Ré, C. Efficiently Modeling Long Sequences with Structured State Spaces. In Proceedings of the ICLR 2022—10th International Conference on Learning Representations, Virtual, 25–29 April 2022. [Google Scholar]
- Gou, J.; Yu, B.; Maybank, S.J.; Tao, D. Knowledge Distillation: A Survey. Int. J. Comput. Vis. 2021, 129, 1789–1819. [Google Scholar] [CrossRef]



| Model | MSE | Pearson | PR-AUC | F1-Score |
|---|---|---|---|---|
| DiffRepairer | 33.090 | 0.815 | 0.764 | 0.630 |
| DAE | 36.130 | 0.816 | 0.777 | 0.632 |
| VAE | 32.790 | 0.822 | 0.779 | 0.626 |
| CQN | 83.550 | 0.613 | 0.773 | 0.649 |
| MAGIC | 78.820 | 0.679 | 0.701 | 0.504 |
| Model | Cell Type Separation | DEG Preservation | Marker Gene Recovery | Overall Biological Score |
|---|---|---|---|---|
| DiffRepairer | 65.210 | 57.410 | 66.450 | 63.023 |
| DAE | 68.530 | 42.760 | 65.250 | 58.847 |
| VAE | 66.500 | 43.650 | 65.510 | 58.553 |
| CQN | 54.230 | 64.950 | 69.010 | 62.730 |
| MAGIC | 51.750 | 52.910 | 59.100 | 54.587 |
| Comparison | Sample Size | Metric | p-Value | Cohen’s d |
|---|---|---|---|---|
| DiffRepairer vs. DAE | n = 1512 | MSE | p < 1 × 10⁻¹⁰ | d = 0.35 |
| Pearson | p < 1 × 10⁻¹⁰ | d = 0.52 | ||
| DiffRepairer vs. VAE | n = 1512 | MSE | p < 1 × 10⁻¹⁰ | d = 0.36 |
| Pearson | p < 1 × 10⁻¹⁰ | d = 0.29 | ||
| DiffRepairer vs. CQN | n = 1512 | MSE | p < 1 × 10⁻¹⁰ | d = 0.29 |
| Pearson | p < 1 × 10⁻¹⁰ | d = −4.77 | ||
| DiffRepairer vs. MAGIC | n = 1512 | MSE | p < 1 × 10⁻¹⁰ | d = 0.71 |
| Pearson | p < 1 × 10⁻¹⁰ | d = −0.48 |
Disclaimer/Publisher’s Note: The statements, opinions and data contained in all publications are solely those of the individual author(s) and contributor(s) and not of MDPI and/or the editor(s). MDPI and/or the editor(s) disclaim responsibility for any injury to people or property resulting from any ideas, methods, instructions or products referred to in the content. |
© 2025 by the authors. Licensee MDPI, Basel, Switzerland. This article is an open access article distributed under the terms and conditions of the Creative Commons Attribution (CC BY) license (https://creativecommons.org/licenses/by/4.0/).
Share and Cite
Xiao, K.; Sun, J.; Liu, Y.; Li, C.; Guo, H.; Wang, Y.; Pang, Y.; Liu, Z. High-Fidelity Transcriptome Reconstruction of Degraded RNA-Seq Samples Using Denoising Diffusion Models. Biology 2025, 14, 1652. https://doi.org/10.3390/biology14121652
Xiao K, Sun J, Liu Y, Li C, Guo H, Wang Y, Pang Y, Liu Z. High-Fidelity Transcriptome Reconstruction of Degraded RNA-Seq Samples Using Denoising Diffusion Models. Biology. 2025; 14(12):1652. https://doi.org/10.3390/biology14121652
Chicago/Turabian StyleXiao, Ke, Jinlei Sun, Yunqing Liu, Chen Li, Hengchuan Guo, Yiying Wang, Yajun Pang, and Zhiyu Liu. 2025. "High-Fidelity Transcriptome Reconstruction of Degraded RNA-Seq Samples Using Denoising Diffusion Models" Biology 14, no. 12: 1652. https://doi.org/10.3390/biology14121652
APA StyleXiao, K., Sun, J., Liu, Y., Li, C., Guo, H., Wang, Y., Pang, Y., & Liu, Z. (2025). High-Fidelity Transcriptome Reconstruction of Degraded RNA-Seq Samples Using Denoising Diffusion Models. Biology, 14(12), 1652. https://doi.org/10.3390/biology14121652


