Article

Phylogeographic Insights into Pipistrellus Species from Türkiye: Diversity, Divergence, and Regional Lineage Structure

1
Institute of Science, Hitit University, 19030 Çorum, Türkiye
2
Department of Biology, Faculty of Science, Gazi University, 06500 Ankara, Türkiye
3
Vocational School of Health Services, Aksaray University, 68100 Aksaray, Türkiye
*
Author to whom correspondence should be addressed.
Biology 2025, 14(11), 1549; https://doi.org/10.3390/biology14111549
Submission received: 1 October 2025 / Revised: 29 October 2025 / Accepted: 2 November 2025 / Published: 4 November 2025
(This article belongs to the Section Zoology)

Simple Summary

Bats are important mammals that contribute to natural balance by consuming insects and serving as indicators of healthy ecosystems. In Türkiye, four closely related species of the genus Pipistrellus are found, yet they are extremely difficult to identify based on external appearance alone. This study investigated their genetic diversity and evolutionary history using mitochondrial Cytb sequences collected from a wide range of regions. The results showed that external features often lead to misidentification, especially between the common pipistrelle and the soprano pipistrelle, highlighting the importance of molecular data for reliable classification. We also discovered that Türkiye plays a dual role in bat evolution, serving both as a refugium for unique lineages and as a contact zone where different lineages meet. Distinct lineages of the common pipistrelle and Kuhl’s pipistrelle were found to overlap within Anatolia, and a previously unrecognized lineage of Nathusius’ pipistrelle was detected in southwestern Türkiye. In Pipistrellus pipistrellus, the Anatolian Diagonal separates eastern and western lineages while still allowing their overlap, acting as both barrier and corridor. These findings emphasize the value of Türkiye as both a refugium and a crossroads for bat diversity, providing knowledge essential for conservation and ecosystem protection.

Abstract

This study investigates the phylogenetic relationships, genetic diversity, and biogeographic structure of Pipistrellus species in Türkiye using mitochondrial cytochrome b (Cytb) sequences from 156 specimens collected across 26 localities. Our primary aim was to clarify taxonomic boundaries of morphologically cryptic species and elucidate the evolutionary role of Anatolia in the Western Palearctic. Analyses strongly confirmed that molecular data are mandatory for defining taxonomic boundaries. Crucially, all individuals morphologically identified as P. pygmaeus were genetically determined to be P. pipistrellus, highlighting the inadequacy of external traits for cryptic species. We resolved deep intraspecific divergence across the genus. In P. pipistrellus, two major lineages (Eastern and Western) were identified, partially separated by the Anatolian Diagonal. Their co-occurrence in multiple localities confirms Anatolia’s function as a secondary contact zone. Similarly, P. kuhlii populations represent a transition zone where two distinct lineages, one of Asiatic origin (P. k. lepidus) and one Mediterranean-Levantine (P. k. kuhlii), meet. Furthermore, while P. nathusii is largely associated with migratory European lineages; a genetically distinct, potentially resident lineage was revealed in southwestern Anatolia. Divergence time estimations indicate that this diversification was shaped by major climatic events from the Miocene to the Pleistocene. This study demonstrates that Anatolia is more than just a geographic bridge; it is a dynamic center of evolution, functioning critically as both a glacial refugium and a secondary contact zone for Palearctic bat fauna.

1. Introduction

The Mediterranean Basin is recognized as one of the world’s biodiversity hotspots, acting as a critical refugium for many taxa during the Quaternary glacial cycles [1]. Its complex topography and climatic heterogeneity fostered the survival, divergence, and secondary contact of numerous species lineages. Straddling the Asian and European continents, Türkiye acts as a natural bridge and biogeographic corridor [1,2]. This makes it an ideal landscape for studying evolutionary processes, including range shifts, species radiation, and gene flow. This strategic location and diverse ecological zones have crucially shaped the genetic and phenotypic diversity of its mammalian fauna. Bats (Chiroptera), which comprise nearly one-quarter of all mammal species worldwide, are particularly affected [3,4,5].
Within Chiroptera, the genus Pipistrellus (family Vespertilionidae) represents a taxonomically and ecologically diverse group, distributed across the Palearctic region and known for its cryptic morphology, high dispersal capabilities, and wide habitat tolerance [6,7]. The genus includes approximately 35 species globally. Four species—P. pipistrellus (Schreber, 1774), P. kuhlii (Kuhl, 1817), P. nathusii (Keyserling & Blasius, 1839), and P. pygmaeus (Leach, 1825)—are confirmed to occur in Türkiye [8]. These species are often sympatric, yet their identification remains problematic due to subtle morphological differences and the presence of cryptic species complexes [9,10,11,12].
Regional studies on Turkish Pipistrellus populations have focused on morphological [13,14], karyological [15], and ecological aspects [16,17]. However, despite the species’ broad distribution and ecological importance, molecular studies on their phylogenetics and phylogeography remain limited in geographic scope and depth. This gap is critical for conservation. Bats serve as keystone species yet are highly sensitive to anthropogenic pressures such as habitat fragmentation, deforestation, agricultural intensification, and wind energy infrastructure expansion [18,19,20,21].
Molecular phylogenetic approaches, especially those based on mitochondrial markers such as cytochrome b (Cytb), have become fundamental tools for studying species boundaries, uncovering cryptic diversity, and reconstructing historical biogeographic scenarios [22,23,24,25,26,27]. Although our study focuses on mitochondrial data, such markers provide valuable first-line insights into genetic structure and biogeographic history, particularly when broader genomic data are not yet available. Moreover, the application of Cytb in Chiroptera phylogeography has enabled the identification of divergent lineages, postglacial recolonization routes, and historical refugia. For example, Hulva et al. showed that P. pipistrellus populations in Türkiye, especially those in Antalya and Cappadocia, have high haplotypic diversity [28]. This suggests these areas may be evolutionary hotspots. Similarly, Çoraman et al. analyzed ND1 and Cytb across four Turkish Pipistrellus species [2]. They revealed distinct phylogeographic structures and potential secondary contact zones, particularly in Anatolia and the Black Sea region.
Despite these advances, the taxonomic and phylogeographic statuses of several Turkish Pipistrellus species and subspecies remain unresolved. For instance, Albayrak proposed a three-subspecies structure for P. pipistrellus based on morphometrics (P. p. pipistrellus, P. p. aladdin, and P. p. mediterraneus) [13]. However, this scheme lacks molecular validation. Furthermore, the altitudinal and latitudinal variation in P. kuhlii populations suggests subspecific divergence. Some researchers classify Turkish populations as P. k. ikhwanius or P. k. lepidus, based on morphological similarity to Arabian or Middle Eastern populations [17,29]. P. nathusii, known for its long-distance seasonal migration [30,31], has been recorded in Thrace and the eastern Black Sea region of Anatolia. This suggests Türkiye may serve as both a migratory corridor and a wintering ground [32]. Additionally, the taxonomic resolution of P. pygmaeus, a cryptic species historically conflated with P. pipistrellus, remains challenging in Türkiye. Molecular analyses confirm its presence [11,12]. Yet, recent studies, including this one, show persistent misidentification when relying solely on morphological traits [9,33].
In this study, we evaluate the genetic diversity, phylogenetic relationships, and biogeographic patterns of all currently documented Pipistrellus species in Türkiye using partial sequences of the mitochondrial cytochrome b (Cytb) gene. We use an expanded sampling strategy across all major biogeographic regions of Türkiye and integrate our data with previously published European and Asian sequences. This study seeks to: (i) clarify the taxonomic boundaries among Pipistrellus species and subspecies in Türkiye, (ii) identify potential historical refugia and zones of secondary contact, (iii) elucidate broader phylogeographic structures of Palearctic-distributed taxa, and (iv) estimate the evolutionary divergence times among major lineages within the genus, providing a temporal framework for speciation and diversification.

2. Materials and Methods

2.1. Tissue Collection

Fieldwork was conducted across Türkiye to sample the distributional range of Pipistrellus species. Sampling targeted diverse habitats, including caves, tree hollows, and abandoned buildings. Roosting bats were commonly observed in rural settings, often found in roof spaces, window ledges, and electrical panels. Individuals were captured manually during the day or using mist nets at dusk. Non-lethal tissue sampling was performed on live-captured individuals using biopsy punches on non-vascular areas of the wing membrane (plagiopatagium), yielding tissue fragments 2–4 mm in diameter. Samples were preserved in 90% ethanol and transported to the laboratory. Additionally, morphological traits were evaluated to confirm species identity, including forearm length (FA), third and fifth finger lengths (D3, D5), and wing membrane patterns, following the criteria of [34] (Figure 1 and Figure 2). For all captured individuals, both wings were examined to assess venation patterns used as a rapid field diagnostic tool for distinguishing closely related Pipistrellus species. Other external features, such as facial or inguinal coloration, were not assessed, and echolocation parameters were not recorded, as individuals were released immediately after tissue sampling.

2.2. Sampling

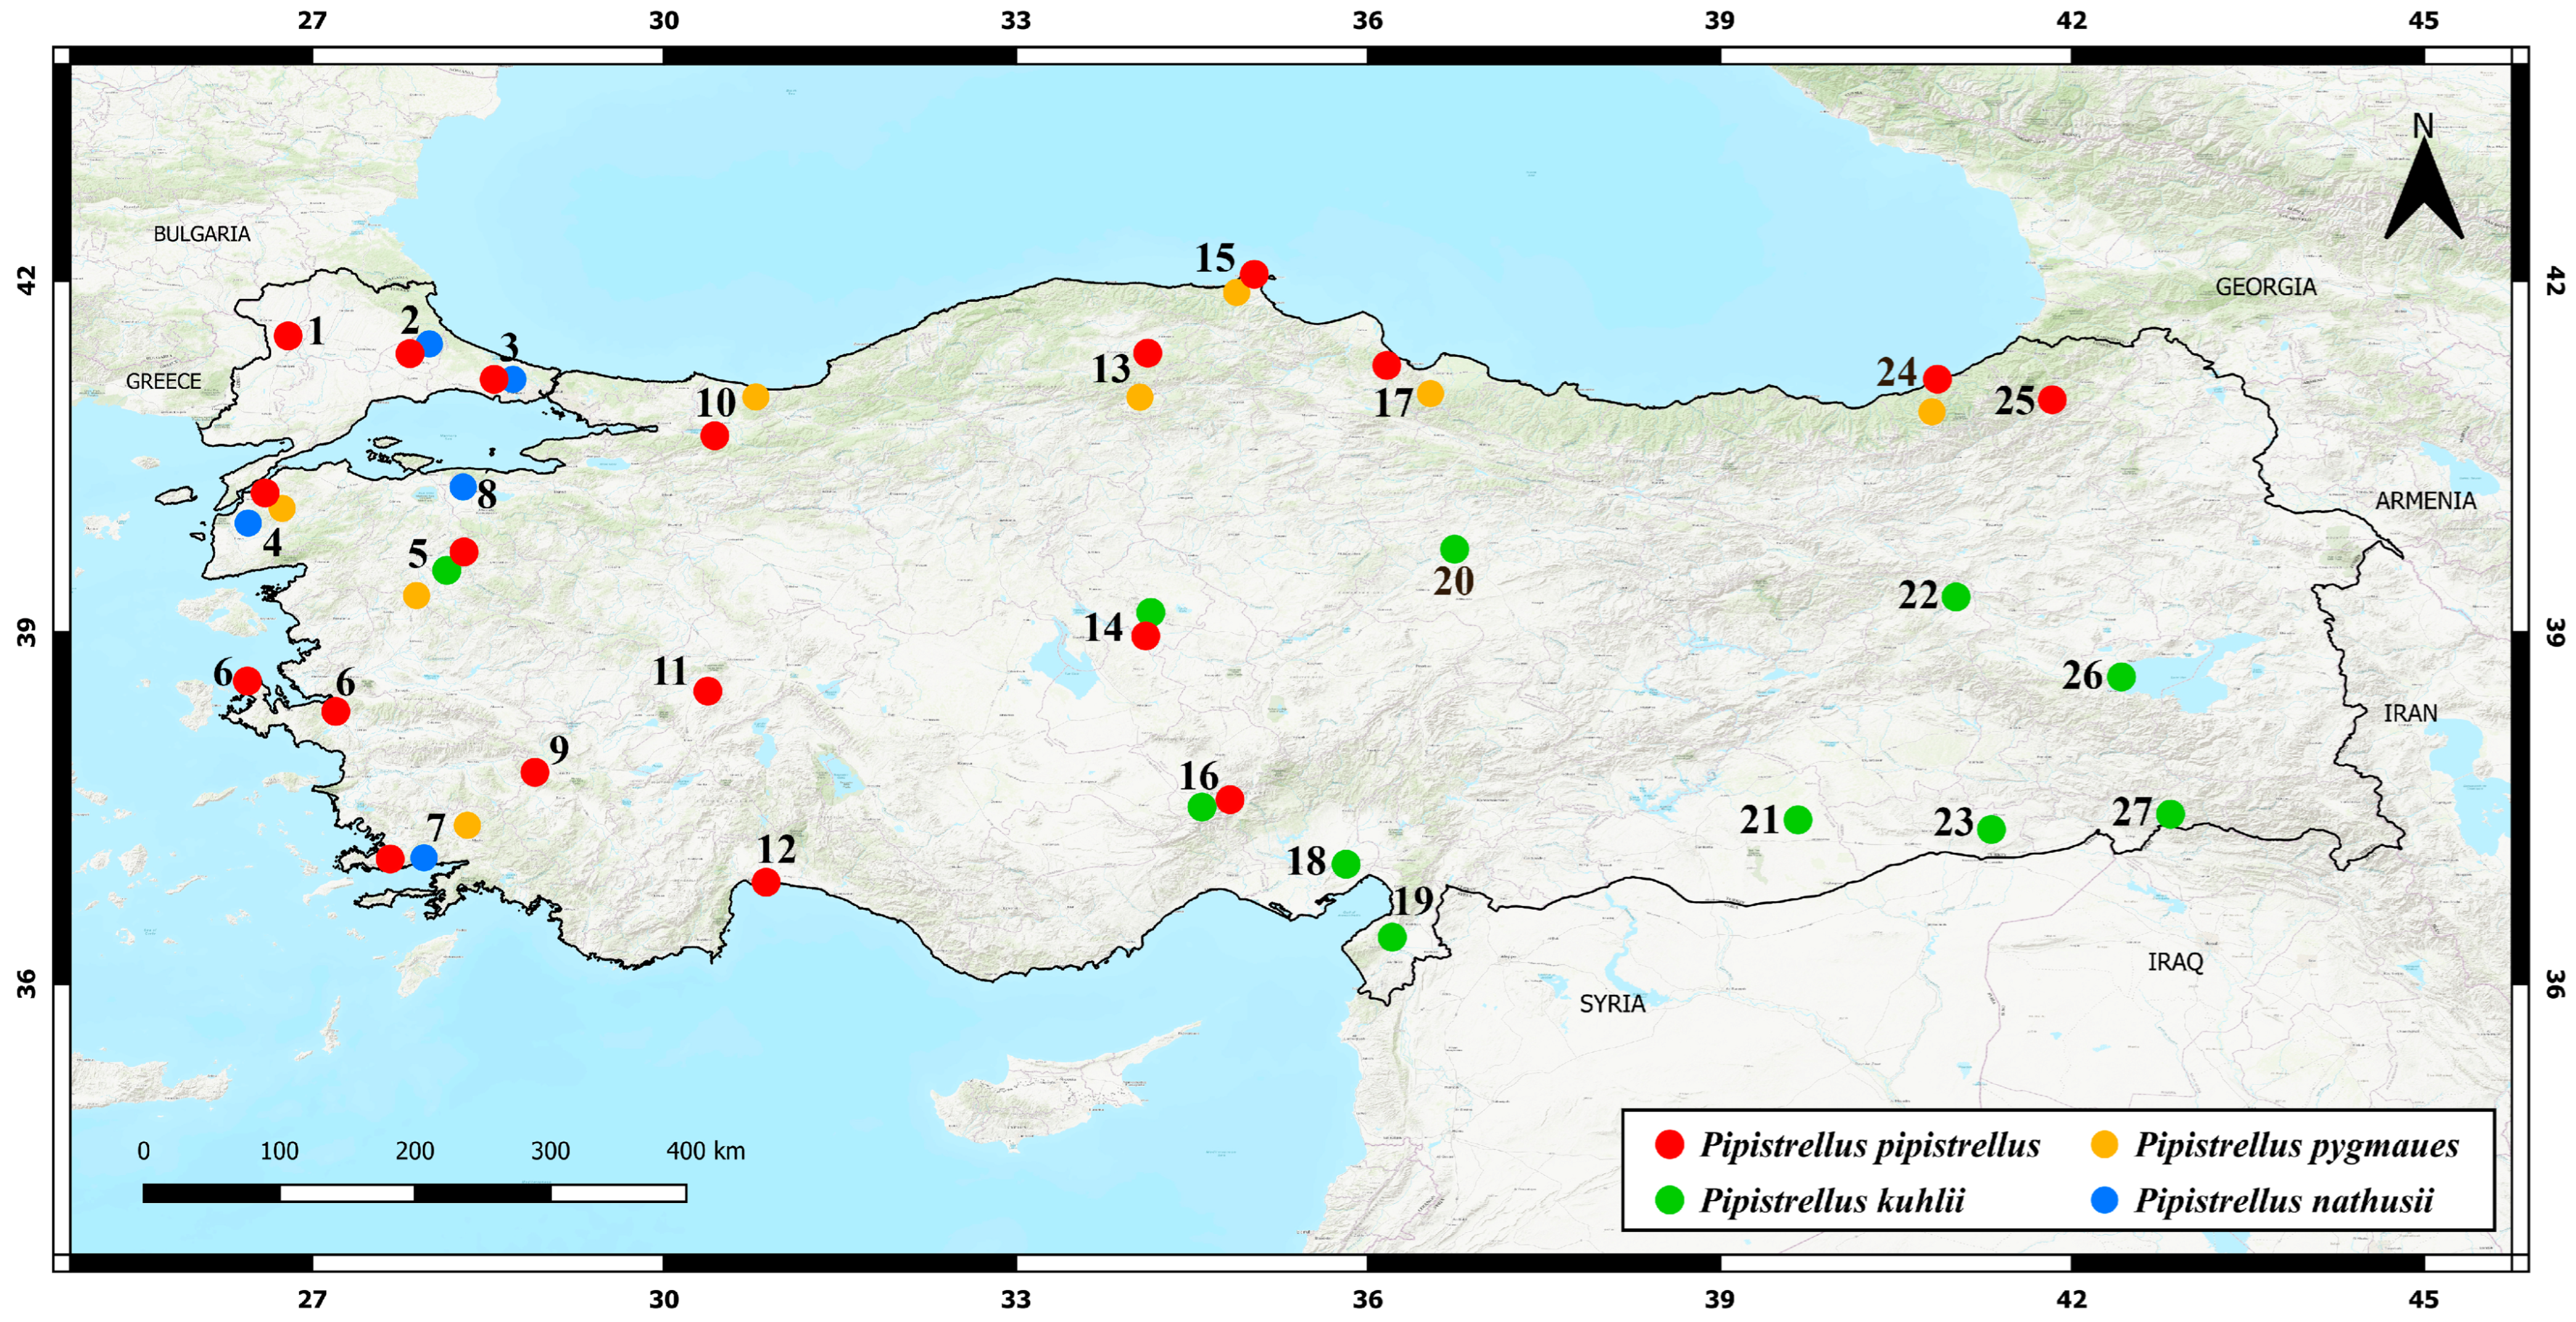
This study utilized original samples collected through extensive fieldwork in Türkiye alongside additional mitochondrial Cytb sequences retrieved from the NCBI GenBank database. Detailed metadata are provided in Supplementary File Table S1, which includes species identifications, sampling localities, voucher numbers, GenBank accession numbers, sample origins, and source publications. In total, individuals from four Pipistrellus species were analyzed across 26 localities in Türkiye (Table S1; Figure 3). The final dataset comprises 78 original P. pipistrellus individuals, 45 P. kuhlii, 11 P. nathusii, and 22 P. pygmaeus.

2.3. DNA Extraction and Polymerase Chain Reaction (PCR)

Tissue samples (2–4 mm) were obtained from the plagiopatagium (wing membranes) using sterile biopsy punches. DNA extraction was performed using the GeneMATRIX Tissue DNA Purification Kit (EURx, Gdańsk, Poland) according to the manufacturer’s protocol. DNA quality was first assessed qualitatively via 1% agarose gel electrophoresis. Quantitative evaluation of concentration and purity was conducted using a NanoDrop spectrophotometer (Thermo Fisher Scientific, Waltham, MA, USA) at absorbance wavelengths of 260 nm and 280 nm. The A260/A280 ratio was used to assess protein impurities; values near 1.8 indicated high-purity DNA. Extracted DNA was resuspended in TE buffer (10 mM Tris-HCl, 1 mM EDTA, pH 8.0) and stored at −20 °C until PCR amplification.
Amplification of the mitochondrial cytochrome b (Cytb) gene utilized the primer pair L14724a (5′ CGAAGCTTGATATGAAAAACCATCGTTG-3′) and H15915R (5′ GGAATTCATCTCTCCGGTTTACAAGAC-3′) [35]. PCR conditions were optimized to amplify the entire Cytb region as a single fragment. PCR reagent concentrations followed the protocol described by Çolak et al. [36]. The thermal cycling protocol began with an initial denaturation step at 94 °C for 5 min. This was followed by 35 cycles, each consisting of denaturation at 94 °C for 1 min, annealing at 43 °C for 1 min, and extension at 65 °C for 5 min. A final extension at 65 °C for 5 min was performed to ensure complete synthesis of all fragments. All successfully amplified PCR products were sequenced bidirectionally using the Sanger chain termination method with gene-specific primers.

2.4. Phylogenetic Reconstruction and Population Analyses

Chromatogram files were visualized using FINCHTV v1.4 software, exported in FASTA format, and subsequently aligned using BIOEDIT v7.2.5.9 [37]. Population genetic parameters were computed using DNASP v6.12.03 [38]. These parameters included the number of segregating sites (S), number of haplotypes (H), haplotype diversity (h), nucleotide diversity (π), and gene flow (Nm) between intraspecific groups. Relationships among haplotypes were visualized using median-joining networks constructed in NETWORK v10.1.0 [39]. To assess the demographic history and neutrality, Tajima’s D [40] and Fu’s Fs [41] tests were conducted using ARLEQUIN v3.5 [42]. Mismatch distribution analyses were also performed to detect signals of demographic expansion or stability, estimating demographic parameters (e.g., τ) under the sudden expansion model. Theoretical Poisson-based distributions were computed and compared with observed distributions via custom Python scripts (Python version 3.10). Phylogenetic relationships were reconstructed using the Maximum Likelihood (ML) method implemented in IQ-TREE v1.6 [43]. The best-fitting substitution model was selected based on the Bayesian Information Criterion (BIC) using MEGA v11. Genetic distances among major lineages were calculated under the Kimura 2-parameter (K2P) model.

2.5. Divergence Time Estimations

Divergence times were inferred from the mitochondrial Cytb alignment using BEAST v1.10.4 [44] under a strict molecular clock. The dataset was partitioned by codon position (1st, 2nd, 3rd). Each partition was modeled with HKY+G and empirical base frequencies; substitution and among-site rate parameters were unlinked across partitions. The clock rate was estimated from the data, conditional on fossil constraints. Node ages were calibrated with three fossil-informed MRCA priors, following Borges et al.: Crown Vespertilionidae (lognormal prior; monophyly enforced for all sampled vespertilionids), the Stem Vespertilio-Pipistrellus split (lognormal prior; monophyly enforced for Vespertilio murinus and Pipistrellus spp.), and Crown Myotis (lognormal prior; monophyly enforced for all sampled Myotis) [45]. The offset and lognormal shape parameters for each calibration were set exactly as reported by Borges et al. [45]. A Yule speciation prior was used for the tree. One MCMC chain was run for 50 million generations, sampling every 10,000 steps; the first 10% was discarded as burn-in. Convergence and mixing were assessed in Tracer (ESS > 200 for all key parameters) [46]. Finally, the maximum clade credibility (MCC) tree with median node heights and 95% HPD intervals was summarized in TreeAnnotator and visualized.

3. Results

3.1. Sampling Localities

A total of 187 Pipistrellus pipistrellus specimens collected from 19 localities across Türkiye (Figure 3) were analyzed to assess the species’ genetic structure. These individuals yielded 970 bp fragments of the mitochondrial cytochrome b (Cytb) gene. The original dataset was then expanded with 62 additional sequences retrieved from the NCBI GenBank database. Phylogenetic rooting was achieved using one P. nathusii individual from the present study (Accession No. PV951912) and one Myotis myotis sequence from GenBank (Accession No. AF376860). In total, 142 P. pipistrellus sequences and two outgroups were included, enabling a comprehensive evaluation of genetic diversity and haplotype composition (Table S1). The genetic diversity and phylogenetic relationships of Pipistrellus kuhlii were evaluated using both field-collected specimens and sequences from GenBank. A total of 45 individuals sampled from 10 localities across Türkiye yielded Cytb fragments ranging from 1008 to 1113 bp. We incorporated an additional 41 P. kuhlii Cytb sequences from GenBank, and the phylogenetic tree was rooted using one P. pipistrellus specimen from this study (Accession No. PV951922) and one M. myotis sequence (Accession No. AF376860). Analyses of Pipistrellus nathusii included 11 original specimens collected from five localities in Türkiye; each produced 1009 bp Cytb sequences. Six European reference sequences from GenBank were also incorporated to place the Turkish samples within a broader phylogenetic context. One P. pipistrellus individual from this study (Accession No. PV951922) and one M. myotis sequence (Accession No. AF376860) were used as outgroups for rooting. Twenty-two individuals morphologically identified as Pipistrellus pygmaeus were sampled from nine localities across Türkiye (Muğla, Çanakkale, Edirne, Sakarya, Kastamonu, Rize, Samsun, Sinop, and Balıkesir) (Table S1). Nineteen Cytb sequences labeled as P. pygmaeus were retrieved from GenBank, representing populations from Azerbaijan, Iran, Greece, Spain, Switzerland, Portugal, the Czech Republic, Cyprus, and Türkiye, and were also included in the analysis. One P. pipistrellus specimen from this study (Accession No. PV951922) and one M. myotis sequence (Accession No. AF376860) served as outgroups.

3.2. Phylogenetic Relationships, Genetic Distances, and Gene Flow

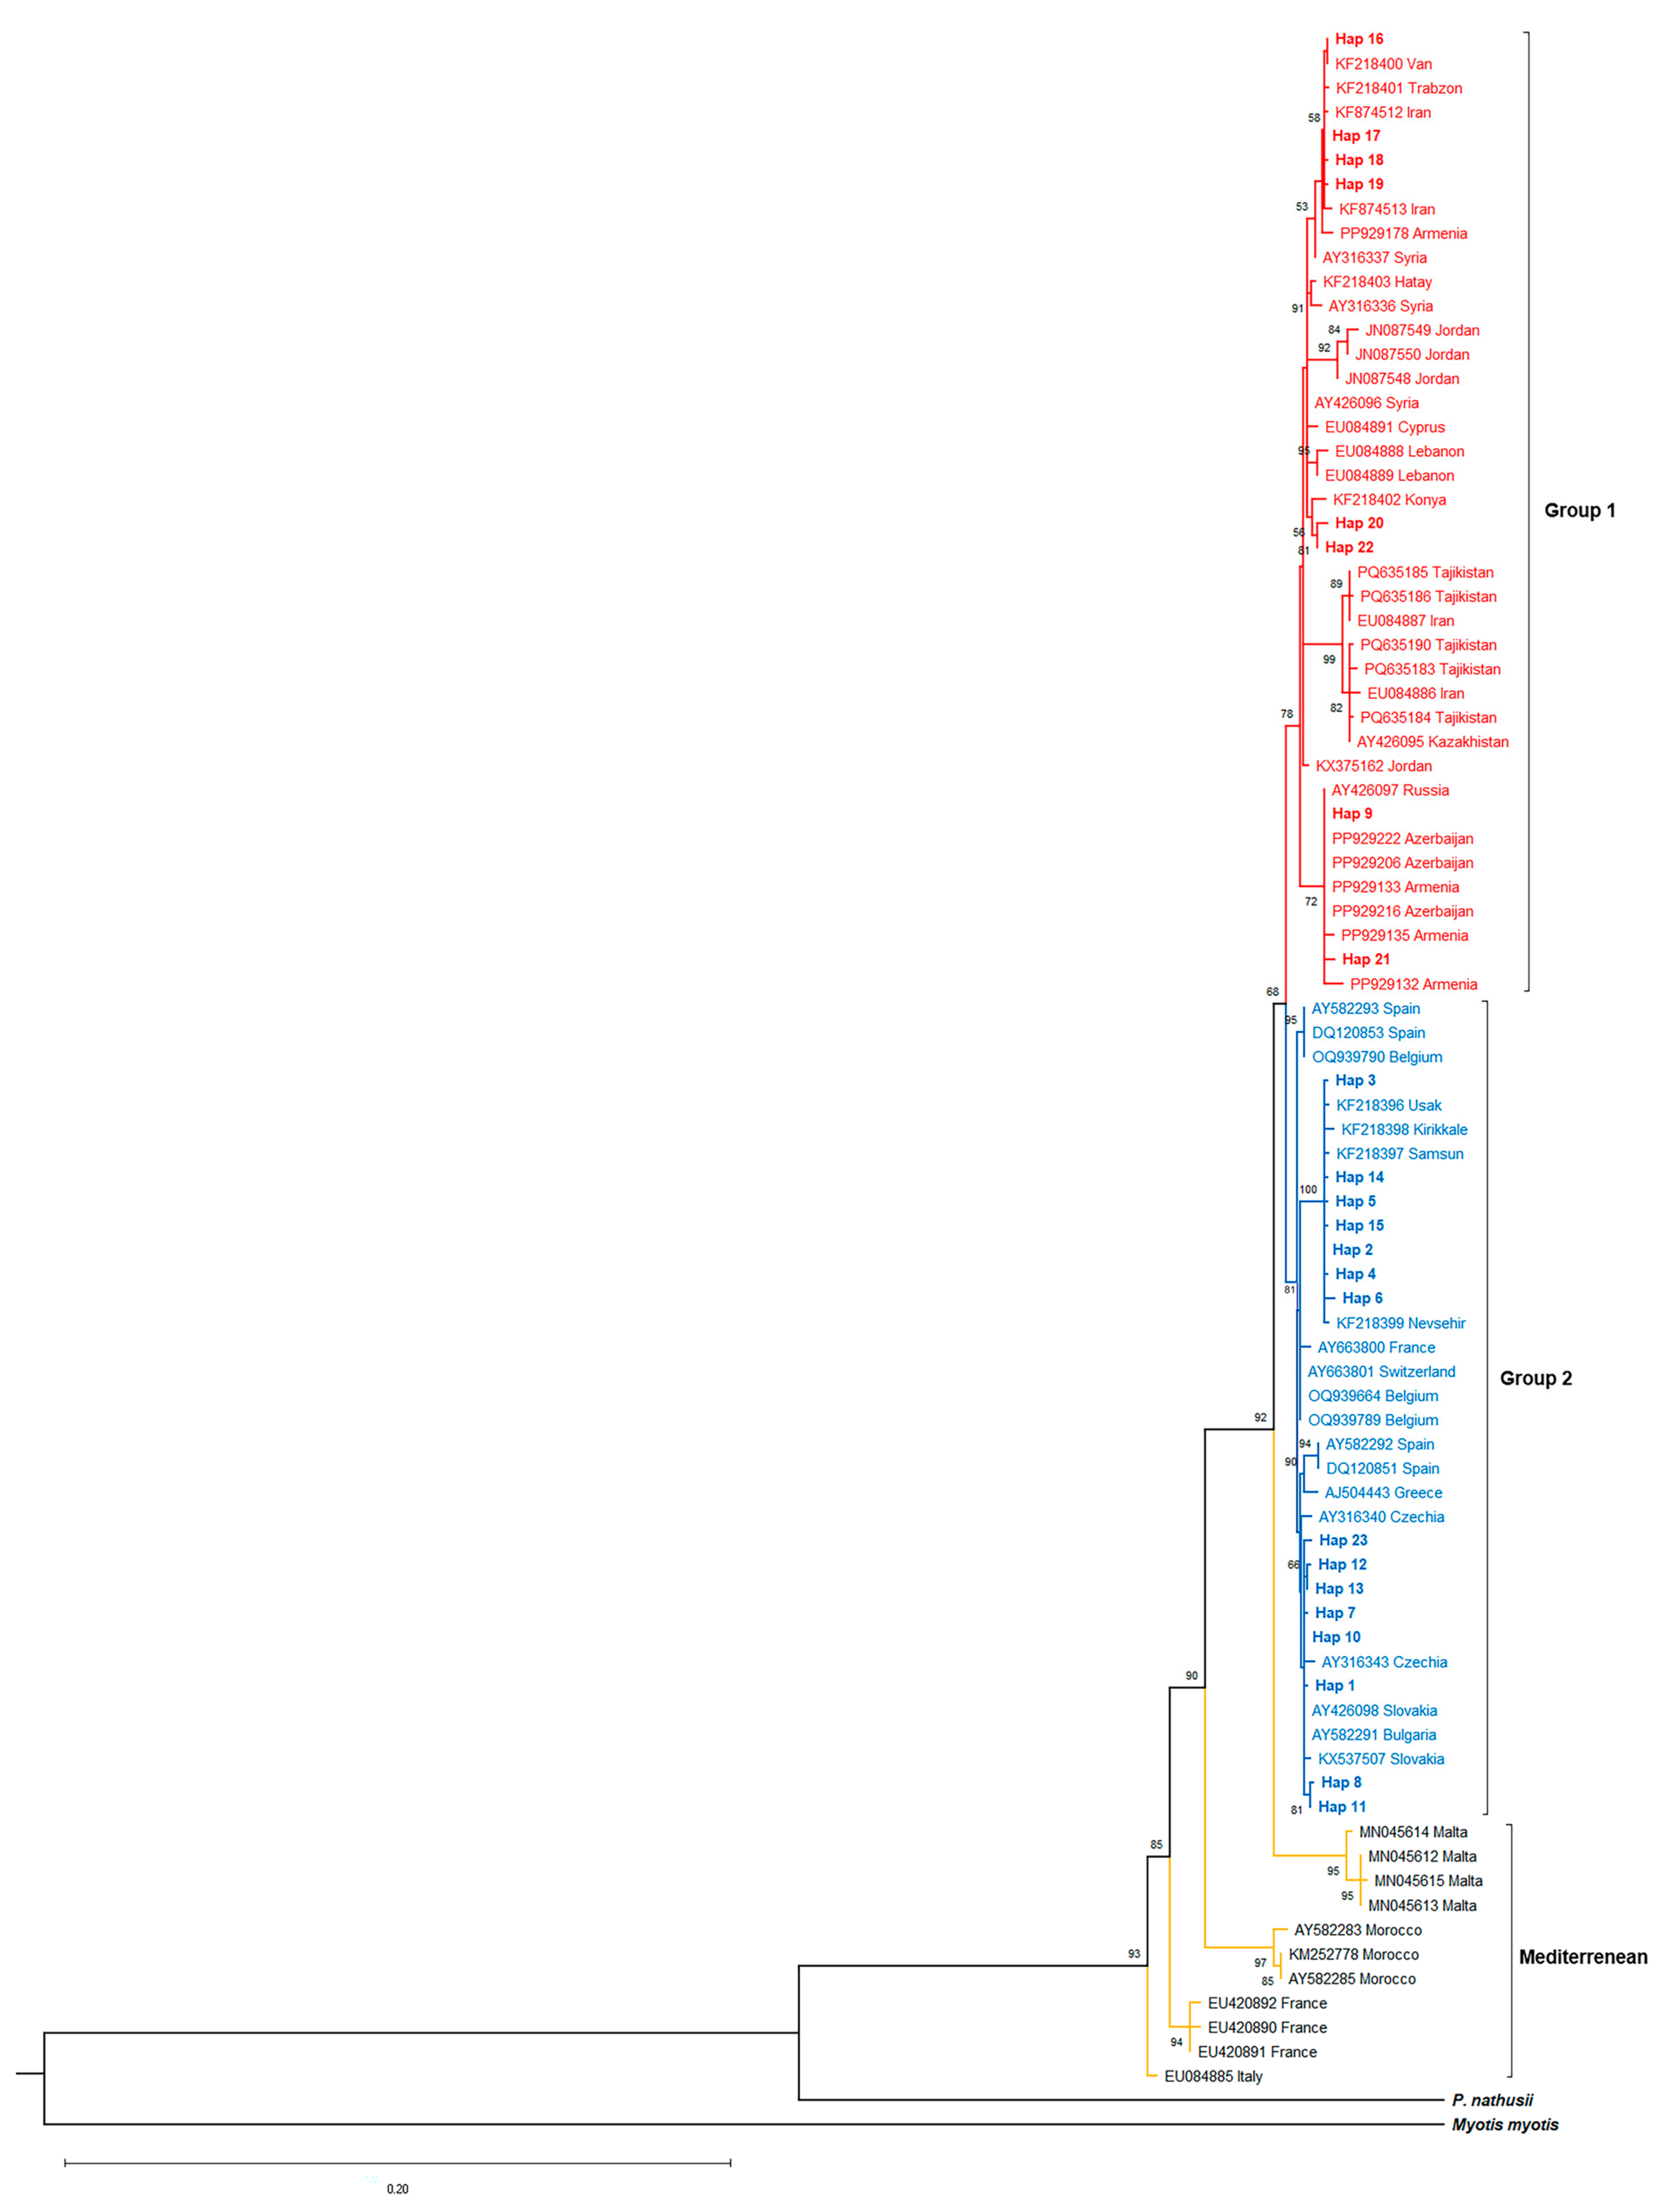
Maximum Likelihood (ML) analyses of P. pipistrellus, which utilized the HKY+G substitution model (best-fit according to the Bayesian Information Criterion, BIC), resolved three major intraspecific lineages (Figure 4). Group 1 encompassed specimens from eastern and central Türkiye, clustering with sequences from Cyprus, the Middle East, the Caucasus, and Central Asia. Group 2 included individuals from western and northwestern Türkiye (a wide range of 20 provinces) and sequences from Europe and the Balkans. The Mediterranean group included multiple distinct lineages comprising specimens from Morocco, Sicily, France, and Malta. Bootstrap support for the split between Group 1 and Group 2 was 68%, while the Mediterranean group showed robust phylogenetic separation (93%). Pairwise genetic distances (Kimura-2-parameter, K2P) further supported this structure: mean divergences were 2.2% ± 0.40 (Group 1 vs. Group 2), 4.5% ± 0.71 (Group 1 vs. Mediterranean), and 4.7% ± 0.72 (Group 2 vs. Mediterranean) (Table S2). Gene flow estimates [47] indicated very limited migration between these lineages: Nm = 0.16 (Group 1 vs. Group 2), Nm = 0.08 (Group 1 vs. Mediterranean), and Nm = 0.12 (Group 2 vs. Mediterranean). All Nm values fell below the isolation threshold (Nm < 1), confirming ongoing genetic isolation.
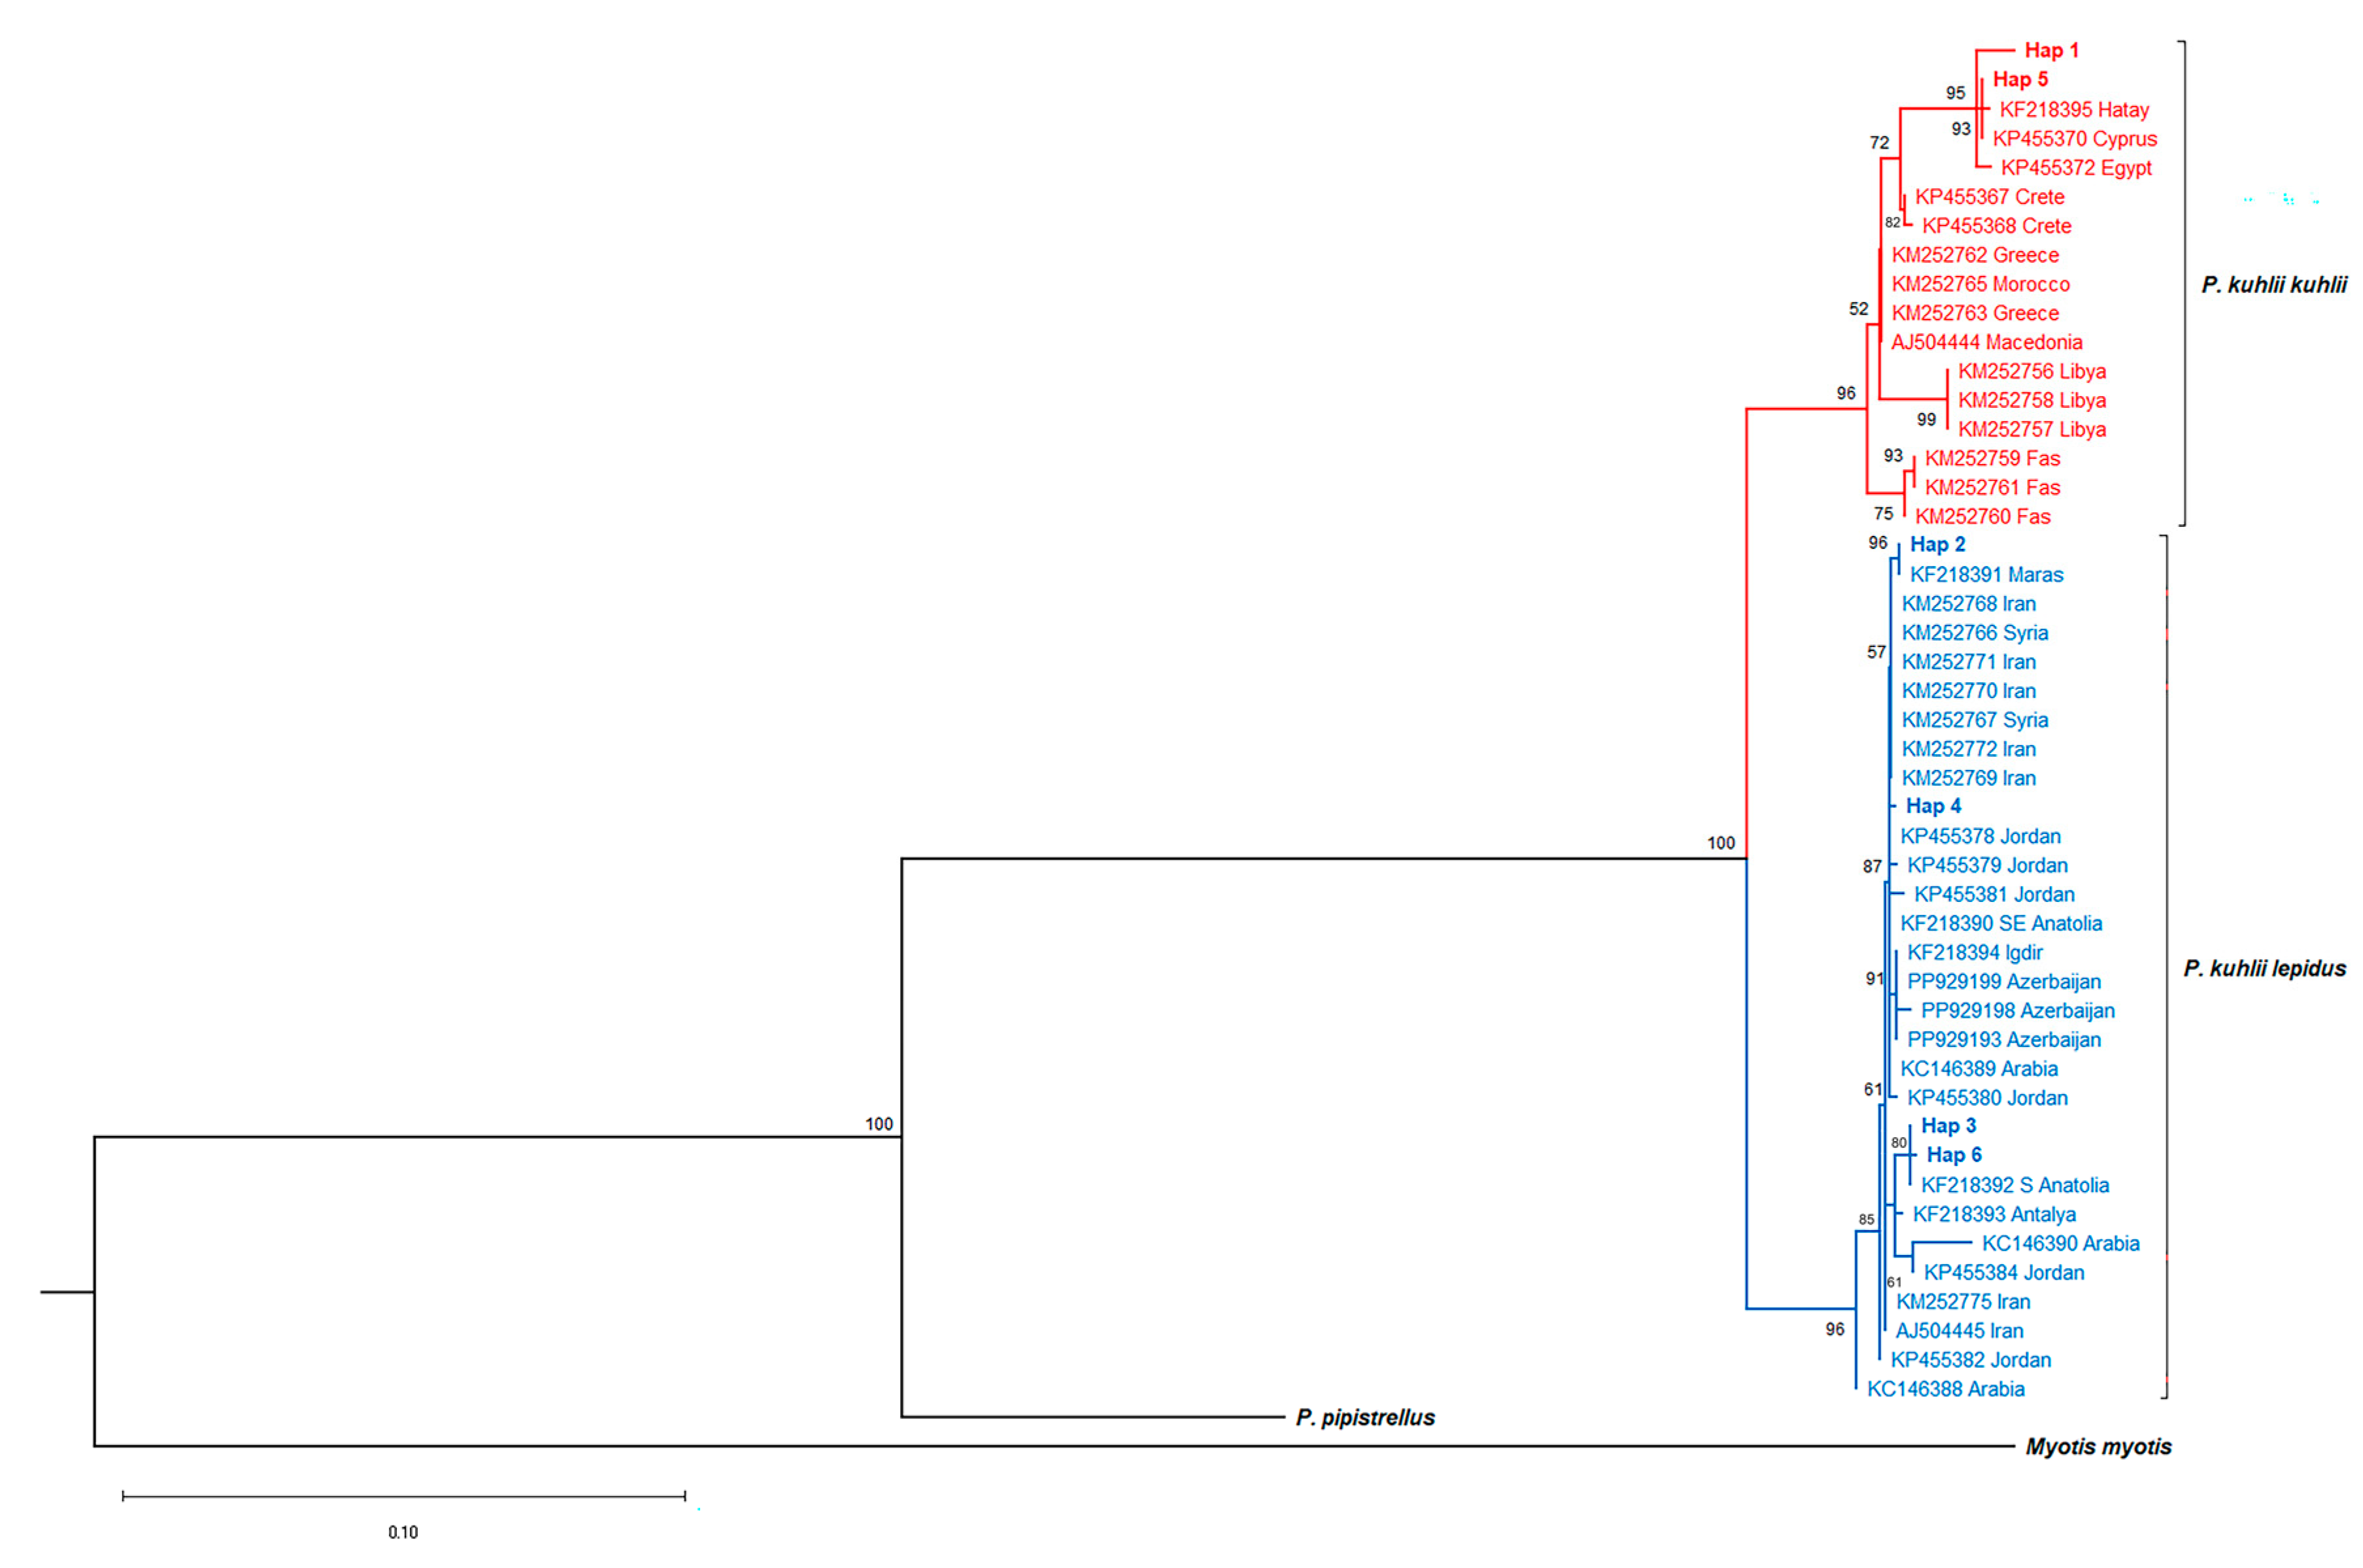
The P. k. lepidus clade, separated from P. k. kuhlii with strong support (100% bootstrap), included specimens collected from 10 Turkish provinces (Figure 5). Conversely, the P. k. kuhlii clade encompassed individuals from Türkiye (Kırşehir, Hatay, and Adana) alongside populations from North Africa, southeastern Europe, and Mediterranean islands. This pattern reflects the hypothesized eastern Mediterranean and Levantine distribution of the latter lineage. Notably, specimens from Kırşehir, Hatay, and Adana were represented in both clades. Pairwise genetic distance estimates based on the Kimura 2-parameter (K2P) model indicated a mean divergence of 3.95% ± 0.76 between P. k. lepidus and P. k. kuhlii. Additionally, gene flow was found to be limited (Nm = 0.35) (Table S2). This genetic structuring was evident despite the collection of some specimens within the same localities (Kırşehir, Hatay, and Adana) that were assigned to both clades.
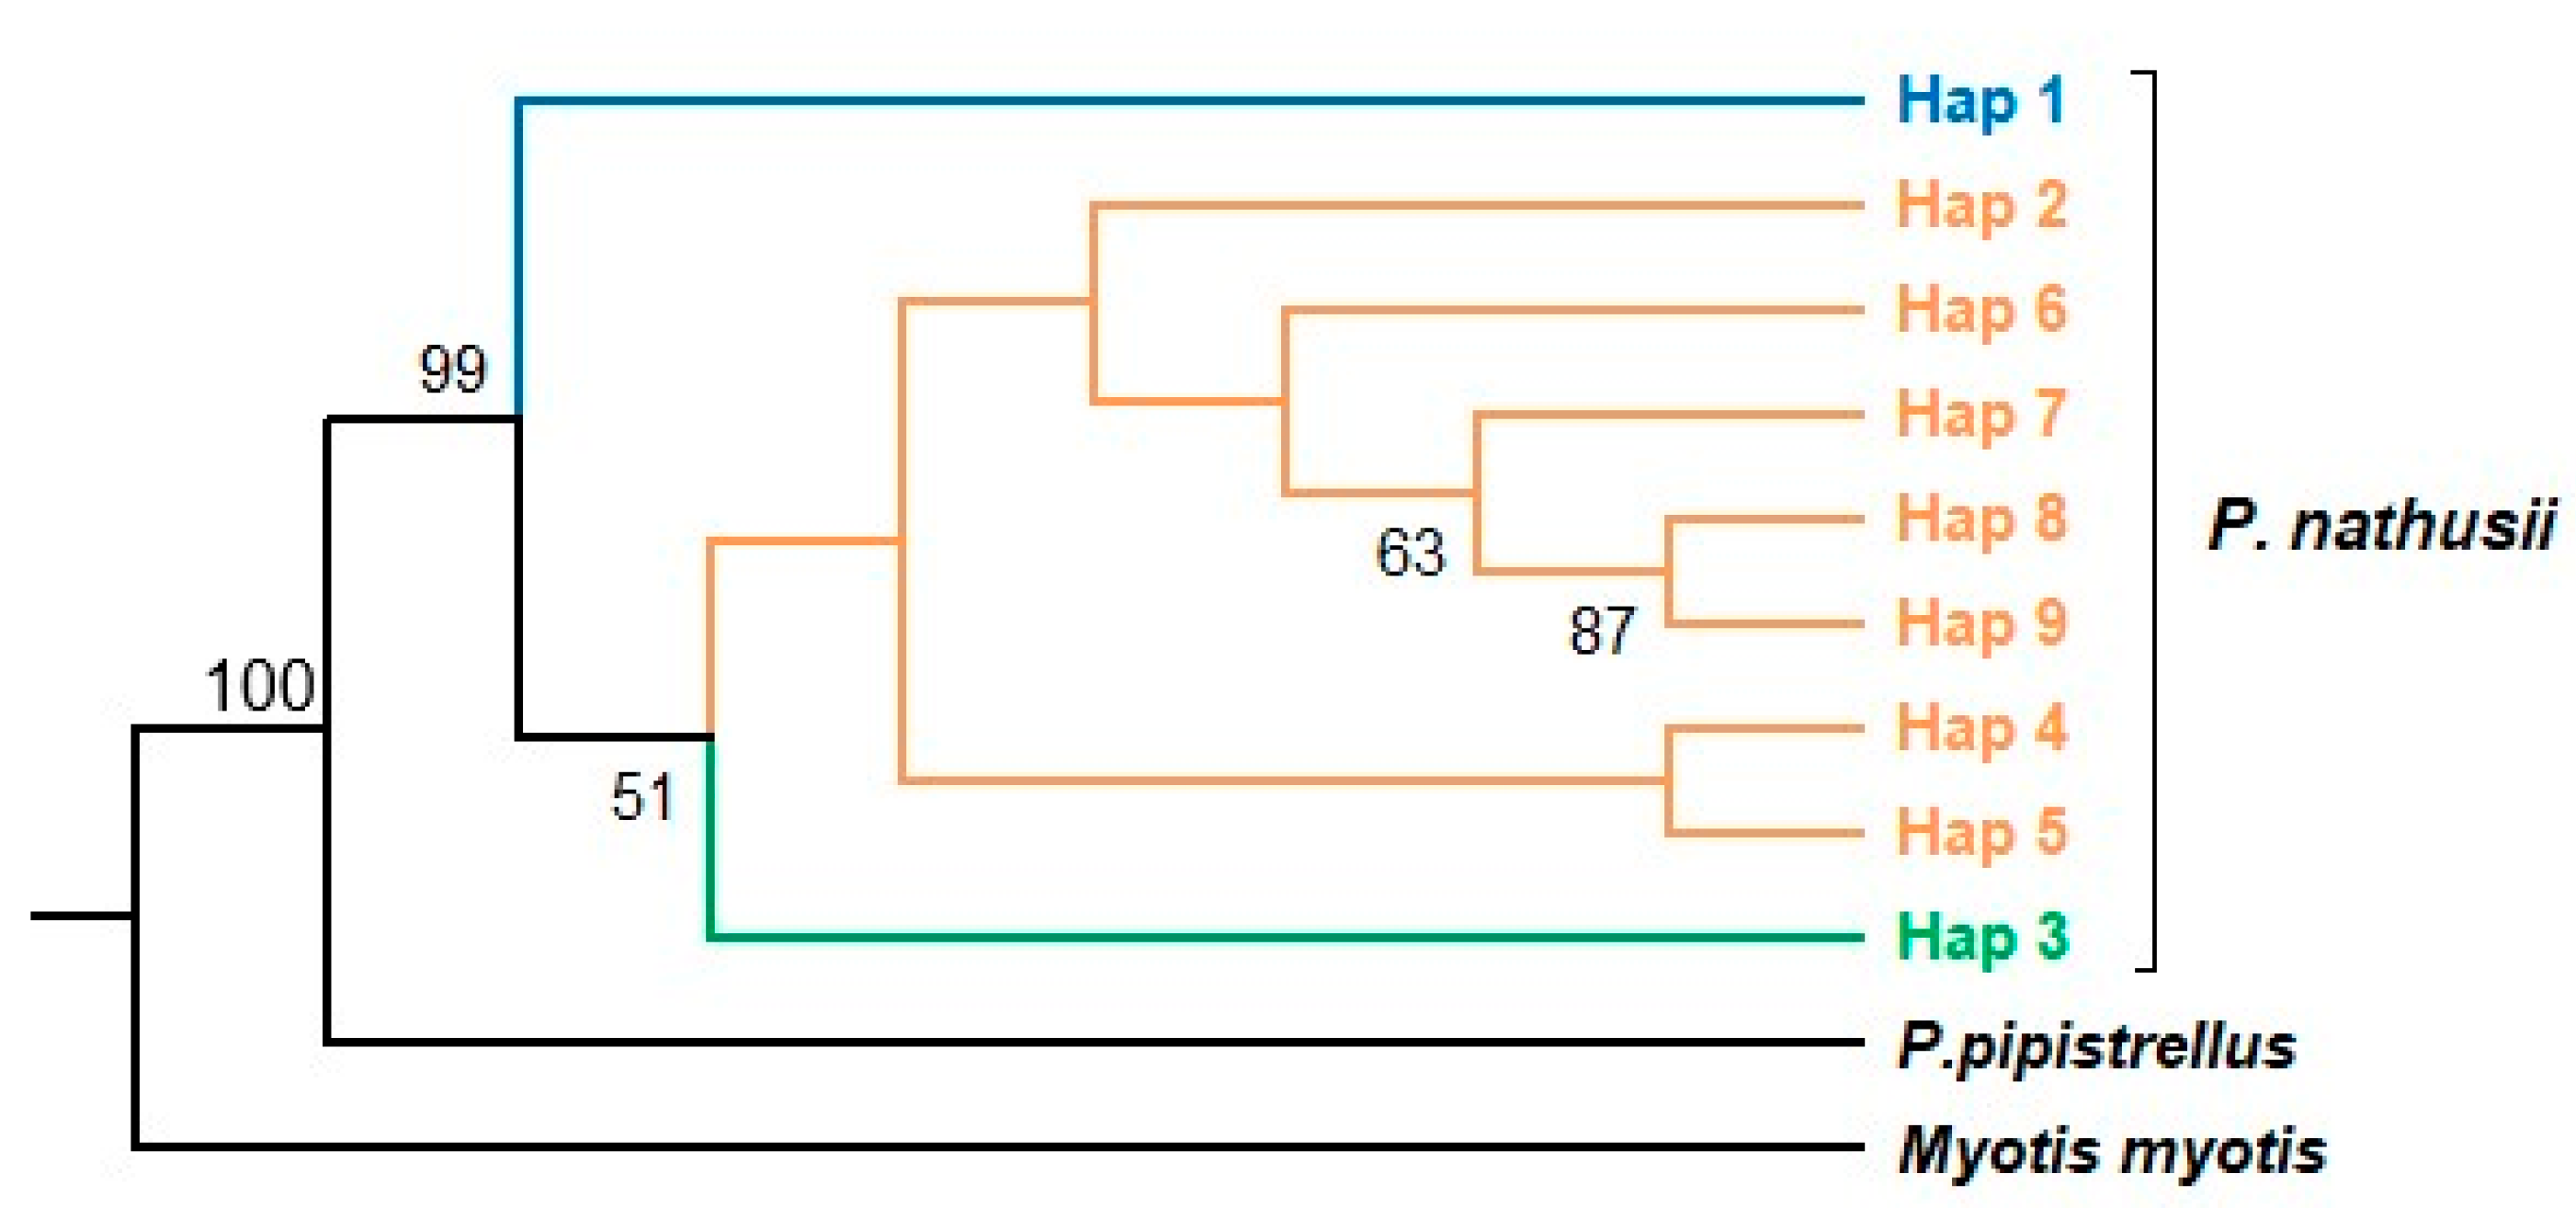
The phylogenetic relationships of Pipistrellus nathusii were evaluated using the Maximum Likelihood (ML) approach, with HKY+G identified as the best-fitting substitution model. Based on 11 original Turkish samples and six European sequences obtained from GenBank, the ML tree revealed a distinct structuring within the species (Supplementary File Table S1, Figure 6). The first lineage consisted solely of a Muğla specimen (Haplotype 1) that clustered separately with 99% bootstrap support. The second lineage grouped individuals from Çanakkale, Bursa, Tekirdağ, and İstanbul with GenBank sequences from Europe (Haplotypes 2 and 4–9). The third lineage comprised a single haplotype (Haplotype 3) from Bursa that clustered weakly (BS = 51%) with the second group. K2P genetic distances between the groups were low but consistent: 0.33% ± 0.16 (Group 1 vs. Group 2), 0.29% ± 0.17 (Group 1 vs. Group 3), and 0.22% ± 0.11 (Group 2 vs. Group 3) (Table S2). Gene flow estimates could not be calculated for Groups 1 and 3 due to the single-specimen representation.
All 22 Turkish individuals morphologically identified as P. pygmaeus matched P. pipistrellus in BLAST searches (BLAST version 2.16.0). Subsequent HKY+G-based ML analyses confirmed this finding, as these Turkish specimens clustered within the P. pipistrellus clade (Figure S1), indicating that morphological identification alone—particularly wing venation—can be misleading for these cryptic taxa [34]. Sequences labeled P. pygmaeus from GenBank (including Turkish specimens AY426087 and AY316328) formed a separate, distinct clade, confirming that our Turkish samples do not belong to the P. pygmaeus taxon.

3.3. Mismatch Distribution and Neutrality Tests

Mismatch distribution analyses and neutrality tests were performed to assess the demographic history of P. pipistrellus (Table S2). Group 1 (n = 81) comprised 32 haplotypes (S = 41), showing moderate haplotype diversity (h = 0.846) and low nucleotide diversity (π = 0.005). Neutrality tests yielded a negative Tajima’s D (−1.170, not significant) but a significantly negative Fu’s Fs (−16.766, p < 0.02). The mismatch distribution exhibited a multimodal pattern (Figure 7), showing deviation from the expectations of a simple sudden expansion model. Group 2 (n = 48) contained very high haplotype diversity (h = 0.982) and nucleotide diversity (π = 0.006), similar to Group 1, with 64 segregating sites observed. Both Tajima’s D (−0.834) and Fu’s Fs (4.646) were non-significant. The mismatch distribution was highly irregular and multimodal (Figure 7).
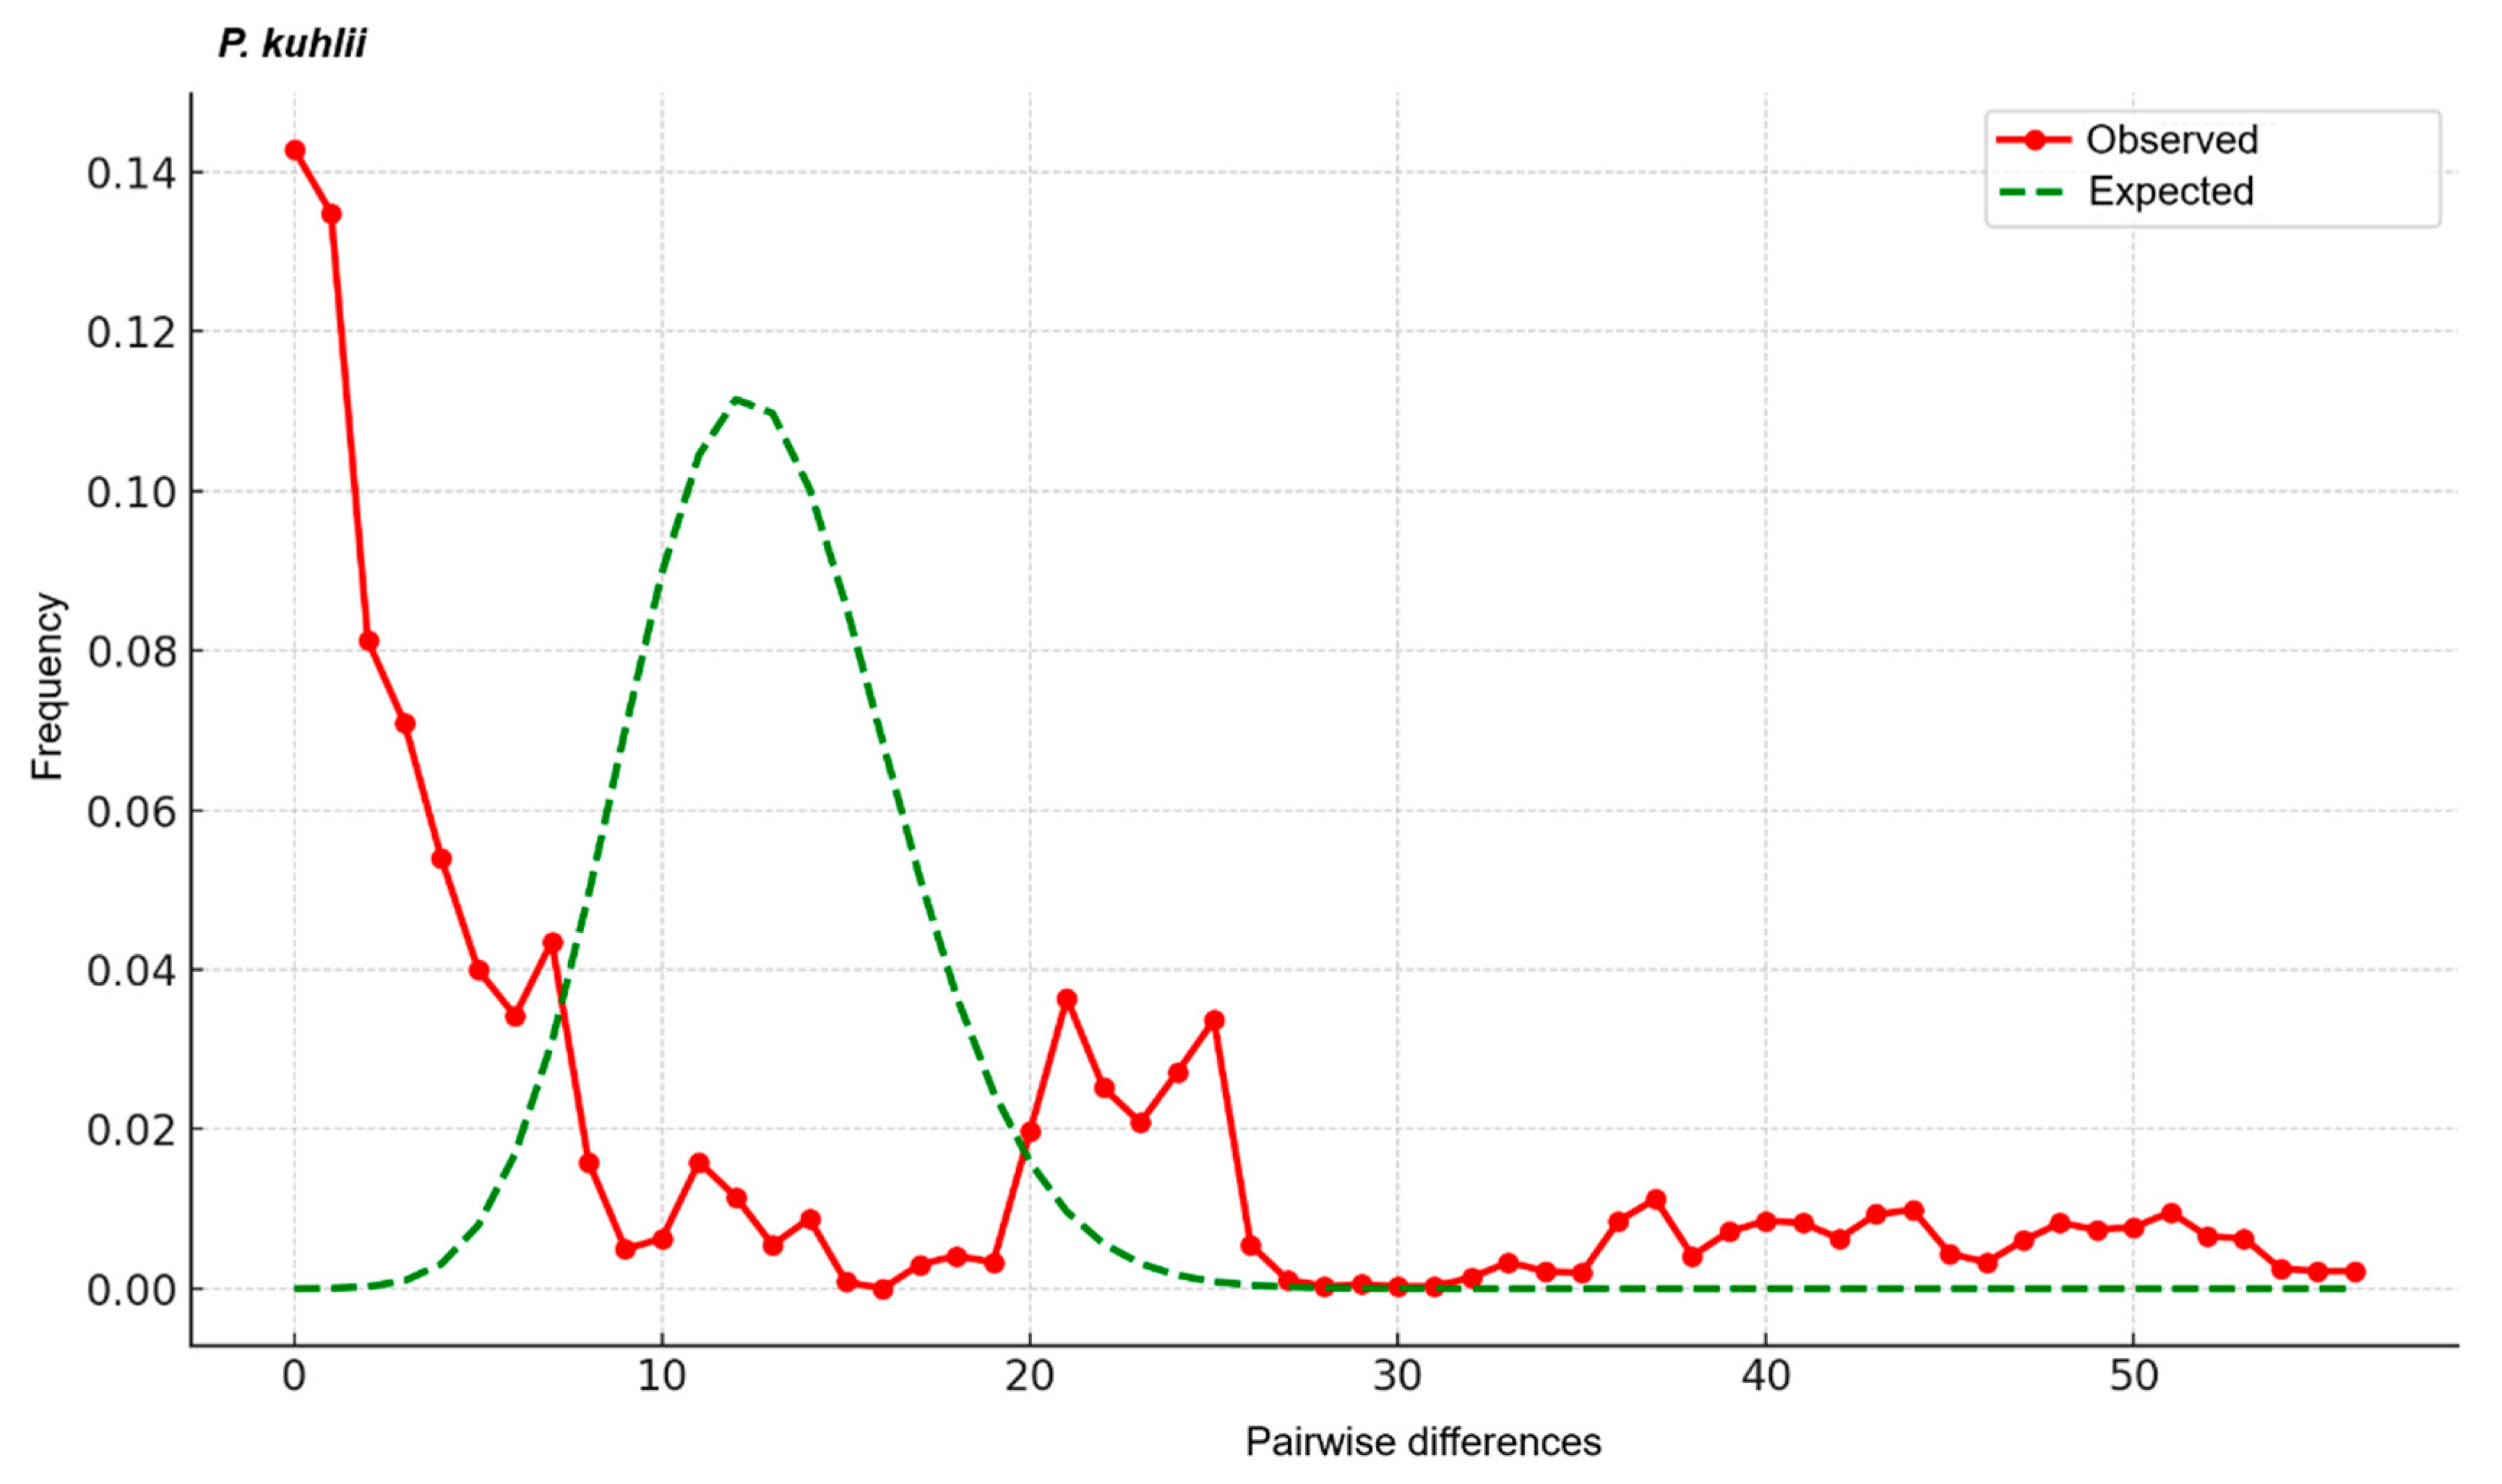
In P. k. kuhlii (n = 29), six haplotypes were detected (h = 0.835; π = 0.0305). Both Tajima’s D (1.254) and Fu’s Fs (2.888) were positive but non-significant. The mismatch curve was multimodal and skewed (Figure 8). Conversely, in P. k. lepidus (n = 57), seven haplotypes were detected (h = 0.396; π = 0.006). Both Tajima’s D (−1.850, p < 0.05) and Fu’s Fs (−2.042, p < 0.05) were significantly negative. The mismatch curve broadly aligned with the sudden expansion model, though it exhibited slight undulations and asymmetry (Figure 8). When all P. kuhlii individuals were pooled (n = 86), the overall mismatch pattern (Figure 9) showed a divergence from the simple sudden expansion model. This pattern was characterized by high frequencies at low pairwise differences, followed by a multimodal distribution.
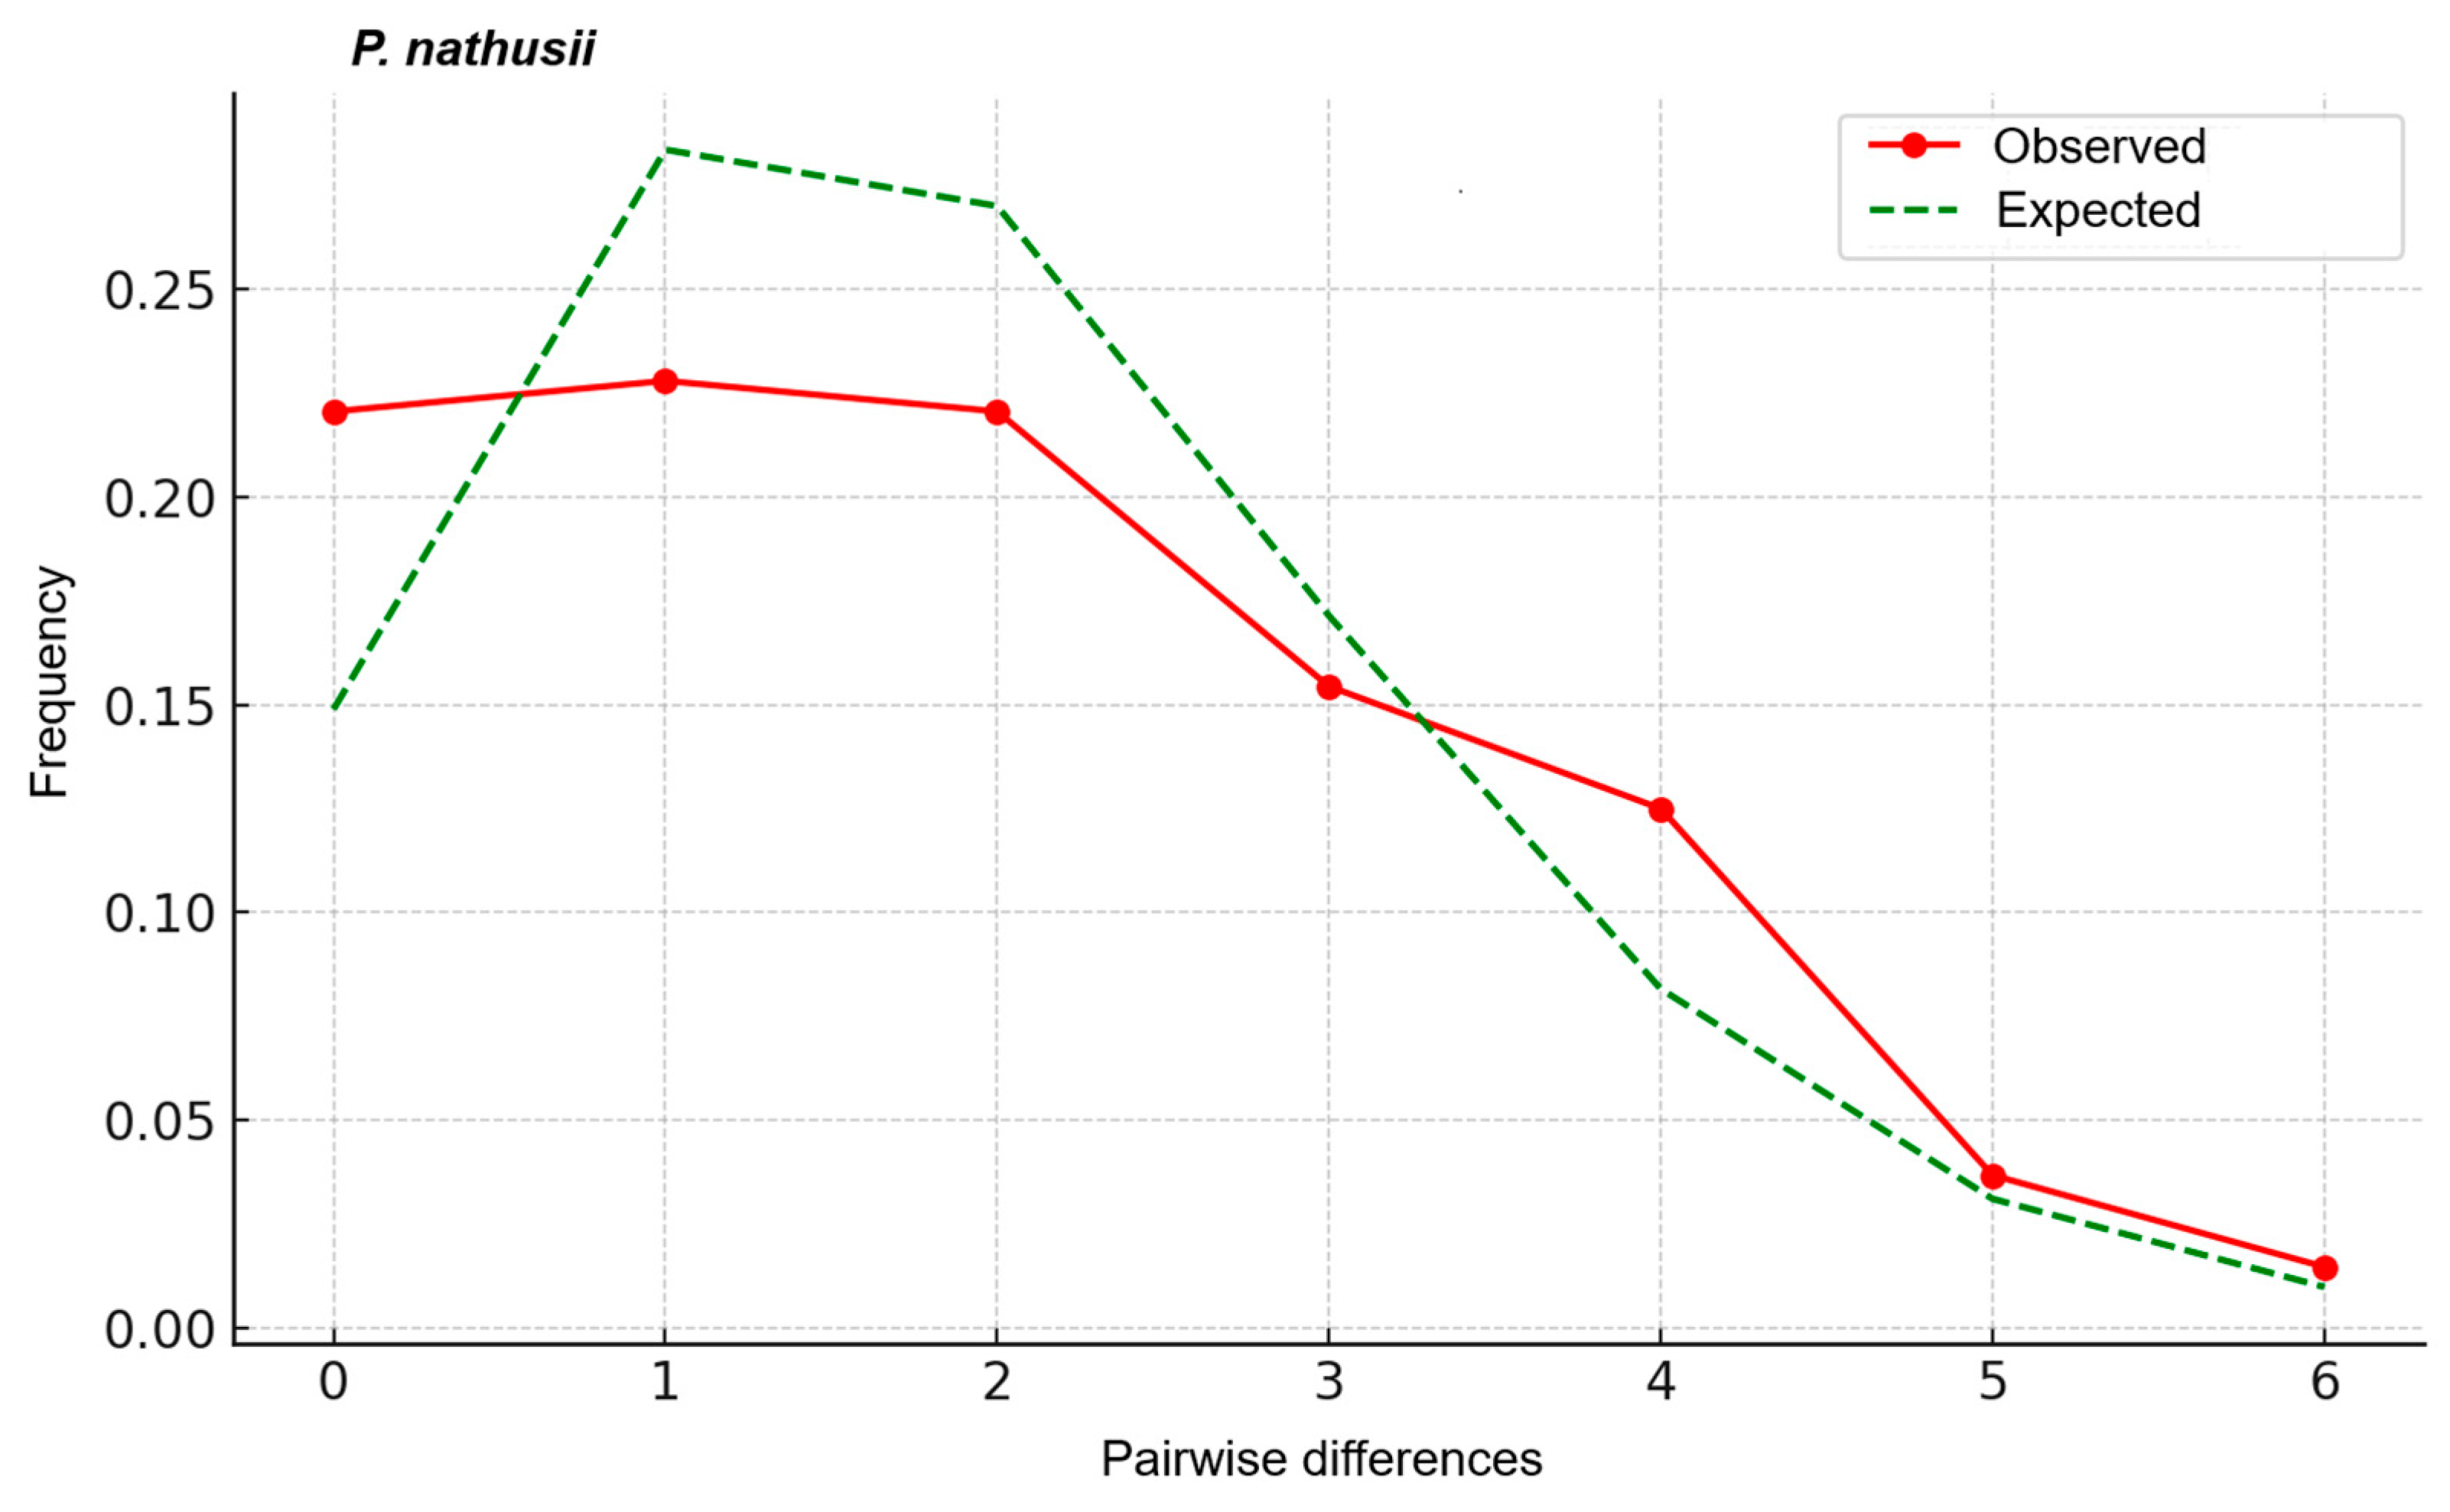
Analyses of P. nathusii (n = 11) identified nine haplotypes, yielding high haplotype diversity (h = 0.73) and low nucleotide diversity (π = 0.002), with 11 segregating sites found. Tajima’s D was significantly negative (−2.152, p < 0.05), whereas Fu’s Fs was positive (13.596). The mismatch distribution (Figure 10) was slightly asymmetric and right-skewed, exhibiting a mild deviation from a Poisson-like sudden expansion curve.

3.4. Median-Joining Network Analysis

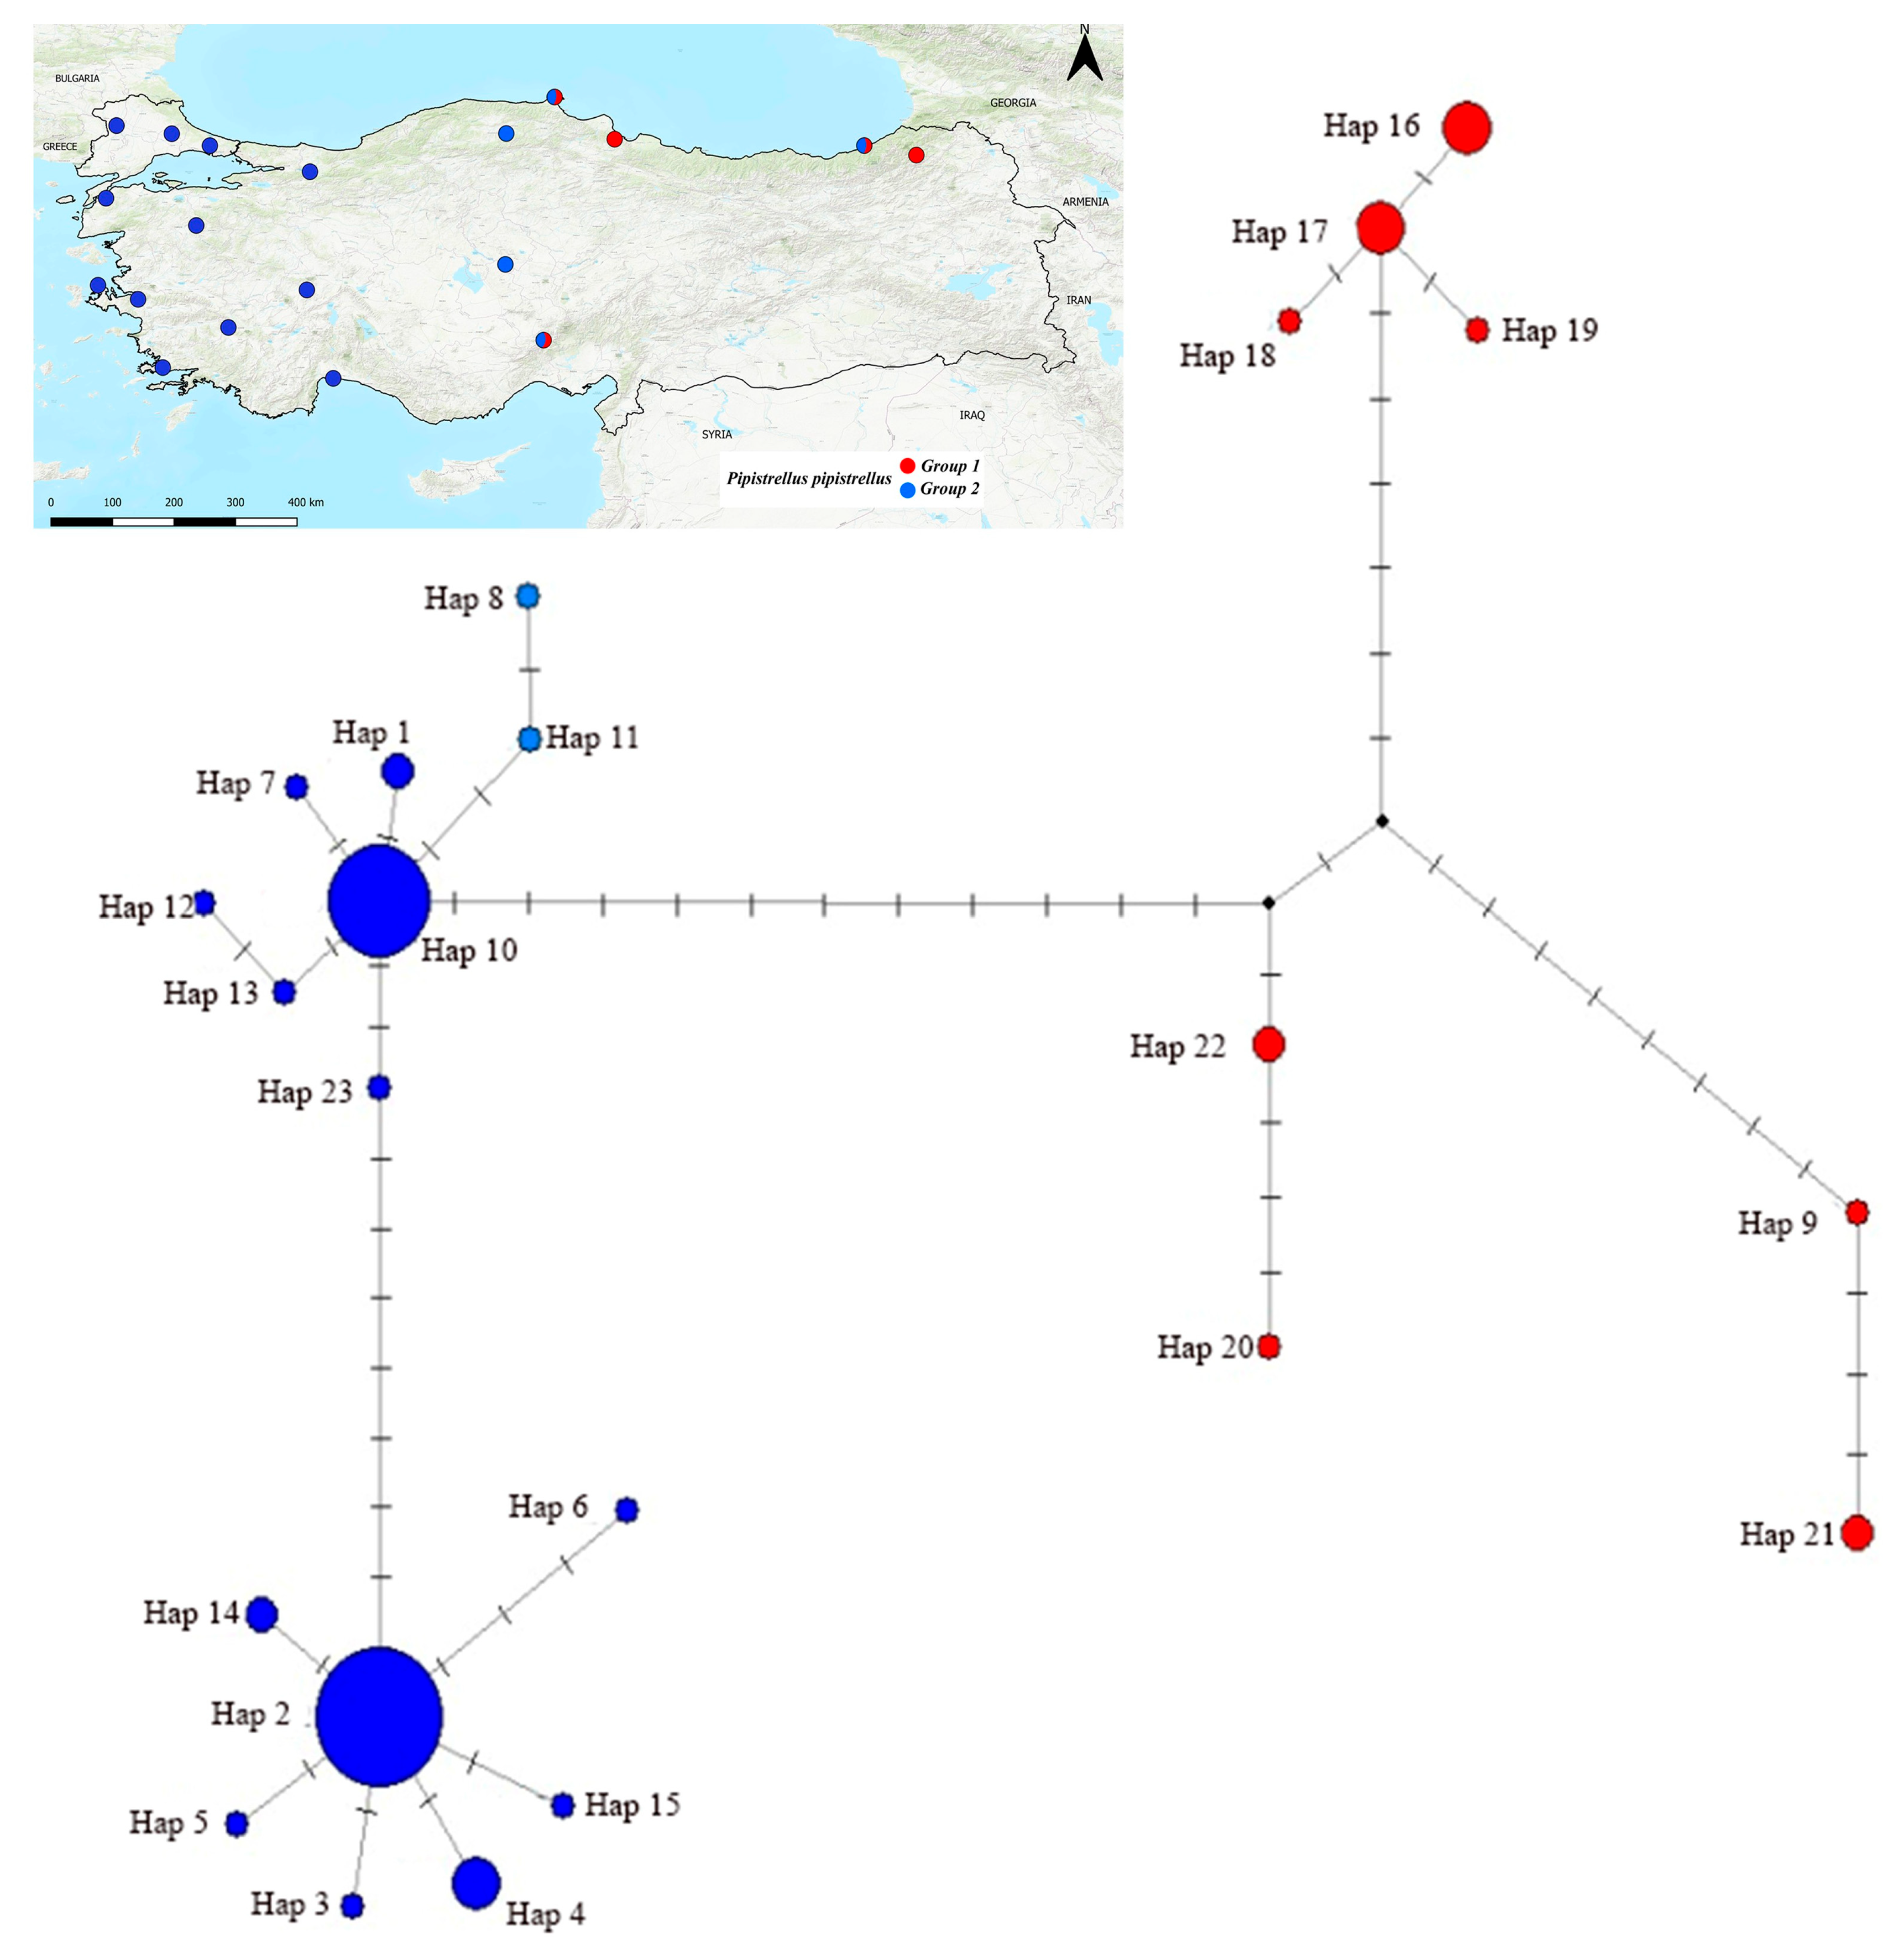
A median-joining network (MJN) was constructed using the Cytb haplotypes to visualize intraspecific genetic structuring in P. pipistrellus (Table S1, Figure 11). The network topology was compared with the ML phylogeny. The network revealed both widespread and highly localized haplotypes. Haplotype 2 (Hap 2) was widely distributed across numerous localities (including Çanakkale, Muğla, İzmir, Niğde, Rize, and Sinop) and occupied a central position. In contrast, Haplotype 9 (Hap 9) was recorded from a similarly broad range (Edirne, Antalya, Kastamonu, Sakarya, and Sinop) but remained peripheral. Notably, individuals from provinces such as Sinop (Hap 2, 10, 20, 21), Rize (Hap 2, 15–18), and Niğde (Hap 2, 22) were present in both major phylogenetic groups (Group 1 and Group 2).
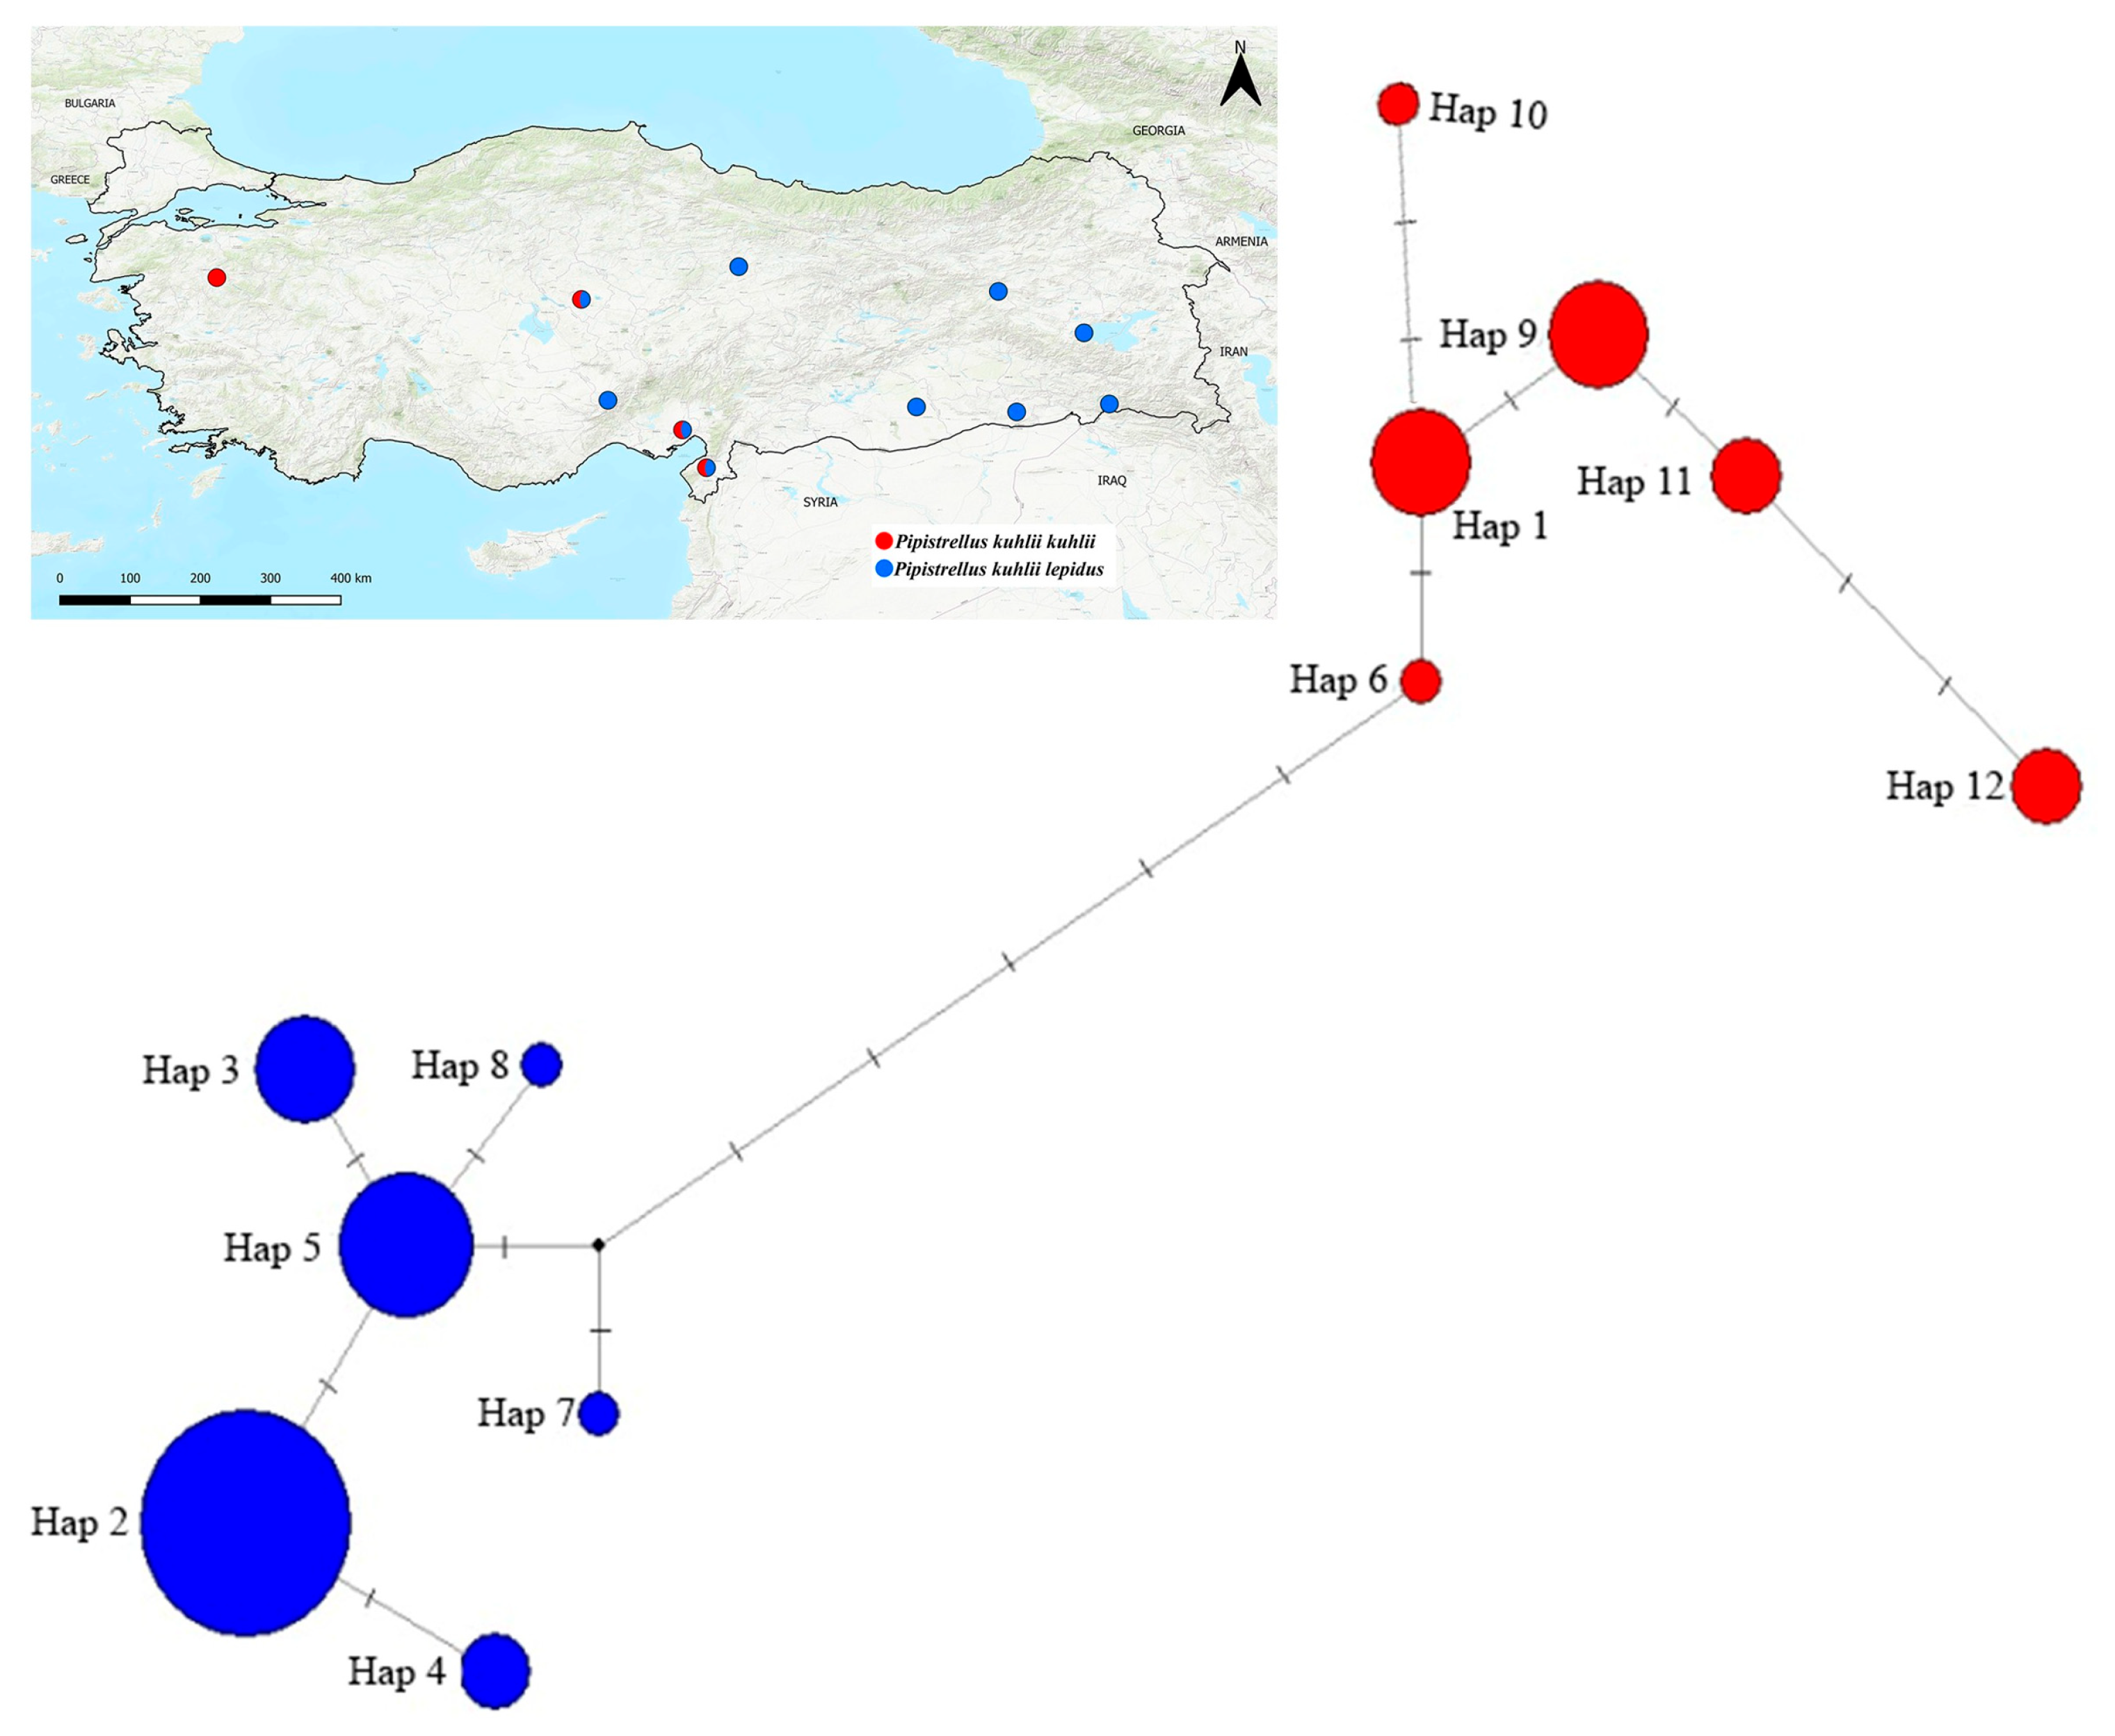
The MJN analysis for P. kuhlii incorporated 45 Turkish individuals and GenBank sequences, resulting in a total of twelve haplotypes (Figure 12; Supplementary File Table S1). Haplotype 2 (Hap 2) was the most frequent and widely distributed, found across numerous Turkish localities (e.g., Adana, Hatay, Mardin, Niğde) and several Middle Eastern countries. Its widespread occurrence was associated with a central placement in the network. Other P. k. lepidus haplotypes (Hap 3, 4, 7, 8) had restricted geographic ranges and peripheral positions. The P. k. kuhlii lineage was primarily represented by Hap 1 (Adana, Hatay, Kırşehir, and Cyprus), Hap 6 (Kırşehir), and Hap 10 (Egypt). Additional haplotypes (Hap 9, 11, 12) were confined to North Africa and southeastern Europe, appearing at the network periphery. The haplotype network supported the phylogenetic structure recovered by the ML analyses.
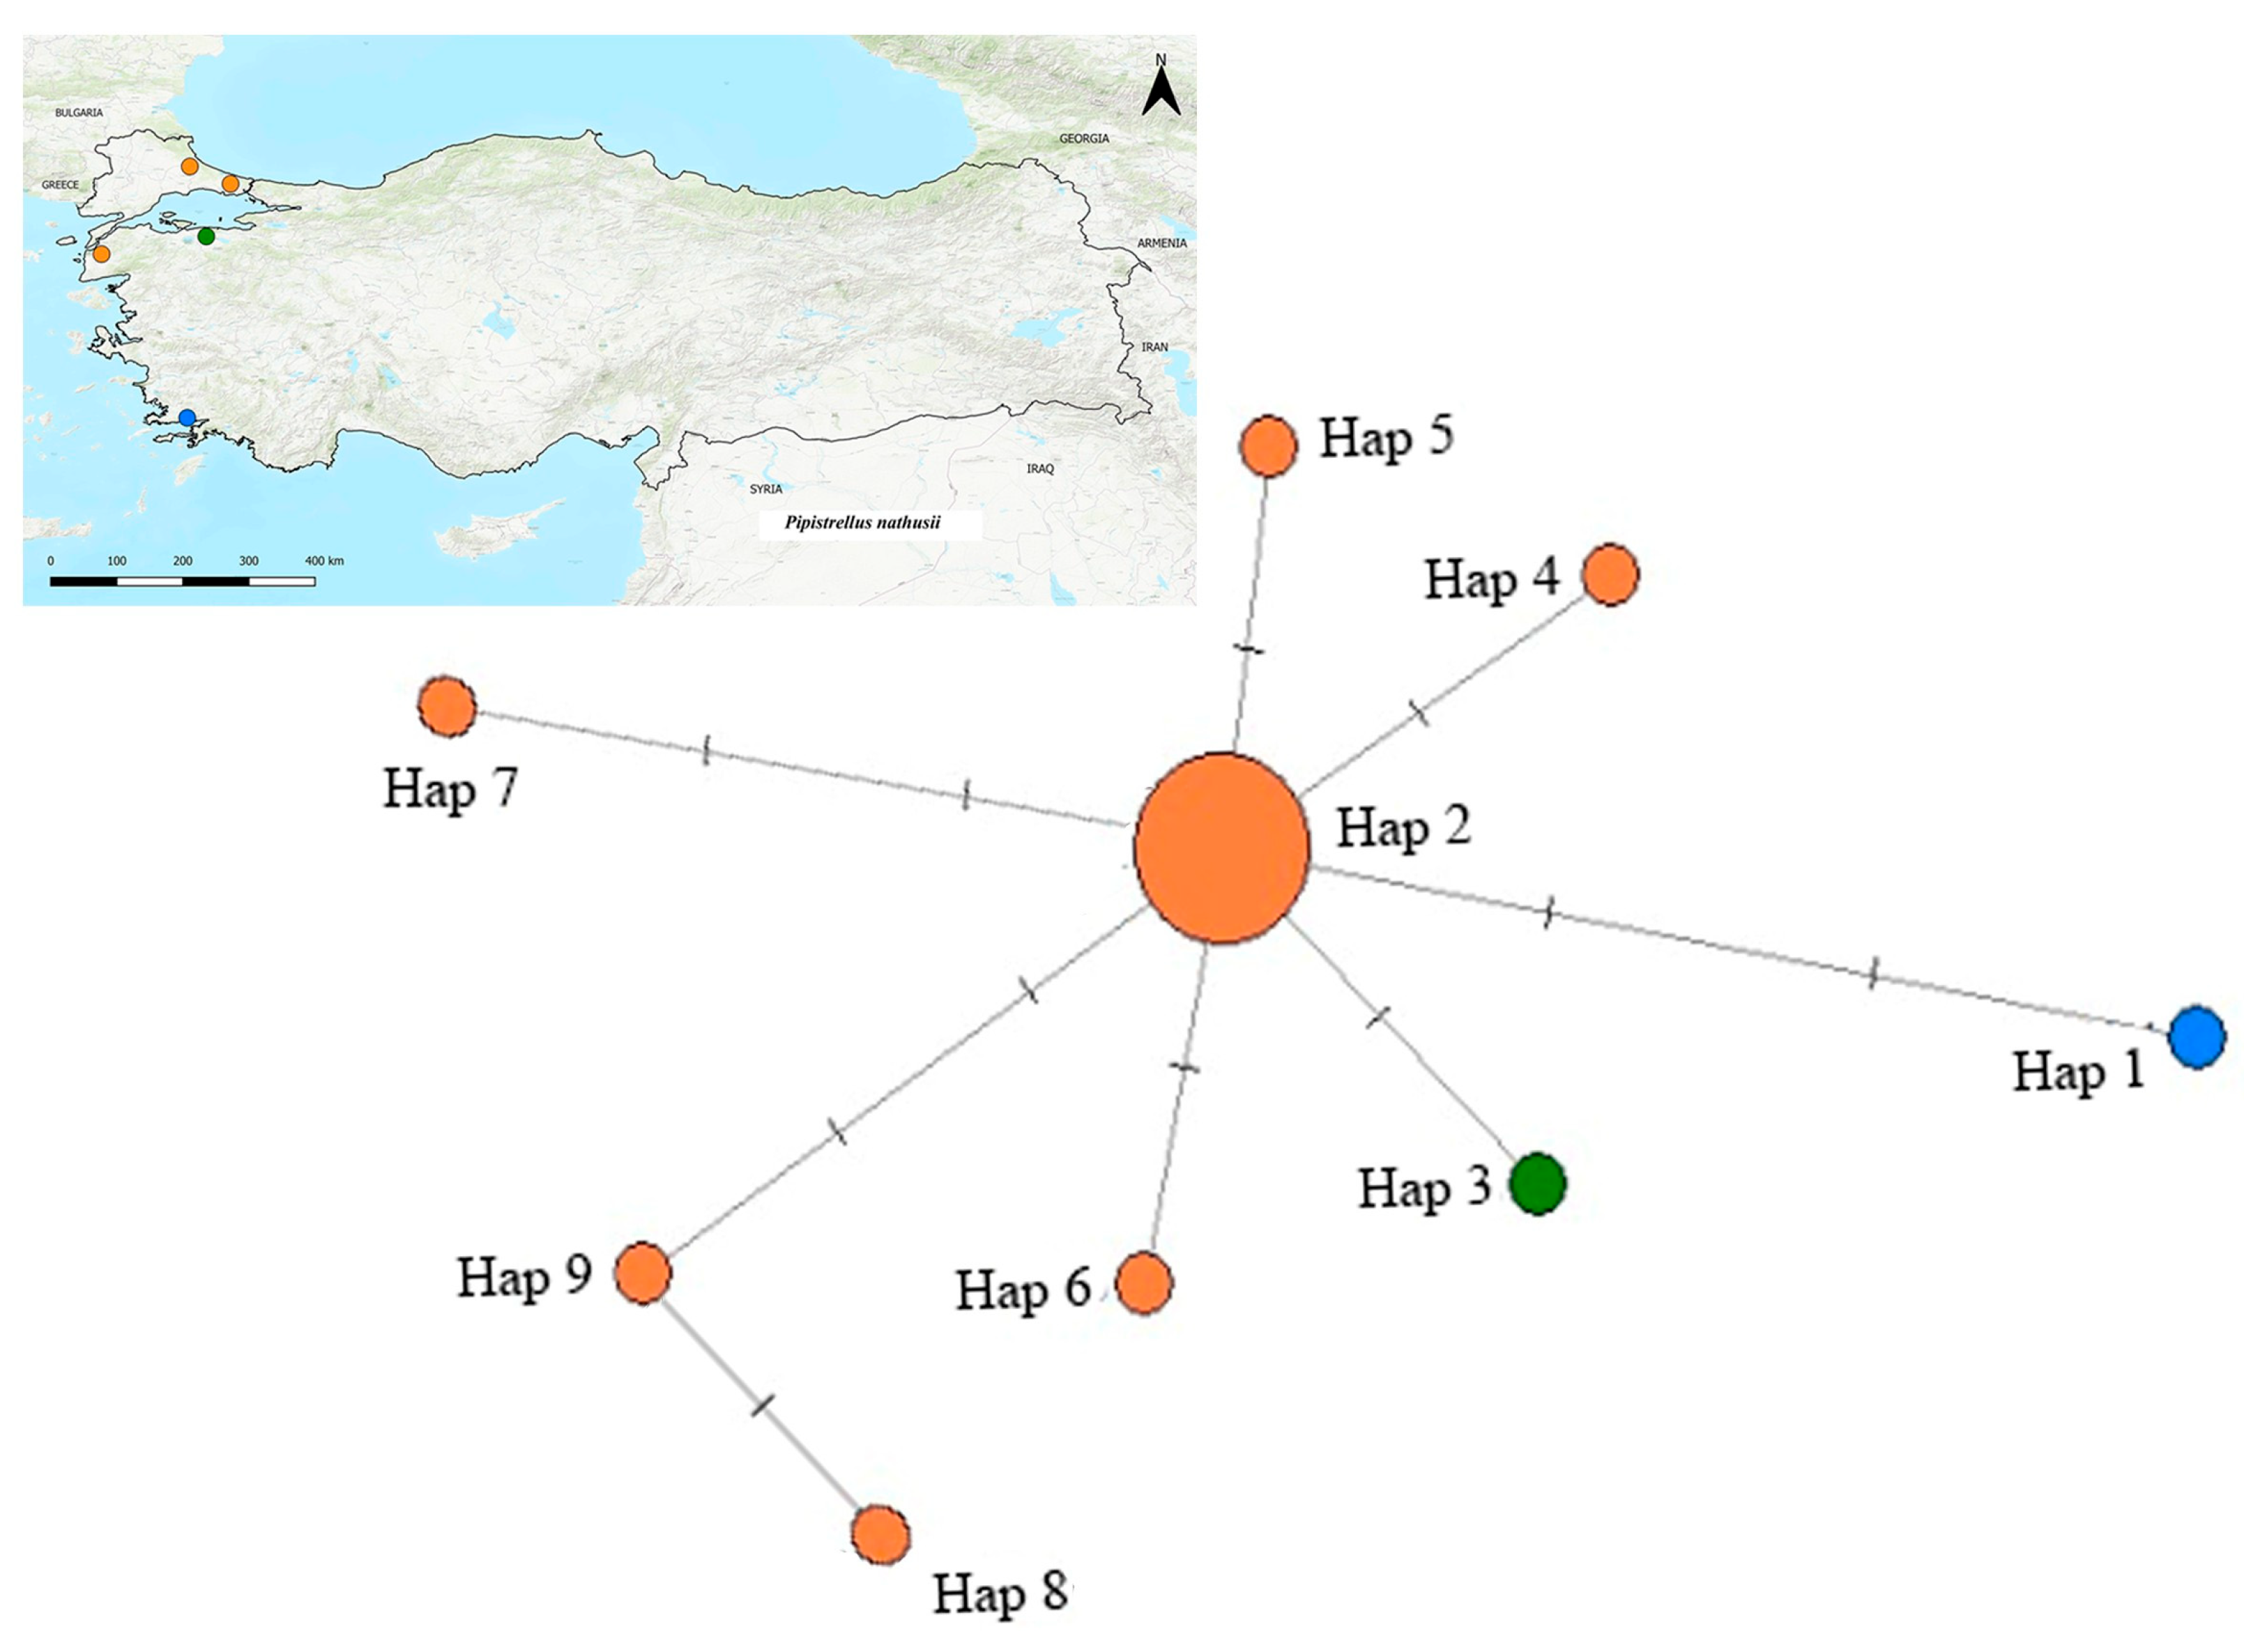
For P. nathusii, the MJN analysis used Turkish specimens and European GenBank sequences, revealing nine haplotypes and their geographic relationships (Figure 13). Haplotype 2 (Hap 2) formed the network core, encompassing individuals from Çanakkale, Tekirdağ, Bursa, and İstanbul, along with samples from Spain, Switzerland, and Belgium. Conversely, the Muğla haplotype (Hap 1) was distinctly positioned on the periphery with minimal connections. The Bursa haplotype (Hap 3) was also rare and distinct. Other haplotypes (Hap 4–9) branched directly around Hap 2, linking Turkish and European sequences. This network structure showed extensive genetic continuity across the species’ range.

3.5. Molecular Dating and Divergence Times

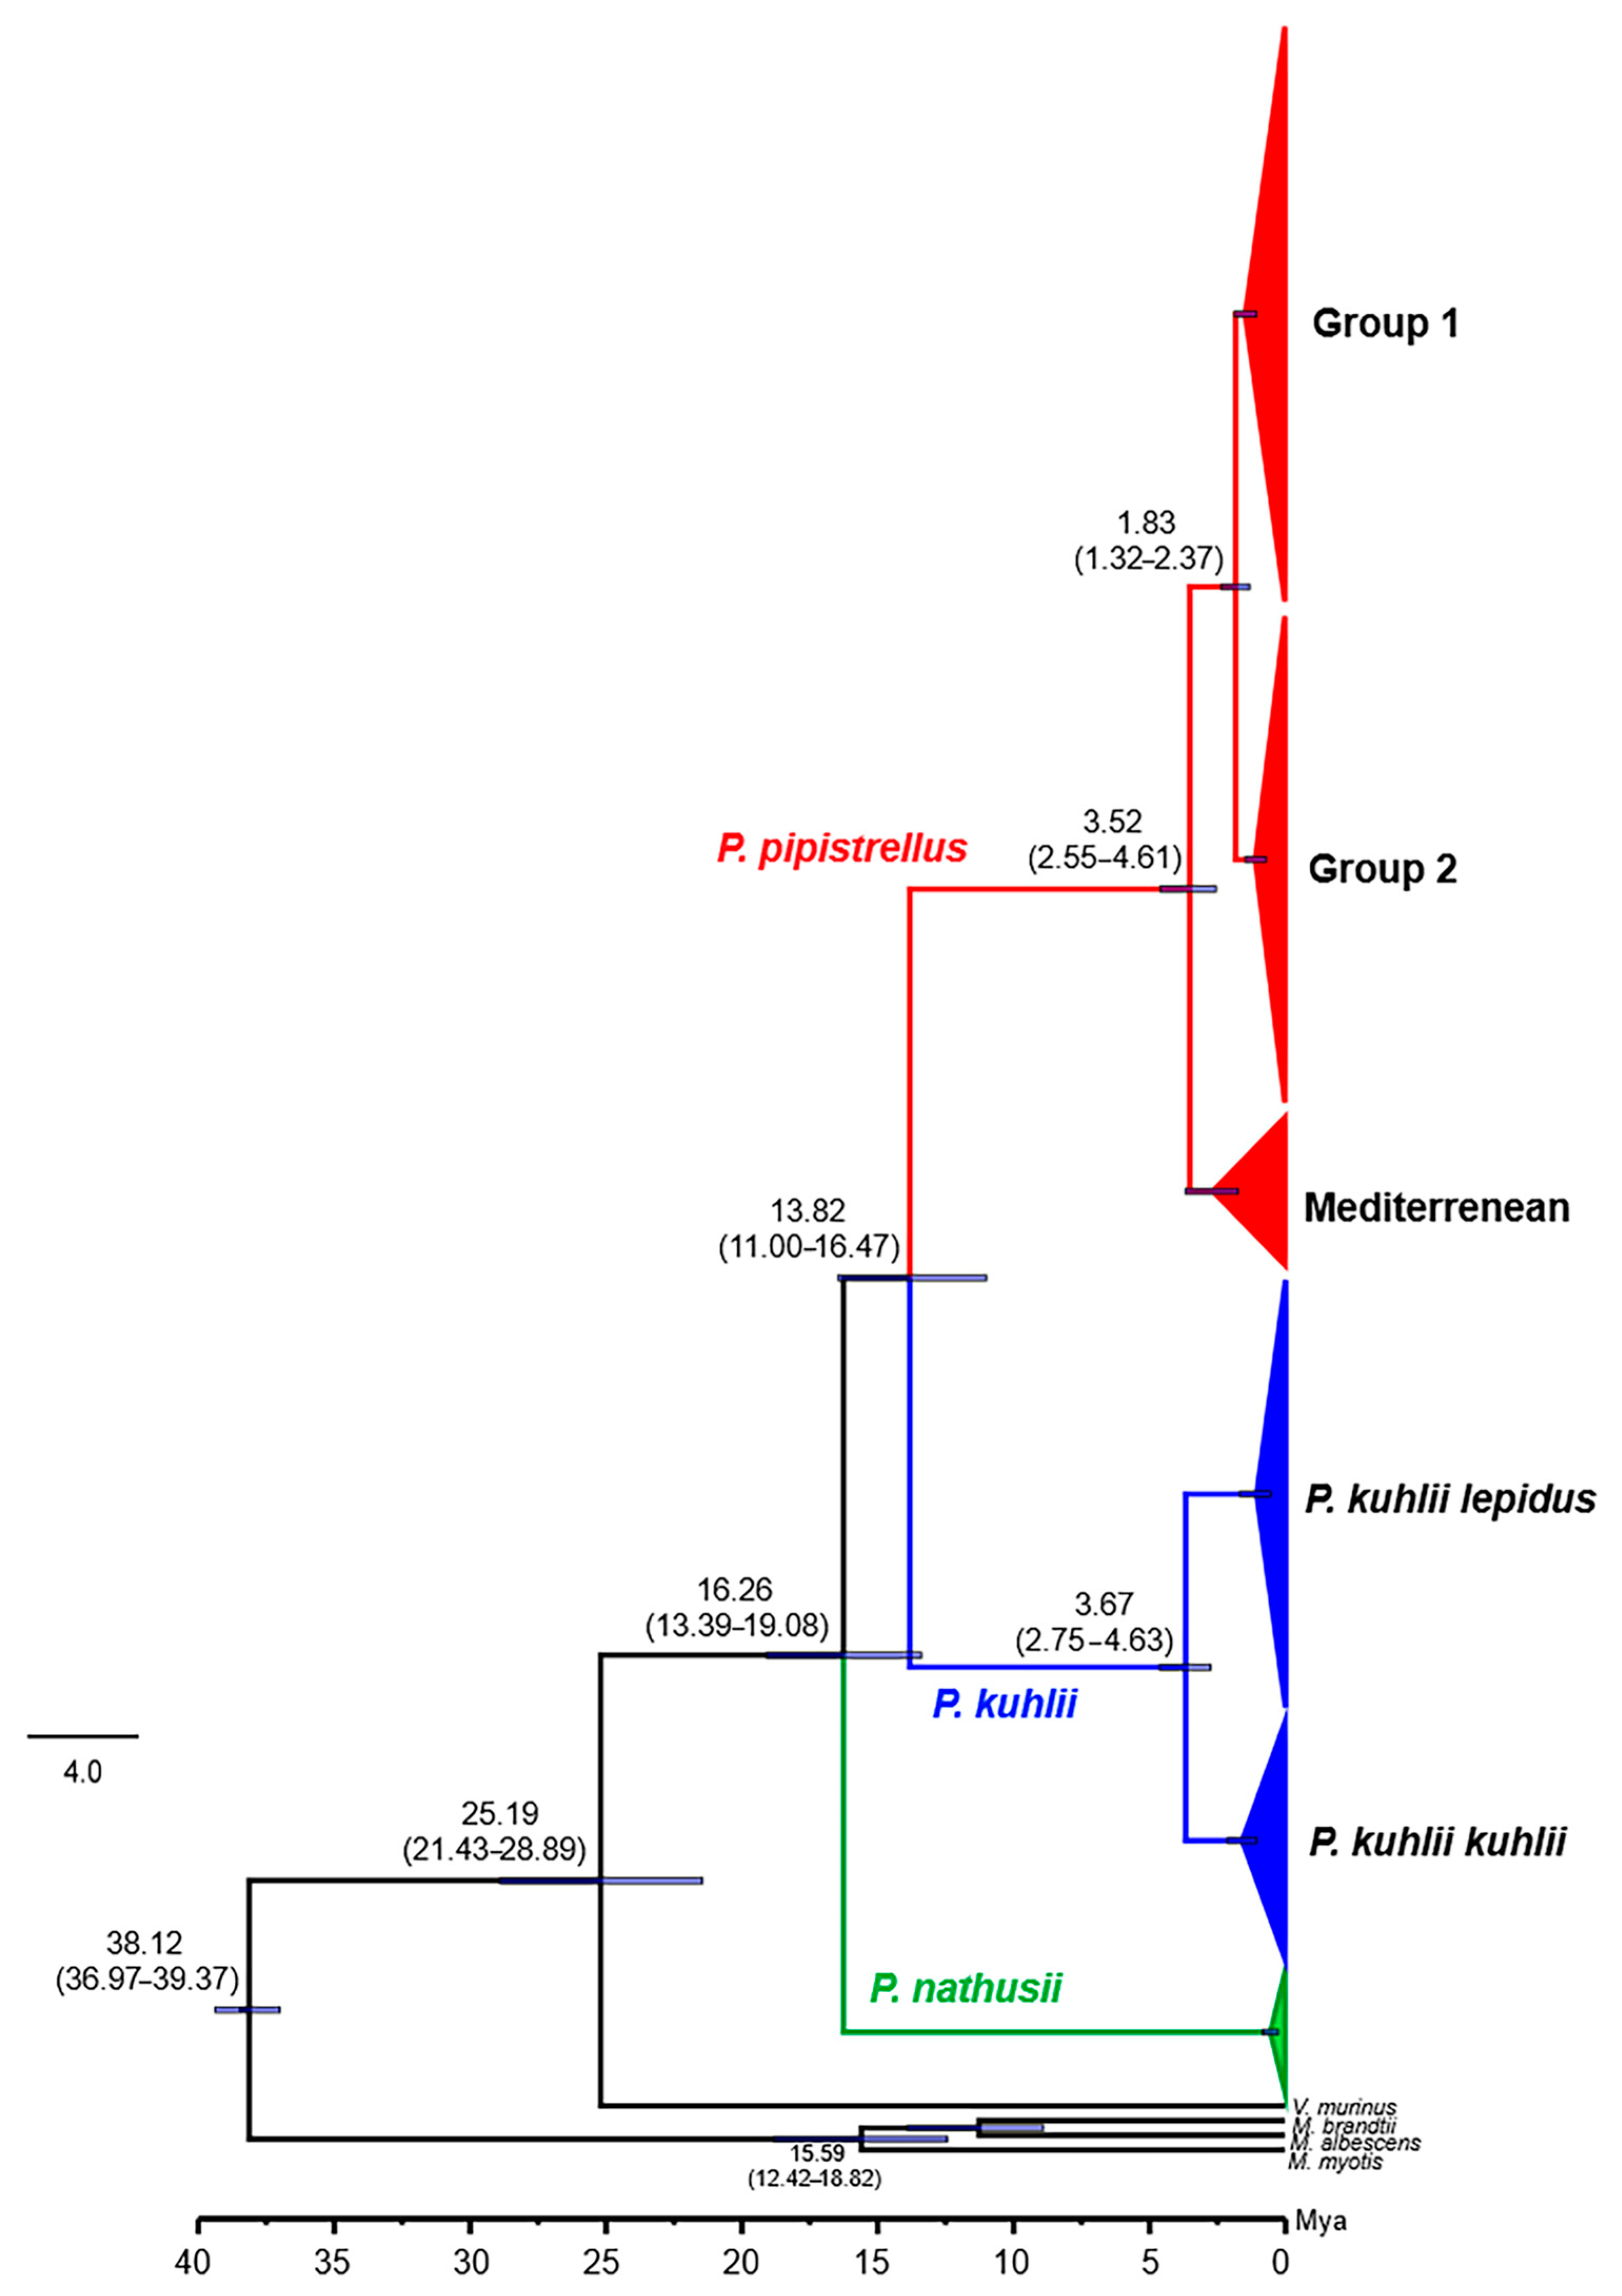
Fossil-calibrated divergence-time estimates inferred using BEAST provided a chronological framework for the evolution of the sampled taxa (Figure 14). The oldest split observed was the divergence of Myotis from the remaining vespertilionids at 38.12 Ma (95% HPD 36.97–39.37). This was followed by the separation of the Vespertilio and Pipistrellus lineages at 25.19 Ma (95% HPD 21.43–28.89). Within the genus Pipistrellus, the divergence of P. nathusii from the (P. pipistrellus + P. kuhlii) clade occurred at 16.26 Ma (95% HPD 13.39–19.08). Subsequently, P. pipistrellus and P. kuhlii split at 13.82 Ma (95% HPD 11.00–16.47). Intraspecific divergences were significantly shallower, dating to the Pliocene and Pleistocene eras. The Mediterranean group of P. pipistrellus diverged from Groups 1 and 2 at 3.52 Ma (95% HPD 2.55–4.61). The subsequent split between Group 1 and Group 2 occurred during the Pleistocene, at 1.83 Ma (95% HPD 1.32–2.37). A comparable divergence time was found in P. kuhlii, where the separation between P. k. kuhlii and P. k. lepidus was estimated at 3.67 Ma (95% HPD 2.75–4.63). The most recent internal divergence was observed within P. nathusii, with the deepest split dating to a very recent period, between 0.12 and 0.55 Ma.

4. Discussion

4.1. Resolving Cryptic Species Boundaries

The initial step of our research involved species identification based on morphological criteria and wing venation patterns [34]. However, our results confirmed the challenges repeatedly emphasized in earlier studies [9,48], where cryptic taxa such as P. pipistrellus and P. pygmaeus are morphologically similar, making external traits alone unreliable. Specifically, 22 individuals initially identified as P. pygmaeus based on external morphological traits, particularly wing venation, were subsequently found to cluster robustly within the P. pipistrellus clade via Cytb sequence analysis (Figure S1). This substantial misidentification underscores that morphological characters commonly used for identification substantially overlap between these two cryptic species. The problem is not unique to Türkiye; earlier large-scale studies [33] concluded that despite being genetically well differentiated, P. pipistrellus and P. pygmaeus are morphologically highly overlapping, rendering diagnosis unreliable. While the presence of P. pygmaeus in Türkiye has been confirmed genetically [11,12], its distribution may be restricted to Thrace and Western Anatolia. Our findings reiterate that molecular confirmation is essential for accurate species identification of cryptic pipistrelle bats in biogeographic transition zones like Anatolia. Nevertheless, the possibility of limited mitochondrial introgression between P. pipistrellus and P. pygmaeus in sympatric regions, as reported in Europe [49], cannot be completely ruled out. Future analyses incorporating nuclear markers would therefore be valuable for confirming the absence or extent of hybridization in Anatolian populations.

4.2. The Biogeographic Role of Anatolia in P. pipistrellus Diversification and Demographic History

Our comparison of Turkish P. pipistrellus sequences with GenBank data revealed three major phylogenetic clusters: Group 1 (East), Group 2 (West), and a paraphyletic Mediterranean group. This bipartite structure is partly consistent with the historical subspecific framework proposed by Albayrak (P. p. pipistrellus [West] and P. p. aladdin [East]) [13]. However, our molecular results placed Hatay within the eastern group (Group 1), and Mediterranean specimens (corresponding to P. p. mediterraneus) were entirely absent from our Turkish dataset, suggesting the presence of this subspecies in Türkiye requires molecular re-evaluation. The co-occurrence of both the Western (Group 2) and Eastern (Group 1) clades in several Turkish localities, including Niğde, Sinop, Samsun, and Rize, indicates significant distributional overlap and confirms the existence of secondary contact zones. This pattern is highly consistent with the refugial and contact zone hypotheses proposed for the Mediterranean Basin [2,23]. The Anatolian Diagonal appears to function as a semi-permeable barrier; while it promotes pronounced genetic divergence in many taxa [50,51], its influence on volant species like Pipistrellus is less restrictive. The bat’s capacity for long-distance movements and use of natural corridors [52] likely explains the co-occurrence of both lineages in transitional areas along the Diagonal. The mixture of European- and Asian-derived haplotypes corroborates the view that Türkiye acts as a crucial biogeographic bridge and a center of mitochondrial diversity [2].
The Median-Joining Network (MJN) analysis revealed the relationships among P. pipistrellus haplotypes (Figure 6). Although the central and widespread position of Haplotype 2 (Hap 2) in the network suggests that it may represent a common and possibly ancestral haplotype, its placement within the broader phylogeny (Figure 4) indicates that this pattern likely reflects local relationships rather than a truly basal position. In addition, the peripheral position of Haplotype 9 suggests a geographically restricted lineage that may have persisted regionally over time. The MJN topology, combined with the co-occurrence of both major phylogenetic groups in provinces such as Sinop, Rize, and Niğde, further reinforces the hypothesis that these localities may represent historical contact areas. The MJN topology, combined with the co-occurrence of both major phylogenetic groups in provinces such as Sinop, Rize, and Niğde, further reinforces the hypothesis that these localities may represent historical contact areas.
Mismatch distribution analyses support this complex history. For Group 1, the significantly negative Fu’s Fs value (−16.766) suggests a historical population expansion, yet the observed multimodal mismatch distribution (Figure 7) is inconsistent with a simple sudden expansion model. This conflict implies that Group 1 has experienced complex demographic processes involving either subsequent genetic structuring or expansion from multiple sub-lineages. Furthermore, the non-significant neutrality tests and highly irregular, multimodal mismatch distribution for Group 2 support complex dynamics, potentially involving admixture between divergent lineages or long-term demographic stability, indicating that this group harbors a heterogeneous genetic background.

4.3. Lineage Diversification and Secondary Contact in P. kuhlii

Analyses of mitochondrial Cytb data resolved two major phylogenetic lineages within Turkish Pipistrellus kuhlii, corresponding to P. k. lepidus and P. k. kuhlii. In line with the subspecific framework of Andriollo et al. [53], Turkish populations clustered into these two groups, indicating that Türkiye is not merely part of a continuous range but a biogeographic transition zone where divergent lineages meet and overlap. This observed split largely corroborates morphologically defined intraspecific differentiation previously described for the species [34,54] and aligns with the Mediterranean contact zones discussed by Stadelmann et al. [24].
The mean K2P genetic divergence of 3.95% ± 0.76 between these lineages exceeds typical intraspecific thresholds in mammals [55], providing strong molecular support for the long-term isolation of these units, potentially warranting subspecies or even species status.
Within P. kuhlii, the kuhlii and lepidus lineages form a well-supported split in the ML tree (BS ≈ 93%) and show higher pairwise divergence (K2P ≈ 3.95%) than observed among P. pipistrellus groups. By contrast, the median-joining network displays relatively short connections between its haplogroups. This difference is likely because parsimony-based networks show only the minimum number of mutations between haplotypes and do not reflect actual genetic distances, which are calculated in model-based analyses like ML or K2P [39,56]. The apparent discrepancy between percentage divergence and the number of mutational steps also reflects methodological and dataset-related factors. K2P distances account for transition/transversion bias, multiple substitutions [57], and alignment length differences (970 bp in P. pipistrellus vs. up to 1113 bp in P. kuhlii), whereas median-joining networks represent only the minimum number of observed substitutions. In addition to methodological factors, this discrepancy may also reflect lineage-specific mitochondrial variation. Similar patterns have been observed in vespertilionid bats [58], where incomplete lineage sorting (ILS) was suggested as a possible cause. Biologically, the pattern is compatible with long-term mitochondrial isolation followed by secondary contact. The overall topology of the network (Figure 12) shows several rare haplotypes radiating from a central, widespread haplotype (Haplotype 2), a pattern that may indicate recent diversification within the population. The co-occurrence of both lineages in Kırşehir, Hatay, and Adana points to secondary contact zones-likely microrefugia where lineage diversity persisted during glacial periods. Furthermore, our phylogenetic analysis placed GenBank sequences labeled as P. k. deserti within the P. k. kuhlii lineage, supporting the conclusion [59] that the deserti form is an environmentally induced ecomorphotype rather than a distinct evolutionary lineage.
Mismatch distribution analyses revealed contrasting demographic signals between the lineages. P. k. lepidus showed significantly negative Tajima’s D and Fu’s Fs values, and a mismatch curve that broadly aligned with the sudden expansion model. This result provides strong statistical evidence for a past population expansion in the eastern lineage. Conversely, P. k. kuhlii showed positive and non-significant neutrality indices and a multimodal curve, suggesting long-term stability or mild contraction. The complex, multimodal pattern observed when all individuals were pooled (Figure 9) is likely a direct reflection of the co-existence of these two deeply divergent lineages, masking the simpler expansion signal found within P. k. lepidus.

4.4. Phylogeography of the Migratory P. nathusii

Mitochondrial Cytb data revealed that most Turkish populations of P. nathusii, particularly those from Northwestern Anatolia and Thrace, cluster within the European lineage. The MJN analysis supports this, showing that Haplotype 2 (Hap 2) forms the network core and links Turkish individuals with samples from across Europe (Figure 13). This robust genetic continuum with Europe is highly consistent with the documented migratory nature of the species [60].
A notable exception was the specimen from Muğla (Southwestern Turkey, Hap 1), which formed a distinct and well-supported clade in the ML tree (BS = 99%). In the MJN (Figure 13), this haplotype shows limited mutational separation from the central haplotype, suggesting slight local differentiation rather than a deeply isolated lineage. This pattern may reflect regional persistence of genetic variation in Southwestern Anatolia, consistent with the idea that local refugia in Western Asia preserved micro-scale diversity during glacial cycles [28].
The significantly negative Tajima’s D value observed for this species further suggests a recent population expansion. However, the positive Fu’s Fs (13.596) value may reflect selective processes or pronounced population structure, which is consistent with the presence of the differentiated Muğla lineage. The slightly asymmetric mismatch distribution tentatively suggests demographic stabilization following an earlier expansion or expansion originating from multiple sublineages.

4.5. Temporal Framework for Diversification: Miocene-Pleistocene Influence

The fossil calibrated divergence time estimates recovered in this study are broadly congruent with earlier molecular dating frameworks for vespertilionid bats [24,45,61,62]. However, it should be noted that estimates based solely on mitochondrial data may carry systematic bias, particularly for deeper nodes, as discussed in previous studies [63,64].
The split of Myotis from other vespertilionids at ~38 Ma corresponds to the late Eocene, a period marked by global cooling and faunal turnover, which has previously been implicated as a driver of diversification in Chiroptera [4,45]. Similarly, the separation of Vespertilio and Pipistrellus around 25 Ma falls within the Oligocene-Miocene transition, a period marked by major climatic reorganizations including global cooling, increased seasonality, and the expansion of open habitats across Eurasia [62,65,66]. This divergence timing is also consistent with recent phylogenomic frameworks, suggesting that the early Miocene split between the Vespertilio and PipistrellusNyctalus lineages occurred approximately 25 Mya [45,67], supported by fossil evidence of early Nyctalus species [68], although genomic calibrations [69] provide more robust estimates for higher-level splits.
Within Pipistrellus, the divergence of P. nathusii from the P. pipistrellus and P. kuhlii clade at ~16 Ma coincides with early-middle Miocene climatic oscillations. This phylogenetic pattern is largely consistent with the mitochondrial topology reported by Zhukova et al. [67], who also recovered P. nathusii as an early-diverging lineage relative to the (P. pipistrellus + P. kuhlii) clade, while additionally including P. pygmaeus as a sister taxon to P. pipistrellus. Minor topological differences likely reflect variation in taxon sampling and the inclusion of additional European lineages in their dataset. Subsequently, the split between P. pipistrellus and P. kuhlii at approximately 14 Ma aligns with the Middle Miocene Climatic Transition (MMCT, ~14–13 Ma), when global cooling and Antarctic glaciation reshaped ecosystems, leading to the emergence of more temperate and arid habitats [70,71]. Similar timing has been inferred for the early diversification of Myotis [24], when global climatic transitions fostered habitat expansion and biogeographic radiation across Eurasia. These concordant patterns suggest that Miocene climatic reorganizations broadly facilitated lineage diversification within Vespertilionidae.
In P. pipistrellus, divergence dating revealed two continental lineages, including Turkish populations, that split around 1.8 Ma. The Mediterranean group diverged slightly earlier, about 3.5 Ma. Hulva et al. [23] suggested that diversification within the P. pipistrellus complex was driven by environmental fragmentation during the Messinian Salinity Crisis (5.96–5.33 Ma), together with ecological specialization of Mediterranean populations. Our divergence times are more recent than the MSC. Instead, Late Pliocene climatic oscillations and sea-level fluctuations, which repeatedly changed habitat connectivity in the Mediterranean Basin, likely played a stronger role in shaping the observed patterns of lineage differentiation. Finally, the shallow divergence within P. nathusii (0.12–0.55 Ma) aligns with late Pleistocene climatic cycles, consistent with its documented migratory ecology and range shifts across Europe and Anatolia [30,59].
Overall, these results suggest that climatic fluctuations since the Miocene, including the Messinian Salinity Crisis, promoted early lineage divergence and regional isolation within Pipistrellus. Later Pliocene–Pleistocene climatic oscillations likely enhanced secondary contact and range shifts among these lineages. Together, these events played a major role in shaping the current diversification patterns of Pipistrellus, although mitochondrial-based dating should be interpreted with caution due to potential calibration bias.

5. Conclusions

This study confirms Anatolia as a crucial evolutionary center for the Pipistrellus genus across the Western Palearctic. Our findings reveal deep intraspecific divergence within multiple species, establishing Türkiye as a significant secondary contact zone where historically isolated lineages converge and overlap, a pattern clearly observed in both P. pipistrellus and P. kuhlii. The discovery of a distinct, potentially resident lineage of P. nathusii alongside widespread migratory populations highlights Anatolia’s dual role as both a refugium (preserving unique diversity) and a migratory corridor (facilitating gene flow). Furthermore, the complete misidentification of all P. pygmaeus specimens based on morphology definitively confirms that external traits are unreliable for distinguishing these cryptic taxa. This underscores the essential and mandatory role of molecular data in modern taxonomy and accurate conservation assessments for the genus. These contemporary genetic patterns are the legacy of diversification events driven by major climatic shifts from the Miocene to the Pleistocene. In summary, the complex phylogeographic structure observed reinforces Anatolia’s position as a dynamic center of evolution, actively shaping the genetic diversity of Palearctic bat fauna.

Supplementary Materials

The following supporting information can be downloaded at: https://www.mdpi.com/article/10.3390/biology14111549/s1. The Supplementary File contains all detailed data and figures supporting the phylogenetic, demographic, and biogeographic analyses presented in this article. Table S1: Provides a comprehensive summary of all 156 Pipistrellus samples used in this study, including locality data, map numbers, field identification numbers, GenBank accession numbers, assigned haplotypes, and references. Table S2: Genetic divergence (K2P), gene flow (Nm), and neutrality tests for Pipistrellus species based on Cytb data. Figure S1: Displays the Maximum Likelihood (ML) phylogeny for Turkish specimens morphologically identified as P. pygmaeus, including all related outgroup and reference sequences. References [2,11,23,33,59,72,73,74,75,76,77,78,79,80,81,82,83,84] are cited in the Supplementary Materials.

Author Contributions

Conceptualization, Ş.B. and E.S.; Data curation, G.O.K. and Ş.B.; Formal analysis, E.S. and G.O.K.; Funding acquisition, G.O.K.; Investigation, E.S., Ş.B. and G.O.K.; Methodology, E.S. and G.O.K.; Supervision, Ş.B. and G.O.K.; Visualization, E.S. and G.O.K.; Writing—original draft, E.S. and G.O.K.; Writing—review and editing, E.S., Ş.B. and G.O.K. All authors have read and agreed to the published version of the manuscript.

Funding

This study was funded by the TÜBİTAK 1002-Program (Project No: 124Z749).

Institutional Review Board Statement

Ethical approval was obtained from the Aksaray University Animal Experiments Ethics Committee (2024/8-45 approved on 4 October 2024). Laboratory work was carried out at the Aksaray University Scientific and Technological Application and Research Center (ASUBTAM).

Informed Consent Statement

Not applicable.

Data Availability Statement

All novel DNA sequences have been deposited in the GenBank international repository. The complete list of Accession Numbers corresponding to the samples analyzed in this study is provided within the Supplementary File (Table S1).

Acknowledgments

Fieldwork was conducted under permits issued by the General Directorate of Nature Conservation and National Parks, Ministry of Agriculture and Forestry (Türkiye).

Conflicts of Interest

The authors declare no conflicts of interest.

References

  1. Benda, P.; Horáček, I. Bats (Mammalia: Chiroptera) of the Eastern Mediterranean. Part 1. Review of distribution and taxonomy of bats in Turkey. Acta Soc. Zool. Bohemicae 1998, 62, 255–313. [Google Scholar]
  2. Çoraman, E.; Furman, A.; Karataş, A.; Bilgin, R. Phylogeographic analysis of Anatolian bats highlights the importance of the region for preserving the chiropteran mitochondrial genetic diversity in the Western Palaearctic. Conserv. Genet. 2013, 14, 1205–1216. [Google Scholar] [CrossRef]
  3. Jones, K.E.; Purvis, A.; Maclarnon, A.N.; Bininda-Emonds, O.R.; Simmons, N.B. A phylogenetic supertree of the bats (Mammalia: Chiroptera). Biol. Rev. 2002, 77, 223–259. [Google Scholar] [CrossRef] [PubMed]
  4. Teeling, E.C.; Springer, M.S.; Madsen, O.; Bates, P.; O’brien, S.J.; ve Murphy, W.J. A molecular phylogeny for bats illuminates biogeography and the fossil record. Science 2005, 307, 580–584. [Google Scholar] [CrossRef]
  5. Mammal Diversity Database. Mammal Diversity Database (Version 1.11). Zenodo. 2023. Available online: https://zenodo.org/records/8428367 (accessed on 1 November 2025).
  6. Wilson, D.E.; Reeder, D.M. (Eds.) Mammal Species of the World: A Taxonomic and Geographic Reference; JHU Press: Baltimore, MD, USA, 2005; Volume 1. [Google Scholar]
  7. Vaughan, T.A.; Ryan, J.M.; Czaplewski, N.J. Mammalogy, 6th ed.; Jones & Bartlett: Burlington, MA, USA, 2015. [Google Scholar]
  8. Karataş, A.; Filiz, H.; Erciyas-Yavuz, K.; Özeren, S.C.; Tok, C.V. The vertebrate biodiversity of Turkey. In Biodiversity, Conservation and Sustainability in Asia: Volume 1: Prospects and Challenges in West Asia and Caucasus; Springer: Cham, Switzerland, 2021; pp. 175–274. [Google Scholar] [CrossRef]
  9. Mayer, F.; von Helversen, O. Sympatric distribution of two cryptic bat species across Europe. Biol. J. Linn. Soc. 2001, 74, 365–374. [Google Scholar] [CrossRef]
  10. Pavlinić, I.; Tvrtković, N.; Holcer, D. Morphological identification of the soprano pipistrelle (Pipistrellus pygmaeus Leach, 1825) in Croatia. Hystrix Ital. J. Mammal. 2008, 19, 47–53. [Google Scholar] [CrossRef]
  11. Benda, P.; Hulva, P.; Andreas, M.; Uhrin, M. Notes on the distribution of Pipistrellus pipistrellus complex in the Eastern Mediterranean: First records of P. pipistrellus for Syria and of P. pygmaeus for Turkey. Vespertilio 2003, 7, 87–95. [Google Scholar]
  12. Dietz, C.; Schunger, I.; Keşapli Didrickson, Ö.; Karataş, A.; Mayer, F. First record of Pipistrellus pygmaeus (Chiroptera: Vespertilionidae) in Anatolia. Zool. Middle East 2005, 34, 5–10. [Google Scholar] [CrossRef]
  13. Albayrak, İ. A new record of Pipistrellus pipistrellus aladidn for Turkey. Commun. Fac. Sci. Univ. Ank. Ser. C Biol. 1987, 5, 31–37. [Google Scholar] [CrossRef]
  14. Karataş, A. Türkiye yarasaları (Mammalia: Chiroptera) (Tayin anahtarı). Niğde Üniversitesi Fen Bilim. Derg. 1996, 1, 107–117. [Google Scholar]
  15. Karataş, A.; Yiğit, N.; Kankılıç, T.; Çolak, E. Contribution to the distribution and karyology of some vespertilionid bats (Mammalia: Chiroptera) from Turkey. Zool. Middle East 2004, 31, 5–12. [Google Scholar] [CrossRef]
  16. Albayrak, İ. The bats of the eastern Black Sea region in Turkey (Mammalia: Chiroptera). Turk. J. Zool. 2003, 27, 269–273. [Google Scholar]
  17. Arslan, A.; Albayrak, İ. Taxonomic status of Kuhl’s pipistrelle Pipistrellus kuhlii (Kuhl, 1819) in Turkey (Mammalia: Chiroptera). Pak. J. Biol. Sci. 2005, 8, 1699–1702. [Google Scholar]
  18. Şekercioğlu, Ç.H.; Anderson, S.; Akçay, E.; Bilgin, R.; Can, Ö.E.; Semiz, G.; Dalfes, H.N. Turkey’s globally important biodiversity in crisis. Biol. Conserv. 2011, 144, 2752–2769. [Google Scholar] [CrossRef]
  19. Yorulmaz, T.; Ürker, O.; Özmen, R. Yarasa ve orman ilişkisi üzerine bir değerlendirme. Orman. Araştırma Derg. 2018, 5, 31–43. [Google Scholar] [CrossRef]
  20. Yorulmaz, T.; Arslan, N. Current status of the bats in Turkey with their ecogeographic distributions and recommendations for national conservation status (Mammalia: Chiroptera). Fresenius Environ. Bull. 2020, 29, 6691–6706. [Google Scholar]
  21. Tzortzakaki, O.; Papadatou, E.; Kati, V.; Giokas, S. Winners and losers in an urban bat community: A case study from southeastern Europe. Hystrix Ital. J. Mammal. 2019, 30, 134–140. [Google Scholar] [CrossRef]
  22. Tian, L.; Liang, B.; Maeda, K.; Metzner, W.; Zhang, Z. Molecular studies on the classification of Miniopterus schreibersii (Chiroptera: Vespertilionidae) inferred from mitochondrial cytochrome b sequences. Folia Zool. 2004, 53, 303–311. [Google Scholar]
  23. Hulva, P.; Benda, P.; Hanák, V.; Evin, A.; Horáček, I. New mitochondrial lineages within the Pipistrellus pipistrellus complex from Mediterranean Europe. Folia Zool. 2007, 56, 378–388. [Google Scholar]
  24. Stadelmann, B.; Lin, L.K.; Kunz, T.H.; Ruedi, M. Molecular phylogeny of New World Myotis (Vespertilionidae) inferred from mitochondrial and nuclear DNA genes. Mol. Phylogenetics Evol. 2007, 43, 32–48. [Google Scholar] [CrossRef]
  25. Uvizl, M.; Petr, B. Intraspecific variation of Myotis emarginatus (Chiroptera: Vespertilionidae) inferred from mitochondrial and nuclear genetic markers. Acta Chiropterologica 2021, 23, 285–300. [Google Scholar] [CrossRef]
  26. Abduriyim, S.; Kasimu, T.; Lan, J.K.; Pu, Z.L.; Bai, J.L.; Wang, Y.C. Morphological and molecular confirmation of the common pipistrelle bat, Pipistrellus pipistrellus Schreber, 1774 (Vespertilionidae: Chiroptera) in Xinjiang, China. Mammalia 2022, 86, 298–302. [Google Scholar] [CrossRef]
  27. Perera, T.; Schwarz, F.; Muzeniek, T.; Siriwardana, S.; Becker-Ziaja, B.; Perera, I.C.; Handunnetti, S.; Weerasena, J.; Premawansa, G.; Premawansa, S. First complete cytochrome B sequences and molecular taxonomy of bat species from Sri Lanka. Animals 2022, 12, 1674. [Google Scholar] [CrossRef]
  28. Hulva, P.; Fornůsková, A.; Chudárková, A.; Evin, A.; Allegrini, B.; Benda, P.; Bryja, J. Mechanisms of radiation in a bat group from the genus Pipistrellus inferred by phylogeography, demography and population genetics. Mol. Ecol. 2010, 19, 5417–5431. [Google Scholar] [CrossRef] [PubMed]
  29. Alivizatos, H.; Karagianni, P.; Kalpakis, S.; Karris, G.; Ioannidis, I.; Poirazidis, K. First record of Pipistrellus lepidus Blyth, 1845 in Greece. North-West. J. Zool. 2023, 19, 217–218. [Google Scholar]
  30. Kurvits, T.; Nellemann, C.; Alfthan, B.; Kühl, A.; Prokosch, P.; Virtue, M.; Skaalvik, J.F. (Eds.) Living Planet: Connected Planet—Preventing the End of the World’s Wildlife Migrations Through Ecological Networks. A Rapid Response Assessment; United Nations Environment Programme, GRID-Arendal: Arendal, Norway, 2011; ISBN 978-82-7701-098-4. [Google Scholar]
  31. Vasenkov, D.; Desmet, J.F.; Popov, I.; Sidorchuk, N. Bats can migrate farther than it was previously known: A new longest migration record by Nathusius’ pipistrelle Pipistrellus nathusii (Chiroptera: Vespertilionidae). Mammalia 2022, 86, 524–526. [Google Scholar] [CrossRef]
  32. Furmankiewicz, J.; Kucharska, M. Migration of bats along a large river valley in southwestern Poland. J. Mammal. 2009, 90, 1310–1317. [Google Scholar] [CrossRef]
  33. Hulva, P.; Horáček, I.; Strelkov, P.P.; Benda, P. Molecular architecture of Pipistrellus pipistrellus/Pipistrellus pygmaeus complex (Chiroptera: Vespertilionidae): Further cryptic species and Mediterranean origin of the divergence. Mol. Phylogenet. Evol. 2004, 32, 1023–1035. [Google Scholar] [CrossRef]
  34. Dietz, C.; von Helversen, O. Illustrated Identification Key to the Bats of Europe; Electronic Publication: Tuebingen, Germany, 2004; Volume 1, 72p. [Google Scholar]
  35. Irwin, D.M.; Kocher, T.D.; Wilson, A.C. Evolution of the cytochrome b gene of mammals. J. Mol. Evol. 1991, 32, 128–144. [Google Scholar] [CrossRef]
  36. Colak, R.; Olgun Karacan, G.; Kandemir, I.; Çolak, E.; Kankiliç, T.; Yigit, N.; Michaux, J. Genetic variations of Turkish bank vole, Myodes glareolus (Mammalia: Rodentia) inferred from mtDNA. Mitochondrial DNA Part A 2016, 27, 4372–4379. [Google Scholar] [CrossRef]
  37. Hall, T.A. BioEdit: A user-friendly biological sequence alignment editor and analysis program for Windows 95/98/NT. Nucleic Acids Symp. Ser. 1999, 41, 95–98. [Google Scholar]
  38. Rozas, J.; Ferrer-Mata, A.; Sánchez-DelBarrio, J.C.; Guirao-Rico, S.; Librado, P.; Ramos-Onsins, S.E.; Sánchez-Gracia, A. DnaSP 6: DNA sequence polymorphism analysis of large datasets. Mol. Biol. Evol. 2017, 34, 3299–3302. [Google Scholar] [CrossRef]
  39. Bandelt, H.J.; Forster, P.; Röhl, A. Median-joining networks for inferring intraspecific phylogenies. Mol. Biol. Evol. 1999, 16, 37–48. [Google Scholar] [CrossRef] [PubMed]
  40. Tajima, F. Statistical method for testing the neutral mutation hypothesis by DNA polymorphism. Genetics 1989, 123, 585–595. [Google Scholar] [CrossRef] [PubMed]
  41. Fu, Y.X. Statistical tests of neutrality of mutations against population growth, hitchhiking and background selection. Genetics 1997, 147, 915–925. [Google Scholar] [CrossRef] [PubMed]
  42. Excoffier, L.; Lischer, H.E.L. Arlequin suite ver 3.5: A new series of programs to perform population genetics analyses under Linux and Windows. Mol. Ecol. Resour. 2010, 10, 564–567. [Google Scholar] [CrossRef]
  43. Nguyen, L.T.; Schmidt, H.A.; von Haeseler, A.; Minh, B.Q. IQ-TREE: A fast and effective stochastic algorithm for estimating maximum-likelihood phylogenies. Mol. Biol. Evol. 2015, 32, 268–274. [Google Scholar] [CrossRef]
  44. Suchard, M.A.; Lemey, P.; Baele, G.; Ayres, D.L.; Drummond, A.J.; Rambaut, A. Bayesian phylogenetic and phylodynamic data integration using BEAST 1.10. Virus Evol. 2018, 4, vey016. [Google Scholar] [CrossRef]
  45. Borges, M.S.; Salles, M.M.A.; Oliveira, E.F.; Magalhães, F.M.; Silva, D.C.; Oliveira, H.F.M.; Faria, K.C.; Laine, V.N.; Lilley, T.M.; Silva, J.M.; et al. Gene-Specific Substitution Rates for the Vespertilionidae (Chiroptera: Mammalia) Mitochondrial Genome, with the Description of Three new Mitogenomes. J. Mol. Evol. 2025, 93, 610–619. [Google Scholar] [CrossRef]
  46. Rambaut, A.; Drummond, A.J.; Xie, D.; Baele, G.; Suchard, M.A. Posterior summarization in Bayesian phylogenetics using Tracer 1.7. Syst. Biol. 2018, 67, 901–904. [Google Scholar] [CrossRef]
  47. Nei, M. Evolution of human races at the gene level. In Human Genetics, Part A: The Unfolding Genome; Bonne-Tamir, B., Cohen, T., Goodman, R.M., Eds.; Alan R. Liss: New York, NY, USA, 1982; pp. 167–181. [Google Scholar]
  48. Barratt, E.M.; Deaville, R.; Burland, T.M.; Bruford, M.W.; Jones, G.; Racey, P.A.; Wayne, R.K. DNA answers the call of pipistrelle bat species. Nature 1997, 387, 138–139. [Google Scholar] [CrossRef]
  49. Sztencel-Jabłonka, A.; Bogdanowicz, W. Population genetics study of common (Pipistrellus pipistrellus) and soprano (Pipistrellus pygmaeus) pipistrelle bats from central Europe suggests interspecific hybridization. Can. J. Zool. 2012, 90, 1251–1260. [Google Scholar] [CrossRef]
  50. Gür, H. The Anatolian diagonal revisited: Testing the ecological basis of a biogeographic boundary. Turk. J. Zool. 2016, 40, 121–134. [Google Scholar] [CrossRef]
  51. Mutun, S.; Dinç, S. The Anatolian Diagonal and paleoclimatic changes shaped the phylogeography of Cynips quercus (Hymenoptera, Cynipidae). Ann. Zool. Fenn. 2019, 56, 65–83. [Google Scholar] [CrossRef]
  52. Dietz, C.; von Helversen, O.; Nill, D.; Lina, P.H.; Hutson, A.M. Bats of Britain, Europe and Northwest Africa; A & C Black Publishers Ltd.: London, UK, 2009. [Google Scholar]
  53. Andriollo, T.; Naciri, Y.; Ruedi, M. Two mitochondrial barcodes for one biological species: The case of European Kuhl’s pipistrelles (Chiroptera). PLoS ONE 2015, 10, e0134881. [Google Scholar] [CrossRef]
  54. Sachanowicz, K.; Pıskorski, M.; Tereba, A. Systematics and taxonomy of Pipistrellus kuhlii (Kuhl, 1817) in Central Europe and the Balkans. Zootaxa 2017, 4306, 53–66. [Google Scholar] [CrossRef]
  55. Baker, R.J.; Bradley, R.D. Speciation in mammals and the genetic species concept. J. Mammal. 2006, 87, 643–662. [Google Scholar] [CrossRef] [PubMed]
  56. Joly, S.; Stevens, M.I.; van Vuuren, B.J. Haplotype Networks Can Be Misleading in the Presence of Missing Data. Syst. Biol. 2007, 56, 857–862. [Google Scholar] [CrossRef]
  57. Kimura, M. A simple method for estimating evolutionary rates of base substitutions through comparative studies of nucleotide sequences. J. Mol. Evol. 1980, 16, 111–120. [Google Scholar] [CrossRef]
  58. Yi, X.; Latch, E.K.; Lim, B.K.; Koroiva, R.; Da Rocha, P.A. UCE-derived mitochondrial phylogeny reveals pervasive mito-nuclear discordances in serotine bats (genus Eptesicus) and complex evolutionary history in Eptesicus (Histiotus). Mamm. Biol. 2024, 104, 417–430. [Google Scholar] [CrossRef]
  59. Benda, P.; Andriollo, T.; Ruedi, M. Systematic position and taxonomy of Pipistrellus deserti (Chiroptera: Vespertilionidae). Mammalia 2015, 79, 419–438. [Google Scholar] [CrossRef]
  60. Hutterer, R.; Ivanova, T.; Meyer-Cords, C.; Rodrigues, L. Bat Migrations in Europe: A Review of Banding Data and Literature; BfN-Schriftenvertrieb im Landwirtschaftsverlag: Münster, Germany, 2005. [Google Scholar]
  61. Hoffmann, F.G.; Hoofer, S.R.; Baker, R.J. Molecular dating of the diversification of Phyllostominae bats based on nuclear and mitochondrial DNA sequences. Mol. Phylogenet. Evol. 2008, 49, 653–658. [Google Scholar] [CrossRef]
  62. Amador, L.I.; Moyers Arévalo, R.L.; Almeida, F.C.; Catalano, S.A.; Giannini, N.P. Bat systematics in the light of unconstrained analyses of a comprehensive molecular supermatrix. J. Mamm. Evol. 2018, 25, 37–70. [Google Scholar] [CrossRef]
  63. Zheng, Y.; Peng, R.; Kuro-o, M.; Zeng, X. Exploring patterns and extent of bias in estimating divergence time from mitochondrial DNA sequence data in a particular lineage: A case study of salamanders (Order Caudata). Mol. Biol. Evol. 2011, 28, 2521–2535. [Google Scholar] [CrossRef] [PubMed]
  64. Lukoschek, V.; Keogh, J.S.; Avise, J.C. Evaluating fossil calibrations for dating phylogenies in light of rates of molecular evolution: A comparison of three approaches. Syst. Biol. 2012, 61, 22–43. [Google Scholar] [CrossRef] [PubMed]
  65. Liu, Z.H.; Pagani, M.; Zinniker, D.; DeConto, R.; Huber, M.; Brinkhuis, H.; Shah, S.R.; Leckie, R.M.; Pearson, A. Global cooling during the Eocene-Oligocene climate transition. Science 2009, 323, 1187–1190. [Google Scholar] [CrossRef]
  66. Agustí, J.; Cabrera, L.; Garcés, M. The Vallesian Mammal Turnover: A Late Miocene record of decoupled land-ocean evolution. Geobios 2013, 46, 151–157. [Google Scholar] [CrossRef]
  67. Zhukova, S.S.; Yuzefovich, A.P.; Lebedev, V.S.; Kruskop, S.V. Reassessment of the Taxonomic Borders Within Pipistrellus (Chiroptera, Vespertilionidae, Pipistrellini). Diversity 2025, 17, 317. [Google Scholar] [CrossRef]
  68. Horáček, I. On the early history of vespertilionid bats in Europe: The Lower Miocene record from the Bohemian Massif. Lynx 2001, 32, 123–154. [Google Scholar]
  69. Foley, N.M.; Mason, V.C.; Harris, A.J.; Bredemeyer, K.R.; Damas, J.; Lewin, H.A.; Eizirik, E.; Gatesy, J.; Karlsson, E.K.; Lindblad-Toh, K.; et al. A genomic timescale for placental mammal evolution. Science 2023, 380, eabl8189. [Google Scholar] [CrossRef]
  70. Zachos, J.; Pagani, M.; Sloan, L.; Thomas, E.; Billups, K. Trends, rhythms, and aberrations in global climate 65 Ma to present. Science 2001, 292, 686–693. [Google Scholar] [CrossRef]
  71. Böhme, M. The Miocene climatic optimum: Evidence from ectothermic vertebrates of Central Europe. Palaeogeography, Palaeoclimatology. Palaeoecology 2003, 195, 389–401. [Google Scholar] [CrossRef]
  72. Stadelmann, B.; Herrera, L.G.; Arroyo-Cabrales, J.; Flores-Martínez, J.J.; May, B.P.; Ruedi, M. Molecular systematics of the fishing bat Myotis (Pizonyx) vivesi. J. Mammal. 2004, 85, 133–139. [Google Scholar] [CrossRef]
  73. Benda, P.; Kiefer, A.; Hanák, V.; Veith, M. Systematic Status of African Populations of Long-Eared Bats, Genus Plecotus (Mammalia: Chiroptera); Institute of Vertebrate Biology: Brno, Czech Republic, 2004. [Google Scholar]
  74. Ibáñez, C.; García-Mudarra, J.L.; Ruedi, M.; Stadelmann, B.; Juste, J. The Iberian contribution to cryptic diversity in European bats. Acta Chiropterologica 2006, 8, 277–297. [Google Scholar] [CrossRef]
  75. Benda, P.; Faizolâhi, K.; Andreas, M.; Obuch, J.; Reiter, A.; Ševčík, M.; Uhrin, M.; Vallo, P.; Ashrafi, S. Bats (Mammalia: Chiroptera) of the Eastern Mediterranean and Middle East. Part 10. Bat fauna of Iran. Acta Soc. Zool. Bohemicae 2012, 76, 163–582. [Google Scholar]
  76. Benda, P.; Lučan, R.K.; Obuch, J.; Reiter, A.; Andreas, M.; Bačkor, P.; Bohnenstengel, T.; Eid, E.K.; Ševčík, M.; Vallo, P.; et al. Bats (Mammalia: Chiroptera) of the Eastern Mediterranean and Middle East. Part 8. Bats of Jordan: Fauna, ecology, echolocation, ectoparasites. Acta Soc. Zool. Bohemicae 2010, 74, 185–353. [Google Scholar]
  77. Benda, P.; Reiter, A.; Uhrin, M.; Varadínová, Z. A new species of pipistrelle bat (Chiroptera: Vespertilionidae) from southern Arabia. Acta Chiropterol. 2016, 18, 301–323. [Google Scholar] [CrossRef]
  78. Mifsud, C.M.; Vella, A. Mitochondrial genetic diversity of bat species from the Maltese Islands and applications for their conservation. Nat. Eng. Sci. 2019, 4, 276–292. [Google Scholar] [CrossRef]
  79. Benda, P.; Hulva, P.; Gaisler, J. Systematic status of African populations of Pipistrellus pipistrellus complex (Chiroptera: Vespertilionidae), with a description of a new species from Cyrenaica, Libya. Acta Chiropterol. 2004, 6, 193–217. [Google Scholar] [CrossRef]
  80. Bray, T.C.; Mohammed, O.B.; Butynski, T.M.; Wronski, T.; Alagaili, A.N.; Hill, J.E. Phylogenetic and demographic insights into Kuhl’s Pipistrelle, Pipistrellus kuhlii, in the Middle East. PLoS ONE 2013, 8, e57306. [Google Scholar] [CrossRef]
  81. Horemans, M.; Van Bets, J.; Joly Maes, T.; Maes, P.; Vanmechelen, B. Discovery and genome characterization of six new orthoparamyxoviruses in small Belgian mammals. Virus Evol. 2023, 9, vead065. [Google Scholar] [CrossRef] [PubMed]
  82. Medinas, D.; Marques, J.T.; Mira, A. Assessing road effects on bats: The role of landscape, road features, and bat activity on road-kills. Ecol. Res. 2013, 28, 227–237. [Google Scholar] [CrossRef]
  83. Benda, P.; Ševčík, M.; Horáček, I.; Uvizl, M.; Reiter, A.; Uhrin, M. Bats (Mammalia: Chiroptera) of the Eastern Mediterranean and Middle East. Part 17. New records of bats and their ectoparasites from Tajikistan with a review of these faunas of the country including a description of a new species of horseshoe bat. Acta Soc. Zool. Bohemicae 2024, 88, 1–213. [Google Scholar]
  84. Phelps, K.; Al Abdulasalam, Z.; Al-Hmoud, N.; Ali, S.; Alrwashdeh, M.; Bilgin, R.; Olival, K.J. Distribution of bat species in Western Asia: Occurrence records from the Western Asia Bat Research Network (WAB-Net) project. Biodivers. Data J. 2024, 12, e132199. [Google Scholar] [CrossRef]
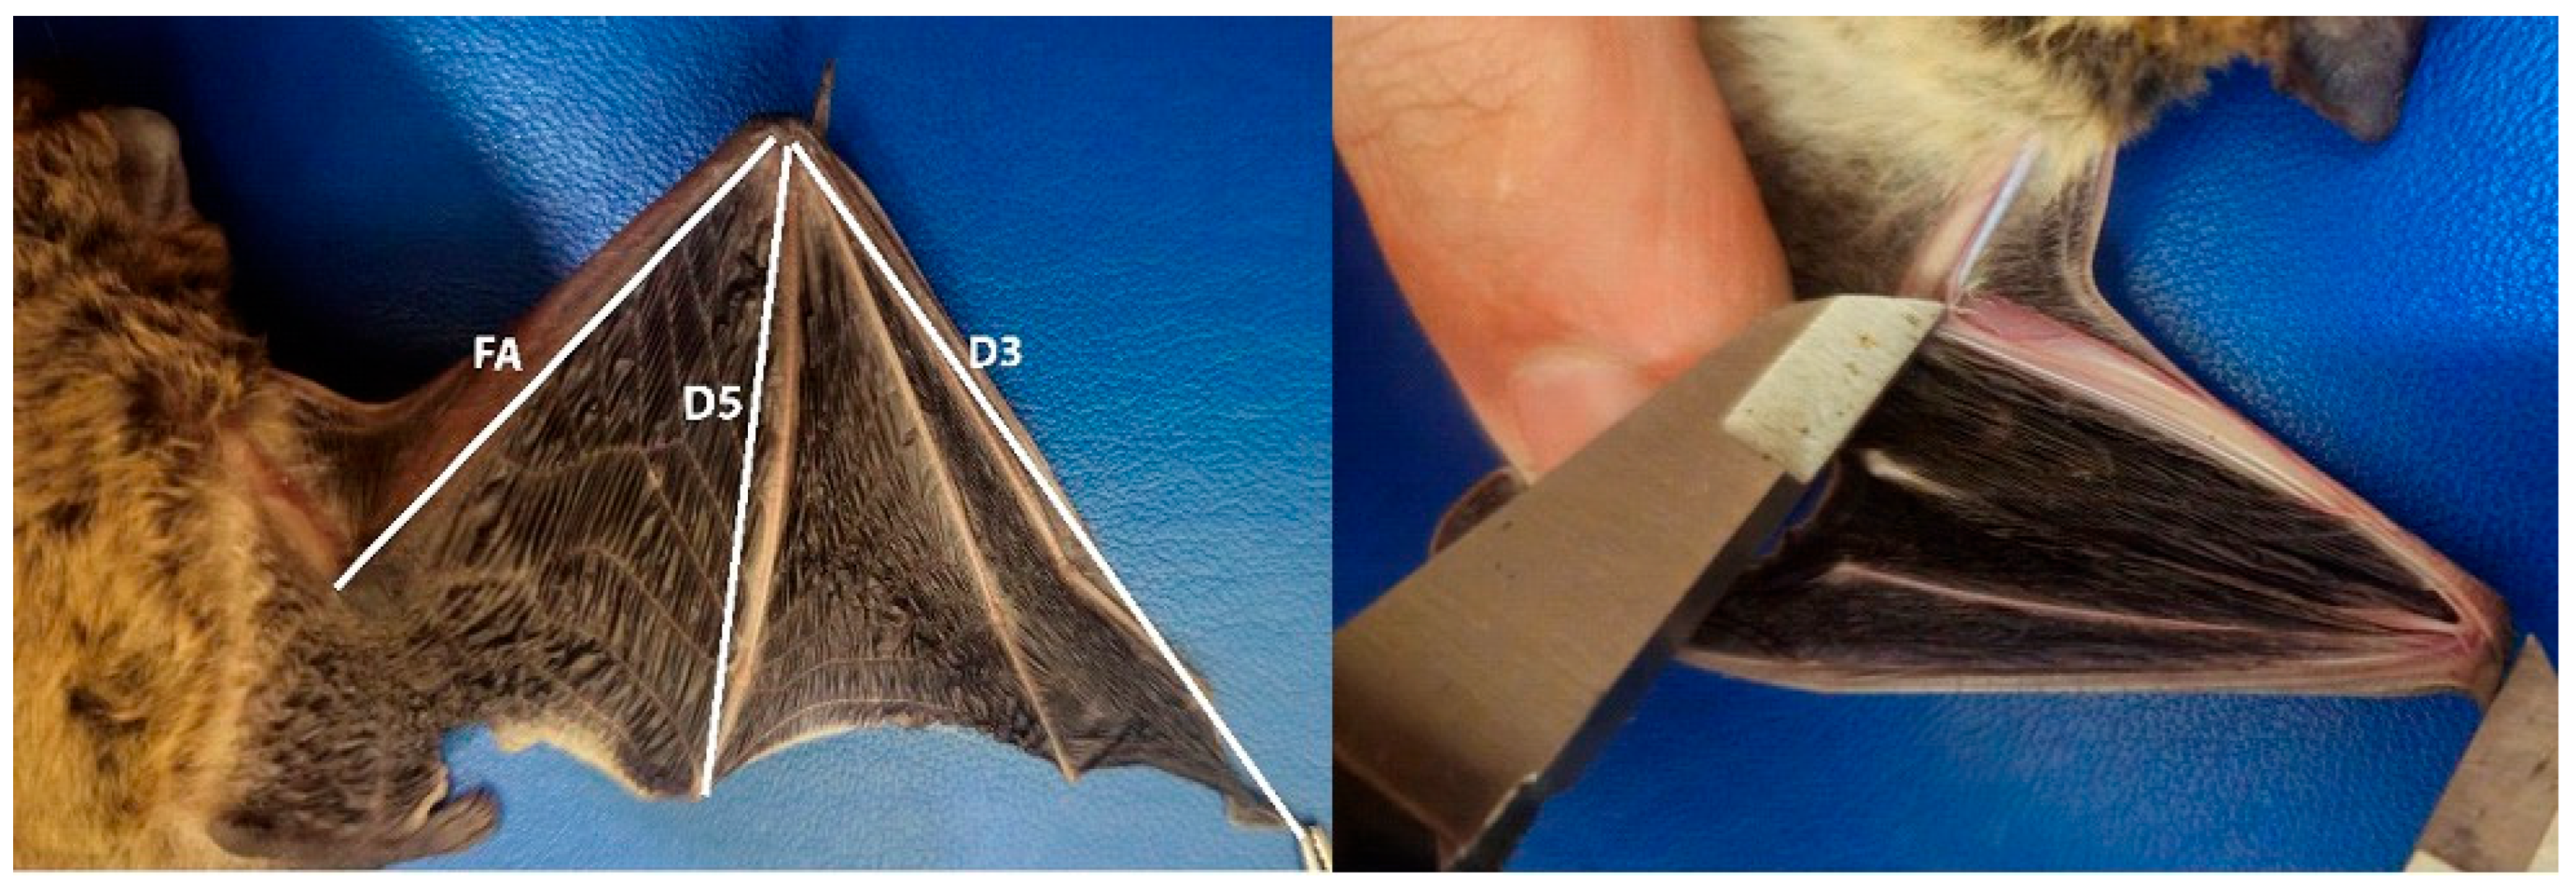
Figure 1. External morphometric measurements were taken from both carcass and live specimens of Pipistrellus species, including forearm length (FA), third digit length (D3), and fifth digit length (D5).
Biology 14 01549 g001
Figure 2. Illustrative diagrams of wing membrane patterns in different Pipistrellus species, based on diagnostic morphological traits described by Dietz and von Helversen [34].
Biology 14 01549 g002
Figure 3. Geographic distribution of sampled Pipistrellus species in Türkiye based on fieldwork conducted between 2019 and 2025. Locality numbers correspond to the specimen information provided in Table S1.
Biology 14 01549 g003
Figure 4. Maximum Likelihood (ML) phylogenetic tree of Pipistrellus pipistrellus based on Cytb sequences. Bootstrap support values (>50%) are shown at the nodes.
Biology 14 01549 g004
Figure 5. Maximum Likelihood (ML) phylogenetic tree of Pipistrellus kuhlii based on Cytb sequences. Bootstrap support values (>50%) are shown at the nodes.
Biology 14 01549 g005
Figure 6. Maximum Likelihood (ML) phylogenetic tree of Pipistrellus nathusii based on Cytb sequences. Bootstrap support values (>50%) are shown at the nodes.
Biology 14 01549 g006
Figure 7. Mismatch distribution curves of Pipistrellus pipistrellus for Group 1 and Group 2, based on Cytb sequences. Observed frequency distributions (solid lines) are compared with the expected distributions under the sudden expansion model (dashed lines).
Biology 14 01549 g007
Figure 8. Mismatch distribution plots for P. kuhlii kuhlii and P. kuhlii lepidus based on Cytb sequences. Red dotted lines represent the observed distributions, and green dashed lines show the expected distributions under the sudden expansion model.
Biology 14 01549 g008
Figure 9. Mismatch distribution for Pipistrellus kuhlii based on all sampled individuals. The observed frequencies (red line) are compared to the expected distribution under a sudden population expansion model (green dashed line).
Biology 14 01549 g009
Figure 10. Mismatch distribution of Pipistrellus nathusii based on Cytb sequences from Turkish populations. The observed distribution of pairwise differences (bars) is compared with the expected distribution under the sudden expansion model (solid line).
Biology 14 01549 g010
Figure 11. Median-joining network of Pipistrellus pipistrellus haplotypes sampled from Türkiye. Each circle represents a distinct haplotype, with circle size proportional to haplotype frequency. Colors correspond to phylogenetic groups inferred from the ML tree: Group 1 (red) and Group 2 (blue). Lines represent mutational steps between haplotypes.
Biology 14 01549 g011
Figure 12. Median-joining network of Pipistrellus kuhlii based on Cytb haplotypes. Each circle represents a distinct haplotype, with circle size proportional to haplotype frequency. Colors indicate phylogenetic assignment: P. k. lepidus (blue) and P. k. kuhlii (red). Lines connecting haplotypes represent mutational steps. Locality codes and haplotype distributions are detailed in Supplementary Table S1.
Biology 14 01549 g012
Figure 13. Median-joining network of Pipistrellus nathusii based on Cytb haplotypes. Each circle represents a distinct haplotype, with circle sizes proportional to haplotype frequency.
Biology 14 01549 g013
Figure 14. Time-calibrated phylogeny of Pipistrellus species based on cytochrome b sequences. Median divergence times (Mya) are shown at major nodes, with 95% highest posterior density (HPD) intervals in parentheses. Node bars represent 95% HPD intervals. Lineages are color-coded: P. pipistrellus (red), P. kuhlii (blue), and P. nathusii (green). Outgroups included Myotis brandtii, M. albescens, M. myotis, and Vespertilio murinus. Fossil-calibrated priors were set following Borges et al. [45].
Biology 14 01549 g014
Disclaimer/Publisher’s Note: The statements, opinions and data contained in all publications are solely those of the individual author(s) and contributor(s) and not of MDPI and/or the editor(s). MDPI and/or the editor(s) disclaim responsibility for any injury to people or property resulting from any ideas, methods, instructions or products referred to in the content.