Simple Summary
A new interspecific backcross ([(Crassostrea hongkongensis ♀ × C. gigas ♂) ♂ × C. hongkongensis ♀]) variety was bred by the South China Sea Institute of Oceanology and named “South China No. 1”. This study aims to explore the effects of stocking density on the growth performance of “South China No. 1”, and compare the growth performance and genetic diversity to that of C. hongkongensis in Beibu Gulf. The results showed that oysters bred under a stocking density of 20 oysters/substrate had better growth manifestation. It was found that the shell height and total weight of “South China No. 1” cultured in Fangchenggang were significantly higher than that of those in Beihai and Qinzhou from September 2018 to November 2018. In addition, the shell height and shell width of “South China No. 1” were significantly higher than that of C. hongkongensis. In the Hardy–Weinberg equilibrium test, for the seven populations and ten microsatellites, in 10 of the 70 groups, the segregation distortion was significant. These results suggest that a stocking density of 20 oysters/substrate can promote the shell height, shell width and total weight of “South China No. 1”. Fangchenggang is a suitable place to cultivate the “South China No. 1” breed according to the total weight and sum of all algal genus abundances.
Abstract
Crassostrea hongkongensis is an economically important bivalve found in various parts of the South China Sea. A new interspecific backcross ([(Crassostrea hongkongensis ♀ × C. gigas ♂) ♂ × C. hongkongensis ♀]) variety was bred by the South China Sea Institute of Oceanology which named “South China No. 1”. This study aims to explore the effects of stocking density on the growth performance of “South China No. 1”, compared their growth performance and genetic diversity to C. hongkongensis, and found the best place breeding site for “South China No. 1” in Beibu Gulf. The results showed that stocking a density of 20 oysters/substrate can significantly increase the shell height, shell width, total weight, survival rate, daily shell height gain and daily body mass gain. It was found that the shell height and total weight of “South China No. 1” cultured in Fangchenggang were significantly higher than that of those in Beihai and Qinzhou from September 2018 to November 2018. Similarly, the shell width of oysters in Fangchenggang and Qinzhou was also significantly higher in September 2018, and the interaction between site and stocking density had significant effects on the shell width in March 2018 and November 2018. In addition, the shell height and shell width of “South China No. 1” were significantly higher than that of C. hongkongensis in all three sites. At all three sites, the phytoplankton community structure was mostly dominated by Bacillariophyta. In the Hardy–Weinberg equilibrium test, for the seven populations and ten microsatellites, in 10 of the 70 groups, the segregation distortion was significant. These results suggest that a stocking density of 20 oysters/substrate can promote the shell height, shell width and total weight of “South China No. 1” in Beibu Gulf, China. “South China No. 1” has better growth performance compared with C. hongkongensis. Fangchenggang is a suitable place to cultivate the “South China No. 1” breed according to the total weight and sum of all algal genus abundances. The results of this study can be used as a reference to further understand the stocking density and genetic diversity of the “South China No. 1” breed in Beibu Gulf, China.
1. Introduction
Oyster is an important mollusk, which is a significant source of nutrients for human [1,2]. The world’s oyster aquaculture production is approximately 6.06 million tons, accounting for 31.4% of the total global mollusk production in 2020 [3]. In 2019, the total production of oyster accounted for 36.31% (5.23 million tons) of total mollusk aquaculture production [4], while Crassostrea hongkongensis accounted for 37.43% (2.0 million tons) of total oyster production in China [5]. The Beibu Gulf is a crucial mollusk aquaculture area, which is located at the northwest of the South China Sea, especially in Qinzhou, Fangchenggang and Zhenzhu bays. [6,7]. Since 2019, the second largest C. hongkongensis aquaculture farm in China is in Qinzhou, accounting for 32.67% of total oyster production, and contributing 5700 million CNY [5].
C. hongkongensis is deemed one of the most important bivalves in the South China Sea. The species formerly collectively known as “C. ariakinsis” was first named as C. hongkongensis in 2004 [8]. In 2006, our team conducted a cross-breeding study on C. hongkongensis by using mixed selection and molecular identification. In 2016, a new variety of [(C. hongkongensis ♀ × C. gigas ♂) ♂ × C. hongkongensis ♀], namely “South China No. 1”, was successfully bred [9]. The parental base group of “South China No. 1” breeding is the backcross generation of (C. hongkongensis ♀ × C. gigas ♂) ♂ and C. hongkongensis ♀, which has a strong growth advantage combination [9]. Total weight and yield of “South China No. 1” was 17.1% and 23.1% higher than that of ordinary C. hongkongensis [9]. Studies have shown that the optimum salinity for the growth of planktic larvae and larvae in “South China No. 1” was 8 to 28, and the optimum salinity was 13 to 23, which expands the existing farming area [10].
Stocking density is one of the elements affecting the growth and survival of oyster [11,12,13,14]. High stocking density leads to a reduction in the growth of oysters in the nursery and grow-out phases [15,16], which may be related to space and food constraints [17]. Bivalves that feed on phytoplankton, zooplankton and suspended solids have a great influence on their survival and growth [18]. Microsatellite markers have the advantages of large quantity, wide distribution and uniformity, high polymorphism information content, co-dominant inheritance, and convenient analysis, and have been extensively applied in the genetic breeding of aquatic animals [19]. There have been many studies on the genetic diversity of artificially selected populations of some economic shellfish, such as C. gigas [20], Crassostrea sikamea [21] and Crassostrea virginica [22]. Information on the genetic diversity of “South China No. 1” is still limited. Therefore, the purpose of this study is to explore the effects of stocking density and location on the grow-out traits of “South China No. 1”. In addition, we also compared the grow-out traits and genetic diversity of “South China No. 1” and C. hongkongensis to better evaluate the growth performance of “South China No. 1”. The results of this study may have certain guiding significance for the breeding and aquaculture of “South China No. 1” in Beibu Gulf, China. It is helpful to further improve and promote the production and development of oyster backcross varieties.
2. Materials and Methods
2.1. Experimental Animals and Study Area
The “South China No. 1” breed was bred through backcross of (Crassostrea hongkongensis ♀ × C. gigas ♂) ♂ and C. hongkongensis ♀. The “South China No. 1” breed and the control group of C. hongkongensis were fertilized at the same time and bred in the Zhanjiang Marine Economic Animal Experiment Station of the South China Sea Institute of Oceanography. After a period of time, they were collected at the same time and transferred to the experimental site. The experimental sites were located in three sea areas along the coast of the Beibu Gulf in China, namely Beihai (21°55′N, 109°46′ E), Qinzhou (21°40′ N, 108°42′ E) and Fangchenggang (21°31′ N, 108°14′ E) (Figure 1). The temperature, salinity and pH were 18–28 °C, 16–18 ppt and 7.6–8.4, respectively. Experiments were conducted from January 2018 to January 2019.
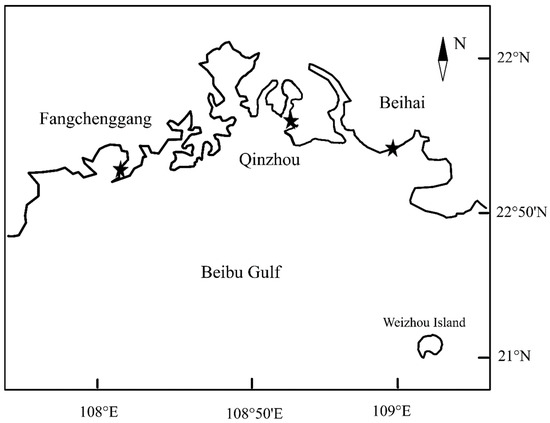
Figure 1.
Location of the experimental grow-out sites in Beibu Gulf, China (* = Beihai, Qinzhou and Fangchenggang).
2.2. Growth Experiment
A total of 540 (“South China No. 1”) and 540 (C. hongkongensis) juvenile oysters were separately kept in 6 lanterns which was a cylindrical structure with a mesh opening of 0.8 cm, had 6 substrates, and was 15 cm high and 30 cm in diameter [23]; each substrate had a density of 20, 30 and 40 oysters/substrate, respectively, and was sent to the experimental breeding site at the same time. Every two mouths, all oysters were counted, weighed and the shell height, shell length and shell width were measured to calculate the daily shell height gain and the daily body mass gain, then continued breeding until the end of the experiment. One extra lantern with the same density as the experimental group was used to replace the dead oysters [24]. The mean initial shell height, shell length, shell width and total weight of “South China No. 1” and C. hongkongensis were 63.90 ± 9.29 mm and 62.73 ± 7.07 mm, 45.86 ± 7.00 mm and 44.89 ± 7.93 mm, 23.13 ± 3.05 mm and 21.04 ± 3.64 mm and 43.11 ± 7.23 g and 43.52 ± 14.41 g, respectively.
2.3. Environmental Parameters of Seawater and Phytoplankton Data
A US YSI portable water quality analyzer (Procomm II) was used to analyze the pH and dissolved oxygen in seawater. Phytoplankton are identified according to the criteria of Muthukumaravel et al. [25]. Every two mouths, 1 L of seawater sample was collected between two breeding lanterns at seawater depth, approximately 90 cm, to inform the three study sea areas, used to authenticate phytoplankton. The collected 1 L water sample was fixed with formaldehyde (CH2O), and after the algae sample was settled for 24 h to 48 h by the algae settler, the 1 mL sample was transferred to the phytoplankton counting chamber (0.1 mL, 20 mm × 20 mm), and the algae was identified as a genus. Follow-up observations were made under the Nikon Research Inverted Light microscope (C-W15x).
2.4. The Genetic Diversity of 7 Cultured Populations
Over the 360-day experiment, two oysters were randomly collected from each substrate at three sites. In addition, an equal number of C. gigas were randomly collected from Qingdao in July 2019, and its shell height, shell length, shell width and total weight were 103.38 ± 11.43 cm, 55.66 ± 6.47 cm, 34.04 ± 4.69 cm and 90.27 ± 17.73 g, respectively. For the genetic diversity experiment, the adductor muscle tissue of oysters was extracted, immersed in absolute ethanol, and then stored at −80 °C.
2.5. DNA Isolation and PCR Extension
The total DNA extraction method was described by Zhang et al. [26]. NanoDrop (Thermo Fisher Scientific, Sunnyvale, CA, USA) was used to detect the purity and concentration of DNA. Agarose gel (1.2%) (Trans Gen, Beijing, China) was used to confirm the integrity of DNA. Primers were cited from Xiao et al. [27] and Ma et al. [28]. All the primers in Table 1 were synthesized by Shanghai Sangon Biotech Co. Ltd. (Shanghai, China). The total reaction volume was 10 μL, containing 1 µL DNA, 1 μL forward primer (10 μM) and 1 μL reverse primer (10 μM), 2 µL ddH2O, and 5 µL Taq Mix (Trans Gen, Beijing, China). The PCR cycle program was: 1 cycle at 95 °C for 3 min, then 35 cycles at 95 °C for 45 s, 56 °C for 45 s, 72 °C for 45 s, and then 1 cycle at 72 °C for 5 min. Non-denaturing polyacrylamide gel (8%) was used for electrophoresis detection of the product of the PCR extension, compared with the 10 bp DNA ladder. After silver nitrate staining, the results were screened with a gel scanner (Bio-Rad, Hercules, CA, USA).

Table 1.
Information of ten pairs of microsatellite primers.
2.6. Statistical Analysis
Normality and mean-square error assumptions were confirmed before any statistical analysis. A two-factor Analysis of Variance (ANOVA) was utilized to establish the effects of location, stocking density and their interaction on growth, total weight, survival rate, daily shell height gain and daily body mass gain. Logarithmic transformation was performed on growth data before analysis, arcsine transformation was performed on incremental survival rate data before analysis, and bidirectional statistical significance was evaluated [29]. One-way Analysis of Variance fand Duncan’s multiple comparison test was used to compare growth parameters of the two breeds with different stocking densities. In addition, a subsequent trend analysis was performed using orthogonal polynomial contrasts to determine whether the significant effects were linear and/or quadratic. The main effect and interaction of two factors (stocking density and breed) were analyzed by two-factor Analysis of Variance. Data were expressed as the mean ± standard deviation. p < 0.05 was considered statistically significant. All analyses were performed using SPSS Statistics 26.0 (SPSS, Michigan Avenue, Chicago, IL, USA).
Species with a degree of dominance in the microalgae community greater than 0.2 are defined as dominant species.
Dominance [30]
Y represents dominance, N represents the total cell abundance of the community, ni represents the cell abundance of No. i species in the community, and fi represents the frequency of the No. i species occurring at each station in the community.
Electrophoretic band analysis was performed using Quantity One, and the size of bands was estimated after manual calibration. The number of alleles (NA), observed heterozygosity (HO) and expected heterozygosity (HE) were calculated by Popgen 32.0. The polymorphism information content was calculated by Cervus 3.0. The polymorphic information content was calculated by Gervus, and Hardy–Weinberg’s equilibrium was calculated for every locus population by Genepop though the allele frequency. According to the genetic distance between populations, a clustering relational tree was determined for every aquaculture populations by MEGA 7.0.
3. Result
3.1. Effect of Stocking Density and Site on the Growth of “South China No. 1”
Overall, from March 2018 to November 2018, the shell height, shell width and total weight of “South China No. 1” increased continuously at all three sites and three stocking densities (Table 2). Site and stocking density had a significant impact on shell height, shell width and total weight from March 2018 to November 2018 (p < 0.05). The total weight was 72.47 g, 73.02 g and 81.88 g at Beihai, 66.42 g, 79.64 g and 94.28 g at Qinzhou, and 69.13 g, 89.41 g and 98.41 g at Fangchenggang in July 2018, September 2018 and November 2018, and had the highest value at Fangchenggang from September 2018 to November 2018 (p < 0.05). In September 2018 and November 2018, the shell height and shell width of “South China No. 1” and farmed in Fangchenggang were significantly higher than that of those farmed in Beihai and Qinzhou (p < 0.05). With the increase in stocking density, the shell height, shell width and total weight of oysters decreased significantly (p < 0.05). At all stations, the highest shell height, shell width and total weight of oysters were recorded when stocking density was 20 oysters/substrate (p < 0.05). The interaction between site and stocking density had significant effects on shell width in March 2018 and November 2018 (p < 0.05).
Table 2.
Effects of site, stocking density and their interaction on shell height, shell width, total weight, survival rate, daily shell height gain and daily body mass gain of oyster “South China No. 1” from March 2018 to November 2018.
In March 2018 to May 2018, there was a significant difference in the survival rate (SR) of oysters at all three sites, with oysters farmed in Fangchenggang having the highest SR (p < 0.05). The stocking density significantly affected SR and daily body mass gain (DMG) (p < 0.05), but did not affect the daily shell height gain (DHG) in September 2018 (p > 0.05). There was no significant difference in the site and stocking density of DHG (p > 0.05), except for in March 2018 (p < 0.05). In March 2018, May 2018, and September 2018, the DMG of oysters with a stocking density of 20 oysters/substrate was higher than that of those with a stocking density of 40 oysters/substrate (p < 0.05). However, the interaction between site and stocking density has no significant impact on SR, DMG and DHG (p > 0.05) (Table 2).
3.2. Effect of Stocking Density on the Growth of Oyster “South China No. 1” and C. hongkongensis Conducted for 360 Days
In Beihai and Qinzhou, the shell height, shell length, shell width and total weight of “South China No. 1” with a stocking density of 20 oysters/substrate was significantly higher than that of those with other stocking densities (Table 3 and Table 4) (p < 0.05). At all three sites, compared to C. hongkongensis, “South China No. 1” showed significantly higher shell height, shell length, shell width and total weight (Table 3, Table 4 and Table 5) (p < 0.05). In Beihai, the interaction between breed and stocking density has significant effects on shell height (Table 3). In Qinzhou, the interaction between breed and stocking density has significant effects on shell width (Table 4). In Fangchenggang, the interaction between breed and stocking density has significant effects on total weight (Table 5) (p < 0.05).
Table 3.
Effect of stocking density on growth traits of oyster “South China No. 1” and C. hongkongensis conducted for 360 days in Beihai.
Table 4.
Effect of stocking density on growth traits of oyster “South China No. 1” and C. hongkongensis conducted for 360 days in Qinzhou.
Table 5.
Effect of stocking density on growth traits of oyster “South China No. 1” and C. hongkongensis conducted for 360 days in Fangchenggang.
3.3. Seawater Quality and Plankton at Three Sites
The environmental factors of the seawater temperature, salinity, pH and dissolved oxygen were shown in Figure 2. No significant differences in environment factors including temperature, salinity, pH and dissolved oxygen at three sites were found. Seawater temperatures ranged from 14 °C to 31 °C at Beihai, from 15 °C to 30 °C at Qinzhou and from 15 °C to 32 °C at Fangchenggang. Seawater salinity ranged from 16 ppt to 24 ppt at Beihai, from 16 ppt to 26 ppt at Qinzhou and from 14 ppt to 27 ppt at Fangchenggang. pH ranged from 7.62 to 8.4 at Beihai, from 7.84 to 8.44 at Qinzhou and from 7.82 to 8.3 at Fangchenggang. However, from September 2018 to November 2018, seawater salinity in different locations varied greatly, with the salinity of the sea water in Beihai ranging from 16.5 to 18 ppt, salinity of the sea water in Qinzhou ranging from 16.5 to 22.4 ppt, and the salinity of the sea water in Fangchenggang ranging from 24 to 26.7 ppt.
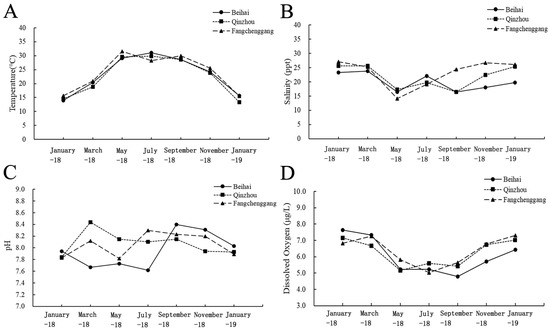
Figure 2.
The variations in (A) temperature, (B) salinity, (C) pH and (D) dissolved oxygen at the Beihai, Qinzhou and Fangchenggang sites from January 2018 to January 2019.
As shown in Table 6, Skeletonema was the most abundant algal species, the only dominant species, which the abundance was 4193 cells·L−1, 4589 cells·L−1 and 6343 cells·L−1 in Beihai, Qinzhou and Fangchenggang, respectively. In Beihai, Qinzhou and Fangchenggang, the sum of all algal genus abundances was 5928 cells·L−1, 6466 cells·L−1 and 9118 cells·L−1, respectively. Skeletonema, Pleurosigma and Navicula had the highest frequency at all three sites. The lowest algal abundance was recorded in Triceratium in Beihai and Fangchenggang, and in Synedra in Qinzhou. Skeletonema, Pleurosigma, Eucampia, Navicula, Ditylum, Chaetoceros, Rhizosolenia, Thalassionema, Coscinodiscus, Synedra, Nitzschia, Bacillaria, Licmophora, Thalassiosira and Lauderia were found at all three sites. Triceratium was found in Beihai and Fangchenggang. Cerataulina was found in Beihai and Qinzhou. Biddulphia and Odontella were found in Qinzhou and Fangchenggang.
Table 6.
Dominant phytoplankton in Beihai, Qinzhou and Fangchenggang.
3.4. The Genetic Diversity of Seven Cultured Populations
As shown in Table 7, the average allele number for 10 pairs of microsatellite primers in 7 oyster cultured population ranged from 4.9 to 5.7. The average number of effective allele, average observed heterozygosity and expected heterozygosity ranged from 2.29 to 3.03, 0.61 to 0.83 and 0.54 to 0.67, respectively. C. hongkongensis from Beihai was first clustered with C. hongkongensis from Fangchenggang, and then with C. hongkongensis from Qinzhou. The “South China No. 1” breed from Beihai was first clustered with “South China No. 1” from Qinzhou, and then clustered with “South China No. 1” from Fangchenggang, while the C. gigas from Qingdao belonged to the outermost branch (Figure 3).
Table 7.
Genetic diversity parameters of seven oyster populations.
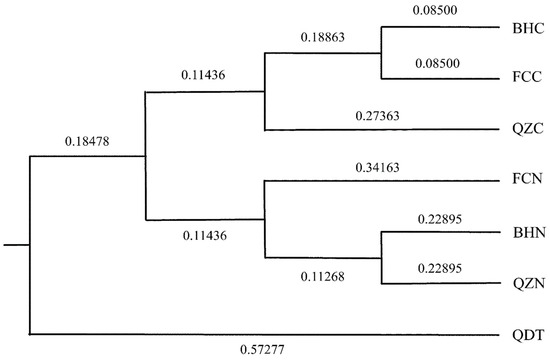
Figure 3.
The UPGMA cluster analysis chart of seven oyster cultured populations based on Nei’s genetic unbiased genetic distance.
4. Discussion
Stocking density has a significant effect on the growth traits and survival rate of bivalves. Our study found that the shell height, shell width and total weight of “South China No. 1” were significantly affected by stocking density, and the best stocking density was 20 oysters/substrate. The highest shell length and total weight were obtained when “South China No. 1” and Crassostrea hongkongensis were bred in a stocking density of 20 oysters/substrate at Beihai and Qinzhou. It has been reported that C. gigas and C. angulata at 20 oysters/basket generally outperformed those at 30 and 40 oysters/basket, which has comparability to the results of our research [12]. A report showed that the growth of C. gigas cultivated at a stocking density of 50 larvae mL−1 was significantly higher than that of those cultivated at stocking densities of 75 and 100 larvae mL−1 [11]. Previous studies have also reported that a low stocking density has better growth traits for abalone [31], Chinese tiger frog (Hoplobatrachus rugulosa) [32] and sea cucumber (Apostichopus japonicus) [33]. Similarly, as the stocking density increases, the growth traits of aquatic animals, such as fish [34] and shrimp [35], also decrease. The factors that affect the growth of organisms in high-density environments may be competition for food and space [15,36,37]. In this study, in May 2018 and September 2018, the survival rate of “South China No. 1” cultivated at 20 oysters/substrate was significantly higher than that at 30 and 40 oysters/substrate. Oliveira et al. [24] found that compared to at a higher stocking density, the survival rates of post-larvae at lower densities were significantly higher. Yang et al. [38] revealed that stocking density significantly affects growth and survival of dwarf surfclam (Mulinia lateralis) larvae. The superior stocking density of D-shaped larvae, umbo larvae and pediveliger larvae was ≤9 larvae mL−1, ≤7 larvae mL−1 and ≤5 larvae mL−1, respectively. These observations support our results that survival is connected with the stocking density of “South China No. 1”. Within a certain density range, mortality is not affected by stocking density; when the density exceeds the threshold, mortality rate will increase [37,39].
As one of the genetic improvement methods in breeding, interspecific backcross plays an important role in improving the performance of economically important strains [40,41,42]. In the present study, we found that breed has a great influence on growth, in which the shell height and shell width of “South China No. 1” at all three sites were significantly higher than that of the common C. hongkongensis. Moreover, the differences were more obvious when oysters were bred in Fangchenggang. The shell height, shell length, shell width and total weight of “South China No. 1” were higher than that of those of C. hongkongensis, indicating that the backcross varieties had certain growth advantages. Zhang et al. [41] demonstrated that artificial interspecific mating between C. hongkongensis♀ × C. gigas♂ fertile hybrids and their parents could successfully produce backcross offspring with a high fertilization level, a fast growth rate and a high survival rate. Research has shown that backcross populations between the hybrid Haliotis discus hannai ♀ × H. fulgens ♂ and the parent species had significant advantages in growth and survival [43]. Shi et al. [44] found that there were differences in the growth of backcrossed populations between the C. angulata ♀ × C. gigas ♂ hybrids and their parents. Similar observations have been documented in fish [38,42,45]. For example, Lago et al. [45] found that the development of genetic strains of red tilapia could make use of genetic breeding programs, mainly to explore paternal heterosis to produce fish. Researchers utilized artificial insemination technology to generate a backcross variety (BC) [Megalobrama amblycephala (MA) ♀ × (Megalobrama amblycephala ♀ × Culter alburnus (CA) ♂) ♂], which has superior growth advantage and digestive enzyme activity than that of its parents [42]. The study on backcross grouper showed that its growth rate was better than of its female parent; the growth difference increased with age [38]. These observations support our results that the backcross offspring have stronger growth advantages than the parents.
Environmental factors, especially salinity, have a significant impact on aquatic animals [46]. Bivalves are filter-feeders and thereby remove the associated nutrient particles from the water column, so their growth performance and feeding depend on environmental factors, like salinity [47]. Our study found that in September 2018 to November 2018, seawater salinity was more stable and higher in Fangchenggang compared with in Beihai and Qinzhou. Furthermore, in September to November 2018, the growth indicators of the shell height, shell width and total weight of “South China No. 1” in Fangchenggang were significantly higher than that of those in Beihai. The research of salinity on early development and growth “South China No. 1” showed that suitable salinity for the larvae and spat of “South China No. 1” ranged from 13 to 23 [10]. The salinity of “South China No. 1” in different growth stages varies, and when fattening, it should be transferred to a high salt environment of 20 to 25 ppt [9]. When oysters are in the juvenile stage, their resistance to hypersaline environment is low [48]. As the oyster grows, it becomes more resistant to high salt levels [48]. Peng et al. [49] found that the shell length and weight gain rate of Sinonovacula constricta were significantly lower when it was bred in the low-salinity environment during the first month of the experiment. Similarly, Pecten maximus at 20 ppt had a significantly higher mortality than that of those at 25 and 30 ppt [50]. Liu et al. [51] investigated the influences of five different salinities (20, 25, 30, 35 and 40 ppt) on growth, tissue damage, enzymes and body composition of Babylonia areolata after salinity adaptation for seven weeks. They found that when juvenile ivory shells were bred in 35 and 40 ppt, growth and survival will be inhibited. The fluctuation in salinity affects the osmolality of aquatic animals, resulting in physiological and metabolic changes, tissue damage, and irregular growth [52]. Therefore, stable salinity could provide a better growing environment for bivalves, and this maybe the reason that “South China No. 1” had better growth performance in Fangchenggang in September 2018 to November 2018.
As we know, low salinity could affect the growth, reproduction and photosynthesis of some algae [53,54]. Bivalves feed on many algae, such as phytoplankton, resuspended benthic microalgae and detritus [47]. Phytoplankton are a food source for bivalves and help to maintain the primary productivity of fisheries [55]. To a extent, mariculture animal’s yield and quality determine that of phytoplankton [56]. The phytoplankton community structure investigated in our study was dominated by diatomata, which is basically consistent with the phytoplankton community structure reported in previous studies [47,57,58]. Bacillariophyta is the preferred food of many herbivores and is less toxic, so it is considered better for the marine ecosystem. [30]. The high biomass of diatoms was related to the bloom of Skeletonema. It has been reported that Skeletonema prevails in warmer climates [59]. Temperature has an important effect on the variation in Bacillariophyta [58]. In Fangchenggang, the abundance of the phytoplankton community was higher than in Beihai and Qinzhou, providing more food for oysters. Maybe this is one of the reasons why “South China No. 1” had better growth performance in Fangchenggang.
Allelic genetic diversity and heterozygosity can be used as indicators of population genetic structure variation [60]. Compared with the average observed heterozygosity and expected heterozygosity of the seven populations, the heterozygosity of the selected population was slightly increased. The mean effective allele number (NE) and mean expected heterozygosity (HE) of “South China No. 1” in the three cultured sea sites were slightly lower than that of C. hongkongensis in the same sea site, indicating a decrease in the genetic diversity of the selected population during the continuous artificial breeding process. In this study, we found that “South China No. 1” had a distant relationship with C. gigas of Qingdao, and a closer genetic relationship with C. hongkongensis. This may be attributed to the selection of primers from the developed C. hongkongensis microsatellite primers. In addition, due to a small number of parents unintentionally selecting the best offspring, the selection of successive generations accelerates the homogenization of germplasm resources [61], and also leads to a reduction in population genetic diversity. At present, in many aquatic economic animals, such as Lates calcarifer [62], silver-lipped pearl oysters (Pinctada maxima) [63] and rock oyster (Saccostrea glomerata) [64], a certain degree of genetic diversity reduction has been observed during artificial selection. The results of this study showed that after Bonferroni correction, bias separation occurred in all seven populations. The 10 sites, except Ch423, Ch697, Ch307 and Ch411, did not deviate from the Hardy–Weinberg equilibrium for seven populations, and bias separation occurred in the other six sites. This may be because the invalid alleles cause changes in the gene frequency, which further leads to the Hardy–Weinberg imbalance, similar to the results of the study of Reece et al. [65], which found that many shellfish have invalid alleles.
5. Conclusions
In summary, stocking density is a vital element affecting growth performance, in which lower stocking density (20 oysters/substrate) significantly increased the shell height, shell width, total weight, survival rate, daily shell height gain and daily body mass gain of “South China No. 1” in Beibu Gulf, China. In Beihai, Qinzhou and Fangchenggang, the shell height and shell width of “South China No. 1” were higher than that of Crassostrea hongkongensis, indicating that “South China No. 1” had better growth performance. The main algal genus in Beibu Gulf, China was Bacillariophyta. In Beihai, Qinzhou and Fangchenggang, the sum of all algal genus abundances was 5928 cells·L−1, 6466 cells·L−1 and 9118 cells·L−1, respectively. The “South China No. 1” breed is closely related to C. hongkongensis, and has high genetic variability. Based on the total weight and sum of all algal genus abundances, the better place for culture “South China No. 1” is Fangchenggang.
Author Contributions
Conceived and designed the experiments: Y.Z., Z.Y. and Y.P. Performed the experiments: Z.W., Y.Q., Y.Z. and Y.P. Collected and analyzed the data: Z.W., Y.Q., Q.X., H.L., Y.Z. and Y.P. Wrote this paper: Z.W., Y.Q., and Y.Z. Revised paper: Z.Y., Y.Z. and Y.P. All authors have read and agreed to the published version of the manuscript.
Funding
The National Science Foundation of China (32260914); the Key Research and Development Program of Guangxi (AB16380154); the National Key Research and Development Program of China (2018YFD0901400); the National Key Research and Development Program of China (2022YFD2400305; 2021YFC3100504; 2022YFC3103403; 2022YFC3102002); the Guangdong Basic and Applied Basic Research Foundation (2022A1515010203; 2021A1515011181; 2023A1515010944); the Guangdong Provincial Key Research and Development Program (2021B0202020003); the Guangzhou Science and Technology Project (202206010133); the National Science Foundation of China (32002387); the Project of Sanya Yazhou Bay Science and Technology City; Science and Technology Project of Guangdong Provincial Department of Natural Resources (GDNRC[2022]40); the Open Foundation of the State Key Laboratory of Loess and Quaternary Geology (SKLLQG2213); the National Marine Genetic Resource Center; the earmarked fund for CARS-49; and the Science and Technology Planning Project of Guangdong Province, China (2020B1212060058).
Institutional Review Board Statement
The animals in this study were approved by the Animal Care and Use Committee of Guangxi University (Guangxi, China).
Informed Consent Statement
The authors declare no conflict of interest.
Data Availability Statement
Data will be made available on request.
Conflicts of Interest
The authors declare no conflict of interest.
References
- Loaiza, I.; Wong, C.; Thiyagarajan, V. Comparative analysis of nutritional quality of edible oysters cultivated in Hong Kong. J. Food Compos. Anal. 2023, 118, 105159. [Google Scholar] [CrossRef]
- Tan, K.; Zheng, H. Endogenous lc-pufa biosynthesis capability in commercially important mollusks. Crit. Rev. Food Sci. Nutr. 2022, 62, 2836–2844. [Google Scholar] [CrossRef]
- FAO. The State of World Fisheries and Aquaculture; FAO: Rome, Italy, 2022. [Google Scholar]
- Fishery Bureau, Ministry of Agriculture. China Fishery Statistical Yearbook; China Agriculture Press: Beijing, China, 2021. [Google Scholar]
- Peng, D.M.; Zhang, S.C.; Zhang, H.Z.; Pang, D.Z.; Yang, Q.; Jiang, R.H.; Lin, Y.T.; Mu, Y.T.; Zhu, Y.G. The oyster fishery in China: Trend, concerns and solutions. Mar. Policy 2021, 129, 104524. [Google Scholar] [CrossRef]
- Ji, Y.; Yan, G.W.; Wang, G.X.; Liu, J.W.; Tang, Z.X.; Yan, Y.J.; Qiu, J.B.; Zhang, L.; Pan, W.Y.; Fu, Y.L.; et al. Prevalence and distribution of domoic acid and cyclic imines in bivalve mollusks from beibu gulf, China. J. Hazard. Mater. 2022, 423, 127078. [Google Scholar] [CrossRef]
- Xu, Y.; Zhang, T.; Zhou, J. Historical occurrence of algal blooms in the northern Beibu gulf of China and implications for future trends. Front. Microbiol. 2019, 10, 451. [Google Scholar] [CrossRef]
- Wang, H.Y.; Guo, X.M.; Zhang, G.F.; Zhang, F.S. Classification of jinjiang oysters Crassostrea rivularis (gould, 1861) from China, based on morphology and phylogenetic analysis. Aquaculture 2004, 242, 137–155. [Google Scholar] [CrossRef]
- Yu, Z.N.; Zhang, Y.H.; Zhang, Y.; Wang, Z.P.; Xiao, S.; Li, J.; Xiang, Z.M.; Ma, H.T. New aquaculture oyster “South China no. 1”. China Fish. 2017, 2, 86–89. [Google Scholar]
- Zhao, N.Q.; Shu, X.; Liu, X.; Pan, Y.; Zhang, Y.H.; Yu, Z.N. Effect of salinity on early development and growth oyster “South China No. 1”. Period. Ocean. Univ. China 2020, 50, 53–64. [Google Scholar]
- De Oliveira, R.C.; Da Silva, F.C.; Araujo de Miranda Gomes, C.H.; Langdon, C.; Takano, P.; Gray, M.W.; de Melo, C.M.R. Effect of larval density on growth and survival of the pacific oyster Crassostrea gigas in a recirculation aquaculture system. Aquaculture 2021, 540, 736667. [Google Scholar]
- Tan, K.; Deng, L.H.; Zheng, H.P. Effects of stocking density on the aquaculture performance of diploid and triploid, Pacific oyster Crassostrea gigas and Portuguese oyster C. angulata in warm water aquaculture. Aquac. Res. 2021, 52, 6268–6279. [Google Scholar] [CrossRef]
- Treviño, L.; Vélez-Falcones, J.; Lodeiros, C. Effects of stocking density in the grow-out culture of winged pearl oyster Pteria sterna (gould, 1851). Aquac. Res. 2019, 50, 964–967. [Google Scholar] [CrossRef]
- Zorita, I.; Juez, A.; Solaun, O.; Muxika, I.; Rodríguez, J.G. Stocking density effect on the growth and mortality of juvenile European flat oyster (Ostrea edulis linnaeus, 1758). Aquac. Fish Fish. 2021, 1, 60–65. [Google Scholar] [CrossRef]
- Tan, K.; Zhai, Y.T.; Zhang, H.K.; Zeng, Z.N.; Ning, Y.; Zheng, H.P. Effects of culture conditions (stocking density, water depth and aquaculture gear) on the aquaculture performance of a new Crassostrea angulata variety “golden oyster#1”. Aquaculture 2023, 564, 739054. [Google Scholar]
- Wassnig, M.; Southgate, P.C. The effects of stocking density and ration on survival and growth of winged pearl oyster (Pteria penguin) larvae fed commercially available micro-algae concentrates. Aquac. Rep. 2016, 4, 17–21. [Google Scholar] [CrossRef]
- Liu, H.X.; Ye, T.; Soon, T.K.; Zhang, H.K.; Cheng, D.W.; Li, S.K.; Ma, H.Y.; Zheng, H.P. Effects of stocking density on the growth performance, bacterial load and antioxidant response systems of noble scallop Chlamys nobilis. Fish Shellfish. Immunol. 2019, 92, 40–44. [Google Scholar] [CrossRef]
- Rusydi, I.; Dewiyanti, I.; Maisuri, M.; Putra, D.F.; Octavina, C.; Nurfadillah, N.; Wulandari, W. Growth of oyster (Crassostrea sp.) With different stocking density in Alue Naga waters, Banda Aceh Indonesia. IOP Conf. Ser. Earth Environ. Sci. 2021, 674, 12082. [Google Scholar] [CrossRef]
- Ma, H.; Yu, D.; Li, J.; Qin, Y.; Zhang, Y.; Yu, Z. Construction of first genetic linkage map based on microsatellite markers and characterization of di- and tri-nucleotide microsatellite markers for Crassostrea hongkongesis. Aquaculture 2022, 556, 738272. [Google Scholar] [CrossRef]
- Xu, L.; Li, Q.; Xu, C.X.; Yu, H.; Kong, L.F. Genetic diversity and effective population size in successive mass selected generations of black shell strain pacific oyster (Crassostrea gigas) based on microsatellites and mtDNA data. Aquaculture 2019, 500, 338–346. [Google Scholar] [CrossRef]
- Ma, H.; Yu, D.; Qin, Y.; Li, J.; Zhang, Y.; Yu, Z. Growth-related phenotypic and genetic diversity analysis of successive mass selected generations of kumamoto oyster (Crassostrea sikamea). Aquac. Rep. 2023, 30, 101621. [Google Scholar] [CrossRef]
- Proestou, D.A.; Vinyard, B.T.; Corbett, R.J.; Piesz, J.; Allen, S.K.; Small, J.M.; Li, C.; Liu, M.; DeBrosse, G.; Guo, X.; et al. Performance of selectively-bred lines of eastern oyster, Crassostrea virginica, across eastern us estuaries. Aquaculture 2016, 464, 17–27. [Google Scholar] [CrossRef]
- De Oliveira Cardoso, J.L.; Lavander, H.D.; Neto, S.R.D.S.; de Souza, A.B.; Silva, L.O.B.D.; Gálvez, A.O. Crescimento da ostra crassostrea rhizophorae cultivada em diferentes densidades de estocagem no litoral norte de pernambuco. Pesqui. Agropecu. Pernambucana 2012, 17, 10–14. [Google Scholar]
- De Oliveira, I.B.; Lavander, H.D.; Lima, P.; Oliveira, C.Y.B.; De Dantas, D.M.; Olivera Gálvez, A. Effect of stocking density on the growth and survival of anomalocardia brasiliana (gmelin, 1791) (bivalvia: Veneridae) post-larvae. Ciênc. Rural 2019, 49, 1–7. [Google Scholar] [CrossRef]
- Muthukumaravel, K.; Pradhoshini, K.P.; Vasanthi, N.; Raja, T.; Jaleel, M.A.; Arunachalam, K.D.; Musthafa, M.S.; Ayyamperumal, R.; Karuppannan, S.; Rajagopal, R.; et al. Assessment of seasonal variation in distribution and abundance of plankton and ichthyofaunal diversity in relation to environmental indices of karankadu mangrove, south east coast of india. Mar. Pollut. Bull. 2021, 173, 113142. [Google Scholar] [CrossRef]
- Zhang, J.; Ma, W.G.; Song, X.M.; Lin, Q.H.; Gui, J.F.; Mei, J. Characterization and development of est-ssr markers derived from transcriptome of yellow catfish. Molecules 2014, 19, 16402–16415. [Google Scholar] [CrossRef] [PubMed]
- Xiao, S.; Ma, H.T.; Yu, Z.N. Development of 20 novel microsatellite markers in the Hong Kong oyster, Crassostrea hongkongensis. Conserv. Genet. Resour. 2011, 3, 413–415. [Google Scholar] [CrossRef]
- Ma, H.; Li, L.; Xiao, S.; Zhang, Y.; Yu, Z. Microsatellite-based study of population genetics of Crassostrea hongkongensis in southern China. Aquac. Rep. 2021, 19, 100591. [Google Scholar] [CrossRef]
- Qin, Y.; Zhang, Y.; Mo, R.; Zhang, Y.; Li, J.; Zhou, Y.; Ma, H.; Xiao, S.; Yu, Z. Influence of ploidy and environment on grow-out traits of diploid and triploid Hong Kong oysters Crassostrea hongkongensis in southern China. Aquaculture 2019, 507, 108–118. [Google Scholar] [CrossRef]
- Peng, C.; Wang, K.; Wang, W.; Kuang, F.; Gao, Y.; Jiang, R.; Sun, X.; Dong, X.; Chen, B.; Lin, H. Phytoplankton community structure and environmental factors during the outbreak of crown-of-thorns starfish in xisha islands, south China sea. Environ. Res. 2023, 235, 116568. [Google Scholar] [CrossRef] [PubMed]
- Pang, G.W.; Gao, X.L.; Hong, J.W.; Luo, X.; Wu, Y.S.; You, W.W.; Ke, C.H. Growing abalone on a novel offshore platform: An on-site test of the effects of stocking density and diet. Aquaculture 2022, 549, 737769. [Google Scholar] [CrossRef]
- Ding, G.H.; Lin, Z.H.; Fan, X.L.; Ji, X. The combined effects of food supply and larval density on survival, growth and metamorphosis of Chinese tiger frog (Hoplobatrachus rugulosa) tadpoles. Aquaculture 2015, 435, 398–402. [Google Scholar] [CrossRef]
- Xia, B.; Ren, Y.C.; Wang, J.Y.; Sun, Y.Z.; Zhang, Z.D. Effects of feeding frequency and density on growth, energy budget and physiological performance of sea cucumber Apostichopus japonicus (Selenka). Aquaculture 2017, 466, 26–32. [Google Scholar] [CrossRef]
- Neto, A.C.; de Alvarenga, É.R.; Toral, F.L.B.; Leite, N.R.; Da Costa, F.F.B.; Goulart, L.Q.; Correa, R.D.S.; Da Silva, M.A.; Dos Santos, B.D.; Fernandes, A.F.A.; et al. Impact of selection for growth and stocking density on Nile tilapia production in the biofloc system. Aquaculture 2023, 577, 739908. [Google Scholar] [CrossRef]
- Yuan, H.; Xie, M.H.; Hu, N.J.; Zheng, Y.D.; Hou, C.H.; Tan, B.P.; Shi, L.L.; Zhang, S. Growth, immunity and transcriptome response to different stocking densities in Litopenaeus vannamei. Fish Shellfish. Immunol. 2023, 139, 108924. [Google Scholar] [CrossRef]
- DiMaggio, M.A.; Ohs, C.L.; Broach, J.S.; Sink, T.D. Effects of stocking density on growth, survival, and stress physiology of pigfish. N. Am. J. Aquac. 2014, 76, 201–210. [Google Scholar] [CrossRef]
- Gao, X.L.; Zhang, M.; Li, X.; Fucu, W.; Song, C.B.; Liu, Y. Effects of stocking density on survival, growth, and food intake of Haliotis discus hannai Ino in recirculating aquaculture systems. Aquaculture 2018, 482, 221–230. [Google Scholar]
- Yang, Y.; Wang, T.; Chen, J.; Wu, X.; Wu, L.; Zhang, W.; Luo, J.; Xia, J.; Meng, Z.; Liu, X. First construction of interspecific backcross grouper and genome-wide identification of their genetic variants associated with early growth. Aquaculture 2021, 545, 737221. [Google Scholar] [CrossRef]
- Jia, R.; Liu, B.L.; Feng, W.R.; Han, C.; Huang, B.; Lei, J.L. Stress and immune responses in skin of turbot (Scophthalmus maximus) under different stocking densities. Fish Shellfish. Immunol. 2016, 55, 131–139. [Google Scholar] [CrossRef]
- Xiao, Q.; Gan, Y.; Yu, F.; Boamah, G.A.; Shen, Y.; Wang, Y.; Huang, Z.; You, W.; Luo, X.; Ke, C. Study of hybrid and backcross abalone populations uncovers trait separation and their thermal resistance capacity. Aquac. Res. 2022, 53, 2619–2628. [Google Scholar] [CrossRef]
- Zhang, Y.; Zhang, Y.; Li, J.; Xiao, S.; Xiang, Z.; Wang, Z.; Yan, X.; Yu, Z. Artificial interspecific backcrosses between the hybrid of female Crassostrea hongkongensis × male C. gigas and the two parental species. Aquaculture 2016, 450, 95–101. [Google Scholar] [CrossRef]
- Zheng, G.; Wu, C.; Liu, J.; Chen, J.; Zou, S. Transcriptome analysis provides new insights into the growth superiority of a novel backcross variety, Megalobrama amblycephala ♀ × (M. amblycephala ♀ × Culter alburnus ♂) ♂. Aquaculture 2019, 512, 734317. [Google Scholar] [CrossRef]
- Lai, X.; Xiao, Q.; Ji, H.; Huang, Z.; Huang, H.; You, W.; Luo, X.; Ke, C. Comparative analysis of the growth and biochemical composition of backcrosses and their parents in abalone. Aquaculture 2023, 570, 739445. [Google Scholar] [CrossRef]
- Shi, G.; Qin, Y.; Wan, W.; Li, S.; Liao, Q.; Ma, H.; Li, J.; Li, Y.; Zhou, Y.; Zhang, Y.; et al. Studies of interspecific backcross between hybrids of (Crassostrea angulata ♀ × C. gigas ♂) and their two parental species. Aquaculture 2023, 564, 739043. [Google Scholar] [CrossRef]
- Lago, A.D.A.; Rezende, T.T.; Dias, M.A.D.; Freitas, R.T.F.D.; Hilsdorf, A.W.S. The development of genetically improved red tilapia lines through the backcross breeding of two Oreochromis niloticus strains. Aquaculture 2017, 472, 17–22. [Google Scholar] [CrossRef]
- Pourmozaffar, S.; Tamadoni Jahromi, S.; Rameshi, H.; Sadeghi, A.; Bagheri, T.; Behzadi, S.; Gozari, M.; Zahedi, M.R.; Abrari Lazarjani, S. The role of salinity in physiological responses of bivalves. Rev. Aquac. 2020, 12, 1548–1566. [Google Scholar] [CrossRef]
- Metian, M.; Pouil, S.; Dupuy, C.; Teyssié, J.; Warnau, M.; Bustamante, P. Influence of food (ciliate and phytoplankton) on the trophic transfer of inorganic and methyl-mercury in the pacific cupped oyster Crassostrea gigas. Environ. Pollut. 2020, 257, 113503. [Google Scholar] [CrossRef]
- She, Z.; Peng, Y.; Jia, Z.; Kang, Z.; Yu, D. Molecular mechanisms affecting the difference in salinity adaptability between juvenile and adult Hong Kong oysters. Aquac. Rep. 2022, 24, 101171. [Google Scholar] [CrossRef]
- Peng, M.X.; Liu, X.J.; Niu, D.H.; Ye, B.; Lan, T.Y.; Dong, Z.G.; Li, J. Survival, growth and physiology of marine bivalve (Sinonovacula constricta) in long-term low-salt culture. Sci. Rep. 2019, 9, 2819. [Google Scholar]
- Christophersen, G.; Strand, Ø. Effect of reduced salinity on the great scallop (Pecten maximus) spat at two rearing temperatures. Aquaculture 2003, 215, 79–92. [Google Scholar] [CrossRef]
- Liu, C.S.; Zhou, J.C.; Yang, Y.M.; Yang, Y.; Wang, A.M.; Gu, Z.F. Effects of salinity on growth performance, physiological response, and body biochemical composition of juvenile ivory shell (Babylonia areolata). Aquaculture 2023, 566, 739193. [Google Scholar] [CrossRef]
- Qin, Z.; Yang, M.Y.; Zhang, J.E.; Deng, Z.X. Effects of salinity on survival, growth and reproduction of the invasive aquatic snail Pomacea canaliculata (Gastropoda: Ampullariidae). Hydrobiologia 2020, 847, 3103–3114. [Google Scholar] [CrossRef]
- Connan, S.; Stengel, D.B. Impacts of ambient salinity and copper on brown algae: 1. Interactive effects on photosynthesis, growth and copper accumulation. Aquat. Toxicol. 2011, 104, 94–107. [Google Scholar] [CrossRef]
- Gatenby, C.M.; Orcutt, D.M.; Kreeger, D.A.; Parker, B.C.; Jones, V.A.; Neves, R.J. Biochemical composition of three algal species proposed as food for captive freshwater mussels. J. Appl. Phycol. 2003, 15, 1–11. [Google Scholar] [CrossRef]
- Zhang, M.; Dong, J.; Gao, Y.; Liu, Y.; Zhou, C.; Meng, X.; Li, X.; Li, M.; Wang, Y.; Dai, D.; et al. Patterns of phytoplankton community structure and diversity in aquaculture ponds, henan, China. Aquaculture 2021, 544, 737078. [Google Scholar] [CrossRef]
- Kong, N.; Liu, Z.; Yu, Z.; Fu, Q.; Li, H.; Zhang, Y.; Fang, X.; Zhang, F.; Liu, C.; Wang, L.; et al. Dynamics of phytoplankton community in scallop farming waters of the bohai sea and north yellow sea in China. BMC Ecol. Evol. 2022, 22, 48. [Google Scholar] [CrossRef]
- Ding, C.; Sun, J.; Narale, D.; Liu, H. Phytoplankton community in the western south China sea in winter and summer. Water 2021, 13, 1209. [Google Scholar] [CrossRef]
- Pan, H.; Xu, M.; Lan, C.; Ma, J.; Li, J.; Lu, J.; Lai, J. Determination of phytoplankton community structure and biomass with HPLC-chemtax and microscopic methods during winter and summer in the Qinzhou bay of the Beibu gulf. Front. Mar. Sci. 2023, 10, 1–15. [Google Scholar] [CrossRef]
- Brito, A.C.; Moita, T.; Gameiro, C.; Silva, T.; Anselmo, T.; Brotas, V. Changes in the phytoplankton composition in a temperate estuarine system (1960 to 2010). Estuaries Coasts 2015, 38, 1678–1691. [Google Scholar] [CrossRef]
- Li, Q.; Yu, H.; Yu, R.H. Genetic variability assessed by microsatellites in cultured populations of the Pacific oyster (Crassostrea gigas) in China. Aquaculture 2006, 259, 95–102. [Google Scholar] [CrossRef]
- Lallias, D.; Boudry, P.; Gue, S.L.; King, J.W.; Beaumont, A.R. Strategies for the retention of high genetic variability in European flat oyster (Ostrea edulis) restoration programmes. Conserv. Genet. 2010, 11, 1899–1910. [Google Scholar] [CrossRef]
- Frost, L.A.; Evans, B.S.; Jerry, D.R. Loss of genetic diversity due to hatchery culture practices in barramundi (Lates calcarifer). Aquaculture 2006, 261, 1056–1064. [Google Scholar] [CrossRef]
- Lind, C.E.; Evans, B.S.; Knauer, J.; Taylor, J.J.U.; Jerry, D.R. Decreased genetic diversity and a reduced effective population size in cultured silver-lipped pearl oysters (Pinctada maxima). Aquaculture 2009, 286, 12–19. [Google Scholar] [CrossRef]
- In, V.; O’Connor, W.; Dove, M.; Knibb, W. Can genetic diversity be maintained across multiple mass selection lines of Sydney rock oyster, Saccostrea glomerata despite loss within each? Aquaculture 2016, 454, 210–216. [Google Scholar] [CrossRef]
- Reece, K.S.; Ribeiiro, W.L.; Gaffney, P.M.; Carnegie, R.B.; SK Allen, J. Microsatellite marker development and analysis in the eastern oyster (Crassostrea virginica): Confirmation of null alleles and non-mendelian segregation ratios. J. Hered. 2004, 95, 346–352. [Google Scholar] [CrossRef]
Disclaimer/Publisher’s Note: The statements, opinions and data contained in all publications are solely those of the individual author(s) and contributor(s) and not of MDPI and/or the editor(s). MDPI and/or the editor(s) disclaim responsibility for any injury to people or property resulting from any ideas, methods, instructions or products referred to in the content. |
© 2024 by the authors. Licensee MDPI, Basel, Switzerland. This article is an open access article distributed under the terms and conditions of the Creative Commons Attribution (CC BY) license (https://creativecommons.org/licenses/by/4.0/).