
Aided Diagnosis Model Based on Deep Learning for Glioblastoma, Solitary Brain Metastases, and Primary Central Nervous System Lymphoma with Multi-Modal MRI


Abstract
Simple Summary
Abstract
1. Introduction
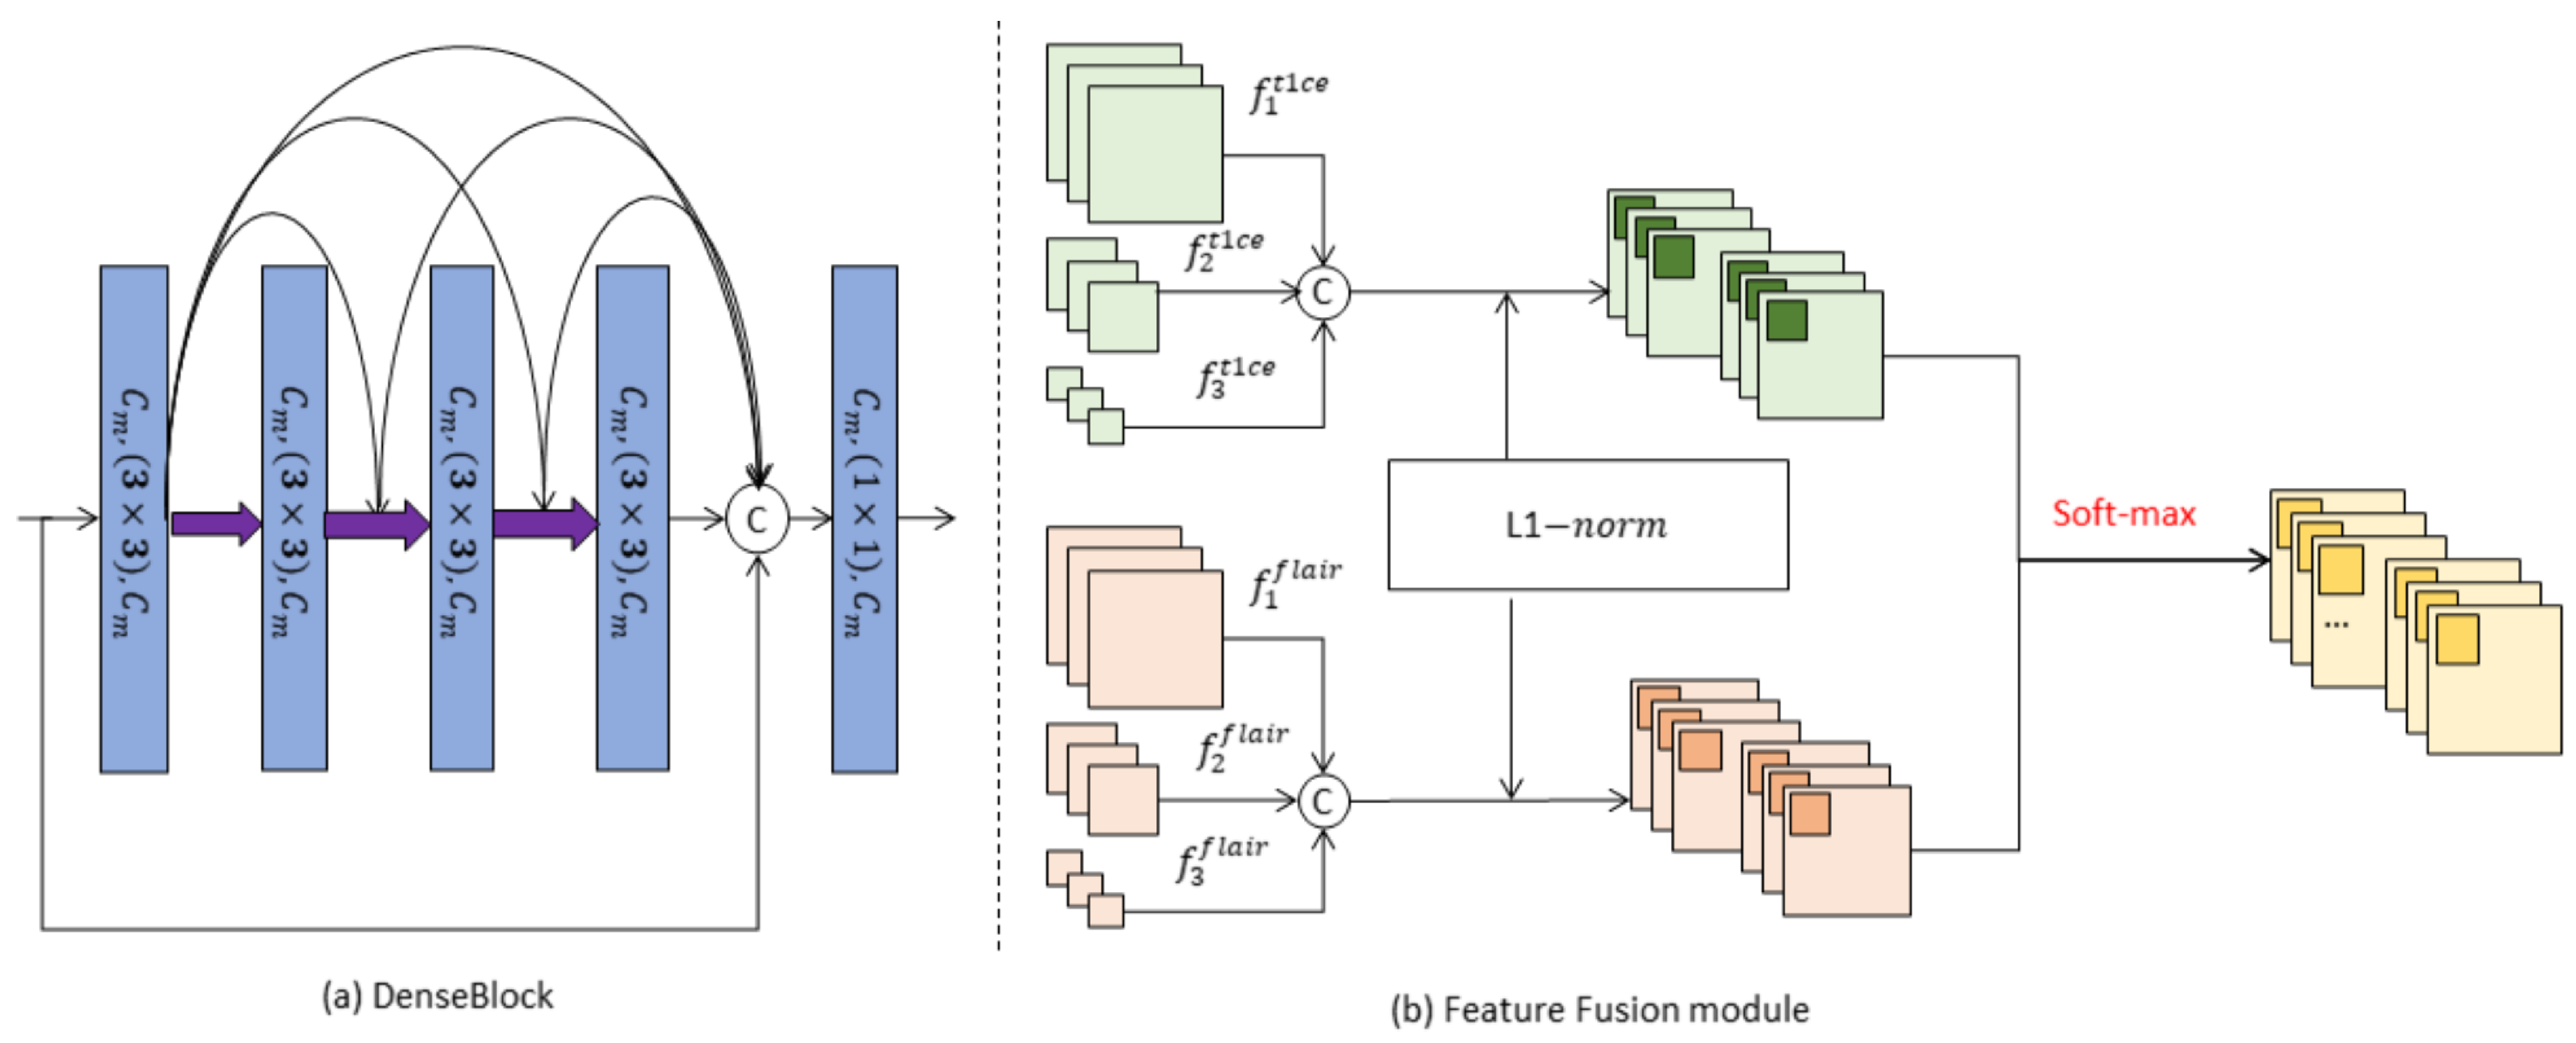
- DenseBlock-based parallel multiple encoders are proposed to extract features simultaneously from different sequences. This allows for comprehensive representation learning across various MRI sequences.
- A novel feature fusion module is introduced to enhance the interrelated information between different tumor tissues. By improving the tumor characterization ability of the extracted features, the model achieves more accurate tumor classification.
- The model incorporates a spatial-channel self-attentive weighting operation on both the modal and fusion features. This operation dynamically adjusts the relationship between the weights of different channels, enhancing the model’s expressive ability and improving its overall performance.
2. Patients
2.1. Patient Enrollment and MRI Scanning Parameters
2.2. Data Preprocessing
3. Method
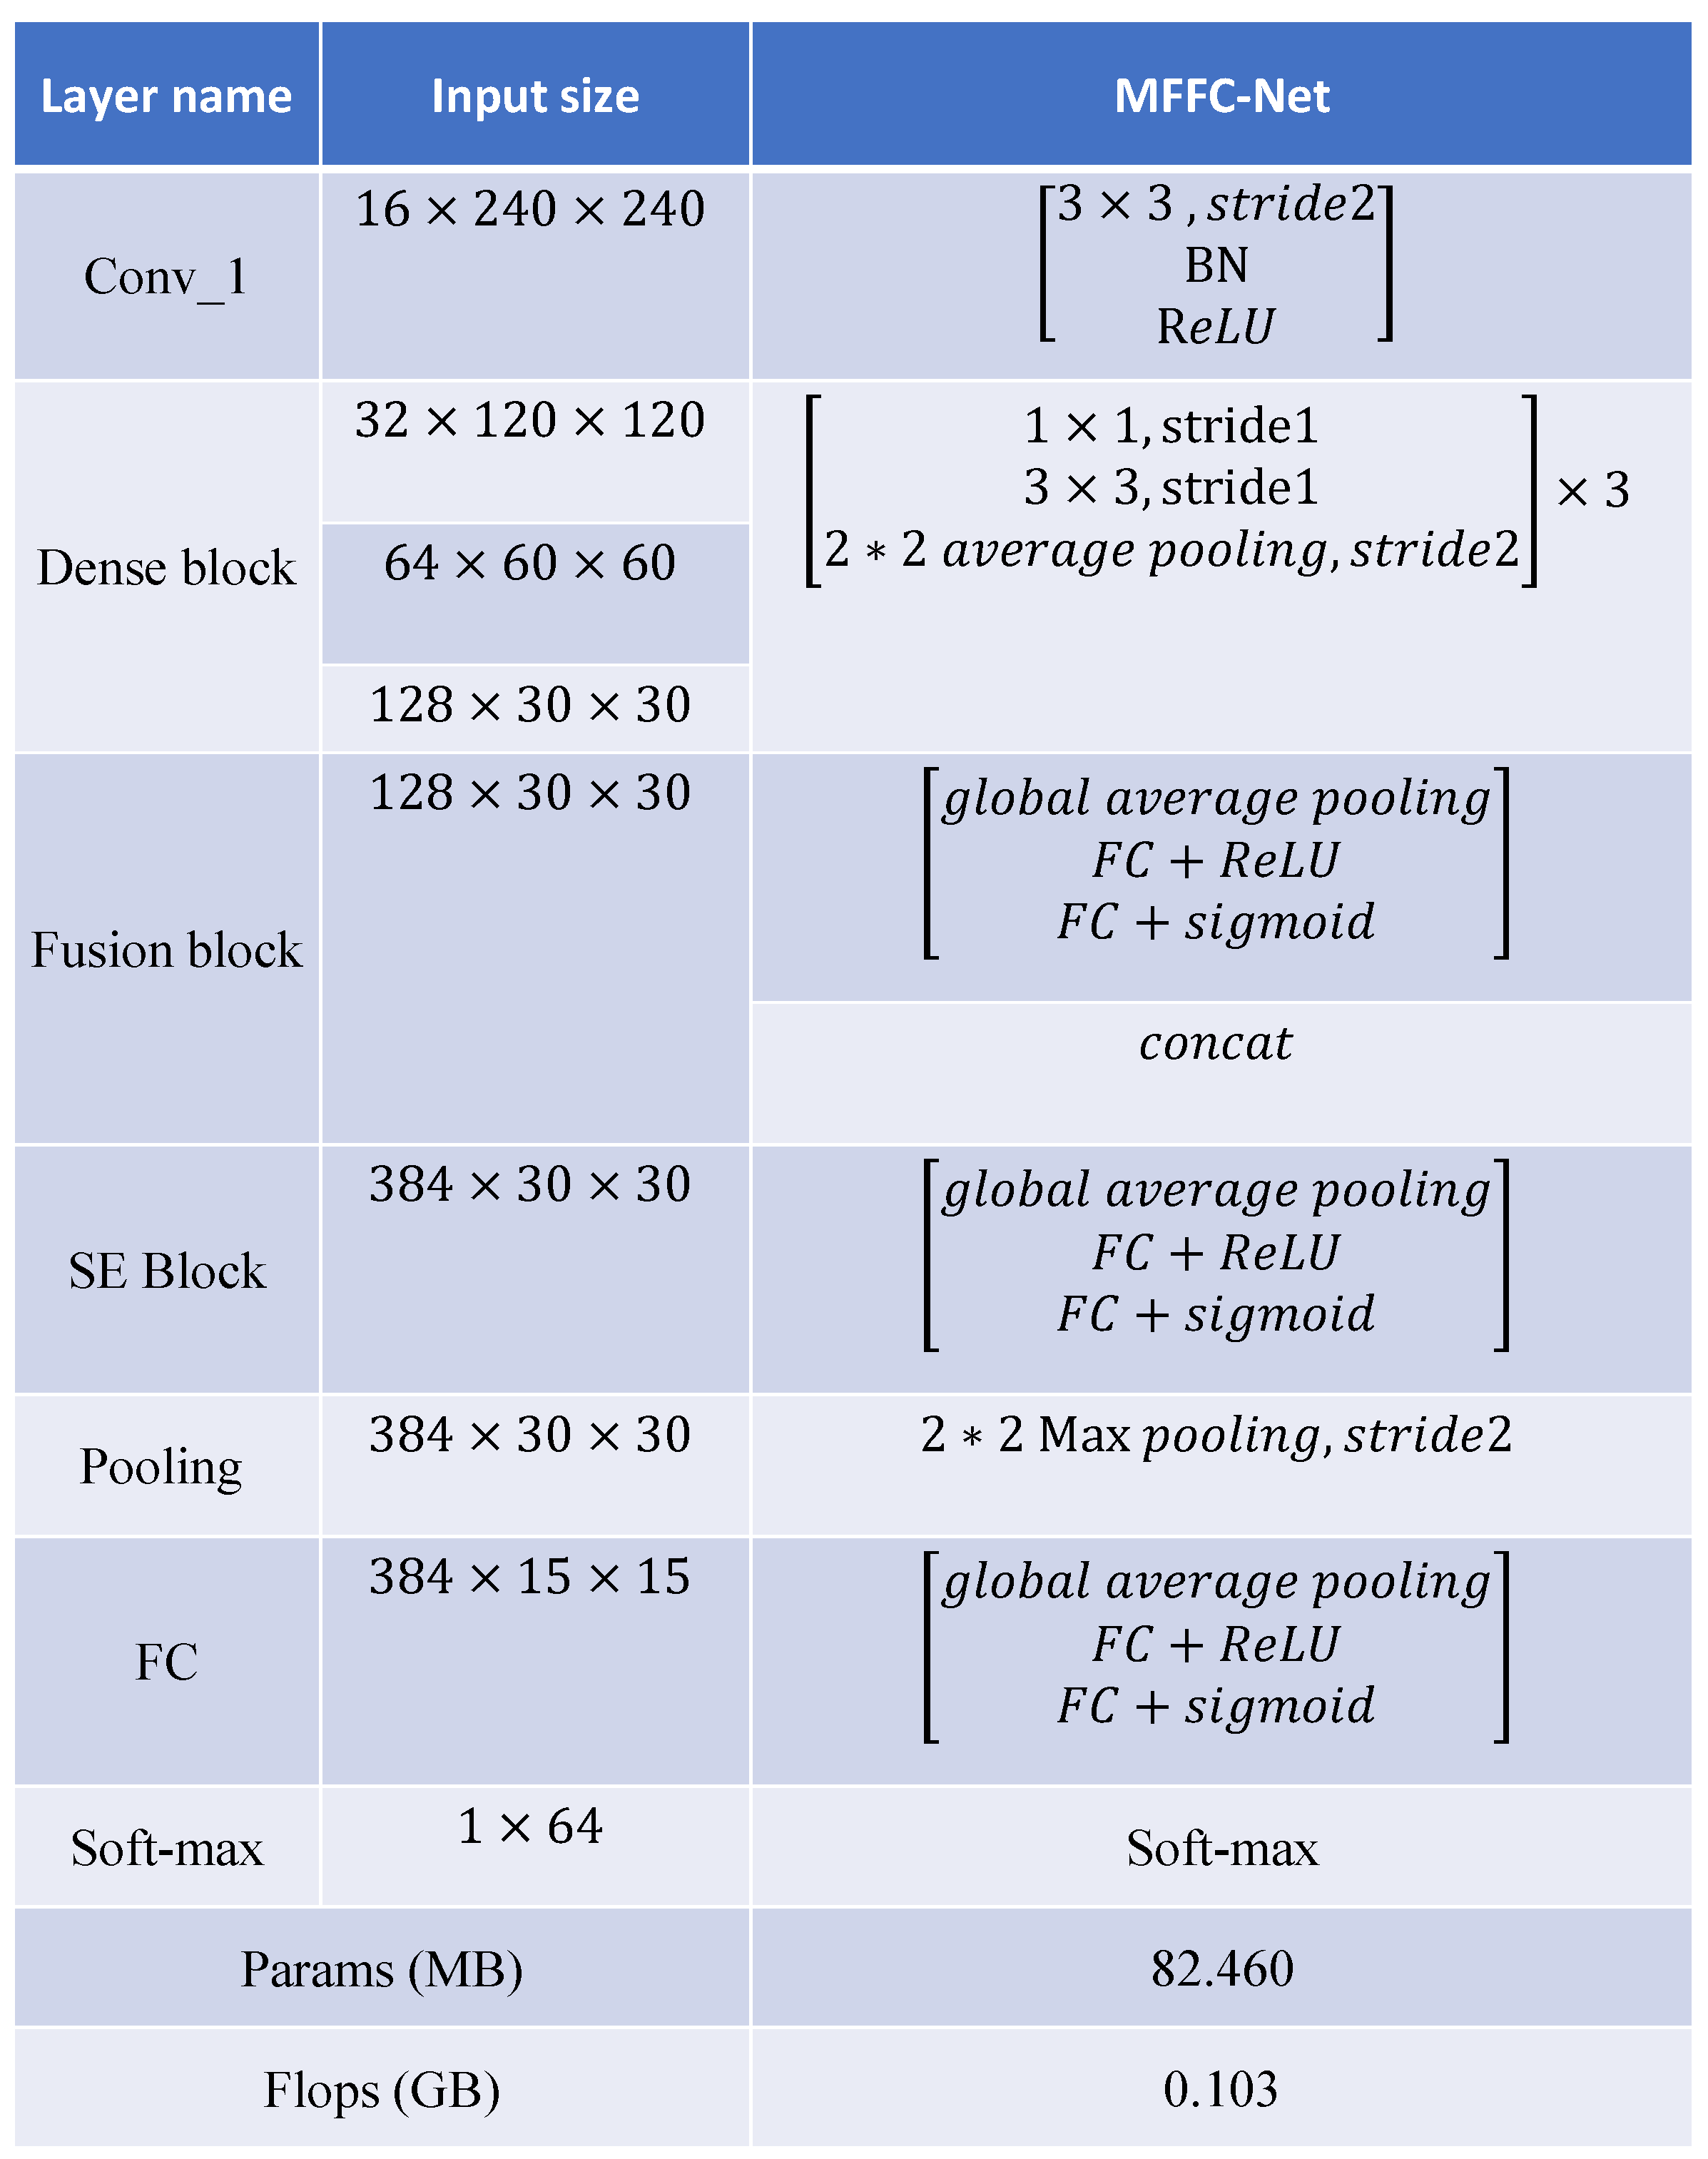
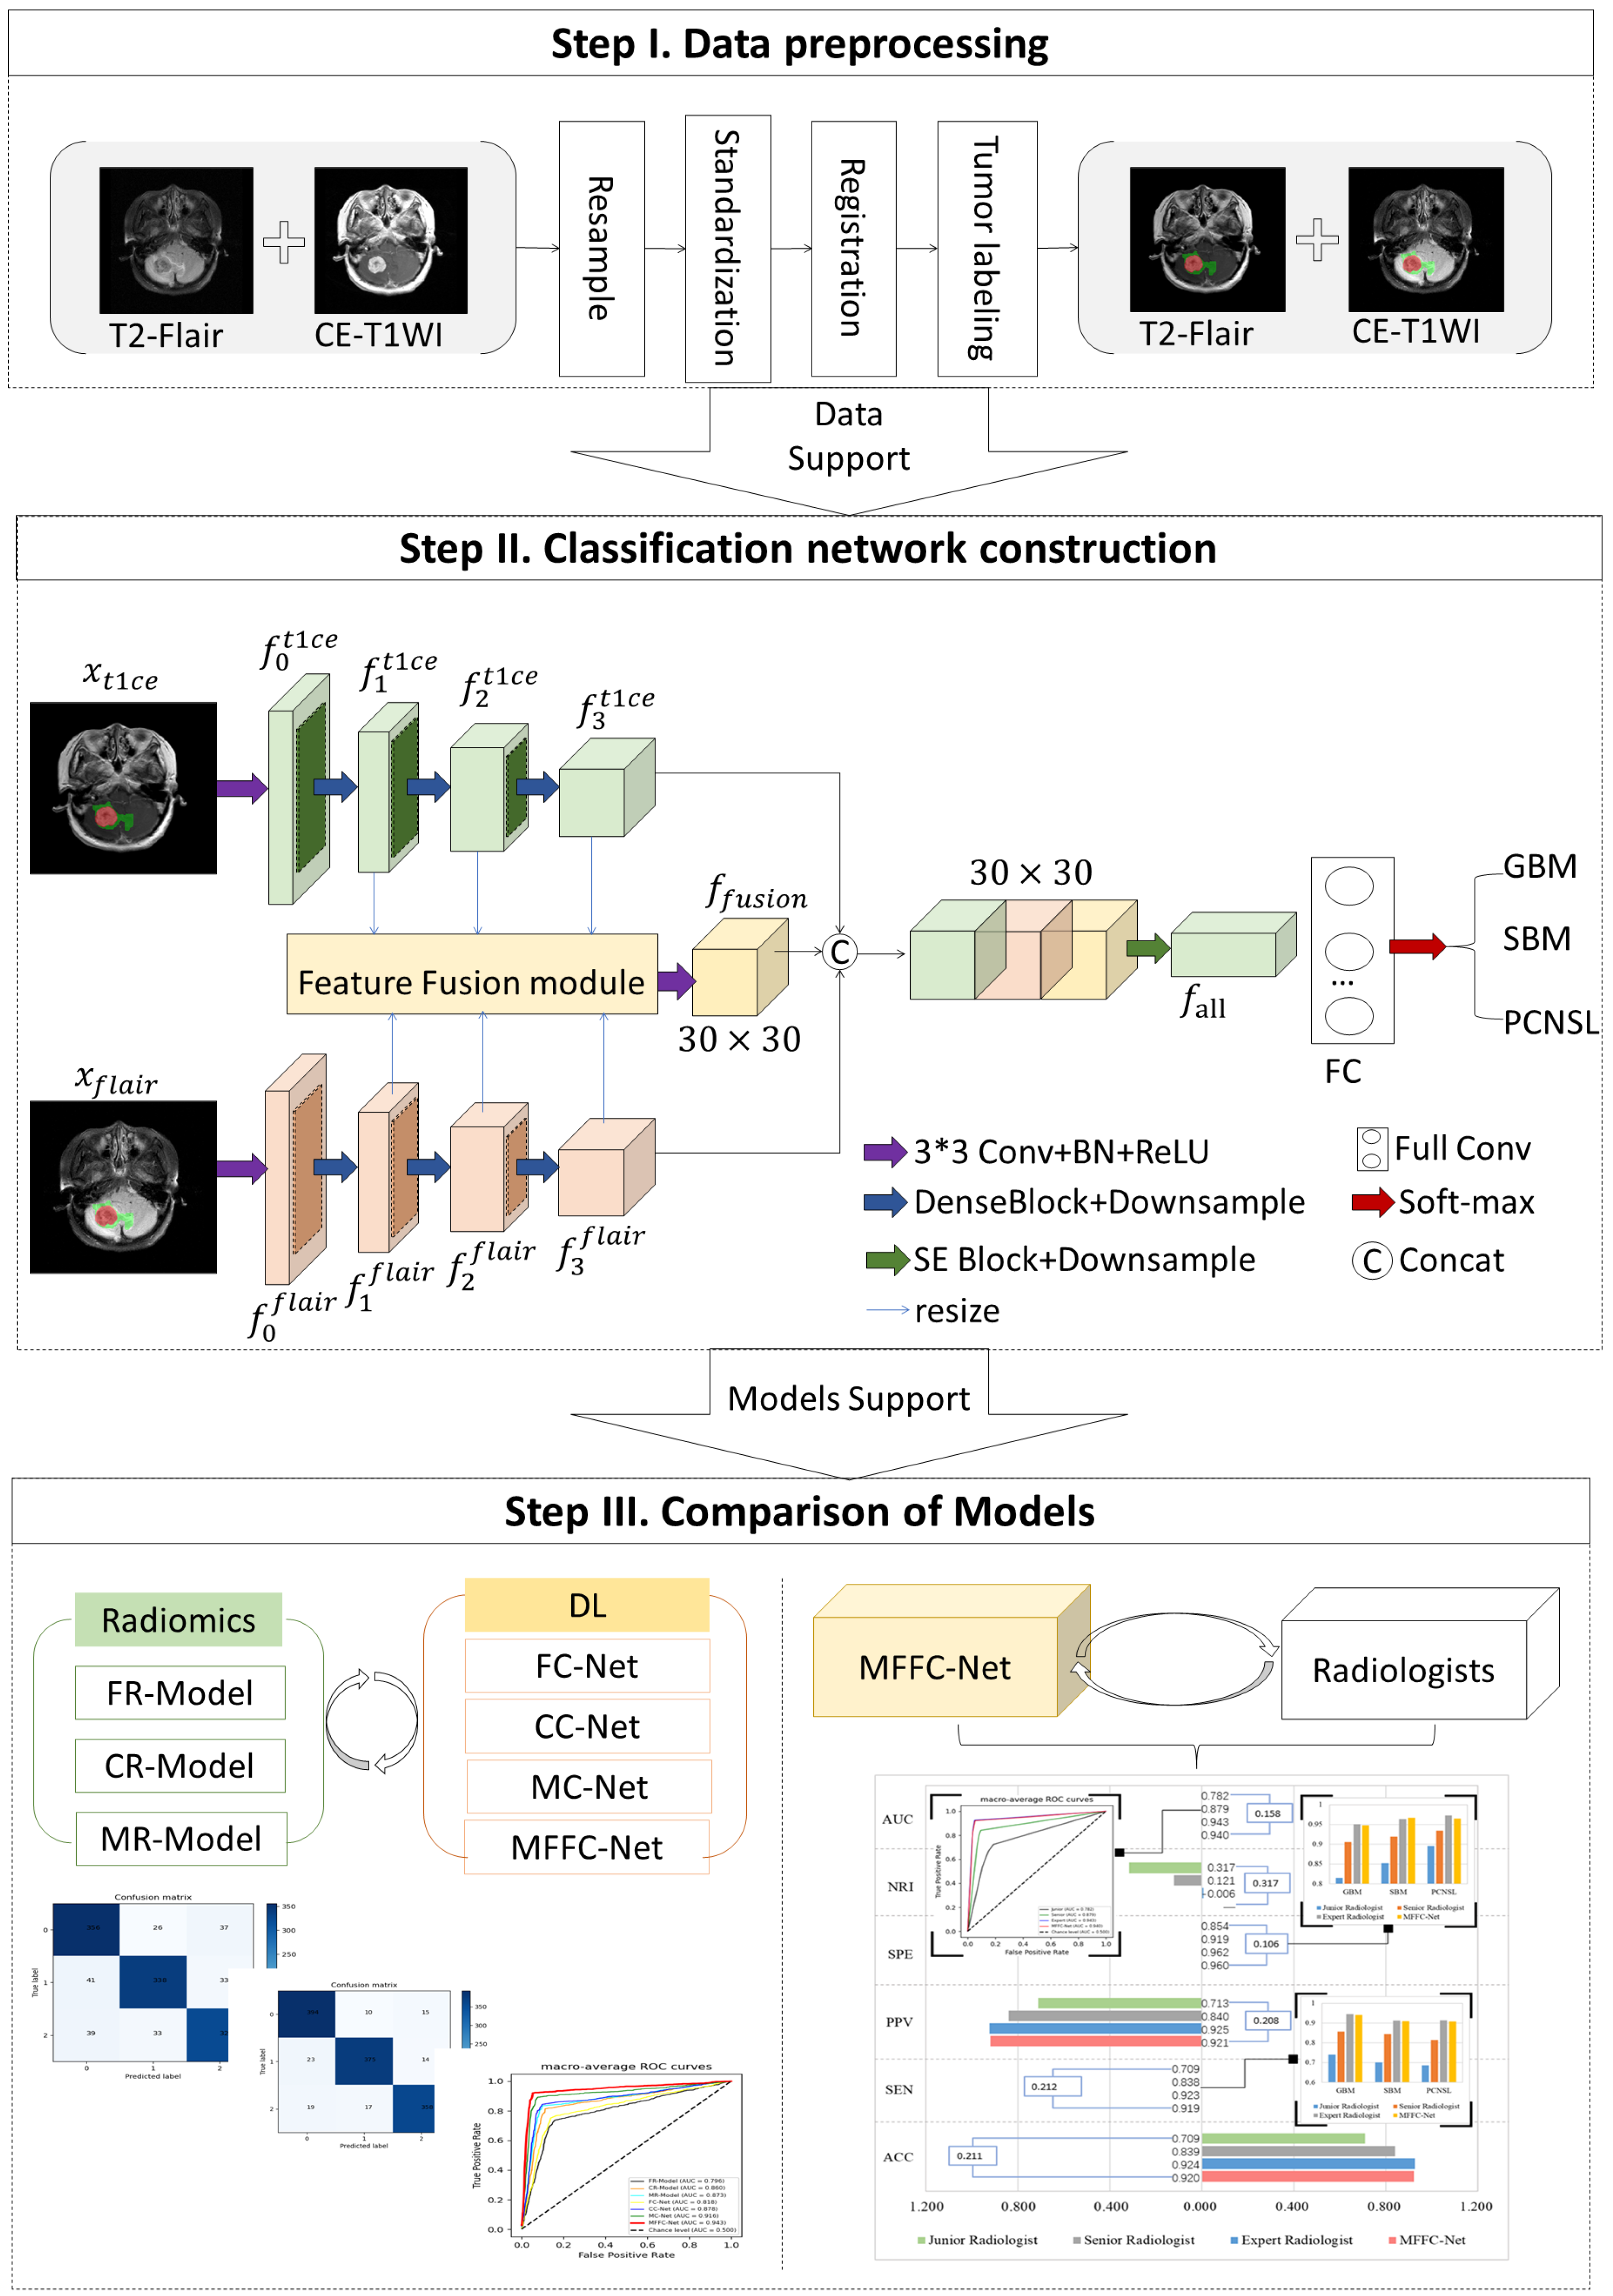
3.1. Classification Network Construction
3.2. Model Training
3.3. Evaluation Indicators
3.4. Statistical Analysis
4. Results
5. Discussion
6. Limitations
7. Conclusions
Supplementary Materials
Author Contributions
Funding
Institutional Review Board Statement
Informed Consent Statement
Data Availability Statement
Acknowledgments
Conflicts of Interest
Abbreviations
| CNS | Central nervous system |
| GBM | Gliomas |
| SBM | Solitary brain metastase |
| PCNSL | Primary central nervous system lymphoma |
| MRI | Magnetic Resonance Imaging |
| T2-Flair | T2 fluid-attenuated inversion recover |
| CE-T1WI | Contrast-enhanced-T1 weighted imaging |
| ML | Machine learning |
| DL | Deep learning |
| CNN | Convolutional neural network |
| FC | Full convolutional |
| BN | Batch Normalization |
| ACC | Accuracy |
| PPV | Positive predictive value |
| SEN | Sensitivity |
| SPE | Specificity |
| ROC | Receiver operating characteristic curve |
| AUC | Area under the ROC curve |
| NRI | Net reclassification improvement |
| FR-Model | T2-Flair radiomics-based model |
| CR-Model | CE-T1WI radiomics-based model |
| MR-Model | Multi-modal radiomics-based model |
| FC-Net | T2-Flair-based network |
| CR-Model | CE-T1WI-based network |
| MR-Net | Multi-modal-based network |
| MFFC-Net | Multi-modal-based feature fusion network |
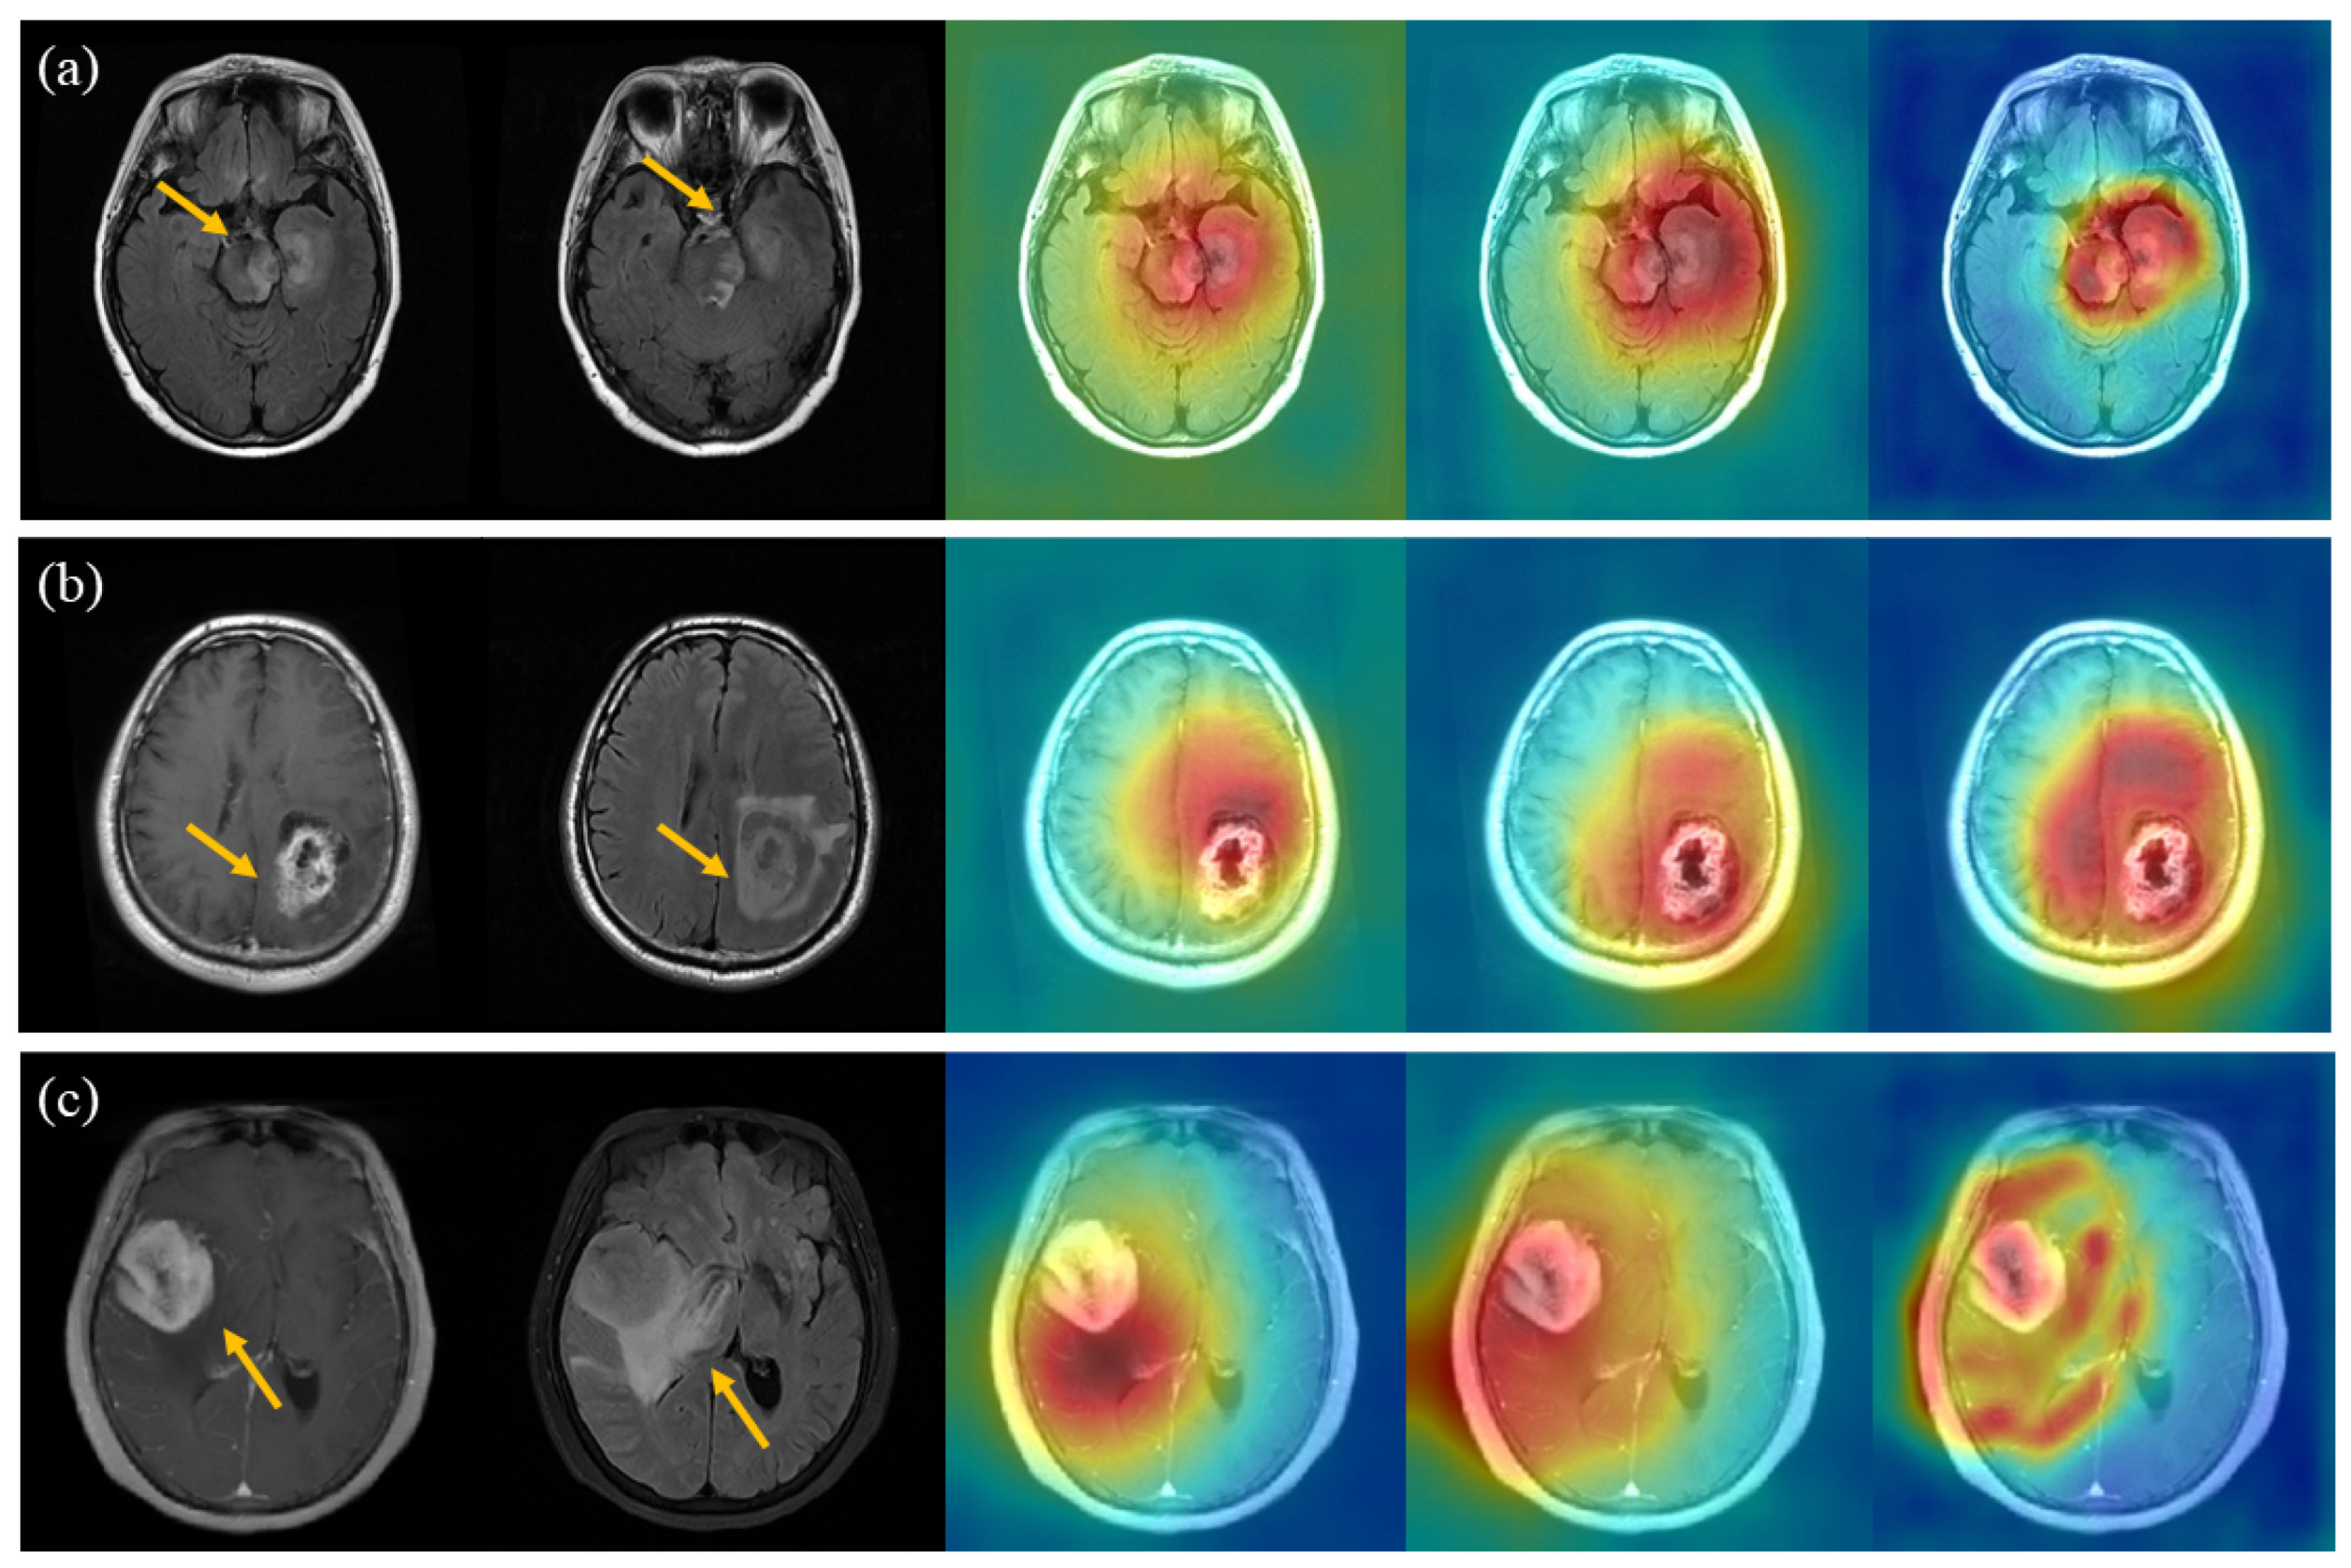
| Grad-CAM | Gradient-weighted class activation mapping |
Appendix A. Evaluation Metrics
| Predicted Positive | Predicted Negative | |
| Real Positive | TP | TN |
| Real Negative | FP | FN |
Appendix B. Figures
References
- Bikfalvi, A.; da Costa, C.A.; Avril, T.; Barnier, J.V.; Bauchet, L.; Brisson, L.; Cartron, P.F.; Castel, H.; Chevet, E.; Chneiweiss, H.; et al. Challenges in glioblastoma research: Focus on the tumor microenvironment. Trends Cancer 2023, 9, 9–27. [Google Scholar] [CrossRef]
- Hung, N.D.; Vi, N.H.; Anh, N.T.H.; Phuong, L.T.H.; Hieu, N.D.; Duc, N.M. The role of 3-Tesla magnetic resonance perfusion and spectroscopy in distinguishing glioblastoma from solitary brain metastasis. J. Clin. Imaging Sci. 2023, 13, 19. [Google Scholar] [CrossRef]
- Hoang-Xuan, K.; Deckert, M.; Ferreri, A.J.; Furtner, J.; Gallego Perez-Larraya, J.; Henriksson, R.; Hottinger, A.F.; Kasenda, B.; Lefranc, F.; Lossos, A.; et al. European Association of Neuro-Oncology (EANO) guidelines for treatment of primary central nervous system lymphoma (PCNSL). Neuro-Oncol. 2023, 25, 37–53. [Google Scholar] [CrossRef]
- Ostrom, Q.T.; Gittleman, H.; Farah, P.; Ondracek, A.; Chen, Y.; Wolinsky, Y.; Stroup, N.E.; Kruchko, C.; Barnholtz-Sloan, J.S. CBTRUS Statistical Report: Primary Brain and Central Nervous System Tumors Diagnosed in the United States in 2006–2010. Neuro-Oncol. 2013, 15, ii1–ii56. [Google Scholar] [CrossRef]
- Villano, J.L.; Durbin, E.B.; Normandeau, C.; Thakkar, J.P.; Moirangthem, V.; Davis, F.G. Incidence of brain metastasis at initial presentation of lung cancer. Neuro-Oncol. 2014, 17, 122–128. [Google Scholar] [CrossRef]
- Shiels, M.S.; Pfeiffer, R.M.; Besson, C.; Clarke, C.A.; Morton, L.M.; Nogueira, L.; Pawlish, K.; Yanik, E.L.; Suneja, G.; Engels, E.A. Trends in primary central nervous system lymphoma incidence and survival in the U.S. Br. J. Haematol. 2016, 174, 417–424. [Google Scholar] [CrossRef]
- Patel, A.P.; Fisher, J.L.; Nichols, E.; Abd-Allah, F.; Abdela, J.; Abdelalim, A.; Abraha, H.N.; Agius, D.; Alahdab, F.; Alam, T.; et al. Global, regional, and national burden of brain and other CNS cancer, 1990–2016: A systematic analysis for the Global Burden of Disease Study 2016. Lancet Neurol. 2019, 18, 376–393. [Google Scholar] [CrossRef]
- Röttgering, J.G.; Klein, M.; Douw, L. Letter regarding “Palliative care and end-of-life care in adults with malignant brain tumors”. Neuro-Oncol. 2023, 25, 612–613. [Google Scholar] [CrossRef] [PubMed]
- Di Giacomo, A.M.; Mair, M.J.; Ceccarelli, M.; Anichini, A.; Ibrahim, R.; Weller, M.; Lahn, M.; Eggermont, A.M.; Fox, B.; Maio, M. Immunotherapy for brain metastases and primary brain tumors. Eur. J. Cancer 2023, 179, 113–120. [Google Scholar] [CrossRef] [PubMed]
- Perkins, A.; Liu, G. Primary brain tumors in adults: Diagnosis and treatment. Am. Fam. Phys. 2016, 93, 211–217B. [Google Scholar]
- Heiss, W.D.; Raab, P.; Lanfermann, H. Multimodality assessment of brain tumors and tumor recurrence. J. Nucl. Med. 2011, 52, 1585–1600. [Google Scholar] [CrossRef] [PubMed]
- Blanchet, L.; Krooshof, P.; Postma, G.; Idema, A.; Goraj, B.; Heerschap, A.; Buydens, L. Discrimination between metastasis and glioblastoma multiforme based on morphometric analysis of MR images. Am. J. Neuroradiol. 2011, 32, 67–73. [Google Scholar] [CrossRef] [PubMed]
- Bühring, U.; Herrlinger, U.; Krings, T.; Thiex, R.; Weller, M.; Küker, W. MRI features of primary central nervous system lymphomas at presentation. Neurology 2001, 57, 393–396. [Google Scholar] [CrossRef] [PubMed]
- Savage, J.; Quint, D. Atypical Imaging Findings in an Immunocompetent Patient. JAMA Oncol. 2015, 1, 247–248. [Google Scholar] [CrossRef] [PubMed]
- Lambin, P.; Rios-Velazquez, E.; Leijenaar, R.; Carvalho, S.; van Stiphout, R.G.; Granton, P.; Zegers, C.M.; Gillies, R.; Boellard, R.; Dekker , A.; et al. Radiomics: Extracting more information from medical images using advanced feature analysis. Eur. J. Cancer 2012, 48, 441–446. [Google Scholar] [CrossRef] [PubMed]
- Zhang, L.; Yao, R.; Gao, J.; Tan, D.; Yang, X.; Wen, M.; Wang, J.; Xie, X.; Liao, R.; Tang, Y.; et al. An integrated radiomics model incorporating diffusion-weighted imaging and 18F-FDG PET imaging improves the performance of differentiating glioblastoma from solitary brain metastases. Front. Oncol. 2021, 11, 732704. [Google Scholar] [CrossRef] [PubMed]
- Bathla, G.; Priya, S.; Liu, Y.; Ward, C.; Le, N.H.; Soni, N.; Maheshwarappa, R.P.; Monga, V.; Zhang, H.; Sonka, M. Radiomics-based differentiation between glioblastoma and primary central nervous system lymphoma: A comparison of diagnostic performance across different MRI sequences and machine learning techniques. Eur. Radiol. 2021, 31, 8703–8713. [Google Scholar] [CrossRef]
- Sudre, C.H.; Cardoso, M.J.; Bouvy, W.H.; Biessels, G.J.; Barnes, J.; Ourselin, S. Bayesian model selection for pathological neuroimaging data applied to white matter lesion segmentation. IEEE Trans. Med. Imaging 2015, 34, 2079–2102. [Google Scholar] [CrossRef]
- Galimzianova, A.; Pernuš, F.; Likar, B.; Špiclin, Ž. Stratified mixture modeling for segmentation of white-matter lesions in brain MR images. NeuroImage 2016, 124, 1031–1043. [Google Scholar] [CrossRef]
- Gryska, E.; Schneiderman, J.; Björkman-Burtscher, I.; Heckemann, R.A. Automatic brain lesion segmentation on standard magnetic resonance images: A scoping review. BMJ Open 2021, 11, e042660. [Google Scholar] [CrossRef]
- Shiee, N.; Bazin, P.L.; Ozturk, A.; Reich, D.S.; Calabresi, P.A.; Pham, D.L. A topology-preserving approach to the segmentation of brain images with multiple sclerosis lesions. NeuroImage 2010, 49, 1524–1535. [Google Scholar] [CrossRef]
- Charron, O.; Lallement, A.; Jarnet, D.; Noblet, V.; Clavier, J.B.; Meyer, P. Automatic detection and segmentation of brain metastases on multimodal MR images with a deep convolutional neural network. Comput. Biol. Med. 2018, 95, 43–54. [Google Scholar] [CrossRef]
- Ozkara, B.B.; Chen, M.M.; Federau, C.; Karabacak, M.; Briere, T.M.; Li, J.; Wintermark, M. Deep learning for detecting brain metastases on MRI: A systematic review and Meta-analysis. Cancers 2023, 15, 334. [Google Scholar] [CrossRef] [PubMed]
- Kleppe, A.; Skrede, O.J.; De Raedt, S.; Liestøl, K.; Kerr, D.J.; Danielsen, H.E. Designing deep learning studies in cancer diagnostics. Nat. Rev. Cancer 2021, 21, 199–211. [Google Scholar] [CrossRef] [PubMed]
- Woo, M.; Devane, A.M.; Lowe, S.C.; Lowther, E.L.; Gimbel, R.W. Deep learning for semi-automated unidirectional measurement of lung tumor size in CT. Cancer Imaging 2021, 21, 43. [Google Scholar] [CrossRef] [PubMed]
- Gao, P.; Shan, W.; Guo, Y.; Wang, Y.; Sun, R.; Cai, J.; Li, H.; Chan, W.S.; Liu, P.; Yi, L.; et al. Development and validation of a deep learning model for brain tumor diagnosis and classification using magnetic resonance imaging. JAMA Netw. Open 2022, 5, e2225608. [Google Scholar] [CrossRef] [PubMed]
- Wang, Y.; Acs, B.; Robertson, S.; Liu, B.; Solorzano, L.; Wählby, C.; Hartman, J.; Rantalainen, M. Improved breast cancer histological grading using deep learning. Ann. Oncol. 2022, 33, 89–98. [Google Scholar] [CrossRef]
- Nazir, M.; Shakil, S.; Khurshid, K. Role of deep learning in brain tumor detection and classification (2015 to 2020): A review. Comput. Med. Imaging Graph. 2021, 91, 101940. [Google Scholar] [CrossRef] [PubMed]
- Cepeda, S.; García-García, S.; Arrese, I.; Fernández-Pérez, G.; Velasco-Casares, M.; Fajardo-Puentes, M.; Zamora, T.; Sarabia, R. Comparison of intraoperative ultrasound B-mode and strain elastography for the differentiation of glioblastomas from solitary brain metastases. An automated deep learning approach for image analysis. Front. Oncol. 2021, 10, 590756. [Google Scholar] [CrossRef]
- Guha, A.; Goda, J.S.; Dasgupta, A.; Mahajan, A.; Halder, S.; Gawde, J.; Talole, S. Classifying primary central nervous system lymphoma from glioblastoma using deep learning and radiomics based machine learning approach-a systematic review and meta-analysis. Front. Oncol. 2022, 12, 884173. [Google Scholar] [CrossRef]
- Li, X.; Wu, J.; Lin, Z.; Liu, H.; Zha, H. Recurrent squeeze-and-excitation context aggregation net for single image deraining. In Proceedings of the European Conference on Computer Vision (ECCV), Munich, Germany, 8–14 September 2018; pp. 254–269. [Google Scholar]
- Zhang, L.; Liu, X.; Xu, X.; Liu, W.; Jia, Y.; Chen, W.; Fu, X.; Li, Q.; Sun, X.; Zhang, Y.; et al. An integrative non-invasive malignant brain tumors classification and Ki-67 labeling index prediction pipeline with radiomics approach. Eur. J. Radiol. 2023, 158, 110639. [Google Scholar] [CrossRef]
- Huang, G.; Liu, Z.; Van Der Maaten, L.; Weinberger, K.Q. Densely connected convolutional networks. In Proceedings of the IEEE Conference on Computer Vision and Pattern Recognition, Honolulu, HI, USA, 21–26 July 2017; pp. 4700–4708. [Google Scholar]
- Jin, X.; Xie, Y.; Wei, X.S.; Zhao, B.R.; Chen, Z.M.; Tan, X. Delving deep into spatial pooling for squeeze-and-excitation networks. Pattern Recognit. 2022, 121, 108159. [Google Scholar] [CrossRef]
- Tan, M.; Le, Q. EfficientNetV2: Smaller Models and Faster Training. In Proceedings of the 38th International Conference on Machine Learning, Virtual Event, 18–24 July 2021; Meila, M., Zhang, T., Eds.; PMLR: New York, NY, USA, 2021; Volume 139, pp. 10096–10106. [Google Scholar]
- Bae, S.; An, C.; Ahn, S.S.; Kim, H.; Han, K.; Kim, S.W.; Park, J.E.; Kim, H.S.; Lee, S.K. Robust performance of deep learning for distinguishing glioblastoma from single brain metastasis using radiomic features: Model development and validation. Sci. Rep. 2020, 10, 12110. [Google Scholar] [CrossRef] [PubMed]
- Shin, I.; Kim, H.; Ahn, S.; Sohn, B.; Bae, S.; Park, J.; Kim, H.; Lee, S.K. Development and Validation of a Deep Learning–Based Model to Distinguish Glioblastoma from Solitary Brain Metastasis Using Conventional MR Images. Am. J. Neuroradiol. 2021, 42, 838–844. [Google Scholar] [CrossRef] [PubMed]
- Lohrke, J.; Frenzel, T.; Endrikat, J.; Alves, F.C.; Grist, T.M.; Law, M.; Lee, J.M.; Leiner, T.; Li, K.C.; Nikolaou, K.; et al. 25 years of contrast-enhanced MRI: Developments, current challenges and future perspectives. Adv. Ther. 2016, 33, 1–28. [Google Scholar] [CrossRef] [PubMed]
- Jiang, Y.; Yang, M.; Wang, S.; Li, X.; Sun, Y. Emerging role of deep learning-based artificial intelligence in tumor pathology. Cancer Commun. 2020, 40, 154–166. [Google Scholar] [CrossRef] [PubMed]
- Angulakshmi, M.; Deepa, M. A review on deep learning architecture and methods for MRI brain tumour segmentation. Curr. Med. Imaging 2021, 17, 695–706. [Google Scholar] [CrossRef] [PubMed]
- Chang, P.; Grinband, J.; Weinberg, B.; Bardis, M.; Khy, M.; Cadena, G.; Su, M.Y.; Cha, S.; Filippi, C.; Bota, D.; et al. Deep-learning convolutional neural networks accurately classify genetic mutations in gliomas. Am. J. Neuroradiol. 2018, 39, 1201–1207. [Google Scholar] [CrossRef]
- Zahid, U.; Ashraf, I.; Khan, M.A.; Alhaisoni, M.; Yahya, K.M.; Hussein, H.S.; Alshazly, H. BrainNet: Optimal deep learning feature fusion for brain tumor classification. Comput. Intell. Neurosci. 2022, 2022, 1465173. [Google Scholar] [CrossRef]

| Characteristic | All | GBM | SBM | PCNSL | p-Value |
|---|---|---|---|---|---|
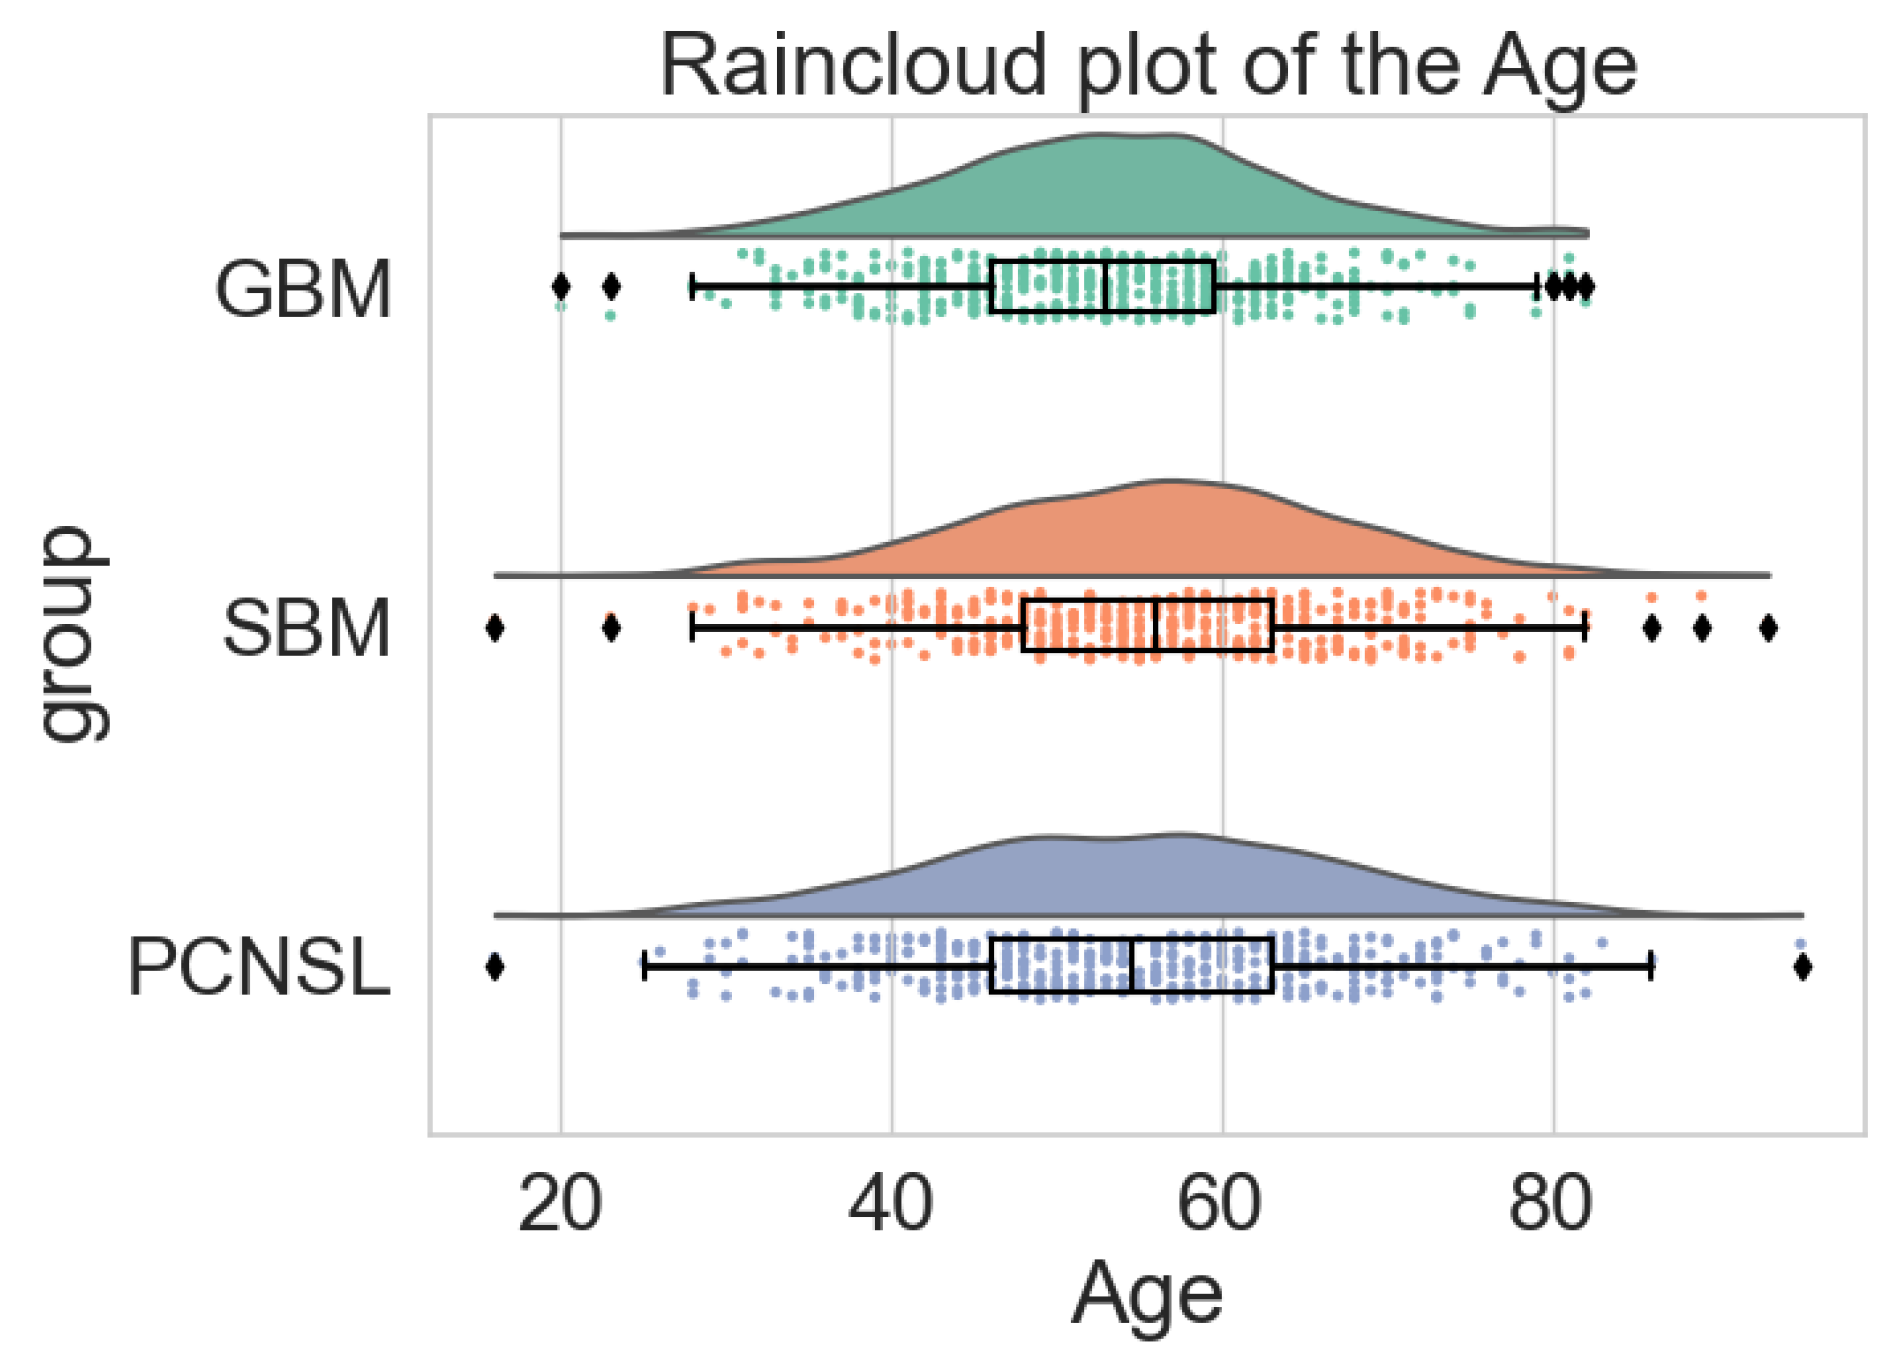
| Age (year) | 53 ± 13 | 53 ± 11 | 56 ± 12 | 55 ± 13 | 0.319 |
| Gender | |||||
| Male | 671 | 228 | 208 | 235 | 0.215 |
| Female | 554 | 191 | 204 | 159 | |
| Total | 1225 | 419 | 412 | 394 | |
| MRI Scanner | T2-Flair | CE-T1WI |
|---|---|---|
| Signa 3T | TR = 6880 ms; TI = 1850 ms; | TR = 1650 ms; TI = 720 ms; |
| TE = 140 ms; Matrix = 288 × 192; | TE = 23.7 ms; Matrix = 288 × 192; | |
| FOV = 240 × 240 mm2; | FOV = 240 × 240 mm2; | |
| Thickness = 5 mm; | Thickness = 5 mm; | |
| Interval = 1.5 mm | Interval = 1.5 mm | |
| Discovery MR750W 3T | TR = 8000 ms; TI = 2100 ms; | TR = 2992 ms; TI = 869 ms; |
| Matrix = 256 × 256; | Matrix = 320 × 320; | |
| FOV = 240 × 240 mm2; | FOV = 240 × 240 mm2; | |
| Thickness = 5 mm; | Thickness = 5 mm; | |
| Interval = 1.5 mm | Interval = 1.5 mm | |
| Verio 3T | TR = 9000 ms; TI = 2500 ms; | TR = 2000 ms; TI = 857 ms; |
| TE = 102 ms; Matrix = 256 × 190; | TE = 17 ms; Matrix = 256 × 168; | |
| FOV = 201 × 230 mm2; | FOV = 201 × 230 mm2; | |
| Thickness = 5 mm; | Thickness = 5 mm; | |
| Interval = 1.5 mm | Interval = 1.5 mm |
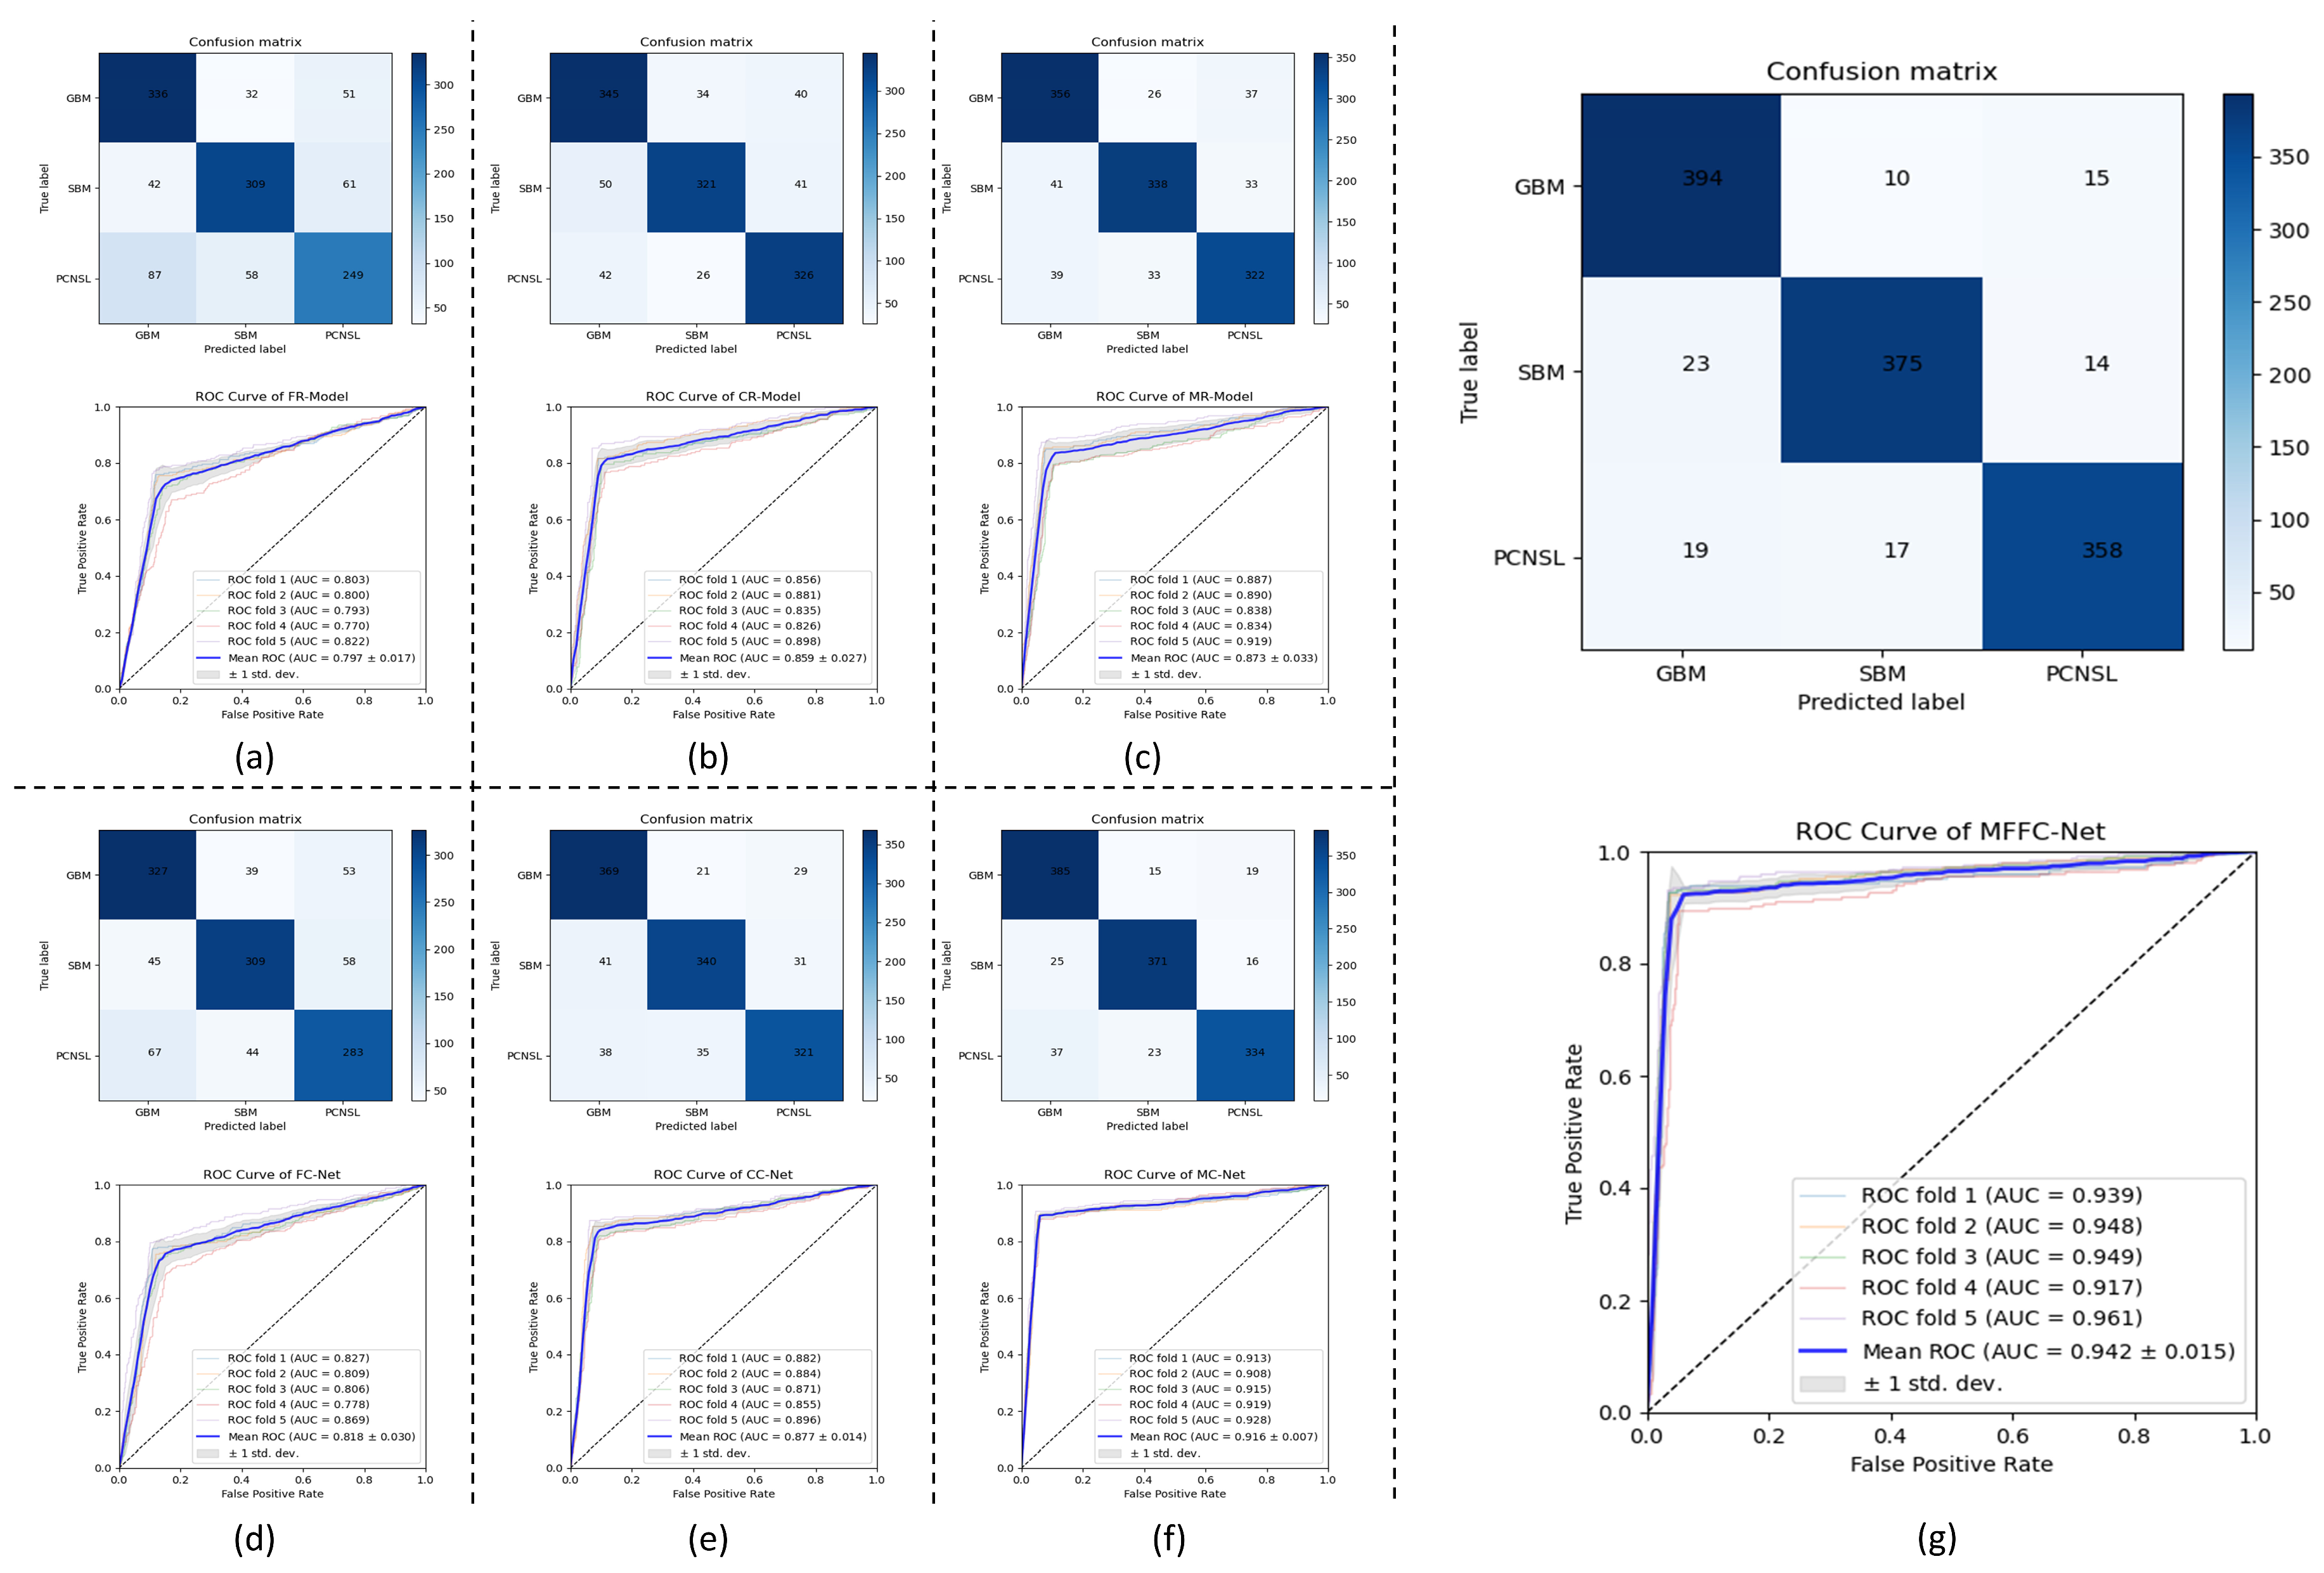
| Methods | ACC | PPV | SEN | SPE | F1-Score | AUC |
|---|---|---|---|---|---|---|
| FR-Model | 0.730 ± 0.172 | 0.729 ± 0.201 | 0.728 ± 0.210 | 0.865 ± 0.087 | 0.727 ± 0.145 | 0.797 ± 0.017 |
| CR-Model | 0.810 ± 0.121 | 0.811 ± 0.137 | 0.810 ± 0.141 | 0.905 ± 0.051 | 0.809 ± 0.0.84 | 0.859 ± 0.027 |
| MR-Model | 0.829 ± 0.105 | 0.830 ± 0.124 | 0.829 ± 0.131 | 0.915 ± 0.048 | 0.829 ± 0.076 | 0.873 ± 0.033 |
| FC-Net | 0.750 ± 0.155 | 0.750 ± 0.167 | 0.750 ± 0.164 | 0.875 ± 0.082 | 0.749 ± 0.107 | 0.818 ± 0.030 |
| CC-Net | 0.841 ± 0.086 | 0.842 ± 0.107 | 0.840 ± 0.112 | 0.920 ± 0.032 | 0.841 ± 0.070 | 0.877 ± 0.014 |
| MC-Net | 0.890 ± 0.052 | 0.891 ± 0.083 | 0.889 ± 0.085 | 0.945 ± 0.023 | 0.890 ± 0.061 | 0.916 ± 0.077 |
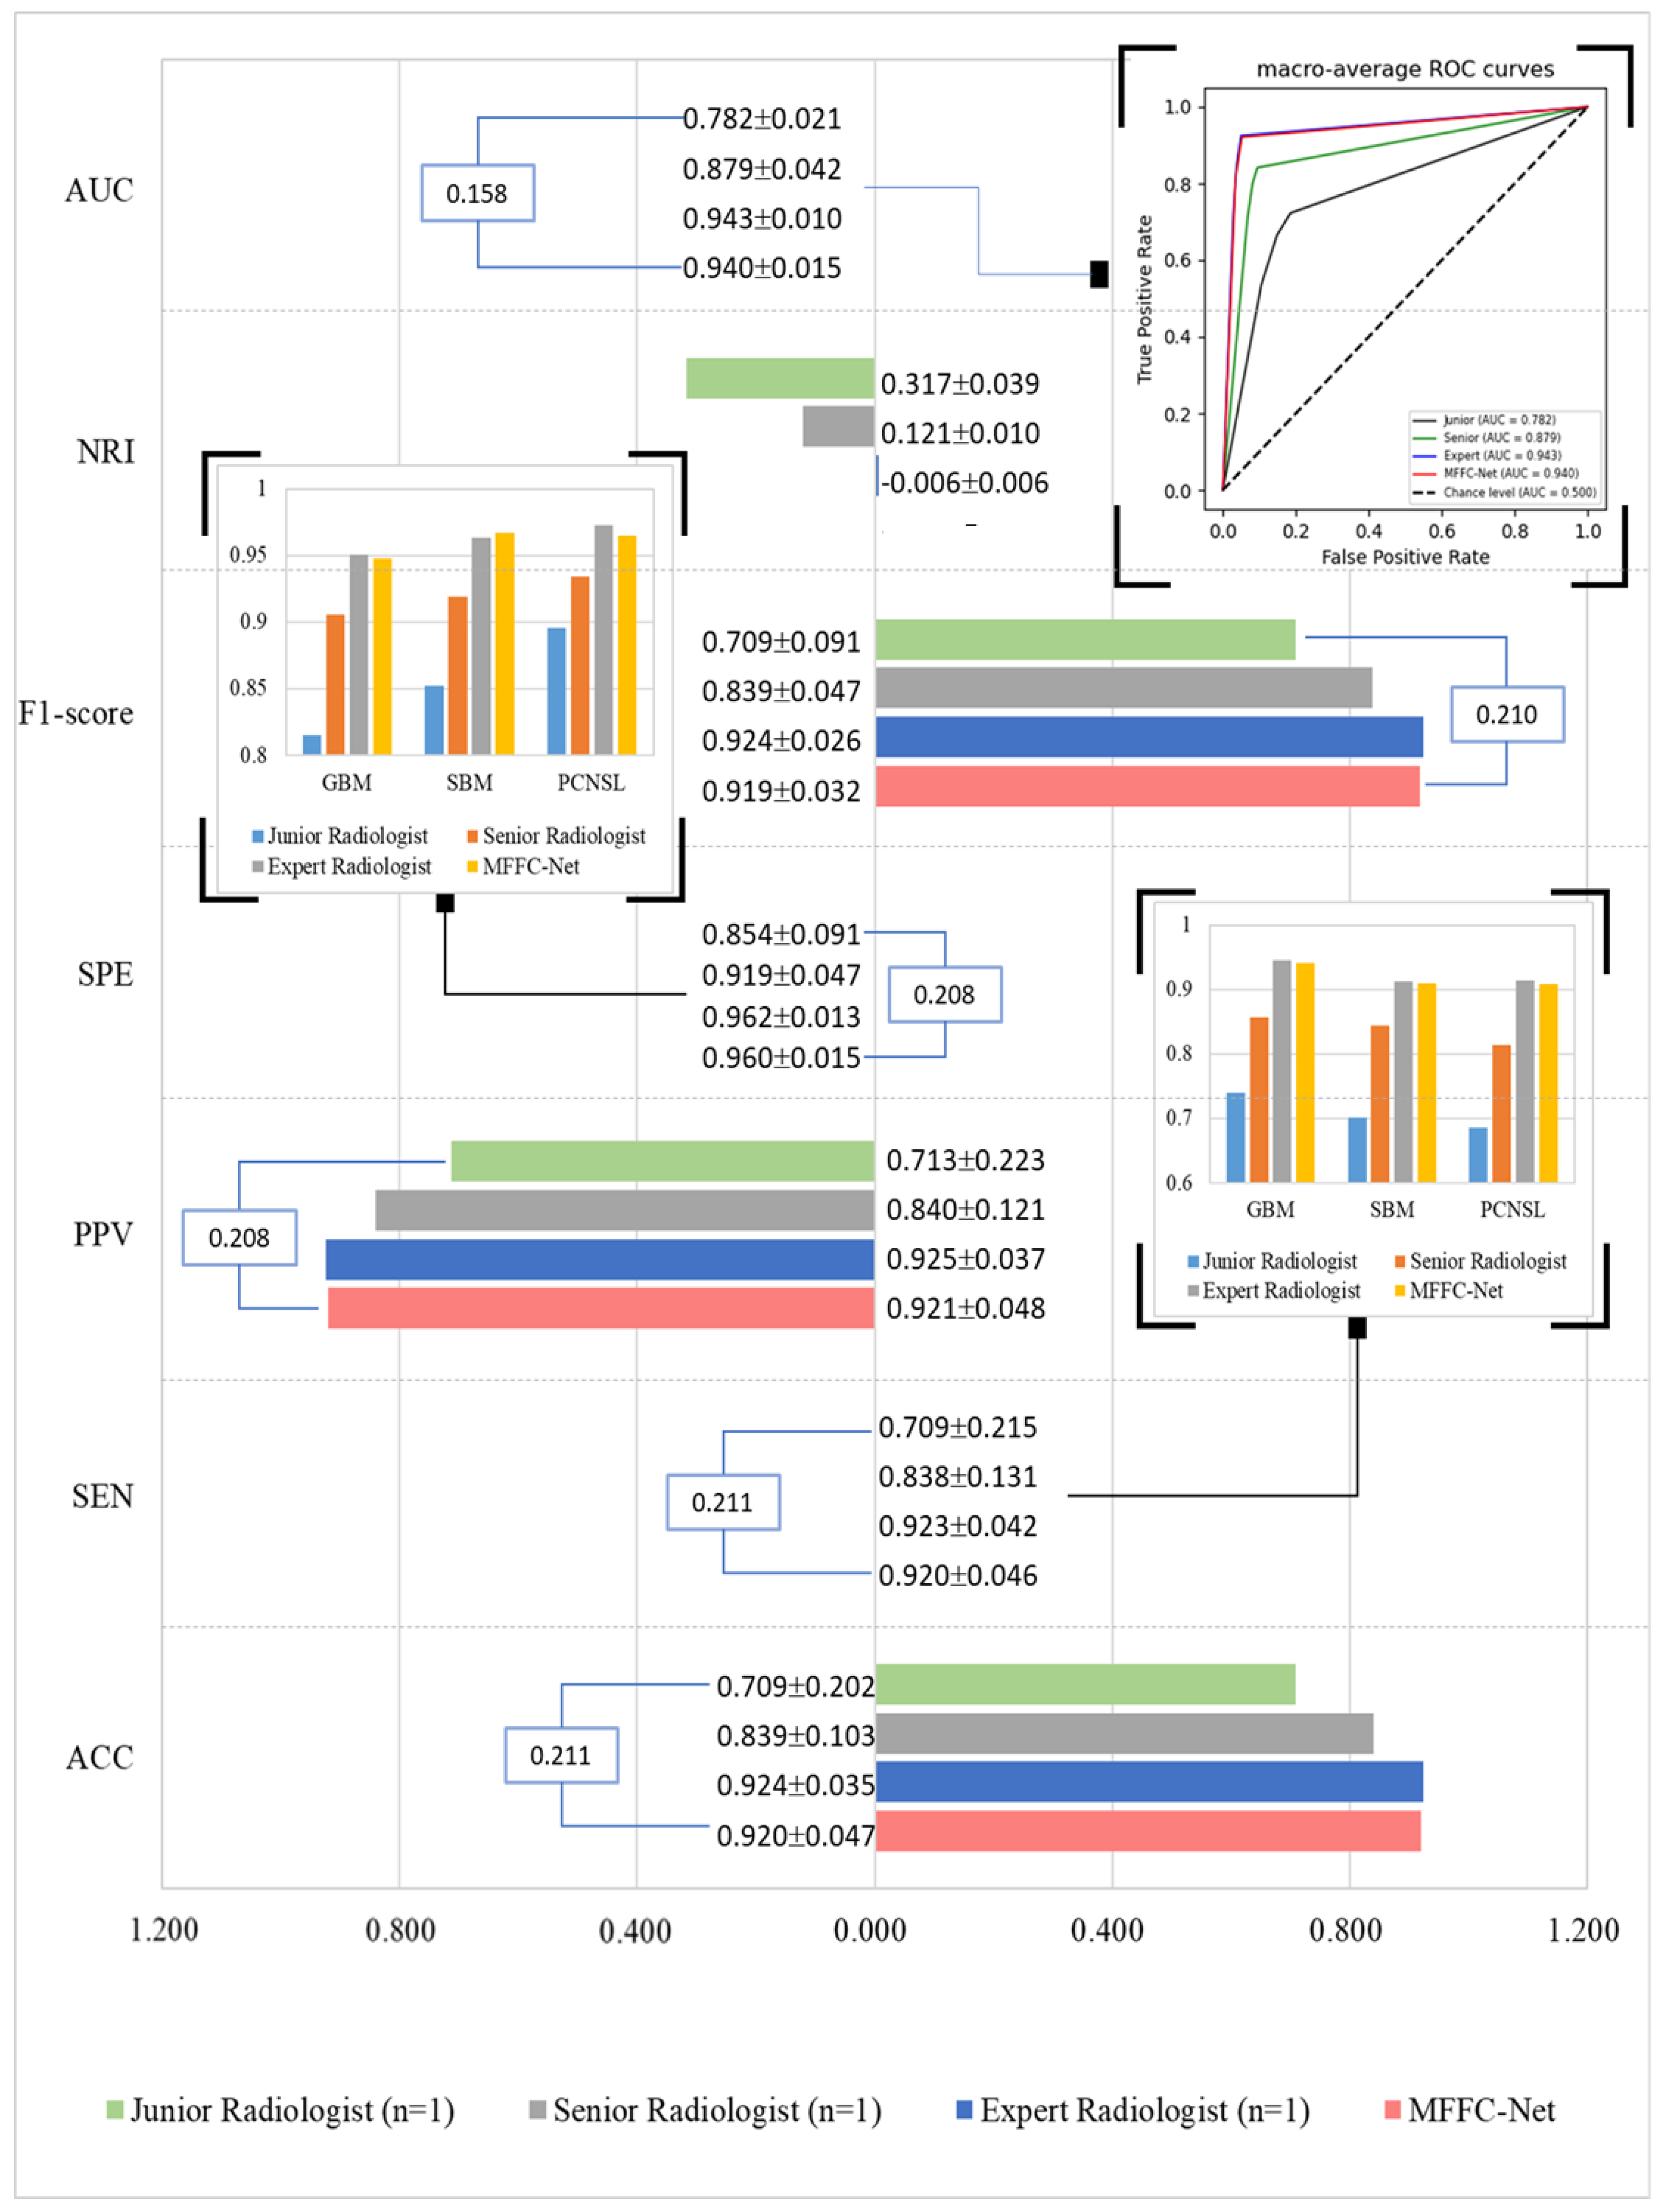
| MFFC-Net | 0.920 ± 0.047 | 0.921 ± 0.048 | 0.920 ± 0.046 | 0.960 ± 0.015 | 0.919 ± 0.032 | 0.942 ± 0.015 |
| Methods | ACC | PPV | SEN | SPE | F1-Score | AUC |
|---|---|---|---|---|---|---|
| DenseNet | 0.886 ± 0.046 | 0.887 ± 0.045 | 0.885 ± 0.042 | 0.943 ± 0.012 | 0.885 ± 0.029 | 0.913 ± 0.010 |
| SENet | 0.906 ± 0.048 | 0.907 ± 0.058 | 0.905 ± 0.063 | 0.953 ± 0.021 | 0.906 ± 0.050 | 0.930 ± 0.013 |
| EfficientNetV2-S | 0.918 ± 0.054 | 0.919 ± 0.060 | 0.918 ± 0.057 | 0.959 ± 0.032 | 0.918 ± 0.401 | 0.938 ± 0.015 |
| MFFC-Net | 0.920 ± 0.047 | 0.921 ± 0.048 | 0.920 ± 0.046 | 0.960 ± 0.015 | 0.919 ± 0.032 | 0.942 ± 0.015 |
Disclaimer/Publisher’s Note: The statements, opinions and data contained in all publications are solely those of the individual author(s) and contributor(s) and not of MDPI and/or the editor(s). MDPI and/or the editor(s) disclaim responsibility for any injury to people or property resulting from any ideas, methods, instructions or products referred to in the content. |
© 2024 by the authors. Licensee MDPI, Basel, Switzerland. This article is an open access article distributed under the terms and conditions of the Creative Commons Attribution (CC BY) license (https://creativecommons.org/licenses/by/4.0/).
Share and Cite
Liu, X.; Liu, J. Aided Diagnosis Model Based on Deep Learning for Glioblastoma, Solitary Brain Metastases, and Primary Central Nervous System Lymphoma with Multi-Modal MRI. Biology 2024, 13, 99. https://doi.org/10.3390/biology13020099
Liu X, Liu J. Aided Diagnosis Model Based on Deep Learning for Glioblastoma, Solitary Brain Metastases, and Primary Central Nervous System Lymphoma with Multi-Modal MRI. Biology. 2024; 13(2):99. https://doi.org/10.3390/biology13020099
Chicago/Turabian StyleLiu, Xiao, and Jie Liu. 2024. "Aided Diagnosis Model Based on Deep Learning for Glioblastoma, Solitary Brain Metastases, and Primary Central Nervous System Lymphoma with Multi-Modal MRI" Biology 13, no. 2: 99. https://doi.org/10.3390/biology13020099
APA StyleLiu, X., & Liu, J. (2024). Aided Diagnosis Model Based on Deep Learning for Glioblastoma, Solitary Brain Metastases, and Primary Central Nervous System Lymphoma with Multi-Modal MRI. Biology, 13(2), 99. https://doi.org/10.3390/biology13020099