Simple Summary
Ammonium (NH4+) is usually toxic to plant growth when used as the sole or dominant N source. Exploring the underlying molecular mechanisms of NH4+ toxicity and how to minimize NH4+ toxicity may greatly benefit crop productivity. In this study, the underlying mechanism of NH4+ toxicity and bicarbonate (HCO3−)-dependent alleviation in wheat was investigated. Comprehensive transcriptomic and physiological analyses suggested that NH4+ nutrition alone stimulated fermentation and glycolysis, promoted the activity of alternative respiratory pathways, suppressed TCA cycle pathways, and reduced ATP synthesis; adding HCO3− relieved the toxic effects of NH4+ nutrition. Our results reveal the importance of C and N interactions for alleviating NH4+ toxicity, likely by mitigating root hypoxic stress. As the first report on the hypoxic stress triggered by NH4+ treatment, this study provides novel insights into the mechanisms of NH4+ toxicity and its alleviation, which may present potential solutions for improving the nitrogen use efficiency in wheat.
Abstract
Ammonium (NH4+) toxicity is ubiquitous in plants. To investigate the underlying mechanisms of this toxicity and bicarbonate (HCO3−)-dependent alleviation, wheat plants were hydroponically cultivated in half-strength Hoagland nutrient solution containing 7.5 mM NO3− (CK), 7.5 mM NH4+ (SA), or 7.5 mM NH4+ + 3 mM HCO3− (AC). Transcriptomic analysis revealed that compared to CK, SA treatment at 48 h significantly upregulated the expression of genes encoding fermentation enzymes (pyruvate decarboxylase (PDC), alcohol dehydrogenase (ADH), and lactate dehydrogenase (LDH)) and oxygen consumption enzymes (respiratory burst oxidase homologs, dioxygenases, and alternative oxidases), downregulated the expression of genes encoding oxygen transporters (PIP-type aquaporins, non-symbiotic hemoglobins), and those involved in energy metabolism, including tricarboxylic acid (TCA) cycle enzymes and ATP synthases, but upregulated the glycolytic enzymes in the roots and downregulated the expression of genes involved in the cell cycle and elongation. The physiological assay showed that SA treatment significantly increased PDC, ADH, and LDH activity by 36.69%, 43.66%, and 61.60%, respectively; root ethanol concentration by 62.95%; and lactate efflux by 23.20%, and significantly decreased the concentrations of pyruvate and most TCA cycle intermediates, the complex V activity, ATP content, and ATP/ADP ratio. As a consequence, SA significantly inhibited root growth. AC treatment reversed the changes caused by SA and alleviated the inhibition of root growth. In conclusion, NH4+ treatment alone may cause hypoxic stress in the roots, inhibit energy generation, suppress cell division and elongation, and ultimately inhibit root growth, and adding HCO3− remarkably alleviates the NH4+-induced inhibitory effects on root growth largely by attenuating the hypoxic stress.
1. Introduction
Nitrogen (N) is one of most essential nutrients for plant growth and development and is involved in the biosynthesis of proteins, nucleic acids, chlorophyll, and several hormones [1,2,3]. Therefore, appropriate N fertilizer use is critical in increasing crop yield and improving the quality of agricultural products. Ammonium (NH4+) and nitrate (NO3−) are the two main N sources for plants [4,5,6]. NH4+ can be more directly assimilated by plant cells, while NO3− uptake and reduction (i.e., conversion of NO3− to NH4+ via the actions of nitrate reductase and nitrite reductase) consume large amounts of ATP and reducing equivalents, and the resulting NH4+ is then used by plants [5,7,8]. Therefore, it is widely acknowledged that NH4+ is the preferred N source with respect to energy cost.
To increase crop yields, farmers tend to apply excessive N fertilizers; however, only 30–40% of the fertilizer is estimated to be taken up by plant roots [8,9]. Moreover, excess N fertilizer application often suppresses crop growth, decreases kernel yield, and causes environmental pollution [10]. In particular, when using NH4+ as the sole N source, most plants exhibit severe growth retardation, leaf chlorosis, a lower net photosynthetic rate, and other toxic symptoms, commonly referred to as NH4+ syndrome [11,12]. Therefore, optimizing N fertilization can improve nitrogen use efficiency (NUE), reduce the cost of N inputs, and decrease environmental pollution [13].
An increasing amount of research has been conducted with the aim of unraveling the mechanisms underlying NH4+ syndrome in plants, and numerous studies have proposed hypotheses to explain NH4+ toxicity, including ion imbalance of the essential cations (K+, Ca2+, Mg2+, Fe2+/3+, Zn2+, SO42−, and PO43−) [6,14,15], acidification of the apoplast and rhizosphere and transient alkalization of the cytosol [16,17], ATP overconsumption and waste [14,18], carbon (C) reserve deprivation caused by the excess consumption of soluble sugars during NH4+ assimilation [19], the accumulation of amino acids and depletion of organic acids [20], imbalanced hormone interactions [6,21], and reduced photosynthesis [14]. However, several hypotheses are controversial and the mechanisms of NH4+ phytotoxicity are not fully understood [15,22].
Many studies have been conducted to elucidate the underlying mechanisms by which exogenous substances alleviate NH4+ toxicity. It was found that elevated potassium (K+) reduced futile NH4+ cycling on the plasma membrane in rice (Oryza sativa L.) [23], and decreased vacuolar H+-ATPase activity and inhibited NH4+ accumulation in Arabidopsis thaliana roots [24]. Low levels of NO3− attenuate NH4+ toxicity by upregulating ACLA-3 (encoding ATP-citrate lyase A-3) and increasing the production of several key metabolites in the tricarboxylic acid (TCA) cycle in Panax notoginseng [25] and wheat [7]. SnRK1.1 allows SLAH3-mediated NO3− efflux by phosphorylating the C-terminal of SLAH3 at site S601, thereby alleviating high-NH4+/low-pH stress in Arabidopsis thaliana [26]. Exogenous α-ketoglutarate (KGA), a key C skeleton for N assimilation, alleviates NH4+ stress in tomato (Solanum lycopersicum L.) [27]. Silicon (Si) alleviates NH4+ toxicity by accelerating NH4+ assimilation via the actions of glutamine synthetase, glutamate synthase, and glutamate dehydrogenase in cabbage (Brassica campestris L.) [28] or increasing the shoot cytokinin content in tomato [29].
When used as the dominant N source, NH4+ stimulates respiratory O2 consumption in Arabidopsis, barley (Hordeum vulgare L.), wheat, and maize (Zea mays L.) to meet the needs of ATP, resulting in higher carbon dioxide (CO2) evolution [30,31,32]. Therefore, the reduced NH4+ toxicity after the exogenous addition of CO32− [33], HCO3− [34], or CO2 [35] may be explained by improved carbohydrate accumulation, balanced C and N metabolism, and a greater ability to cope with the depletion of organic acids [25]. Notably, these changes are involved in the TCA cycle, where intermediates, mainly KGA, can be used as C skeletons for NH4+ assimilation [36,37].
Wheat is one of the most important food crops, and about one third of the global population currently consumes wheat [38]. Improving NUE is important to improve grain yield and processing quality and reduce the cost of wheat production [39]. In this study, comprehensive transcriptomic and physiological analyses were conducted to investigate the underlying mechanisms of NH4+ toxicity and its HCO3−-dependent alleviation in wheat. Our results show that NH4+ nutrition alone stimulated fermentation and glycolysis, promoted the activity of alternative respiratory pathways, suppressed TCA cycle pathways, and reduced ATP synthesis; adding HCO3− relieved the toxic effects of NH4+ nutrition. Our results reveal the importance of C and N interactions for alleviating NH4+ toxicity, likely by mitigating root hypoxic stress.
2. Materials and Methods
2.1. Plant Material and Growth Conditions
Seeds of wheat (cultivar Jimai 22) were surface-sterilized using 70% ethanol for 45 s and washed 5 times with distilled water. The sterilized seeds were then germinated on moist filter paper placed inside Petri dishes at 23 °C. After 3 days, the uniform-sized seedlings were transferred to black plastic pots with dimensions of 10 cm × 8 cm × 5 cm (length, width, height) containing distilled water and grown in a growth chamber at 25 °C/21 °C (day/night) under 14 h/10 h (light/dark) for 5 days under the following conditions: light intensity 450 µmol m−2 s−1 and humidity 70 ± 5%. Each pot contained 15 plants and the distilled water was renewed every 2 days.
In our preliminary experiment, we found that the roots of 8-day-old seedlings grew best in half-strength Hoagland nutrient solution containing 7.5 mM NO3− (Table S1), and 7.5 mM NH4+ showed significant inhibition of root growth compared with 7.5 mM NO3−. An experiment using gradient concentrations showed that 3 mM HCO3− significantly improved the root growth of wheat seedlings fed 7.5 mM NH4+. Therefore, the following experiment was conducted using 8-day-old seedlings that were fixed on polystyrene plates and hydroponically cultured in half-strength Hoagland nutrient solution containing 7.5 mM NO3− (CK, applied as KNO3 and Ca(NO3)2), 7.5 mM NH4+ (sole ammonium (SA), applied as 7.5 mM NH4Cl), or 7.5 mM NH4+ + 3 mM HCO3− (ammonium and bicarbonate (AC), applied as 7.5 mM NH4Cl and 3 mM KHCO3). The solutions were renewed every 2 days. Each treatment was repeated in triplicate. Potassium in the nutrient solution was balanced by the addition of K2SO4.
2.2. Measurement of Plant Fresh Weight (FW)
Wheat seedlings were collected at 24, 48, 72, and 96 h after treatment and separated into shoots and roots, which were dried with absorbent paper and immediately weighed. Three biologically independent experiments, each with three replicates, were conducted to calculate the net increase in FW.
2.3. Transcriptome Sequencing
2.3.1. RNA Extraction and Detection
Fresh roots (approximately 0.1 g) were fully ground in a mortar with 1 mL RLT and 100 µL PLANTaid at room temperature. The homogenate was transferred to a centrifuge tube, vigorously shaken for 15 s, and centrifuged at 13,000 rpm for 5 min. Then, 450 µL of supernatant was transferred to a new centrifuge tube, and the volume of half absolute ethanol was added, blown, and mixed. The mixture was added to an adsorption column for RA (the adsorption column was placed in the collection tube) and centrifuged at 13,000 rpm for 60 s, and the waste liquid was abandoned. Total RNA extracted from roots underwent RNA-Seq analysis at Novogene (Beijing, China). Three biological replicates of each sample were used for RNA-Seq analysis. RNA quality and quantity were checked using a spectrophotometer (NanoDrop ND-1000 UV-Vis spectrophotometer; Nanodrop Technologies, Wilmington, DE, USA). The integrity of the final RNA samples was checked by denaturing gel electrophoresis on 1.4% (w/v) formaldehyde agarose gels, and the concentration was determined photometrically (NanoDrop). Purified RNA was treated with a Turbo DNase-free kit. cRNA synthesis and labeling, array hybridization, and scanning were performed at imaGenes GmbH (Berlin, Germany).
2.3.2. Library Construction and Quality Inspection
There are 2 ways to construct a library: ordinary NEB construction and chain-specific construction. The NEBNext® Ultra™ RNA Library Prep Kit from Illumina® was used to build the library. After RNA library construction, initial quantification was characterized on 1% agarose gels and examined using the NanoPhotometer® spectrophotometer (Implen, Westlake Village, CA, USA). RNA concentrations were measured using a Qubit® RNA Assay Kit in a Qubit® 2.0 Fluorimeter (Life Technologies, Carlsbad, CA, USA). The RNA integrity number was analyzed by accurate detection of RNA integrity and library insert size using an Agilent Bioanalyzer 2100 system (Agilent Technologies, Santa Clara, CA, USA). After the insert size was determined, effective library concentrations were accurately quantified by qRT-PCR (above 2 nM) to ensure quality.
2.3.3. Sequencing
After inspection, libraries were pooled and sequenced against the effective concentration and target data volume. Four fluorescently labeled dNTP, DNA polymerase, and adapter primers were amplified to the sequenced flow cells. When the sequencing cluster extended the complementary strand, each fluorescently labeled dNTP was released. The sequencer captured the fluorescence signal and the light signal was converted to the sequencing peak through the computer software to obtain the sequence information of the fragments to be measured.
2.3.4. Data Quality Control
The image data of sequencing fragments measured using a high-throughput sequencer were converted into sequence data (reads) by CASAVA bases, which mainly contained the sequence information of the sequencing fragments and the corresponding quality information. The sequencing error rate distribution was checked and Q20, Q30, and GC contents were determined, and a small number of reads with low sequencing quality were filtered out of the raw data to obtain clean reads with high quality for subsequent analysis (Table S2). The clean reads were quickly and accurately aligned to the reference genome using HISAT2-2.1.0 software to obtain the mapping information of reads on the reference genome.
2.4. Analysis of Total Differentially Expressed Genes (DEGs)
After quantifying gene expression, we performed a statistical analysis of their expression data to screen the samples for genes with significantly different expression levels in different states. The original read count was first standardized (normalized) and mainly corrected for sequencing depth. The statistical model then calculated the hypothesis testing probability (Padj) and performed multiple-hypothesis test correction to obtain the false discovery rate (FDR, commonly notated as Padj). Finally, the number of DEGs for each comparative combination was counted and screened to analyze the expression of target genes.
2.5. GO and KEGG Enrichment Analysis of DEGs
Gene Ontology (GO) proteome annotation and the Kyoto Encyclopedia of Genes and Genomes (KEGG) database were used to annotate pathways, and they were derived from the online DAVID Bioinformatics tools (https://david.ncifcrf.gov/home.jsp; accessed on 28 March 2023). First, identified gene IDs were converted to Entrez gene IDs and then mapped to GO IDs by gene ID. GO is a comprehensive database describing gene function, divided into three parts: biological process (BP), cellular component (CC), and molecular function (MF). Correction for multiple hypothesis tests was carried out by using standard false discovery rate control methods. In the following discussion, GO functional enrichment was determined with Padj < 0.05 as the threshold for significance. KEGG is a comprehensive database that integrates information on genomic, chemical, and systematic functions. KEGG pathway enrichment analysis of DEGs was performed with Padj < 0.05 as the threshold for significance.
2.6. Enzymatic Assays
Fresh root tissue (approximately 1.0 g) was added with 1.6 mL of pre-cooled phosphate buffer (1 mM AsA, 3 mM β-mercaptoethanol, 0.5 mM PMSF, 2% PVP, 1 mM EDTA, pH 7.8). The mixture was ground with liquid nitrogen, the extract was centrifuged at 4 °C at 12,000× g for 20 min, and the supernatant was used for the determination of enzyme activity. Complex V, pyruvate decarboxylase (PDC), alcohol dehydrogenase (ADH), lactate dehydrogenase (LDH), pyruvate kinase (PK), and pyruvate dehydrogenase complex (PDHC) activity was determined using commercial chemical detection kits (Comin, Suzhou Comin Biotechnology Co., Ltd., Suzhou, China) according to the instructions provided by the manufacturer. Absorbance measurement was performed using a 96-well microplate reader (Rayto RT-6100, Rayto Company, Shenzhen, China), and the corresponding calculation formula was used to calculate enzyme activity.
2.7. Ethanol and Organic Acid Determination
Fresh roots (approximately 2.0 g) were homogenized using a mortar and pestle with 10 mL of pre-chilled extracting solution (80% methanol v/v, 100 mM imidazole, pH 7.0) and then heated at 80 °C for 15 min. The homogenate was transferred into 2 mL Eppendorf tubes and centrifuged at 8000× g at 4 °C for 10 min, and then the supernatant was collected. The concentrations of ethanol, lactate (LA), pyruvate (Pyr), acetyl-CoA, citrate (CA), KGA, succinate, fumarate, malate, oxaloacetic acid (OAA), alanine (Ala), γ-aminobutyric acid (GABA), formate, tryptophan (Trp), tyrosine (Tyr), and phenylalanine (Phe) were determined using commercial chemical detection kits (Comin, Suzhou Comin Biotechnology Co., Ltd., Suzhou, China). The spectrophotometric value of the solution was measured using a spectrophotometer (Varian Cary 100) or a microplate reader (Rayto RT-6100, Rayto Company, Shenzhen, China). The metabolite concentrations were calculated according to the manufacturer’s instructions.
2.8. Measurement of ATP and ADP Content
Fresh roots (approximately 1.0 g) were homogenized using a mortar and pestle with 5 mL of extracting solution (96% ethanol, 0.1 M EDTA, pH 7) at 78 °C. This homogenate was heated in a boiling water bath for 1 min and filled with nitrogen for 10 min, and then the supernatant was diluted with available Tris-EDTA. The ATP and ADP content was measured on ice by chemiluminescent analysis using commercial chemical detection kits (Comin, Suzhou Comin Biotechnology Co., Ltd., Suzhou, China) according to the manufacturer’s instructions.
2.9. Quantitative Reverse Transcription Polymerase Chain Reaction (qRT-PCR)
qRT-PCR was conducted using TaqPro Universal SYBR qPCR Mastermix (Q712-02, Vazyme, Nanjing, China) according to the manufacturer’s instructions. Three independent biological repetitions were performed. qRT-PCR was performed under the following conditions: 95 °C for 3 min, followed by 40 cycles of 95 °C for 10 s, 58 °C for 30 s, and 72 °C for 30 s. The glyceraldehyde 3-phosphate dehydrogenase gene was used as the reference gene. The obtained Cq values were used as the original data to calculate the relative expression levels of DEGs via the 2−ΔΔcq method.
2.10. Statistical Analysis
All data analyses were conducted with Data Processing System (DPS) statistical software (DPS 10.05, Hangzhou, Zhejiang, China), and the least-significant-different (LSD) test (p ≤ 0.05) was used to compare significant differences between treatments.
3. Results
3.1. Plant Growth
No significant difference in the net increase in shoot FW of the wheat seedlings was observed between CK, AC, and SA treatments at 24, 48, 72, and 96 h (Figure 1a,c). At 24 h, no significant difference in the net increase in root FW was observed between CK, SA, and AC treatments (Figure 1b). However, the net increase in root biomass of the SA-treated wheat seedlings was significantly decreased at 48, 72, and 96 h compared to CK, while the net increase under AC treatment was increased compared to SA (Figure 1b,c). These results indicate that NH4+ treatment suppresses root growth and the addition of HCO3− partially restores root growth.
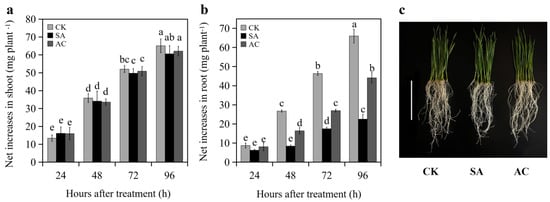
Figure 1.
Net increase in (a) shoot and (b) root fresh weight (mean ± SD) of wheat seedlings at 24, 48, 72, and 96 h after treatment, and (c) seedling phenotype grown with different treatments at 48 h. Different letters above columns indicate significant differences between treatments at p ≤ 0.05. In (c), bar = 10 cm. Wheat seedlings were treated with 7.5 mM NO3− (CK), 7.5 mM NH4+ (SA), or 7.5 mM NH4+ + 3 mM HCO3− (AC).
3.2. DEGs under Different N Treatments
After filtering out low-quality reads and adapter sequences, a total of 1.38 billion clean reads were obtained with a Q30-based percentage of 91.16% and an average GC content above 55.4%. Combining the GC content and Q30, we believed that the sequencing results were highly accurate and relatively reliable for further experimental analysis.
We performed differential significance analysis of DEGs from the roots of three plant groups (CK, SA, and AC) and conducted paired comparisons between wheat roots subjected to different N treatments. Our screening criteria for significance of DEGs were |log2 (fold change)| ≥ 1 and p ≤ 0.05. In the comparison between SA and CK, a total of 97,506 DEGs were identified, of which 5738 DEGs were upregulated and 6449 DEGs were downregulated. In AC vs. CK, 96,653 DEGs were identified, including 369 upregulated and 81 downregulated DEGs. In AC vs. SA, 97,383 DEGs were identified, with 10,507 upregulated and 9692 downregulated DEGs (Figure 2). These data suggest that the roots strongly respond to NH4+ stress and that the HCO3−-dependent alleviation of NH4+ stress is extremely complex.
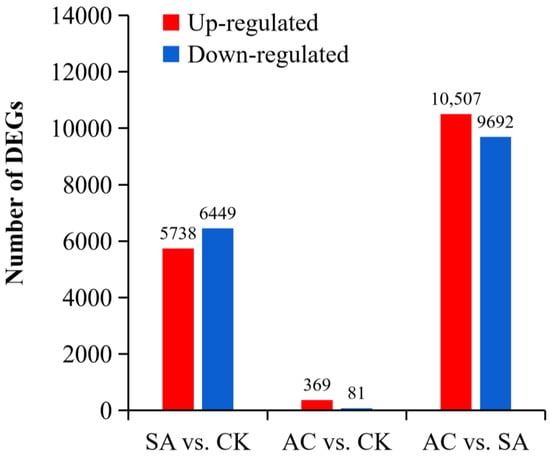
Figure 2.
Paired comparisons of DEGs between N treatments. Red and blue represent up- and downregulated expression, respectively. Wheat seedlings were treated with 7.5 mM NO3− (CK), 7.5 mM NH4+ (SA), or 7.5 mM NH4+ + 3 mM HCO3− (AC).
3.3. Expression of Fermentation Genes and Concentration of Fermentation Products
The expression of fermentation transcripts, PDC, ADH, LDH, alanine aminotransferase (AlaAT), and NAD-dependent formate dehydrogenase (FDH) was upregulated under SA treatment at 48 h compared with CK. However, under AC treatment, the expression of these DEGs was significantly downregulated compared with SA treatment (Figure 3).
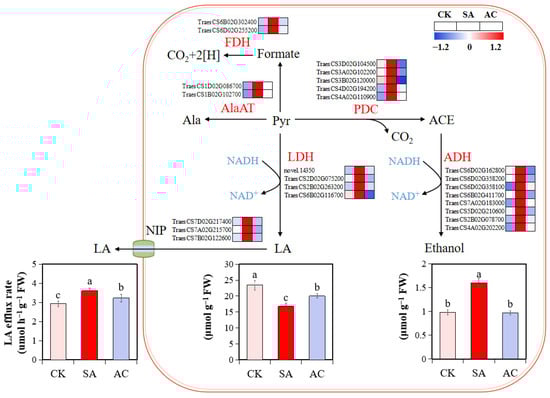
Figure 3.
Influence of N treatments on fermentation pathway. Heatmap shows expression levels of identified DEGs in roots of wheat plants with different treatments. Numbers in color scale bar indicate log2 (FC) in gene expression. Wheat seedlings were treated with 7.5 mM NO3− (CK), 7.5 mM NH4+ (SA), or 7.5 mM NH4+ + 3 mM HCO3− (AC). Different letters above bars indicate significant differences at p ≤ 0.05. ACE, acetaldehyde; ADH, alcohol dehydrogenase; Ala, alanine; AlaAT, alanine aminotransferase; FDH, formate dehydrogenase; LA, lactate; LDH, lactate dehydrogenase; NIP, nodulin intrinsic proteins; PDC, pyruvate decarboxylase; Pyr, pyruvate.
To further verify whether high NH4+ causes hypoxic stress in wheat roots, the contents of fermentation products were determined. The results show that NH4+ alone caused a significant accumulation of ethanol (62.95% increase compared to CK) in the roots (Figure 3). Although the root LA content was decreased in wheat plants under SA treatment, the LA content in the nutrient solution was increased by 23.20%, suggesting that a larger amount of LA was released from the root to apoplast and then to the medium. However, root ethanol accumulation and LA efflux rate were decreased by 39.36% and 10.44%, respectively, after the application of HCO3− (Figure 3). These results suggest that NH4+ alone may induce low O2 stress in the root cells, leading to alcohol and lactate fermentation; the HCO3−-dependent alleviation of NH4+ stress may be associated with the relief of low O2 stress and the lower accumulation of fermentation products.
3.4. Expression of Genes Involved in Hypoxic Stress
To further verify whether SA treatment would induce hypoxic stress in terms of root growth, 11 classes of hypoxia-inducible genes were collected from previous publications (Table 1). Among these genes, hypoxia-inducible factor (HIF), burst oxidase homologs (Rbohs), internal and external alternative NADH dehydrogenase, alternative oxidases (AOXs), nodulin intrinsic proteins (NIPs), aspartate aminotransferase (AspAT), AlaAT, the pivotal enzymes of γ-aminobutyric acid (GABA shunt (glutamate decarboxylase (GAD), GABA transaminase (GABA-T), and succinate-semialdehyde dehydrogenase (SSADH)), ethylene biosynthesis, mitochondrial dicarboxylate carrier, mitochondrial arginine carrier, SLAH3, allene oxide synthase, and nudix hydrolase were significantly upregulated under NH4+ alone and downregulated after the application of HCO3−. On the contrary, prolyl 4-hydroxylases (PHDs), plasma membrane intrinsic proteins (PIPs), non-symbiotic hemoglobins (PGBs), DNA methylation, and chromatin structure regulatory mechanisms were significantly downregulated under NH4+ treatment and upregulated after the addition of HCO3−. The differential expression of these genes under SA is highly consistent with what was previously reported in plants under hypoxic stress (Table 1; for NIPs, see Figure 3), further suggesting that NH4+ treatment alone may induce hypoxic stress in wheat roots.

Table 1.
List of genes related to hypoxic stress in wheat roots.
3.5. Expression of DEGs Involved in O2 Transport or Consumption Processes
To explore the possible causes of SA-induced hypoxic stress, we analyzed the transcript abundance of genes involved in O2 transport or consumption processes. The results show that the expressions of 14 genes encoding PIP-type AQPs were significantly downregulated and those of 5 genes encoding Rbohs were significantly upregulated under SA treatment (Table 1), and after the addition of HCO3−, the PIP AQPs were significantly upregulated and Rbohs genes were significantly downregulated (Table 1).
A total of 255 DEGs encoding dioxygenases were screened between N treatments. In the comparison between SA and CK, 47 DEGs were significantly upregulated and 13 DEGs were markedly downregulated (Figure 4). The upregulated dioxygenases are mainly involved in ethylene synthesis (1-aminocyclopropane-1-carboxylate oxidase 1 (ACO)), ABA synthesis (9-cis-epoxycarotenoid dioxygenase 1), auxin oxidation (2-oxoglutarate-dependent dioxygenase (DAO)), gibberellin 2-beta-hydroxylation (gibberellin 2-beta-dioxygenase 2), and fatty acid desaturation (fatty acid dioxygenase AlphaDOX1), while the downregulated DEGs are mainly involved in iron (Fe) transport (2′-deoxymugineic-acid 2′-dioxygenases). However, in AC vs. SA, 19 DEGs were significantly upregulated and 67 DEGs were significantly downregulated (Figure 4). Generally, these genes showed the opposite expression pattern to that in SA vs. CK. In short, the majority of DEGs encoding dioxygenases were significantly upregulated in the roots with NH4+ treatment alone, while most DEGs were generally downregulated after the addition of external HCO3− (Figure 4).
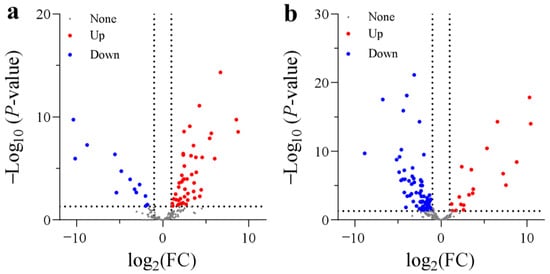
Figure 4.
Volcano plots of DEGs encoding dioxygenases: (a) SA vs. CK; (b) AC vs. SA. Wheat seedlings were treated with 7.5 mM NO3− (CK), 7.5 mM NH4+ (SA), or 7.5 mM NH4+ + 3 mM HCO3− (AC). Red and blue dots indicate upregulated and downregulated DEGs, respectively, and gray dots indicate genes that were not differentially expressed. Images were created using GraphPad Prism 9.4.1.
3.6. Glycolysis, Pyruvate Metabolism, TCA Cycle, Fermentation, Shikimate Pathway, and GABA Shunt
The expression levels of DEGs involved in glycolysis, including phosphofructokinase (PFK), orthologs to phosphoglycerate kinase (PGK), and enolase (ENO), were generally upregulated in roots under SA treatment compared to CK, except for hexokinase (HK) (Figure 5). After the addition of HCO3−, the expression of DEGs encoding glycolytic enzymes, including PFK, PGK, and ENO, was downregulated, while HK was upregulated (Figure 5). These results indicate that the flux of glycolysis may be increased under NH4+ treatment and downregulated with the addition of HCO3−.
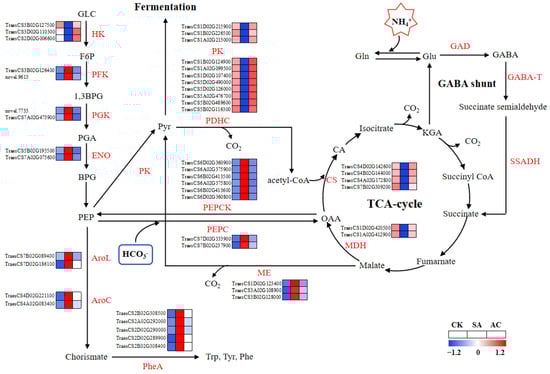
Figure 5.
Glycolysis and TCA cycle pathways overrepresented among differentially expressed genes and significantly changed metabolites. Color gradient indicates expression levels of DEGs from low (blue) to high (red). Wheat seedlings were treated with7.5 mM NO3− (CK), 7.5 mM NH4+ (SA), or 7.5 mM NH4+ + 3 mM HCO3− (AC). AroC, chorismate synthetase; AroL, shikimate kinase; BPG, bisphosphoglycerate; 1,3 BPG, 1,3-bisphosphoglycerate; CA, citrate; CS, citrate synthase; ENO, enolase; F6P, fructose-6-phosphate; GABA, γ-aminobutyric acid; GABA-T, GABA transaminase; GAD, glutamate decarboxylase; GLC, glucose; Gln, glutamine; Glu, glutamate; HK, hexokinase; KGA, α-ketoglutarate; MDH, malate dehydrogenase; ME, malic enzyme; OAA, oxaloacetic acid; PDHC, pyruvate dehydrogenase complex; PEP, phosphoenolpyruvate; PEPC, phosphoenolpyruvate carboxylase; PEPCK, phosphoenolpyruvate carboxylase kinase; PFK, phosphofructokinase; PGA, 3-phosphoglycerate; PGK, phosphoglycerate kinase; Phe, phenylalanine; PheA, prephenate dehydratase; PK, pyruvate kinase; Pyr, pyruvate; SSADH, succinate-semialdehyde dehydrogenase; Trp, tryptophan; Tyr, tyrosine.
As shown in Figure 5, SA enhanced the transcript levels of DEGs encoding phosphoenolpyruvate carboxylase (PEPC), phosphoenolpyruvate carboxylase kinase (PEPCK), and NADP-malic enzyme (ME) for anaplerotic routes associated with the TCA cycle, while AC decreased the transcript levels of these genes. In the pyruvate metabolism and TCA cycle pathways, the expression of DEGs encoding PK, PDHC, malate dehydrogenase (MDH), and citrate synthase (CS) was downregulated under NH4+ treatment. After the addition of HCO3−, the expression of DEGs encoding PK, PDHC, MDH, and CS was upregulated (Figure 5). Briefly, these data indicate that the capacity of the TCA cycle may be suppressed in roots when wheat plants are exposed to NH4+ alone and may be promoted when HCO3− is added.
The physiological assay showed that the activity of PDC, ADH, and LDH in roots was significantly increased by 36.69%, 43.66%, and 61.60%, respectively, under SA treatment and decreased by 19.69%, 13.52%, and 32.57% after the addition of HCO3−, whereas the activity of PK and pyruvate dehydrogenase (PDH) in roots decreased by 11.29% and 11.15%, respectively, under NH4+ treatment and increased by 4.37% and 93.17% after the addition of HCO3− (Table 2), which was highly consistent with the RNA-Seq results (Figure 5).
Table 2.
Fermentation and Pyr metabolism enzyme activity.
The concentrations of Ala, formate, aromatic amino acids (Trp, Tyr, and Phe), and GABA increased significantly in the roots of wheat plants under SA treatment compared with CK. The addition of HCO3− led to the decreased synthesis of these amino acids and formate. The concentrations of TCA cycle intermediates, including Pyr, CA, KGA, succinate, fumarate, malate, and OAA, were significantly decreased in the roots when subjected to SA treatment, while under AC treatment, the concentrations were increased (Table 3).
Table 3.
Effects of N treatments on concentrations of metabolites from amino acid metabolism, Pyr metabolism, TCA cycle, and GABA shunt in roots.
3.7. ATP Synthesis
All DEGs encoding ATP synthases were downregulated under SA treatment and upregulated when HCO3− was added (Figure 6a). Accordingly, the activity of complex V significantly decreased in the roots under SA compared with CK and significantly increased under AC compared with SA (Figure 6b). As a consequence, root ATP content decreased and ADP content increased, resulting in a lower ATP/ADP ratio under SA treatment compared with CK (Figure 6c,d). Adding HCO3− led to a significant increase in ATP content and decrease in ADP content, resulting in a higher ATP/ADP ratio compared with SA (Figure 6c,d).
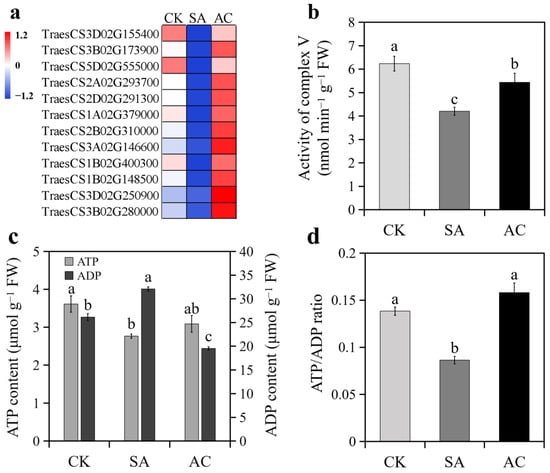
Figure 6.
Effects of N treatments on ATP synthesis in roots of wheat seedlings: (a) expression of DEGs encoding ATP synthases; (b) activity of root complex V; (c) ATP and ADP content; (d) ratio of ATP to ADP. Values represent mean ± SD from three independent biological replicates. Different lowercase letters above columns indicate significant differences at p < 0.05. Wheat seedlings were treated with 7.5 mM NO3− (CK), 7.5 mM NH4+ (SA), or 7.5 mM NH4+ + 3 mM HCO3− (AC).
3.8. DEGs Involved in Cell Division and Elongation
A total of 72 DEGs, including 40 genes encoding mitosis-related proteins, 26 genes associated with cell division, and 6 genes involved in cell elongationin the roots, were downregulated by SA treatmentand upregulated by AC treatment (Table 4). Taken together, these data suggest that NH4+ alone can suppress the rate of cell division in meristems and cell elongation in the elongation zone, thereby decreasing root growth, while adding HCO3− promotes the cell cycle rate and restores root growth.
Table 4.
Differentially expressed genes related to cell division and cell elongation in wheat roots under different N treatments.
3.9. Functional Analysis of DEGs
Using GO classification, DEGs were classified into three functional categories: BP, CC, and MF. GO analysis showed that in SA vs. CK, the main categories in the BP group included microtubule-based movement, cell wall biogenesis, chromosome condensation, the mitotic cell cycle, DNA replication initiation, and pre-replicative complex assembly that is involved in nuclear cell cycle DNA replication. The DEGs in the CC group were mainly classified into the cell wall, microtubule, DNA replication preinitiation complex, and chromosome. The DEGs in the MF group were classified as electron carrier activity, DNA replication origin binding, the structural constituent of the cytoskeleton, nucleosomal DNA binding, DNA helicase activity, and glutamate-ammonia ligase activity (Figure 7a). In AC vs. SA, the main enriched DEGs in the BP group were associated with microtubule-based movement, cell wall biogenesis, the mitotic cell cycle, chromosome condensation, the aromatic compound biosynthetic process, and the response to auxin. The DEGs in the CC group mainly included the microtubule, cell wall, membrane, chromosome, DNA replication preinitiation complex, and mitochondrion. The DEGs in the MF group were mainly classified as GTPase activity, ATP-dependent microtubule motor activity, electron carrier activity, DNA replication origin binding, nucleosomal DNA binding, DNA helicase activity, transmembrane transporter activity, and glutathione oxidoreductase activity (Figure 7b).
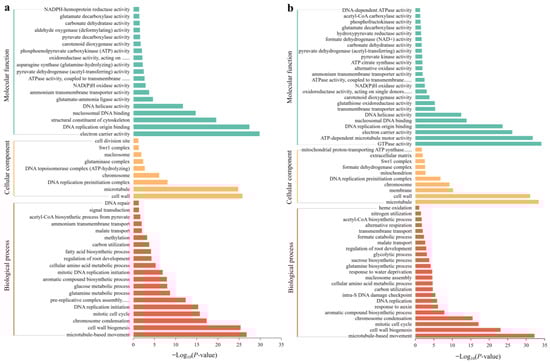
Figure 7.
GO analysis of DEGs under different N treatments: (a) SA vs. CK; (b) AC vs. SA. X-axis indicates −Log10 (p-value), and Y-axis is enriched GO terms.
KEGG analysis revealed that in SA vs. CK, the significantly enriched pathways included DNA replication; amino acid biosynthesis; alanine, aspartate, and glutamate metabolism; amino sugar and nucleotide sugar metabolism; nitrogen metabolism; glycolysis/gluconeogenesis; starch and sucrose metabolism; carbon metabolism; and the citrate cycle (TCA cycle) (Figure 8a). In AC vs. SA, the pathways were mainly clustered in DNA replication; amino acid biosynthesis; carbon metabolism; glycolysis/gluconeogenesis; the pentose phosphate pathway; nitrogen metabolism; alanine, aspartate, and glutamate metabolism; amino sugar and nucleotide sugar metabolism; nucleotide metabolism; the citrate cycle (TCA cycle); beta-alanine metabolism; and pyruvate metabolism (Figure 8b). These results indicate that an array of physiological processes in wheat roots are affected by NH4+ stress.
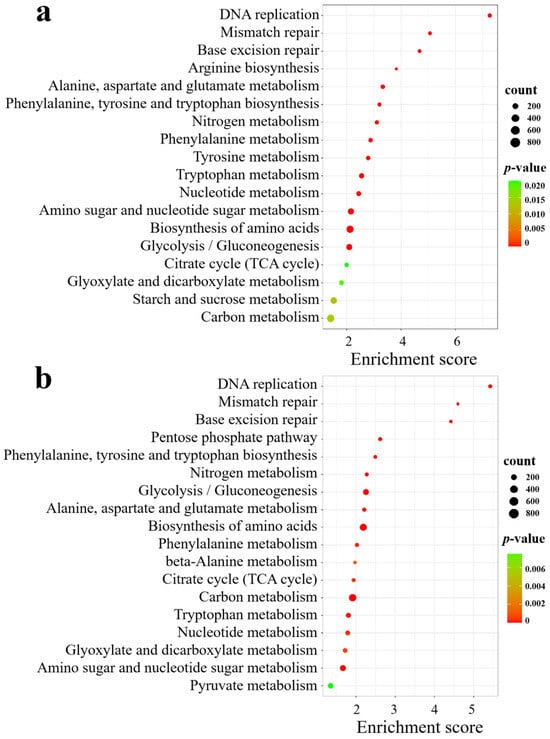
Figure 8.
KEGG analysis of DEGs under different N treatments: (a) SA vs. CK; (b) AC vs. SA. X-axis is enrichment score, Y-axis is KEGG pathway; size of dots represents number of genes annotated to KEGG pathway; and red to green in color bar indicate significance (high to low, respectively) of enrichment.
3.10. Validation of Hub Genes by qRT-PCR
Sixteen hub genes were selected to further verify the reliability of the RNA-Seq data by determining the RNA expression levels. The qRT-PCR results showed that the 7 hub genes, including ADH, 1-aminocyclopropane-1-carboxylate synthase (ACS), and AOXs, were significantly upregulated, and the 9 hub genes, associated with PIP, PDHC, DNA, and chromatin metabolic processes and mitosis, were significantly downregulated in SA vs. CK, while in AC vs. SA, these 16 DEGs showed the reverse expression trend. The qRT-PCR results were highly consistent with those of RNA-Seq analysis (Figure 9).
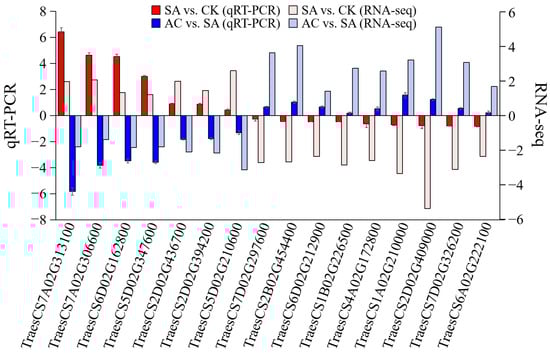
Figure 9.
RNA-Seq data accuracy verification. Column represents 2−ΔΔcq value of qRT-PCR analysis and log2(FC) value of RNA-Seq. Values represent mean ± SD. Positive values on Y-axis indicate upregulation of hub genes, and negative values indicate downregulation. Wheat seedlings were treated with 7.5 mM NO3− (CK), 7.5 mM NH4+ (SA), or 7.5 mM NH4+ + 3 mM HCO3− (AC).
4. Discussion
4.1. HCO3− Alleviates the Inhibition of Root Growth under NH4+ Treatment Alone
Increasing evidence has demonstrated that NH4+ as a dominant N source inhibits root growth in Arabidopsis thaliana, wheat, rice, and other plants [6,7,14,66], suggesting that roots are highly sensitive to NH4+ [25]. In the present study, we found that NH4+ treatment alone inhibited root growth and adding HCO3− attenuated the inhibitory effects of NH4+ (Figure 1a–c).
4.2. Fermentation Is Stimulated by NH4+ and Mitigated after Addition of HCO3−
The underlying mechanisms of NH4+ toxicity remain largely unknown [7,21,26]. In the present study, we found an increased transcript abundance of DEGs encoding PDC, ADH, and LDH; an increased activity of PDC, ADH, and LDH; and subsequent ethanol and LA accumulation under NH4+ treatment, while the addition of HCO3− significantly attenuated these changes (Figure 3 and Figure 9, Table 2). The increased rate of LA efflux under NH4+ treatment may be due to the higher expression of NIPs (Figure 3), as observed in Arabidopsis and other plants under hypoxic conditions [67,68]. These results are highly consistent with the findings reported in Glycine max [69]. Considering that PDC, ADH, and LDH are reliable markers of fermentative processes launched by hypoxic stress [49,51,60], it would be reasonable to assume that NH4+ alone can induce hypoxia in the roots and exogenous HCO3− can attenuate this stress. This assumption corroborates the finding that the plant response to NH4+ may overlap with the response to low O2 stress [32].
4.3. Differential Expression of Hypoxia Response Genes Indicates That NH4+ Induces Cellular O2 Deprivation and HCO3− Alleviates This Stress
Previous studies have reported that numerous hypoxia-inducible factors, such as HIF, Rbohs, internal and external alternative NADH dehydrogenases, AOXs, NIPs, AlaAT, and ethylene biosynthesis, were significantly induced by hypoxic stress, while PIPs, PGB, PHDs, DNA methylation, and chromatin structure regulatory mechanisms were significantly downregulated. In our study, we observed that the transcriptomic response of core hypoxia-inducible genes to NH4+ treatment was highly consistent with what was observed in earlier studies on hypoxia-stressed plants (Table 1, Figure 3), further supporting the notion that NH4+ treatment may induce hypoxic stress in wheat roots. The HCO3−-dependent alleviation of NH4+ toxicity may be associated with the attenuated hypoxic stress.
4.4. O2 Uptake, Transport, and Consumption May Be Associated with Cellular O2 Availability
It is interesting to explore how hypoxic conditions are established in wheat roots under NH4+ treatment. Rbohs are a family of plasma-membrane-bound enzymes that transfer electrons from cytosolic NADPH/NADH to apoplastic O2 with the production of reactive oxygen species, and thus play various roles in defense response and morphogenetic processes [12,43]. In this study, Rbohs genes were significantly upregulated in roots subjected to NH4+ and significantly downregulated after the application of HCO3− (Table 1). These data suggest that the higher expression of Rbohs genes under NH4+ treatment dampens O2 uptake and contributes to cellular O2 depletion (Figure 10).
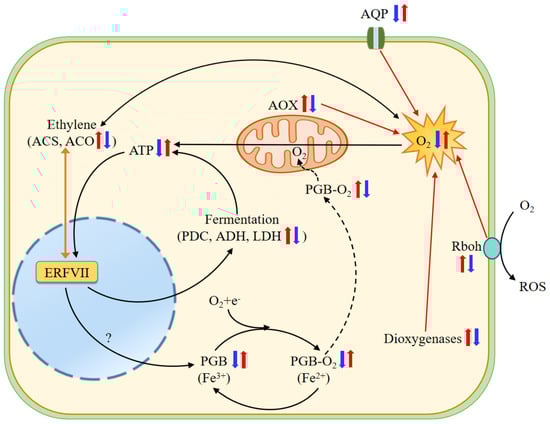
Figure 10.
Schematic model of NH4+ toxicity and HCO3−-dependent alleviation in roots of wheat seedlings. Under NH4+ treatment, significantly upregulated Rbohs consume large amounts of apoplastic O2, downregulated PIP-type AQPs decrease O2 uptake and transport from the ambient environment to the cell, and upregulated dioxygenases and AOXs increase intracellular O2 consumption, thus reducing cellular O2 availability. O2 deprivation then suppresses oxidative phosphorylation and ATP production, in turn activating the ethylene-enhanced ERFVII pool and stimulating hypoxic metabolism, such as alcoholic and lactic fermentation, and regulates the expression of hypoxia-like responsive genes encoding PDC, ADH, LDH, and PGBs [70]. O2-binding PGBs may function as terminal electron acceptor electron transport chains (ETCs), thus downregulated expression of PGBs under NH4+ may reduce electron transport inETC and then ATP generation. Higher ethylene production further consumes more molecular O2 [71]. Conversely, adding HCO3− greatly ameliorates the negative effects of NH4+ alone on these processes. Two juxtaposed arrows indicate differential expression of genes in SA vs. CK and AC vs. SA. The question mark in the figure indicates that this process remains to be elucidated. Red and blue arrows indicate increased and decreased transcript abundance, respectively. ACO, 1-aminocyclopropane-1-carboxylate oxidase; ACS, 1-aminocyclopropane-1-carboxylate synthase; ADH, alcohol dehydrogenase; AOX, alternative oxidase; AQP, aquaporins; ERFVII, Group VII Ethylene Response Factor; LDH, lactate dehydrogenase; PDC, pyruvate decarboxylase; PGB, nonsymbiotic hemoglobin; Rbohs, respiratory burst oxidase homolog.
Plant AQPs are localized in cell membranes to transport water molecules, O2, and CO2, and are involved in the hypoxia response [72,73,74]. Five subfamilies of AQPs, including the PIPs and NIPs, have been categorized in higher plants [75]. In particular, the overexpression of PIP1;3 has been observed to improve the rate of root O2 utilization and respiration, and to promote plant growth under hypoxic stress by mediating glycolysis, pyruvate metabolism, and the TCA cycle in the roots of canola (Brassica napus) [76]. In the present study, we found that NH4+ treatment reduced the transcript levels of genes encoding PIP-type AQPs, while the addition of HCO3− led to a significantly upregulated expression (Table 1, Figure 9). Based on these results, it is conceivable that the downregulated expression of PIP-type AQPs at least partially contributes to the low O2 stress in roots under NH4+ treatment (Figure 10).
Dioxygenases catalyze the incorporation of one or two O2 atoms into target organic substrates in various metabolic reactions, including DNA replication, RNA modification, and histone demethylation [41,77]. Therefore, high dioxygenase activity would induce O2 overconsumption [41]. In this study, we observed that most genes encoding dioxygenases, including ACO1, non-heme dioxygenases, gibberellin 2-beta-dioxygenases, and 9-cis-epoxycarotenoid dioxygenases, were upregulated by NH4+ treatment (Figure 4). So, we speculate that the higher upregulated expression of dioxygenases would promote the incorporation of molecular O2 into various substrates and decrease free O2 availability, thus leading to cellular hypoxia in the roots of plants fed NH4+ alone (Figure 10).
AOX is one of the terminal oxidases of the plant mitochondrial ETC [46,78]. AOX has a non-proton motive characteristic and delivers electrons from ubiquinone to O2 to generate H2O by bypassing two sites of H+ pumping in complexes III and IV of the cytochrome pathway, which dramatically reduces ATP generation [44,46,78]. Our results show that the transcript abundance of four AOX genes was increased in the roots of plants fed only NH4+, while HCO3− supplementation led to a significantly decreased expression of these genes (Table 1, Figure 9). The upregulation of AOX genes under NH4+ treatment may greatly increase O2 consumption without ATP production, which may be associated with hypoxic stress in root cells (Figure 10).
PGBs have an extremely high affinity for O2 and extremely slow O2 dissociation properties [79] and can serve as terminal electron acceptors in hypoxic root tissue [80,81]. Under hypoxic conditions, the expression of Pgb1.1 and Pgb1.2 was upregulated, thus mitigating the inhibitory effect of O2 deprivation on root growth in maize [43]. Fe is involved in the biosynthesis of heme molecules [79], and its deficiency leads to physiological hypoxia [82]. Mugineic acid (MA) is involved in Fe translocation in plant tissues as an Fe chelator, and its biosynthesis requires a precursor, nicotianamine (NA, formed from S-adenosyl methionine via nicotianamine synthase (NAS)) in graminaceous plants [83] and 2′-deoxymugineic-acid 2′-dioxygenases [84]. Our results show that all genes encoding PGBs, NAS, 2′-deoxymugineic-acid 2′-dioxygenases, and Fe2+ transport proteins in the roots were significantly downregulated under NH4+ treatment and were upregulated after HCO3− application (Table 1). Considering that Fe is a cofactor of PGBs, and PGBs function as O2 carriers and potential terminal electron acceptors in hypoxic root tissue, it is tempting to speculate that intracellular O2 availability and respiratory use are reduced in the roots of wheat plants fed NH4+ and increased after the addition of HCO3− (Figure 10).
4.5. Glycolytic Pathway Is Stimulated by NH4+ but Mitigated by Supplementation with HCO3−
It has been well documented that O2 is used as a terminal electron acceptor in ETC [46]. During aerobic respiration, about 36 moles of ATPs are produced [85]. However, under hypoxic conditions, ATP synthesis from oxidative phosphorylation is reduced [41]; thus, plant cells will rely on other metabolic pathways, such as glycolysis, leading to reduced ATP generation (2 moles of ATPs per mole of glucose) [52,85]. This metabolic switch may be regulated by many factors, such as hypoxia-inducible factor 1 (HIF-1) [85]. In the present study, we observed that DEGs encoding PFK, PGK, and ENO were upregulated under NH4+ treatment and downregulated after HCO3− was added (Figure 5). In short, NH4+ treatment simulates glycolysis, presumably because of the lower O2 availability in the root cells, while the addition of HCO3− may mitigate the hypoxic stress and improve the glycolytic pathway.
4.6. Supplementing with HCO3− Ameliorates NH4+-Repressed TCA Cycle
It is well known that the TCA cycle provides essential C skeletons for the assimilation of NH4+ into amino acids [34], while producing energy [5]. Therefore, the functions of the TCA cycle may be important in the alleviation of NH4+ toxicity. In the present study, we found that the DEGs encoding PEPC and PEPCK were upregulated under NH4+ treatment and downregulated after HCO3− was added (Figure 5). PEPC catalyzes the carboxylation of PEP in the presence of HCO3− to form OAA, and PEPCK catalyzes the decarboxylation of OAA to PEP in the gluconeogenesis pathway [86]. Therefore, the higher expression of PEPC and PEPCK under NH4+ conditions could lead to futile cycling between PEP and OAA in the cytoplasm, resulting in a lower accumulation of OAA in the roots (Table 3), which decreases the C anaplerosis in the TCA cycle.
In addition, PEP can also be converted to chorismate through the shikimate pathway, producing aromatic amino acids Trp, Tyr, and Phe [87]. In this study, we observed that under NH4+ conditions, the expression of all AroL, AroC, and PheA genes encoding the shikimate pathway enzymes was significantly upregulated and the concentrations of Trp, Tyr, and Phe were increased, which in turn significantly reduced the concentration of Pyr (glycolytic terminal intermediate) under NH4+ treatment (Table 1 and Table 3). The application of HCO3− led to increased Pyr concentration (Table 3).
Ala and formate are synthesized via AlaAT and FDH, respectively, using Pyr as a precursor [88,89]. AlaAT and FDH expression was induced and Ala and formate accumulated in roots under NH4+ treatment, and these were repressed by the addition of HCO3− (Figure 3), leading to more ions in the NH4+-treated plants (Table 3). Furthermore, the expression levels and activity of PK and PDHC decreased with NH4+ treatment and increased after the addition of HCO3− (Figure 5 and Figure 9, Table 2). These changes were greatly attenuated after the addition of HCO3−. Based on these results, it can be reasonably hypothesized that NH4+ nutrition alone suppresses the flux of Pyr in the TCA cycle and adding HCO3− mitigates this suppression.
The irreversible α-decarboxylation of glutamate catalyzed by GAD in plant tissues synthesizes GABA, a bypassing step in the TCA cycle known as GABA shunt [90]. In our study, the expression of GDA, GABA-T, and SSADH genes and the GABA content were significantly upregulated in roots under NH4+ treatment, while after HCO3− addition, the expression was downregulated and GABA content was decreased (Table 1 and Table 3). Furthermore, we observed that the expression of most TCA cycle enzymes and the concentrations of key intermediates were reduced under NH4+ treatment and increased after HCO3− was applied (Figure 5, Table 3). Based on these results, we propose that NH4+ treatment alone reduces the overall capacity of the TCA cycle, likely due to the suppressed flow of C and enhanced GABA shunt. It was encouraging to find that the addition of HCO3− mitigated the suppressed TCA cycle activity. This finding is consistent with findings reported in wheat [53] and rice [91] and findings reported by Cramer and Lewis [30] and Bialczyk et al. [34].
4.7. ATP Biosynthesis Is Inhibited by NH4+ and Promoted after Addition of HCO3−
As discussed above, the functions of alternative NAD(P)H:ubiquinone oxidoreductases and AOXs are not coupled to proton translocation, and thus inhibit ATP production [46,92]. In the present study, we found that the expression of alternative NAD(P)H:ubiquinone oxidoreductases and AOXs was upregulated in roots under NH4+ treatment and downregulated after the addition of HCO3− (Table 1, Figure 9), while the transcription level of PGBs was reduced under NH4+ alone and increased after the addition of HCO3− (Table 1). In agreement with this, we observed that the downregulated ATP synthase expression, reduced ETC complex V activity, and lower ATP content under NH4+ treatment were largely mitigated after the addition of HCO3− (Figure 6a–c). Considering that hypoxic stress induces the fermentation and glycolysis pathways, suppresses the TCA cycle, and limits energy generation [85,93], we conclude that NH4+-induced changes in the roots may be due to low O2 stress, and that adding HCO3− may promote O2 transport to the mitochondria and oxidative phosphorylation with PGBs as electron acceptors, ultimately improving ATP synthesis in the roots.
4.8. HCO3− Mitigates NH4+-Induced Cell Cycle Arrest and Elongation Inhibition
Cell division and cell elongation are the principal processes that determine root growth, and they occur in spatially distinct developmental zones [94]. The precise regulation of chromatin structure in the nucleus is closely related to the transcriptional reprogramming associated with cell proliferation in root apical meristems and growth and development in Arabidopsis and rice [95]. In this study, we found that the expression of all genes related to DNA and chromatin metabolic processes, cell division, and cell elongation was downregulated in roots exposed to NH4+ and upregulated after the addition of HCO3− (Table 1 and Table 4, Figure 9). Hence, we propose that cell cycle arrest and elongation inhibition may directly account for root growth inhibition under NH4+ treatment and that applying HCO3− attenuates the inhibitory effects of this treatment.
4.9. Ethylene Signaling Is Involved in Regulating NH4+ Toxicity and its Alleviation by HCO3−
Numerous studies have shown that ethylene contributes to the expression of core hypoxia genes and hypoxia acclimation by enhancing the production and stabilization of Group VII Ethylene Response Factors (ERFVIIs) [66,96,97]. ERFVIIs facilitate the induction of genes involved in fermentation, glycolysis, energy maintenance, and C metabolism under hypoxic stress in Arabidopsis [98], rice [99], and tobacco [44]. In the present study, transcriptome-wide analysis showed that the expression of genes encoding ACSs, ACOs, and two pivotal enzymes in ethylene synthesis was upregulated under NH4+ treatment but downregulated after HCO3− addition (Table 1, Figure 9). It seems reasonable to assume that ethylene synthesis is increased and is involved in NH4+ toxicity as a signaling agent, and that adding HCO3− negatively regulates ethylene signal transduction, thus improving root growth (Figure 10).
5. Conclusions
Treatment with NH4+ alone led to significantly restrained wheat root growth and induced the expression of hypoxia-response core genes, indicating that hypoxia may be the primary cause of NH4+ toxicity in root cells. Hypoxic stress appears to be associated with the upregulation of Rbohs, dioxygenases, and AOXs and the downregulation of AQPs. As a consequence, the capacity of the TCA cycle is reduced and the production of ATP is inhibited, eventually dampening the root cell cycle, elongation, and growth. Compared with NH4+ nutrition alone, the addition of HCO3− significantly improved hypoxia-related metabolic processes, boosted ATP generation, promoted root cell division and elongation, and ultimately enhanced root growth in wheat seedlings. Ethylene signaling may be involved in NH4+ toxicity and HCO3−-dependent detoxification.
As the first report on hypoxic stress triggered by NH4+ treatment, this study provides novel insights into the mechanisms of NH4+ toxicity and its alleviation, further providing a valuable molecular basis for studying how to improve NUE. In particular, based on the data reported here, we can strongly recommend splitting the proportion of N fertilizer for wheat production in the field. Alternatively, C-containing fertilizers such as ammonium bicarbonate and urea should be used as the preferred N source. Retaining the C-rich residue of previous crops is also a practical strategy when using NH4+ fertilizers as the dominant N source. These practices could minimize NH4+ toxicity and increase nutrient use efficiency and wheat grain yield.
Supplementary Materials
The following supporting information can be downloaded at: https://www.mdpi.com/article/10.3390/biology13020101/s1, Table S1: Fresh weight of wheat seedlings grown in different strengths of Hoagland nutrient solution for 48 h; Table S2: Quality assessment of RNA-Seq sequencing results.
Author Contributions
X.L. and L.K. conceived and designed the study and wrote the manuscript. Y.Z. and C.T. participated in the experiments. X.L. and H.L. analyzed the transcriptome data and constructed the figures. C.T. performed the physiological determination. H.X. and S.F. modified the manuscript. All authors have read and agreed to the published version of the manuscript.
Funding
This work was supported by the Natural Science Foundation of Shandong Province (ZR2020MC087), the National Key Research and Development Program of China (2022YFD2300801), and the Shandong Modern Agricultural Technology and Industry System (SDAIT-01-07).
Institutional Review Board Statement
Not applicable.
Informed Consent Statement
Not applicable.
Data Availability Statement
The datasets used and/or analyzed during the current study are available from the corresponding author on reasonable request.
Conflicts of Interest
The authors did not report any conflicts of interest.
References
- Nunes-Nesi, A.; Fernie, A.R.; Stitt, M. Metabolic and signaling aspects underpinning the regulation of plant carbon nitrogen interactions. Mol. Plant 2010, 3, 973–996. [Google Scholar] [CrossRef]
- Gutiérrez-Gamboa, G.; Alañón-Sánchez, N.; Mateluna-Cuadra, R.; Verdugo-Vásquez, N. An overview about the impacts of agricultural practices on grape nitrogen composition: Current research approaches. Food Res. Int. 2020, 136, 109477. [Google Scholar] [CrossRef]
- Calatrava, V.; Tejada-Jimenez, M.; Sanz-Luque, E.; Fernandez, E.; Galvan, A. Nitrogen metabolism in Chlamydomonas. In The Chlamydomonas Sourcebook; Academic Press: Cambridge, MA, USA, 2023; pp. 99–128. [Google Scholar]
- Vega-Mas, I.; Cukier, C.; Coleto, I.; González-Murua, C.; Limami, A.M.; González-Moro, M.B.; Marino, D. Isotopic labelling reveals the efficient adaptation of wheat root TCA cycle flux modes to match carbon demand under ammonium nutrition. Sci. Rep. 2019, 9, 8925. [Google Scholar] [CrossRef]
- Wang, F.; Gao, J.; Yong, J.W.; Liu, Y.; Cao, D.; He, X. Glutamate over-accumulation may serve as an endogenous indicator of tricarboxylic acid (TCA) cycle suppression under NH4+ nutrition in wheat (Triticum aestivum L.) seedlings. Environ. Exp. Bot. 2020, 177, 104130. [Google Scholar] [CrossRef]
- Di, D.W.; Wu, J.; Ma, M.; Li, G.; Wang, M.; Kronzucker, H.J.; Shi, W. PIN5 is involved in regulating NH4+ efflux and primary root growth under high-ammonium stress via mediating intracellular auxin transport. Plant Soil 2023, 1–16. [Google Scholar] [CrossRef]
- Du, W.; Zhang, Y.; Si, J.; Zhang, Y.; Fan, S.; Xia, H.; Kong, L. Nitrate alleviates ammonium toxicity in wheat (Triticum aestivum L.) by regulating tricarboxylic acid cycle and reducing rhizospheric acidification and oxidative damage. Plant Signal. Behav. 2021, 16, 1991687. [Google Scholar] [CrossRef] [PubMed]
- Zhang, W.; Zhang, T.; Zhang, J.; Lei, W.; Zhao, L.; Wang, S.; Shi, M.; Wei, M. Low nitrogen stress promotes root nitrogen uptake and assimilation in strawberry: Contribution of hormone networks. Horticulturae 2023, 9, 249. [Google Scholar] [CrossRef]
- Curci, P.L.; Aiese, C.R.; Zuluaga, D.L.; Janni, M.; Sanseverino, W.; Sonnante, G. Transcriptomic response of durum wheat to nitrogen starvation. Sci. Rep. 2017, 7, 1176. [Google Scholar] [CrossRef]
- Hakeem, K.R.; Ahmad, A.; Iqbal, M.; Gucel, S.; Ozturk, M. Nitrogen-efficient rice cultivars can reduce nitrate pollution. Environ. Sci. Pollut. Res. Int. 2011, 18, 1184–1193. [Google Scholar] [CrossRef]
- Esteban, R.; Ariz, I.; Cruz, C.; Moran, J.F. Mechanisms of ammonium toxicity and the quest for tolerance. Plant Sci. 2016, 248, 92–101. [Google Scholar] [CrossRef]
- Podgórska, A.; Burian, M.; Dobrzyńska, K.; Rasmusson, A.G.; Szal, B. Respiratory burst oxidases and apoplastic peroxidases facilitate ammonium syndrome development in Arabidopsis. Environ. Exp. Bot. 2021, 181, 104279. [Google Scholar] [CrossRef]
- Zhong, X.; Zhou, X.; Fei, J.; Huang, Y.; Wang, G.; Kang, X.; Hu, W.; Zhang, H.; Rong, X.; Peng, J. Reducing ammonia volatilization and increasing nitrogen use efficiency in machine-transplanted rice with side-deep fertilization in a double-cropping rice system in Southern China. Agric. Ecosyst. Environ. 2021, 306, 107183. [Google Scholar] [CrossRef]
- Britto, D.T.; Kronzucker, H.J. NH4+ toxicity in higher plants: A critical review. J. Plant Physiol. 2002, 159, 567–584. [Google Scholar] [CrossRef]
- Kong, L.; Zhang, Y.; Zhang, B.; Li, H.; Wang, Z.; Si, J.; Fan, S.; Feng, B. Does energy cost constitute the primary cause of ammonium toxicity in plants? Planta 2022, 256, 62. [Google Scholar] [CrossRef]
- Britto, D.T.; Kronzucker, H.J. Nitrogen acquisition, PEP carboxylase, and cellular pH homeostasis: New views on old paradigms. Plant Cell Environ. 2005, 28, 1396–1409. [Google Scholar] [CrossRef]
- Zhu, Y.; Qi, B.; Hao, Y.; Liu, H.; Sun, G.; Chen, R.; Song, S. Appropriate NH4+/NO3− ratio triggers plant growth and nutrient uptake of flowering Chinese cabbage by optimizing the pH value of nutrient solution. Front. Plant Sci. 2021, 12, 656144. [Google Scholar] [CrossRef]
- Szczerba, M.W.; Britto, D.T.; Balkos, K.D.; Kronzucker, H.J. Alleviation of rapid, futile ammonium cycling at the plasma membrane by potassium reveals K+-sensitive and -insensitive components of NH4+ transport. J. Exp. Bot. 2008, 59, 303–313. [Google Scholar] [CrossRef]
- Ariz, I.; Artola, E.; Asensio, A.C.; Cruchaga, S.; Aparicio-Tejo, P.M.; Moran, J.F. High irradiance increases NH4+ tolerance in Pisum sativum: Higher carbon and energy availability improve ion balance but not N assimilation. J. Plant Physiol. 2011, 168, 1009–1015. [Google Scholar] [CrossRef]
- Roosta, H.R.; Schjoerring, J.K. Effects of ammonium toxicity on nitrogen metabolism and elemental profile of cucumber plants. J. Plant Nutr. 2007, 30, 1933–1951. [Google Scholar] [CrossRef]
- Li, G.; Zhang, L.; Wang, M.; Di, D.; Kronzucker, H.J.; Shi, W. The Arabidopsis AMOT1/EIN3 gene plays an important role in the amelioration of ammonium toxicity. J. Exp. Bot. 2019, 70, 1375–1388. [Google Scholar] [CrossRef] [PubMed]
- Xiao, C.; Sun, D.; Liu, B.; Fang, X.; Li, P.; Jiang, Y.; He, M.; Li, J.; Luan, S.; He, K. Nitrate transporter NRT1.1 and anion channel SLAH3 form a functional unit to regulate nitrate-dependent alleviation of ammonium toxicity. J. Integr. Plant Biol. 2022, 64, 942–957. [Google Scholar] [CrossRef]
- Balkos, K.D.; Britto, D.T.; Kronzucker, H.J. Optimization of ammonium acquisition and metabolism by potassium in rice (Oryza sativa L. cv. IR-72). Plant Cell Environ. 2010, 33, 23–34. [Google Scholar] [PubMed]
- Liang, G.; Song, H.; Xiao, Y.; Zhang, Z. Ammonium accumulation caused by reduced tonoplast V-ATPase activity in Arabidopsis thaliana. Int. J. Mol. Sci. 2021, 22, 2. [Google Scholar] [CrossRef] [PubMed]
- Ou, X.; Li, S.; Liao, P.; Cui, X.; Zheng, B.; Yang, Y.; Liu, D.; Zheng, Y. The transcriptome variations of Panax notoginseng roots treated with different forms of nitrogen fertilizers. BMC Genom. 2019, 20 (Suppl. S9), 965. [Google Scholar] [CrossRef]
- Sun, D.; Fang, X.; Xiao, C.; Ma, Z.; Huang, X.; Su, J.; Li, J.; Wang, J.; Wang, S.; Luan, S.; et al. Kinase SnRK1.1 regulates nitrate channel SLAH3 engaged in nitrate-dependent alleviation of ammonium toxicity. Plant Physiol. 2021, 186, 731–749. [Google Scholar] [CrossRef]
- Magalhaes, J.R.; Huber, D.M.; Tsai, C.Y. Evidence of increased 15N-ammonium assimilation in tomato plants with exogenous α-ketoglutarate. Plant Sci. 1992, 85, 135–141. [Google Scholar] [CrossRef]
- Song, J.; Yang, J.; Jeong, B.R. Silicon mitigates ammonium toxicity in cabbage (Brassica campestris L. ssp. pekinensis) ‘Ssamchu’. Front. Sustain. Food Syst. 2022, 6, 922666. [Google Scholar] [CrossRef]
- Ferreira Barreto, R.; de Mello Prado, R.; Barbosa Lúcio, J.C.; Lopez-Diaz, I.; Carrera, E.; Falleiros Carvalho, R. Ammonium toxicity alleviation by silicon is dependent on cytokinins in tomato cv. Micro-Tom. Plant Growth Regul. 2021, 41, 417–428. [Google Scholar] [CrossRef]
- Cramer, M.D.; Lewis, O.A.M. The influence of nitrate and ammonium nutrition on the growth of wheat (Triticum aestivum) and maize (Zea mays) plants. Ann. Bot. 1993, 72, 359–365. [Google Scholar] [CrossRef]
- Rigano, C.; Rigano, V.D.; Vona, V.; Carfagna, S.; Carillo, P.; Esposito, S. Ammonium assimilation by young plants of Hordeum vulgare in light and darkness: Effects on respiratory oxygen consumption by roots. New Phytol. 1996, 132, 375–382. [Google Scholar] [CrossRef]
- Hachiya, T.; Noguchi, K. Integrative response of plant mitochondrial electron transport chain to nitrogen source. Plant Cell Rep. 2011, 30, 195–204. [Google Scholar] [CrossRef] [PubMed]
- Roosta, H.R.; Schjoerring, J.K. Effects of nitrate and potassium on ammonium toxicity in cucumber plants. J. Plant Nutr. 2008, 31, 1270–1283. [Google Scholar] [CrossRef]
- Bialczyk, J.; Lechowski, Z.; Dziga, D.; Molenda, K. Carbohydrate and free amino acid contents in tomato plants grown in media with bicarbonate and nitrate or ammonium. Acta Physiol. Plant. 2005, 27, 523–529. [Google Scholar] [CrossRef]
- Vega-Mas, I.; Pérez-Delgado, C.M.; Marino, D.; Fuertes-Mendizábal, T.; González-Murua, C.; Márquez, A.J.; Betti, M.; Estavillo, J.M.; González-Moro, M.B. Elevated CO2 induces root defensive mechanisms in tomato plants when dealing with ammonium toxicity. Plant Cell Physiol. 2017, 58, 2112–2125. [Google Scholar] [CrossRef] [PubMed]
- Oaks, A. A re-evaluation of nitrogen assimilation in roots: Ability of legume roots to export asparagine reflects a capacity to assimilate nitrogen not possessed by cereal roots. Bioscience 1992, 42, 103–111. [Google Scholar] [CrossRef]
- De la Peña, M.; González-Moro, M.B.; Marino, D. Providing carbon skeletons to sustain amide synthesis in roots underlines the suitability of Brachypodium distachyon for the study of ammonium stress in cereals. AoB Plants 2019, 11, plz029. [Google Scholar] [CrossRef] [PubMed]
- Prasad, K.; Reddy, T.S.K.; Sharma, A. Pollination, Emasculation and hybridization methods in wheat: A review. J. Pharm. Innov. 2022, 11, 1087–1091. [Google Scholar]
- Zörb, C.; Ludewig, U.; Hawkesford, M.J. Perspective on wheat yield and quality with reduced nitrogen supply. Trends Plant Sci. 2018, 23, 1029–1037. [Google Scholar] [CrossRef]
- Yoon, B.; Yang, E.G.; Kim, S.Y. The ADP-ribose reactive NUDIX hydrolase isoforms can modulate HIF-1α in cancer cells. Biochem. Biophys. Res. Commun. 2018, 504, 321–327. [Google Scholar] [CrossRef]
- Lee, P.; Chandel, N.S.; Simon, M.C. Cellular adaptation to hypoxia through hypoxia inducible factors and beyond. Nat. Rev. Mol. Cell Biol. 2020, 21, 268–283. [Google Scholar] [CrossRef]
- Druker, J.; Wilson, J.W.; Child, F.; Shakir, D.; Fasanya, T.; Rocha, S. Role of hypoxia in the control of the cell cycle. Int. J. Mol. Sci. 2021, 22, 4874. [Google Scholar] [CrossRef] [PubMed]
- Mira, M.M.; Hill, R.D.; Stasolla, C. Phytoglobins improve hypoxic root growth by alleviating apical meristem cell death. Plant Physiol. 2016, 172, 2044–2056. [Google Scholar] [CrossRef] [PubMed]
- Zafari, S.; Vanlerberghe, G.C.; Igamberdiev, A.U. The role of alternative oxidase in the interplay between nitric oxide, reactive oxygen species, and ethylene in tobacco (Nicotiana tabacum L.) plants incubated under normoxic and hypoxic conditions. Int. J. Mol. Sci. 2022, 23, 7153. [Google Scholar] [CrossRef] [PubMed]
- Igamberdiev, A.U.; Hill, R.D. Elevation of cytosolic Ca2+ in response to energy deficiency in plants: The general mechanism of adaptation to low oxygen stress. Biochem. J. 2018, 475, 1411–1425. [Google Scholar] [CrossRef] [PubMed]
- Jayawardhane, J.; Cochrane, D.W.; Vyas, P.; Bykova, N.V.; Vanlerberghe, G.C.; Igamberdiev, A.U. Roles for plant mitochondrial alternative oxidase under normoxia, hypoxia, and reoxygenation conditions. Front. Plant Sci. 2020, 11, 566. [Google Scholar] [CrossRef] [PubMed]
- Matsuo, N.; Nanjo, Y.; Tougou, M.; Nakamura, T.; Nishizawa, K.; Komatsu, S.; Satoshi, S. Identification of putative aquaporin genes and their expression analysis under hypoxic conditions in soybean [Glycine max (L.) Merr.]. Plant Prod. Sci. 2012, 15, 278–283. [Google Scholar] [CrossRef]
- Kadam, S.; Abril, A.; Dhanapal, A.P.; Koeste, R.P.; Vermerris, W.; Jose, S.; Fritschi, F.B. Characterization and regulation of aquaporin genes of sorghum [Sorghum bicolor (L.) Moench] in response to waterlogging stress. Front. Plant Sci. 2017, 8, 862. [Google Scholar] [CrossRef]
- Diab, H.; Limami, A.M. Reconfiguration of N metabolism upon hypoxia stress and recovery: Roles of alanine aminotransferase (AlaAT) and glutamate dehydrogenase (GDH). Plants 2016, 5, 25. [Google Scholar] [CrossRef]
- Kęska, K.; Szcześniak, M.W.; Makałowska, I.; Czernicka, M. Long-term waterlogging as factor contributing to hypoxia stress tolerance enhancement in cucumber: Comparative transcriptome analysis of waterlogging sensitive and tolerant accessions. Genes 2021, 12, 189. [Google Scholar] [CrossRef]
- Ricoult, C.; Cliquet, J.B.; Limami, A.M. Stimulation of alanine aminotransferase (AlaAT) gene expression and alanine accumulation in embryo axis of the model legume Medicago truncatula contribute to anoxia stress tolerance. Physiol. Plant. 2005, 123, 30–39. [Google Scholar] [CrossRef]
- Rocha, M.; Licausi, F.; Araújo, W.L.; Nunes-Nesi, A.; Sodek, L.; Fernie, A.R.; van Dongen, J.T. Glycolysis and the tricarboxylic acid cycle are linked by alanine aminotransferase during hypoxia induced by waterlogging of Lotus japonicus. Plant Physiol. 2010, 152, 1501–1513. [Google Scholar] [CrossRef]
- Shingaki-Wells, R.N.; Huang, S.; Taylor, N.L.; Carroll, A.J.; Zhou, W.; Millar, A.H. Differential molecular responses of rice and wheat coleoptiles to anoxia reveal novel metabolic adaptations in amino acid metabolism for tissue tolerance. Plant Physiol. 2011, 156, 1706–1724. [Google Scholar] [CrossRef] [PubMed]
- Miyashita, Y.; Good, A.G. Contribution of the GABA shunt to hypoxia-induced alanine accumulation in roots of Arabidopsis thaliana. Plant Cell Physiol. 2008, 49, 92–102. [Google Scholar] [CrossRef] [PubMed]
- Narsai, R.; Whelan, J. How unique is the low oxygen response? An analysis of the anaerobic response during germination and comparison with abiotic stress in rice and Arabidopsis. Front. Plant Sci. 2013, 4, 349. [Google Scholar] [CrossRef]
- Xie, R.; Zheng, L.; Jiao, Y.; Huang, X. Understanding physiological and molecular mechanisms of citrus rootstock seedlings in response to root zone hypoxia by RNA-Seq. Environ. Exp. Bot. 2021, 192, 104647. [Google Scholar] [CrossRef]
- Loreti, E.; Betti, F.; Ladera-Carmona, M.J.; Fontana, F.; Novi, G.; Valeri, M.C.; Perata, P. ARGONAUTE1 and ARGONAUTE4 regulate gene expression and hypoxia tolerance. Plant Physiol. 2020, 182, 287–300. [Google Scholar] [CrossRef] [PubMed]
- Lee, T.A.; Bailey-Serres, J. Conserved and nuanced hierarchy of gene regulatory response to hypoxia. New Phytol. 2021, 229, 71–78. [Google Scholar] [CrossRef]
- Kenneth, N.S.; Mudie, S.; van Uden, P.; Rocha, S. SWI/SNF regulates the cellular response to hypoxia. J. Biol. Chem. 2009, 287, 4123–4131. [Google Scholar] [CrossRef]
- Hess, N.; Klode, M.; Anders, M.; Sauter, M. The hypoxia responsive transcription factor genes ERF71/HRE2 and ERF73/HRE1 of Arabidopsis are differentially regulated by ethylene. Physiol. Plant. 2011, 143, 41–49. [Google Scholar] [CrossRef]
- Barreto, P.; Arcuri, M.L.C.; Lima, R.P.M.; Marino, C.L.; Maia, I.G. Comprehensive in silico analysis and transcriptional profiles highlight the importance of mitochondrial dicarboxylate carriers (DICs) on hypoxia response in both Arabidopsis thaliana and Eucalyptus grandis. Plants 2022, 11, 181. [Google Scholar] [CrossRef]
- Taylor, N.L.; Howell, K.A.; Heazlewood, J.L.; Tan, T.Y.; Narsai, R.; Huang, S.; Whelan, J.; Millar, A.H. Analysis of the rice mitochondrial carrier family reveals anaerobic accumulation of a basic amino acid carrier involved in arginine metabolism during seed germination. Plant Physiol. 2010, 154, 691–704. [Google Scholar] [CrossRef] [PubMed]
- Lehmann, J.; Jørgensen, M.E.; Fratz, S.; Müller, H.M.; Kusch, J.; Scherzer, S.; Navarro-Retamal, C.; Mayer, D.; Böhm, J.; Konrad, K.R.; et al. Acidosis-induced activation of anion channel SLAH3 in the flooding-related stress response of Arabidopsis. Curr. Biol. 2021, 31, 3575–3585. [Google Scholar] [CrossRef] [PubMed]
- Xie, L.J.; Zhou, Y.; Chen, Q.F.; Xiao, S. New insights into the role of lipids in plant hypoxia responses. Prog. Lipid Res. 2021, 81, 101072. [Google Scholar] [CrossRef] [PubMed]
- Shimizu, M.; Takaya, N. Nudix hydrolase controls nucleotides and glycolytic mechanisms in hypoxic Aspergillus nidulans. Biosci. Biotechnol. Biochem. 2013, 77, 1888–1893. [Google Scholar] [CrossRef] [PubMed]
- Sun, L.; Di, D.W.; Li, G.; Kronzucker, H.J.; Wu, X.; Shi, W. Endogenous ABA alleviates rice ammonium toxicity by reducing ROS and free ammonium via regulation of the SAPK9-bZIP20 pathway. J. Exp. Bot. 2020, 71, 4562–4577. [Google Scholar] [CrossRef]
- Tan, X.; Xu, H.; Khan, S.; Equiza, M.A.; Lee, S.H.; Vaziriyeganeh, M.; Zwiazek, J.J. Plant water transport and aquaporins in oxygen-deprived environments. J. Plant Physiol. 2018, 227, 20–30. [Google Scholar] [CrossRef]
- Beamer, Z.G.; Routray, P.; Choi, W.G.; Spangler, M.K.; Lokdarshi, A.; Roberts, D.M. Aquaporin family lactic acid channel NIP2; 1 promotes plant survival under low oxygen stress in Arabidopsis. Plant Physiol. 2021, 187, 2262–2278. [Google Scholar] [CrossRef]
- Oliveira, H.C.; Freschi, L.; Sodek, L. Nitrogen metabolism and translocation in soybean plants subjected to root oxygen deficiency. Plant Physiol. Biochem. 2013, 66, 141–149. [Google Scholar] [CrossRef]
- Hartman, S.; Sasidharan, R.; Voesenek, L.A. The role of ethylene in metabolic acclimations to low oxygen. New Phytol. 2021, 229, 64–70. [Google Scholar] [CrossRef]
- Fukao, T.; Bailey-Serres, J. Plant responses to hypoxia- is survival a balancing act? Trends Plant Sci. 2004, 9, 449–456. [Google Scholar] [CrossRef]
- Verdoucq, L.; Maurel, C. Plant aquaporins. In Advances in botanical research. Adv. Bot. Res. 2018, 87, 25–56. [Google Scholar]
- Zwiazek, J.J.; Xu, H.; Tan, X.; Navarro-Ródenas, A.; Morte, A. Significance of oxygen transport through aquaporins. Sci. Rep. 2017, 7, 40411. [Google Scholar] [CrossRef] [PubMed]
- Heckwolf, M.; Pater, D.; Hanson, D.T.; Kaldenhoff, R. The Arabidopsis thaliana aquaporin AtPIP1; 2 is a physiologically relevant CO2 transport facilitator. Plants 2011, 67, 795–804. [Google Scholar]
- Kapilan, R.; Vaziri, M.; Zwiazek, J.J. Regulation of aquaporins in plants under stress. Biol. Res. 2018, 51, 4. [Google Scholar] [CrossRef] [PubMed]
- Liu, M. Role of Aquaporins in Brassica napus Responses to Root Hypoxia and Re-Aeration. Ph.D. Thesis, University of Alberta, Alberta, AB, Canada, 2021. [Google Scholar]
- Iacopino, S.; Licausi, F. The contribution of plant dioxygenases to hypoxia signaling. Front. Plant Sci. 2020, 11, 1008. [Google Scholar] [CrossRef] [PubMed]
- Saha, B.; Borovskii, G.; Panda, S.K. Alternative oxidase and plant stress tolerance. Plant Signal. Behav. 2016, 11, e1256530. [Google Scholar] [CrossRef]
- Igamberdiev, A.U.; Bykova, N.V.; Hill, R.D. Structural and functional properties of class 1 plant hemoglobins. IUBMB Life 2011, 63, 146–152. [Google Scholar] [CrossRef]
- Sturms, R.T. Structure and Function of Class One Non-Symbiotic Plant Hemoglobins. Ph.D. Thesis, Iowa State University, Ames, IA, USA, 2013. [Google Scholar]
- Timilsina, A.; Dong, W.; Hasanuzzaman, M.; Liu, B.; Hu, C. Nitrate–nitrite–nitric oxide pathway: A mechanism of hypoxia and anoxia tolerance in plants. Int. J. Mol. Sci. 2022, 23, 11522. [Google Scholar] [CrossRef]
- Kobayashi, T.; Nagasaka, S.; Senoura, T.; Itai, R.N.; Nakanishi, H.; Nishizawa, N.K. Iron-binding haemerythrin RING ubiquitin ligases regulate plant iron responses and accumulation. Nat. Commun. 2013, 4, 2792. [Google Scholar] [CrossRef]
- Nozoye, T. The nicotianamine synthase gene is a useful candidate for improving the nutritional qualities and Fe-deficiency tolerance of various crops. Front. Plant Sci. 2018, 9, 340. [Google Scholar] [CrossRef]
- Han, J.; Wang, X.; Niu, S. Genome-wide identification of 2-Oxoglutarate and Fe (II)-dependent dioxygenase (2ODD-C) family genes and expression profiles under different abiotic stresses in Camellia sinensis (L.). Plants 2023, 12, 1302. [Google Scholar] [CrossRef]
- Kierans, S.J.; Taylor, C.T. Regulation of glycolysis by the hypoxia-inducible factor (HIF): Implications for cellular physiology. J. Physiol. 2021, 599, 23–37. [Google Scholar] [CrossRef]
- Hartman, M.D.; Rojas, B.E.; Iglesias, A.A.; Figueroa, C.M. The involvement of allosteric effectors and post-translational modifications in the control of plant central carbon metabolism. Plants 2023, 114, 1037–1058. [Google Scholar] [CrossRef] [PubMed]
- Kedar, P.; Colah, R.; Shimizu, K. Proteomic investigation on the pyk-F gene knockout Escherichia coli for aromatic amino acid production. Enzym. Microb. Technol. 2007, 41, 455–465. [Google Scholar] [CrossRef]
- Hourton-Cabassa, C.; Ambard-Bretteville, F.; Moreau, F.; Davy de Virville, J.; Rémy, R.; Francs-Small, C.C. Stress induction of mitochondrial formate dehydrogenase in potato leaves. Plant Physiol. 1998, 116, 627–635. [Google Scholar] [CrossRef]
- Miyashita, Y.; Dolferus, R.; Ismond, K.P.; Good, A.G. Alanine aminotransferase catalyses the breakdown of alanine after hypoxia in Arabidopsis thaliana. Plants 2007, 49, 1108–1121. [Google Scholar] [CrossRef] [PubMed]
- Wu, Q.; Su, N.; Huang, X.; Cui, J.; Shabala, L.; Zhou, M.; Yu, M.; Shabala, S. Hypoxia-induced increase in GABA content is essential for restoration of membrane potential and preventing ROS-induced disturbance to ion homeostasis. Plant Commun. 2021, 2, 100188. [Google Scholar] [CrossRef] [PubMed]
- Narsai, R.; Howell, K.A.; Carroll, A.; Ivanova, A.; Millar, A.H.; Whelan, J. Defining core metabolic and transcriptomic responses to oxygen availability in rice embryos and young seedlings. Plant Physiol. 2009, 151, 306–322. [Google Scholar] [CrossRef] [PubMed]
- Tarrío, N.; Prado, S.D.; Cerdán, M.E.; Siso, M.I. The nuclear genes encoding the internal (KlNDI1) and external (KlNDE1) alternative NAD(P)H: Ubiquinone oxidoreductases of mitochondria from Kluyveromyces lactis. BBA-Bioenerg. 2005, 1707, 199–210. [Google Scholar] [CrossRef] [PubMed]
- Terzoudis, K.; Hertog, M.L.; Nicolai, B.M. Dynamic labelling reveals central carbon metabolism responses to stepwise decreasing hypoxia and reoxygenation during postharvest in pear fruit. Postharvest Biol. Technol. 2022, 186, 111816. [Google Scholar] [CrossRef]
- Rizza, A.; Tang, B.; Stanley, C.E.; Grossmann, G.; Owen, M.R.; Band, L.R.; Jones, A.M. Differential biosynthesis and cellular permeability explain longitudinal gibberellin gradients in growing roots. Proc. Natl. Acad. Sci. USA 2021, 118, e1921960118. [Google Scholar] [CrossRef] [PubMed]
- Kang, H.; Wu, D.; Fan, T.; Zhu, Y. Activities of chromatin remodeling factors and histone chaperones and their effects in root apical meristem development. Int. J. Mol. Sci. 2020, 21, 771. [Google Scholar] [CrossRef] [PubMed]
- Weits, D.A.; van Dongen, J.T.; Licausi, F. Molecular oxygen as a signaling component in plant development. New Phytol. 2021, 229, 24–35. [Google Scholar] [CrossRef] [PubMed]
- Liu, Z.; Hartman, S.; van Veen, H.; Zhang, H.; Leeggangers, H.A.; Martopawiro, S.; Bosman, F.; de Deugd, F.; Su, P.; Hummel, M.; et al. Ethylene augments root hypoxia tolerance via growth cessation and reactive oxygen species amelioration. Plant Physiol. 2022, 190, 1365–1383. [Google Scholar] [CrossRef]
- Hartman, S.; Liu, Z.; van Veen, H.; Vicente, J.; Reinen, E.; Martopawiro, S.; Zhang, H.; van Dongen, N.; Bosman, F.; Bassel, G.W.; et al. Ethylene-mediated nitric oxide depletion pre-adapts plants to hypoxia stress. Nat. Commun. 2019, 10, 4020. [Google Scholar] [CrossRef]
- Mori, Y.; Kurokawa, Y.; Koike, M.; Malik, A.I.; Colmer, T.D.; Ashikari, M.; Pedersen, O.; Nagai, K. Diel O2 dynamics in partially and completely submerged deepwater rice: Leaf gas films enhance internodal O2 status, influence gene expression and accelerate stem elongation for ‘snorkelling’ during submergence. Plant Cell Physiol. 2019, 60, 973–985. [Google Scholar] [CrossRef]


Disclaimer/Publisher’s Note: The statements, opinions and data contained in all publications are solely those of the individual author(s) and contributor(s) and not of MDPI and/or the editor(s). MDPI and/or the editor(s) disclaim responsibility for any injury to people or property resulting from any ideas, methods, instructions or products referred to in the content. |
© 2024 by the authors. Licensee MDPI, Basel, Switzerland. This article is an open access article distributed under the terms and conditions of the Creative Commons Attribution (CC BY) license (https://creativecommons.org/licenses/by/4.0/).