
Isotopic Overlap of Invasive and Native Consumers in the Food Web of Lake Trasimeno (Central Italy)

 , , ,
, , , 
Abstract
Simple Summary
Abstract
1. Introduction
2. Materials and Methods
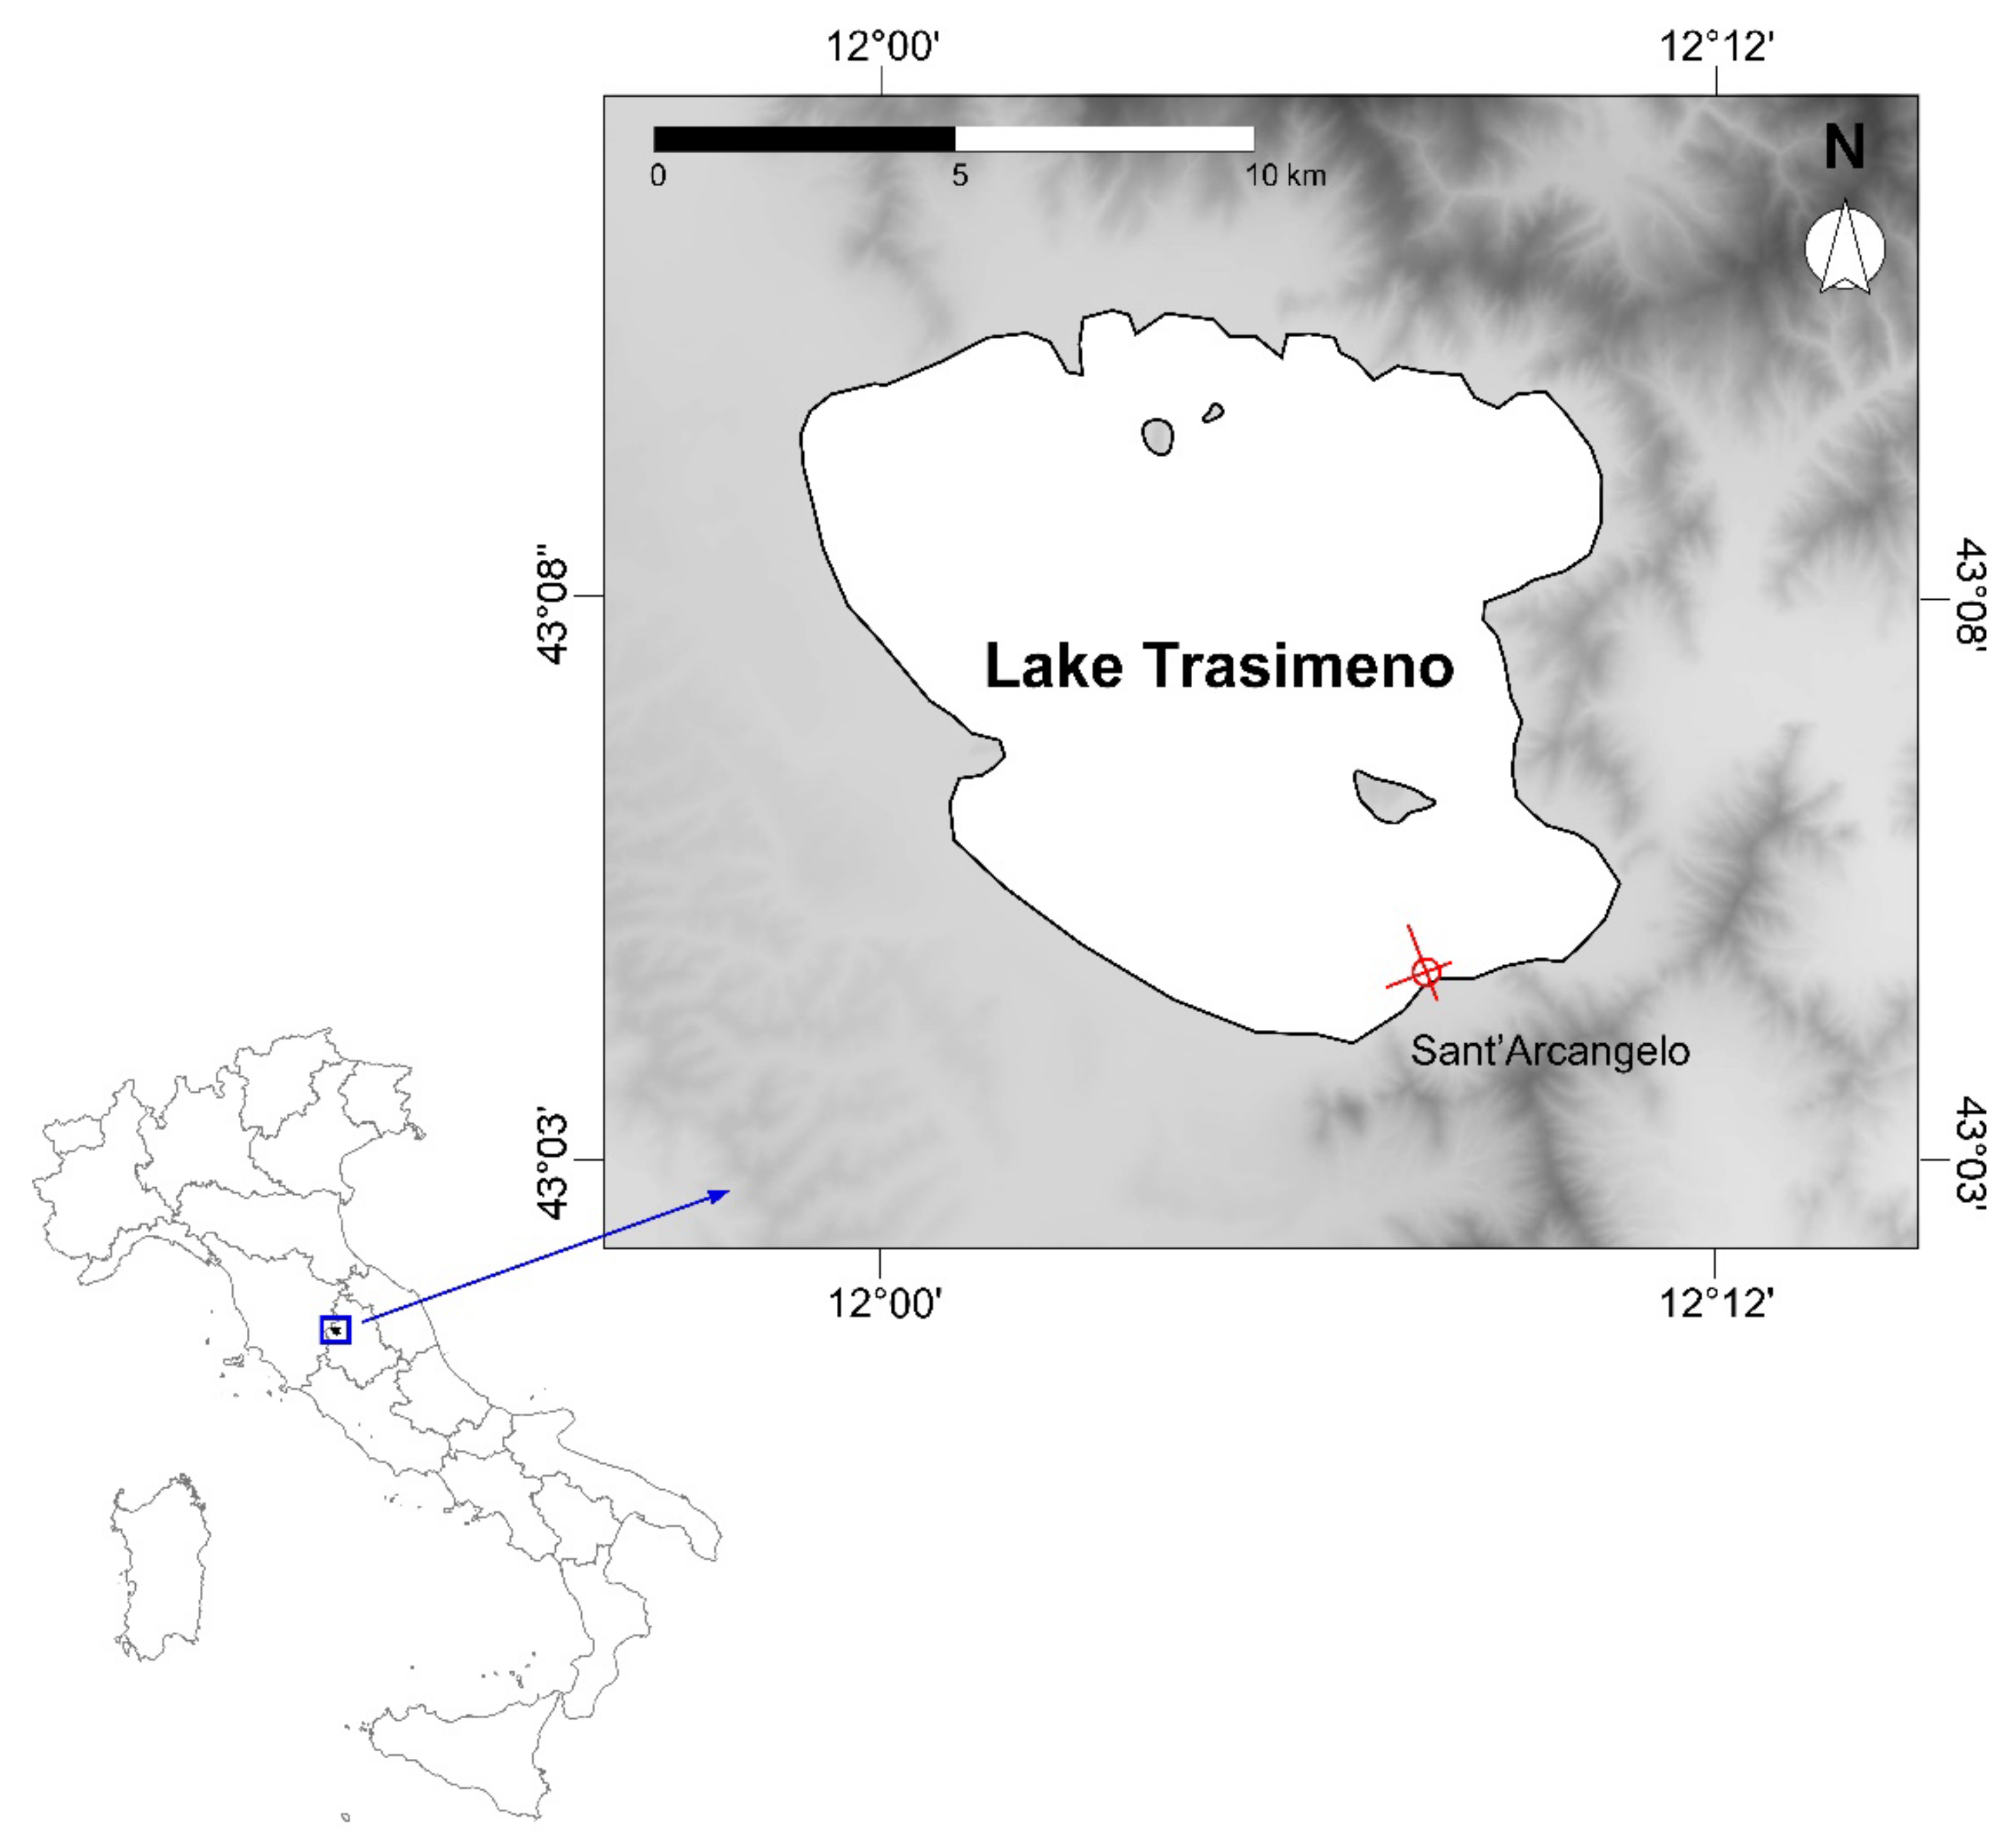
2.1. Site Description
2.2. Sample Collection and Laboratory Procedures
2.3. Data Analysis
3. Results
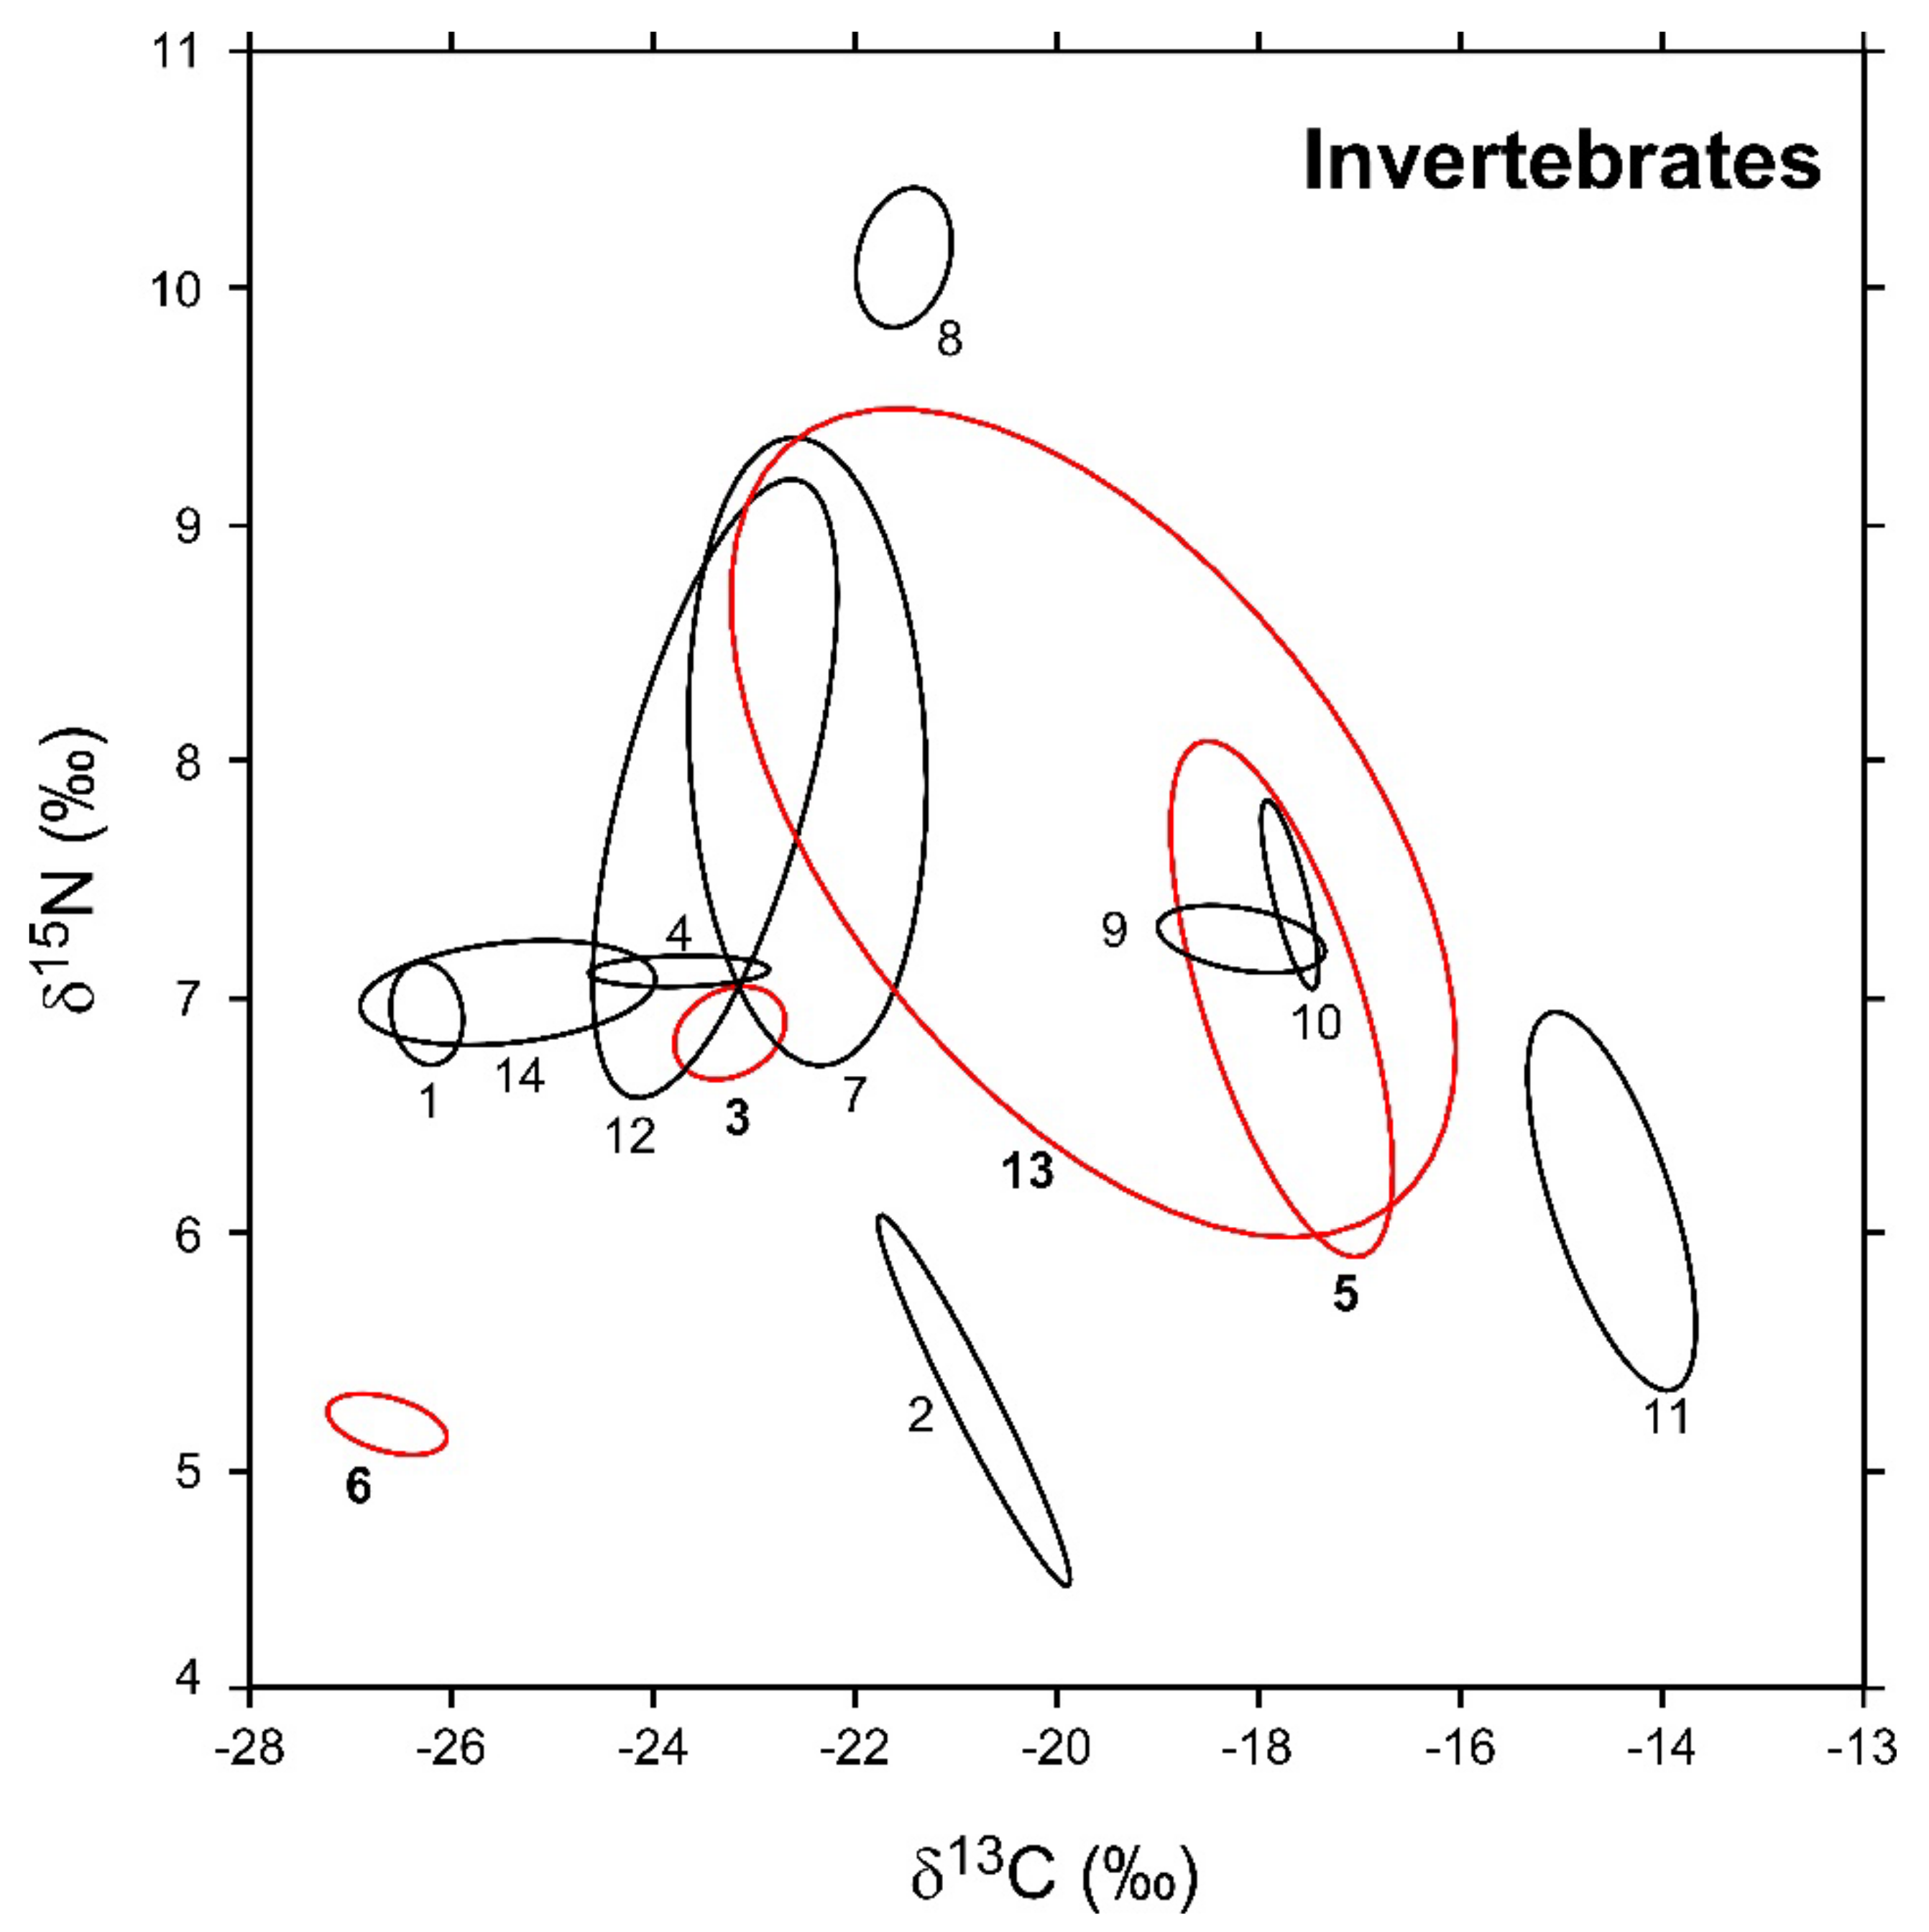
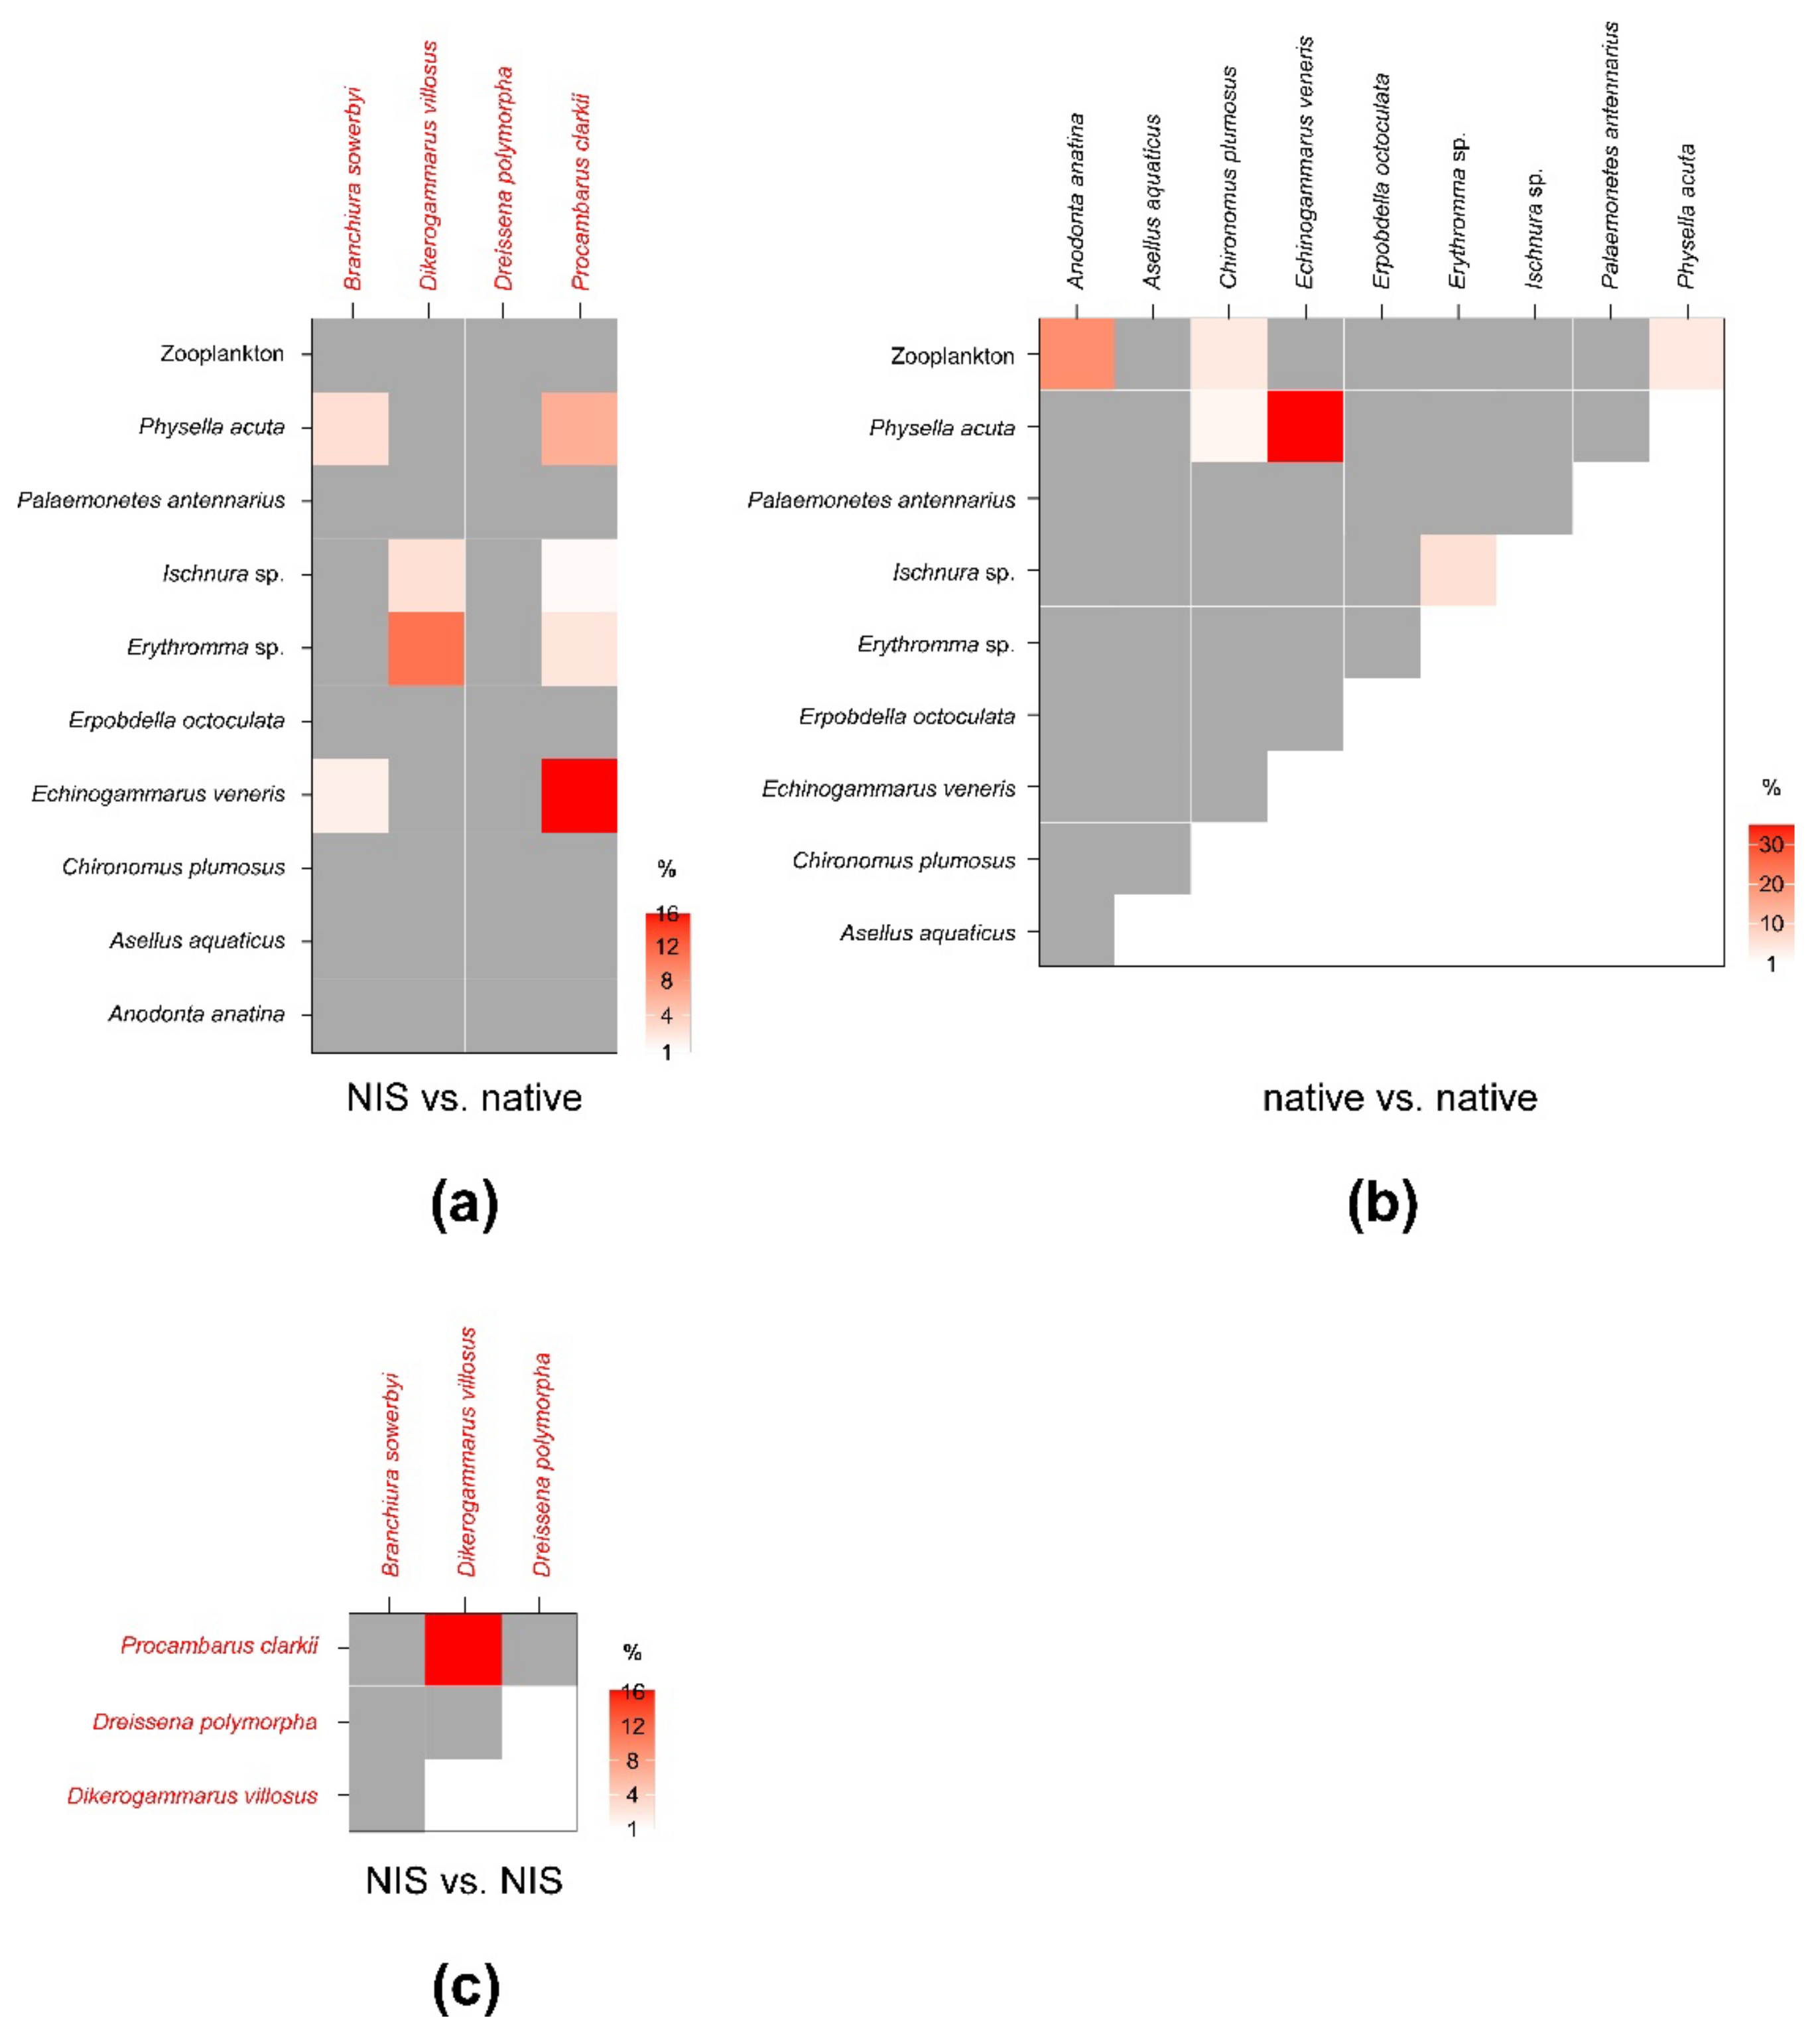
3.1. Invertebrates
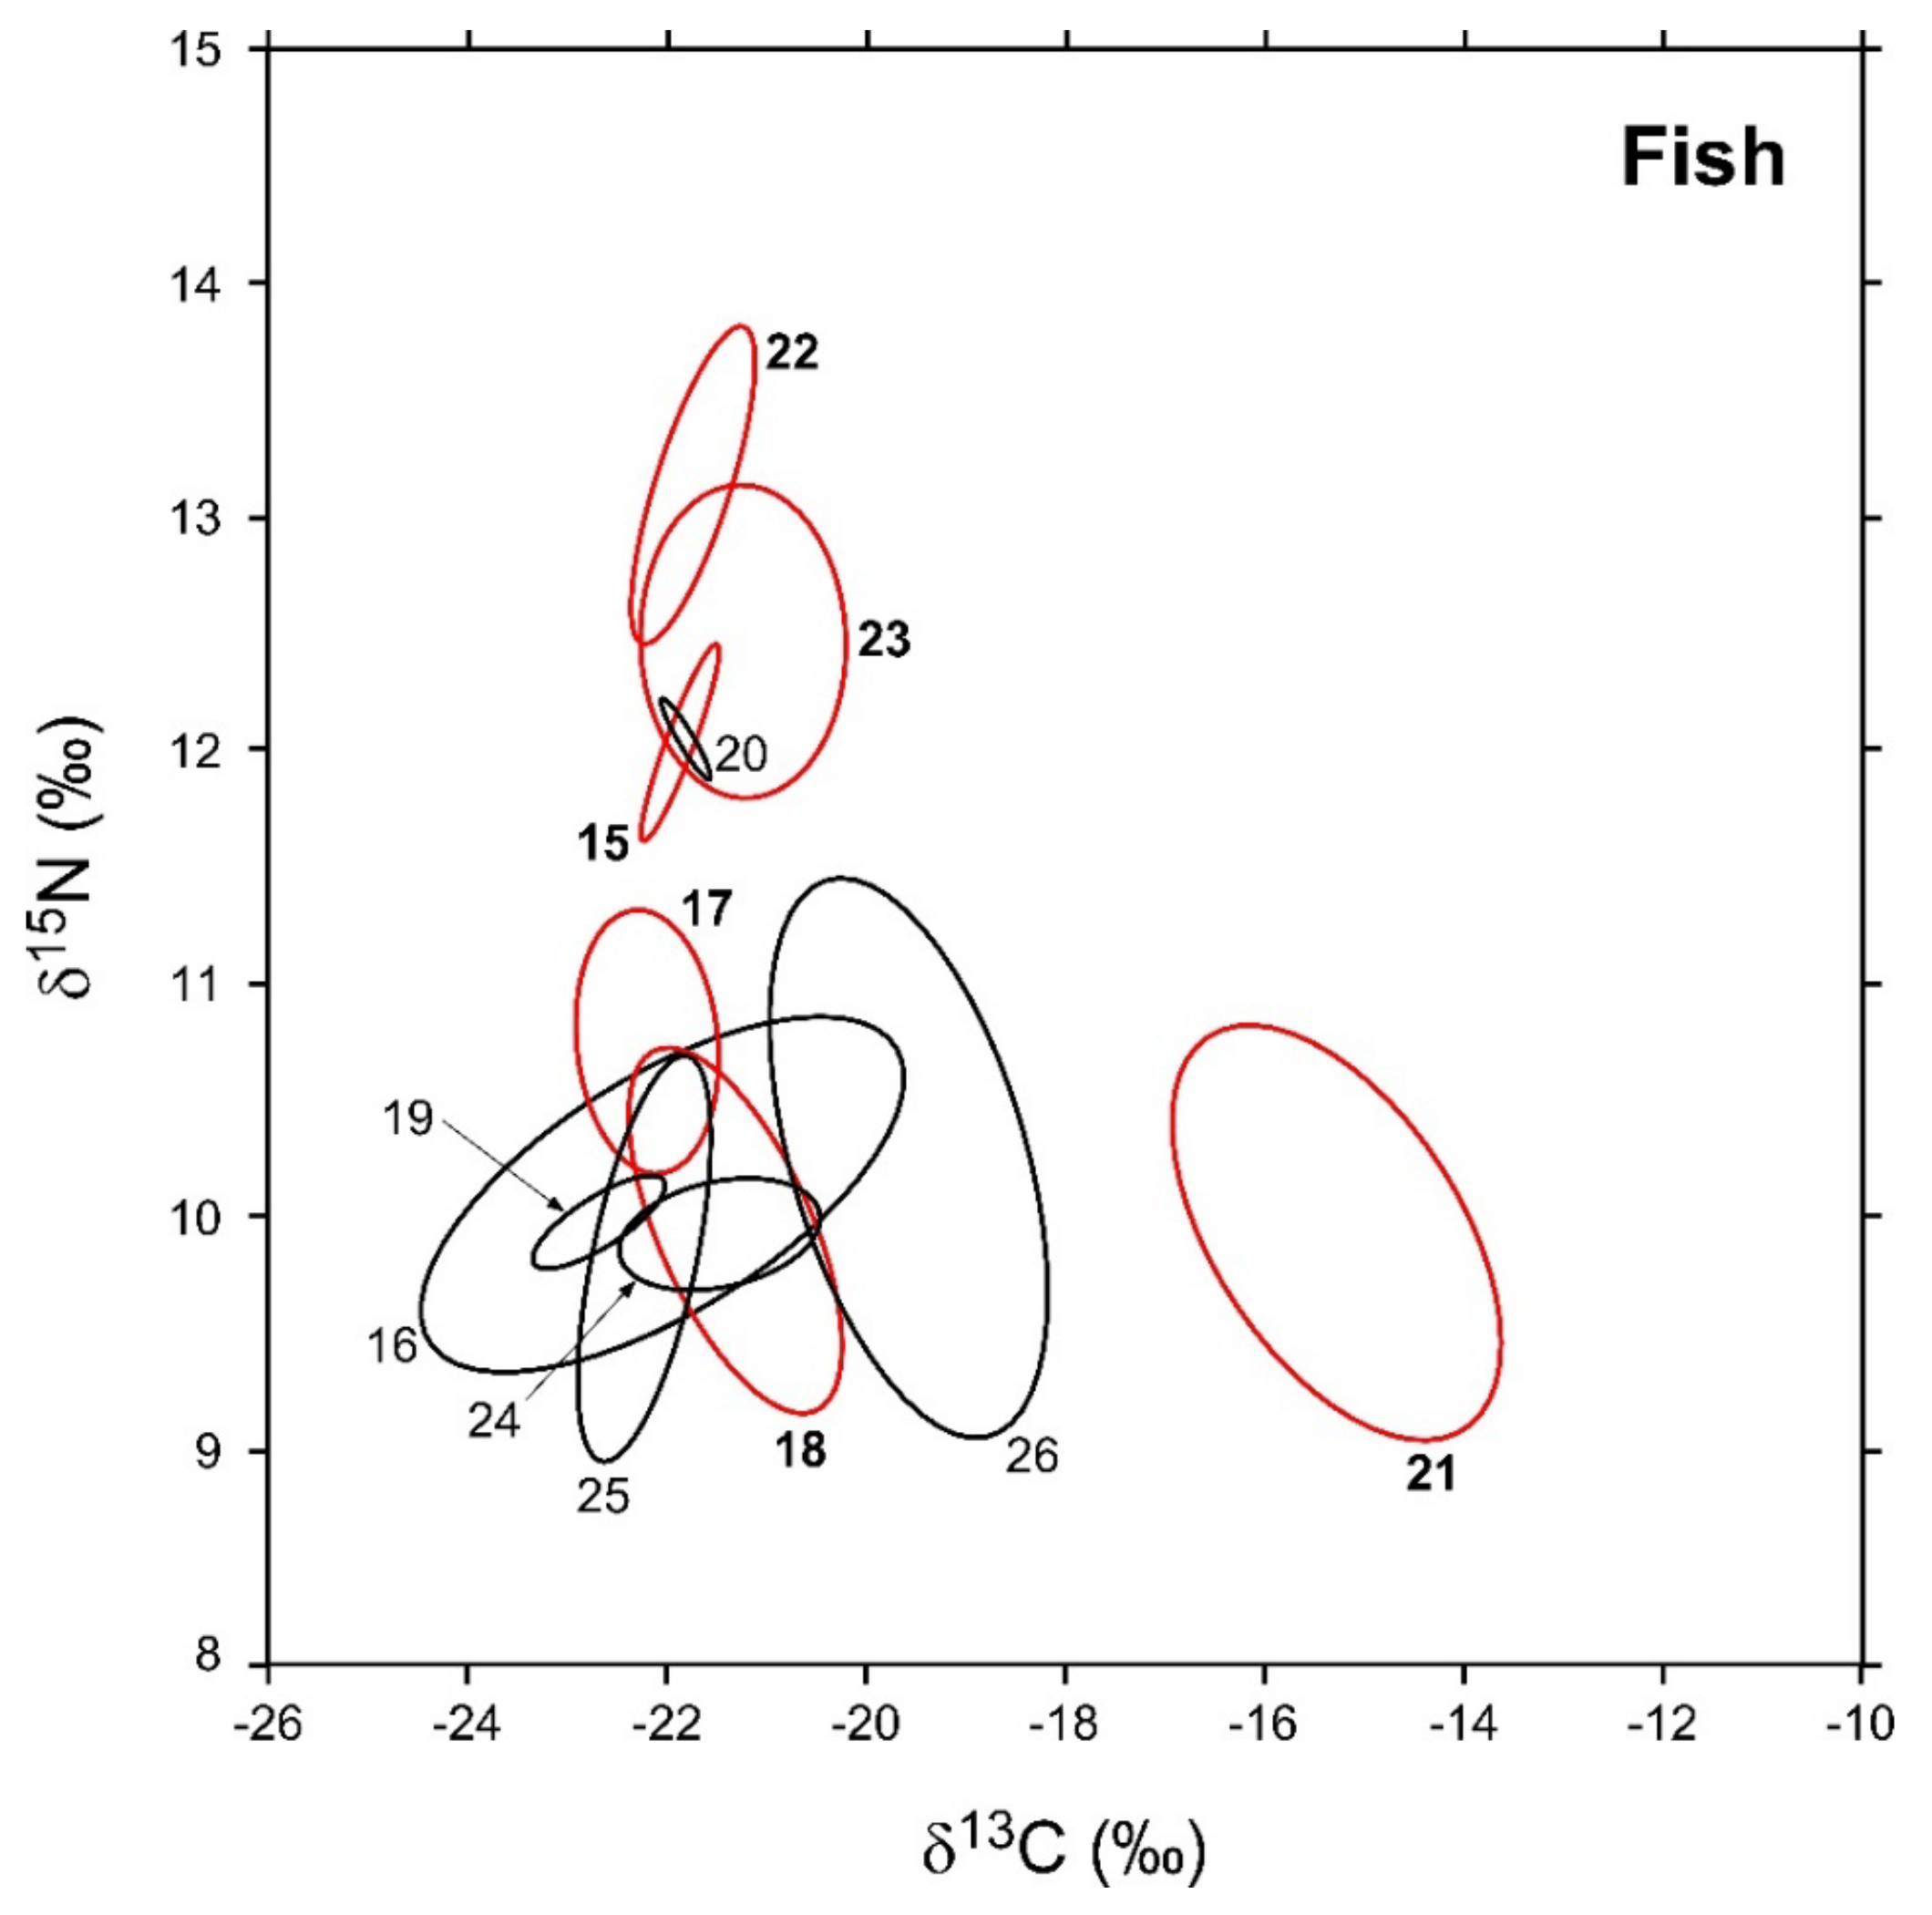
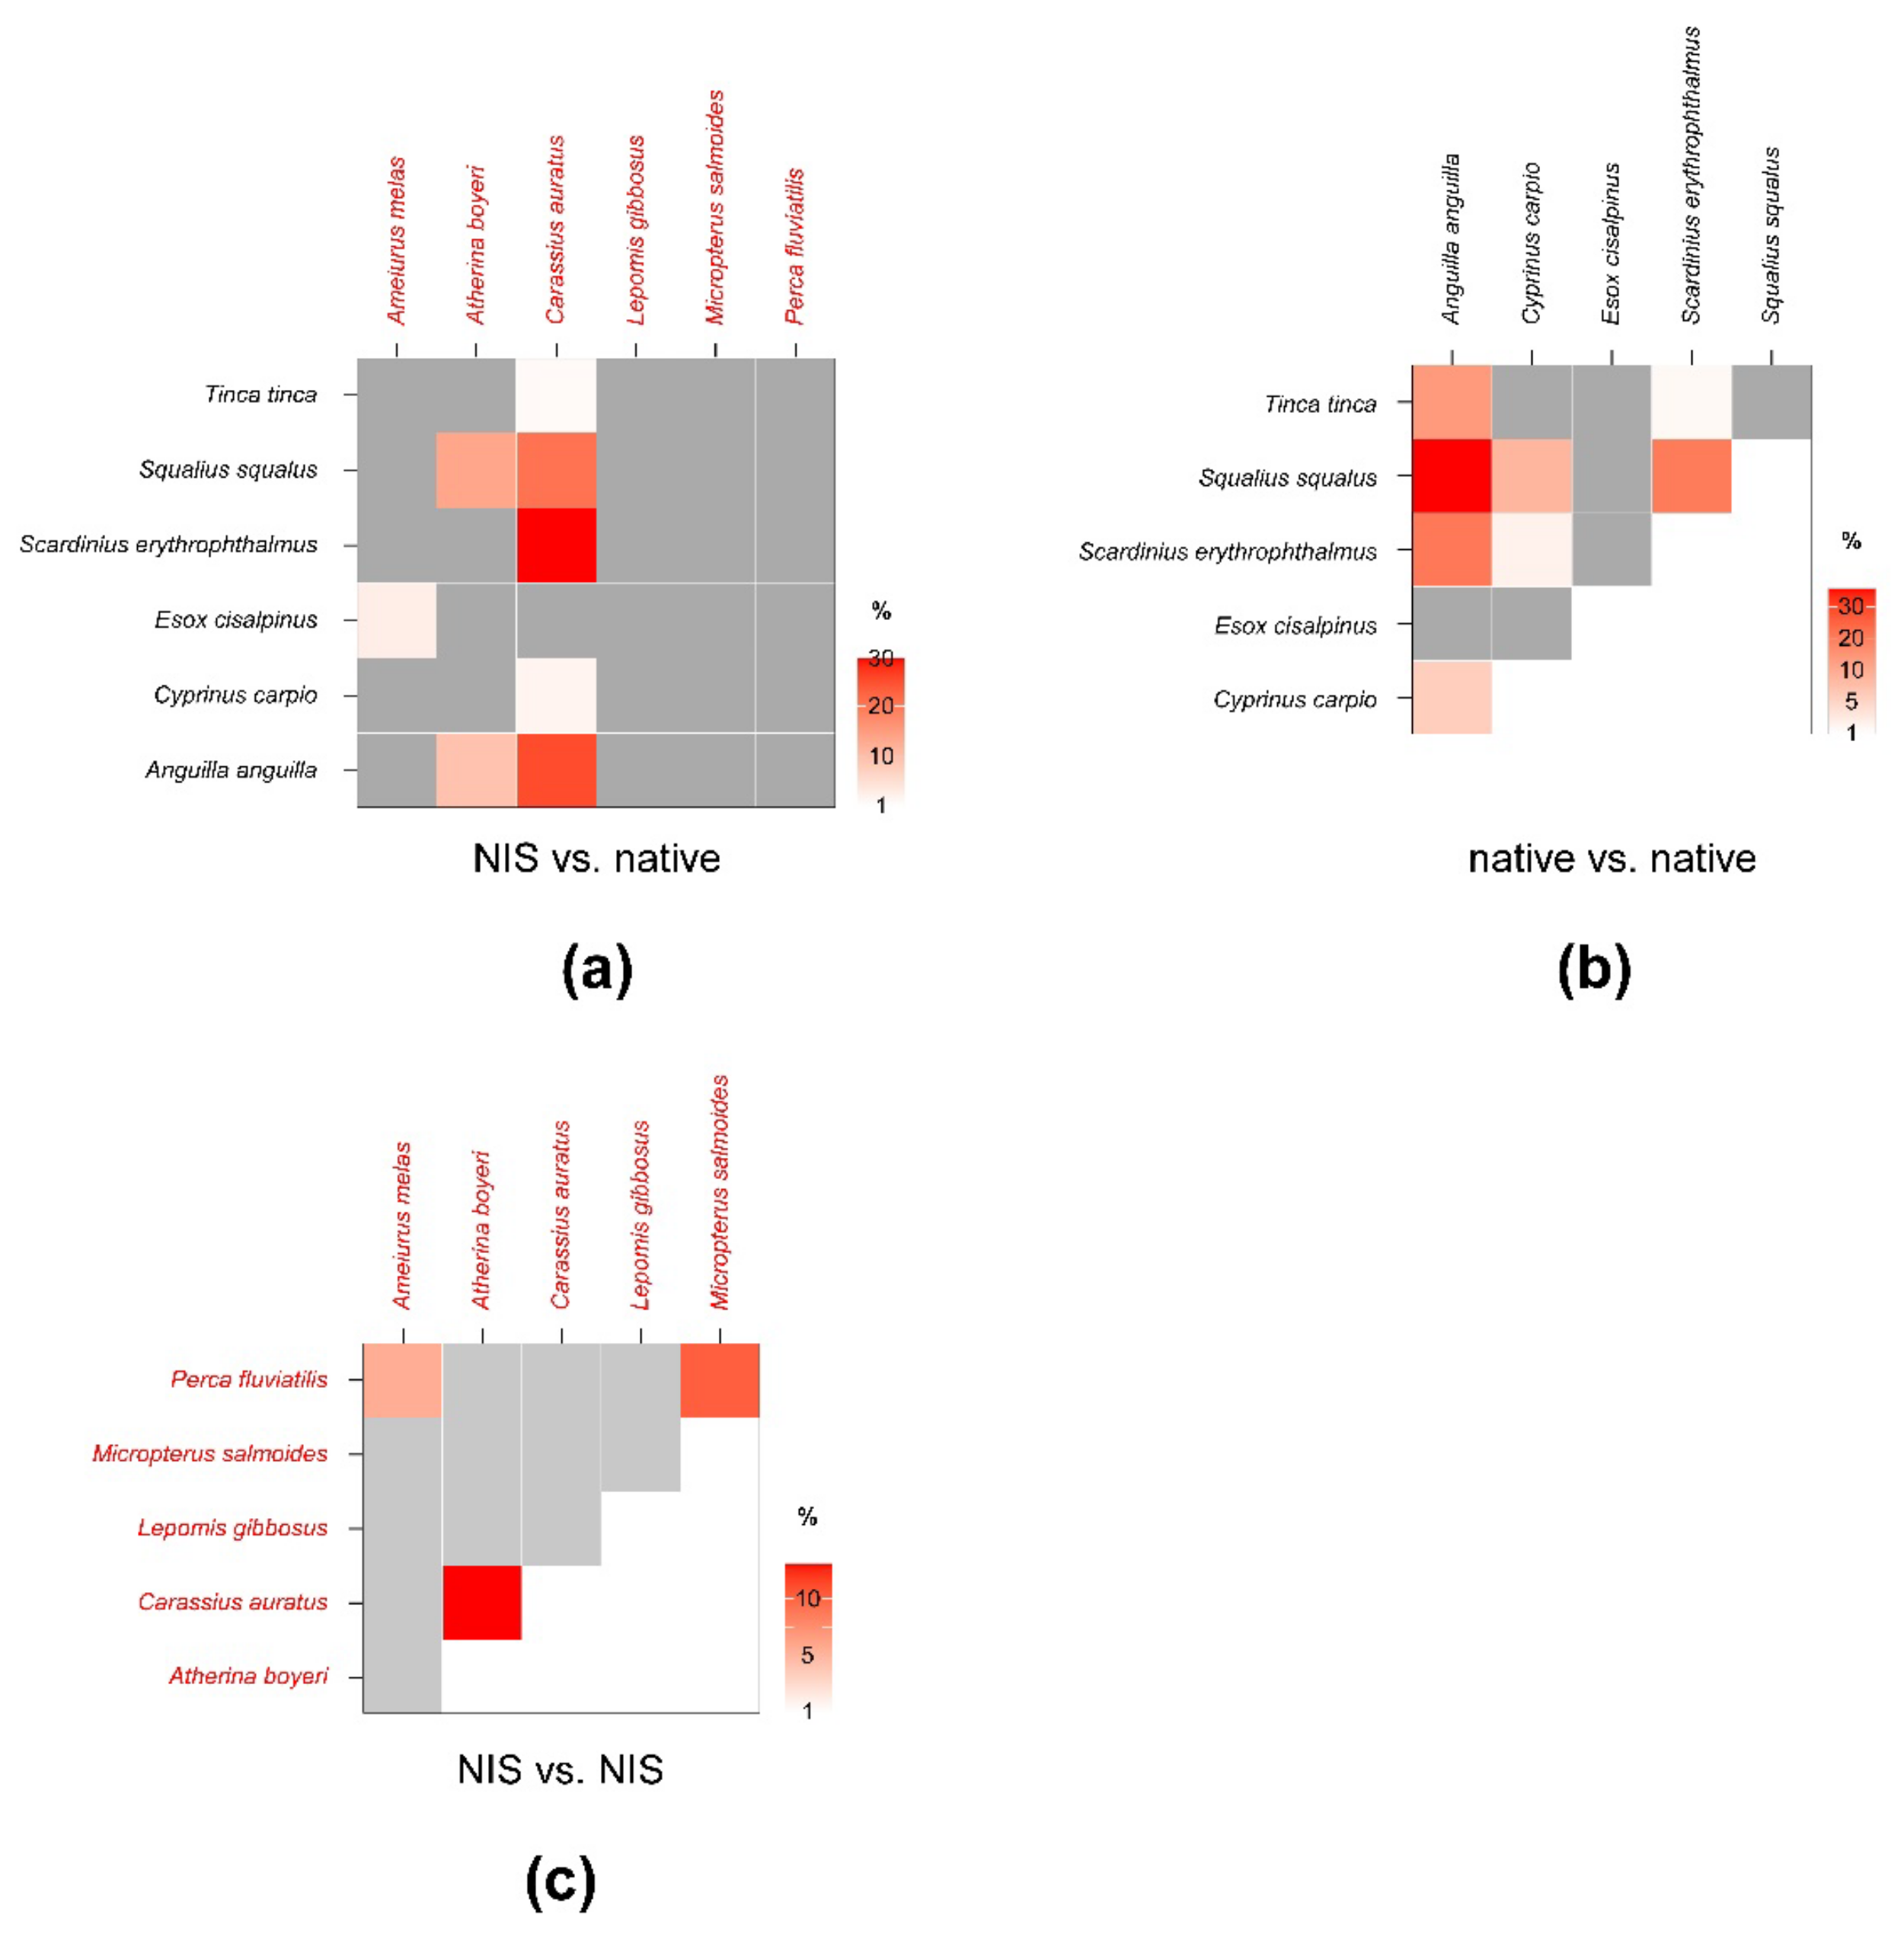
3.2. Fish
4. Discussion
4.1. General Considerations
4.2. Species-Specific Issues
5. Conclusions
Author Contributions
Funding
Institutional Review Board Statement
Informed Consent Statement
Data Availability Statement
Acknowledgments
Conflicts of Interest
Appendix A

| Taxon | 2018 | 2016 | Total | Mean C:N | C:N Range | Mean Length | Length Range |
|---|---|---|---|---|---|---|---|
| Invertebrates | |||||||
| Anodonta anatina * | --- | 5 | 5 | 7.66 ± 0.61 | 7.04–8.32 | 99.7 ± 13.88 | 87–116 |
| Asellus aquaticus | 5 | --- | 5 | 3.99 ± 1.12 | 2.77–5.78 | 8.47 ± 2.06 | 6.7–11.8 |
| Branchiura sowerbyi | 3 | 3 | 6 | 5.53 ± 0.23 | 5.22–5.75 | 46.83 ± 19.05 | 29–77 |
| Chironomus plumosus | 3 | 3 | 6 | 6.58 ± 0.39 | 6.14–7.09 | 5.8 ± 1.89 | 3.3–8.2 |
| Dikerogammarus villosus | 54 | --- | 54 | 4.96 ± 0.45 | 4.31–5.9 | 12.71 ± 4.64 | 5.4–20.2 |
| Dreissena polymorpha * | --- | 8 | 8 | 4.65 ± 0.36 | 4.28–5.21 | 17.63 ± 5.93 | 10–26 |
| Echinogammarus veneris | 16 | 4 | 20 | 5.52 ± 0.9 | 4.39–8.03 | 7.37 ± 1.14 | 5.3–9.3 |
| Erpobdella octoculata | 3 | 3 | 6 | 4.25 ± 0.24 | 3.89–4.51 | 14.17 ± 4.49 | 7–19 |
| Erythromma sp. | 12 | --- | 12 | 3.94 ± 0.17 | 3.66–4.18 | 14.52 ± 1.59 | 12.4–16.5 |
| Ischnura sp. | 6 | --- | 6 | 3.74 ± 0.09 | 3.61–3.86 | 9.11 ± 1.34 | 7.5–11.5 |
| Palaemonetes antennarius | 4 | 2 | 6 | 3.85 ± 0.15 | 3.67–4.08 | 17.33 ± 3.88 | 12–22 |
| Physella acuta * | 6 | --- | 6 | 4.41 ± 0.33 | 4.04–4.87 | 9.5 ± 3.08 | 6–14 |
| Procambarus clarkii | 12 | 6 | 18 | 3.18 ± 0.25 | 2.33–3.46 | 97.26 ± 24.84 | 15–125 |
| Zooplankton | --- | 5 | 5 | 7.49 ± 0.32 | 7.23–8.01 | --- | --- |
| Fish | |||||||
| Ameiurus melas | 6 | --- | 6 | 3.15 ± 0.05 | 3.09–3.24 | 188.75 ± 6.18 | 184–197 |
| Anguilla anguilla | 6 | --- | 6 | 4.89 ± 1.92 | 3.75–8.44 | 401.25 ± 40.49 | 370–460 |
| Atherina boyeri | 21 | --- | 21 | 3.13 ± 0.32 | 2.45–3.65 | 62.95 ± 13.95 | 35–80 |
| Carassius auratus | 15 | --- | 15 | 3.16 ± 0.13 | 2.94–3.39 | 203.87 ± 94.52 | 91–312 |
| Cyprinus carpio | 6 | --- | 6 | 3.2 ± 0.2 | 2.93–3.43 | 326.83 ± 100.75 | 240–480 |
| Esox cisalpinus | 8 | --- | 8 | 3.12 ± 0.02 | 3.07–3.14 | 308.38 ± 74.41 | 222–412 |
| Lepomis gibbosus | 26 | --- | 26 | 3.3 ± 0.05 | 3.21–3.45 | 76.5 ± 13.37 | 45–95 |
| Micropterus salmoides | 7 | --- | 7 | 3.14 ± 0.1 | 3.06–3.29 | 183.86 ± 17.14 | 165–210 |
| Perca fluviatilis | 19 | --- | 19 | 3.19 ± 0.08 | 3.03–3.33 | 145.16 ± 32.06 | 58–205 |
| Scardinius erythrophthalmus | 8 | --- | 8 | 3.11 ± 0.1 | 2.96–3.24 | 143.43 ± 22.45 | 120–182 |
| Squalius squalus | 8 | --- | 8 | 3.29 ± 0.12 | 3.04–3.48 | 99.67 ± 46.65 | 53–150 |
| Tinca tinca | 10 | --- | 10 | 3.23 ± 0.1 | 3.18–3.46 | 243.25 ± 45.96 | 160–300 |
Appendix B
| Taxon | 1 | 2 | 3 | 4 | 5 | 6 | 7 | 8 | 9 | 10 | 11 | 12 | 13 |
|---|---|---|---|---|---|---|---|---|---|---|---|---|---|
| Anodonta anatina (1) | |||||||||||||
| Asellus aquaticus (2) | 0.0002 | ||||||||||||
| Branchiura sowerbyi (3) | 0.02 | 0.0009 | |||||||||||
| Chironomus plumosus (4) | 0.0003 | 0.0003 | 0.13 | ||||||||||
| Dikerogammarus villosus (5) | 0.0001 | 0.0001 | 0.0001 | 0.0001 | |||||||||
| Dreissena polymorpha (6) | 0.0001 | 0.0001 | 0.0001 | 0.0001 | 0.0001 | ||||||||
| Echinogammarus veneris (7) | 0.01 | 0.0004 | 0.03 | 0.12 | 0.0001 | 0.0001 | |||||||
| Erpobdella octoculata (8) | 0.0001 | 0.0001 | 0.0001 | 0.0001 | 0.0001 | 0.0001 | 0.0007 | ||||||
| Erythromma sp. (9) | 0.0001 | 0.0001 | 0.0001 | 0.0001 | 0.09 | 0.0001 | 0.0001 | 0.0001 | |||||
| Ischnura sp. (10) | 0.0001 | 0.0002 | 0.0001 | 0.0001 | 0.08 | 0.0001 | 0.0004 | 0.0001 | 0.45 | ||||
| Palaemonetes antennarius (11) | 0.0001 | 0.0001 | 0.0001 | 0.0001 | 0.002 | 0.0001 | 0.0001 | 0.0001 | 0.0001 | 0.0001 | |||
| Physella acuta (12) | 0.15 | 0.001 | 0.02 | 0.02 | 0.0001 | 0.0001 | 0.02 | 0.0013 | 0.0001 | 0.0001 | 0.0001 | ||
| Procambarus clarkii (13) | 0.17 | 0.07 | 0.31 | 0.49 | 0.0001 | 0.0001 | 0.51 | 0.03 | 0.07 | 0.19 | 0.001 | 0.12 | |
| Zooplankton (14) | 0.49 | 0.002 | 0.44 | 0.17 | 0.0001 | 0.0001 | 0.05 | 0.0001 | 0.0001 | 0.0001 | 0.0001 | 0.18 | 0.29 |
| Taxon | 1 | 2 | 3 | 4 | 5 | 6 | 7 | 8 | 9 | 10 | 11 |
|---|---|---|---|---|---|---|---|---|---|---|---|
| Ameiurus melas (1) | |||||||||||
| Anguilla anguilla (2) | 0.002 | ||||||||||
| Atherina boyeri (3) | 0.001 | 0.001 | |||||||||
| Carassius auratus (4) | 0.001 | 0.35 | 0.002 | ||||||||
| Cyprinus carpio (5) | 0.001 | 0.02 | 0.005 | 0.03 | |||||||
| Esox cisalpinus (6) | 0.94 | 0.001 | 0.001 | 0.001 | 0.001 | ||||||
| Lepomis gibbosus (7) | 0.001 | 0.001 | 0.001 | 0.001 | 0.001 | 0.001 | |||||
| Micropterus salmoides (8) | 0.01 | 0.001 | 0.001 | 0.001 | 0.001 | 0.003 | 0.001 | ||||
| Perca fluviatilis (9) | 0.05 | 0.001 | 0.001 | 0.001 | 0.001 | 0.05 | 0.001 | 0.04 | |||
| Scardinius erythrophthalmus (10) | 0.001 | 0.25 | 0.002 | 0.91 | 0.02 | 0.001 | 0.001 | 0.001 | 0.001 | ||
| Squalius squalus (11) | 0.001 | 0.04 | 0.002 | 0.11 | 0.47 | 0.001 | 0.001 | 0.001 | 0.001 | 0.17 | |
| Tinca tinca (12) | 0.001 | 0.43 | 0.001 | 0.007 | 0.002 | 0.001 | 0.001 | 0.001 | 0.001 | 0.01 | 0.002 |
Appendix C
| NIS | Native | Overlap (SEAc) | % Overlap (SEAc) | Overlap (SEAB) | % Overlap (SEAB) | 95% CI | |
|---|---|---|---|---|---|---|---|
| Branchiura sowerbyi | Chironomus plumosus | <0.01 | <1% | <0.01 | <1% | <1% | <1% |
| Echinogammarus veneris | 0.07 | 1.36 | 0.08 | 1.37 | 1.19 | 1.54 | |
| Physella acuta | 0.13 | 2.75 | 0.08 | 1.96 | <1% | 4.35 | |
| Dikerogammarus villosus | Erythromma sp. | 0.32 | 11.36 | 0.39 | 9.44 | 9.43 | 9.46 |
| Ischnura sp. | 0.07 | 2.66 | 0.11 | 2.87 | 2.62 | 2.93 | |
| Dreissena polymorpha | Anodonta anatina | <0.01 | <1% | <0.01 | <1% | <1% | <1% |
| Zooplankton | <0.01 | <1% | <0.01 | <1% | <1% | <1% | |
| Procambarus clarkii | Asellus aquaticus | <0.01 | <1% | <0.01 | <1% | <1% | <1% |
| Echinogammarus veneris | 3.02 | 16.15 | 4.82 | 17.94 | 11.99 | 24.58 | |
| Erpobdella octoculata | <0.01 | <1% | <0.01 | <1% | <1% | <1% | |
| Erythromma sp. | 0.36 | 2.12 | 0.44 | 1.77 | 1.74 | 1.81 | |
| Ischnura sp. | 0.07 | <1% | 0.13 | <1% | <1% | <1% | |
| Physella acuta | 1.35 | 6.74 | 2.26 | 8.45 | 8.34 | 8.57 | |
| Native | Native | Overlap (SEAc) | % Overlap (SEAc) | Overlap (SEAB) | % Overlap (SEAB) | 95% CI | |
|---|---|---|---|---|---|---|---|
| Echinogammarus veneris | Asellus aquaticus | <0.01 | <1% | <0.01 | <1% | <1% | <1% |
| Chironomus plumosus | <0.01 | <1% | <0.01 | <1% | <1% | <1% | |
| Erpobdella octoculata | Asellus aquaticus | <0.01 | <1% | <0.01 | <1% | <1% | <1% |
| Echinogammarus veneris | <0.01 | <1% | <0.01 | <1% | <1% | <1% | |
| Ischnura sp. | Erythromma sp. | 0.02 | 5.79 | 0.03 | 6.02 | 3.31 | 8.45 |
| Physella acuta | Chironomus plumosus | 0.08 | 1.86 | 0.07 | 1.15 | 0.05 | 3.49 |
| Echinogammarus veneris | 2.47 | 35.21 | 3.16 | 30.95 | 22.84 | 42.12 | |
| Zooplankton | Anodonta anatina | 0.24 | 20.38 | 0.27 | 18.12 | 10.22 | 26.04 |
| Chironomus plumosus | 0.05 | 3.88 | 0.05 | 4.01 | 2.33 | 5.86 | |
| Physella acuta | 0.22 | 4 | 0.14 | 3.74 | 2.72 | 5.15 | |
| NIS | NIS | Overlap (SEAc) | % Overlap (SEAc) | Overlap (SEAB) | % Overlap (SEAB) | 95% CI | |
|---|---|---|---|---|---|---|---|
| Procambarus clarkii | Branchiura sowerbyi | <0.01 | <1% | <0.01 | <1% | <1% | <1% |
| Dikerogammarus villosus | 2.73 | 16.22 | 3.59 | 15.83 | 10.38 | 19.28 | |
Appendix D
| NIS | Native | Overlap (SEAc) | % Overlap (SEAc) | Overlap (SEAB) | % Overlap (SEAB) | 95% CI | |
|---|---|---|---|---|---|---|---|
| Ameiurus melas | Anguilla anguilla | <0.01 | <1% | <0.01 | <1% | <1% | <1% |
| Cyprinus carpio | <0.01 | <1% | <0.01 | <1% | <1% | <1% | |
| Esox cisalpinus | <0.01 | 2.73 | <0.01 | 2.32 | 1.54 | 3.03 | |
| Scardinius erythrophthalmus | <0.01 | <1% | <0.01 | <1% | <1% | <1% | |
| Squalius squalus | <0.01 | <1% | <0.01 | <1% | <1% | <1% | |
| Atherina boyeri | Anguilla anguilla | 0.53 | 9.24 | 0.89 | 10.44 | 8.09 | 12.81 |
| Cyprinus carpio | <0.01 | <1% | <0.01 | <1% | <1% | <1% | |
| Esox cisalpinus | <0.01 | <1% | <0.01 | <1% | <1% | <1% | |
| Scardinius erythrophthalmus | <0.01 | <1% | <0.01 | <1% | <1% | <1% | |
| Squalius squalus | 0.34 | 13.28 | 0.29 | 12.59 | 7.82 | 14.52 | |
| Carassius auratus | Anguilla anguilla | 1.4 | 24.79 | 1.67 | 23.7 | 21.27 | 26.23 |
| Cyprinus carpio | 0.04 | 1.69 | 0.05 | 2.21 | 1.06 | 3.51 | |
| Esox cisalpinus | <0.01 | <1% | <0.01 | <1% | <1% | <1% | |
| Scardinius erythrophthalmus | 0.65 | 29.02 | 0.63 | 25.1 | 22 | 32.17 | |
| Squalius squalus | 0.62 | 20.32 | 0.75 | 18.46 | 17.66 | 22.54 | |
| Tinca tinca | 0.06 | <1% | 0.08 | <1% | <1% | 1.31 | |
| Micropterus salmoides | Anguilla anguilla | <0.01 | <1% | <0.01 | <1% | <1% | <1% |
| Cyprinus carpio | <0.01 | <1% | <0.01 | <1% | <1% | <1% | |
| Esox cisalpinus | <0.01 | <1% | <0.01 | <1% | <1% | <1% | |
| Scardinius erythrophthalmus | <0.01 | <1% | <0.01 | <1% | <1% | <1% | |
| Squalius squalus | <0.01 | <1% | <0.01 | <1% | <1% | <1% | |
| Perca fluviatilis | Anguilla anguilla | <0.01 | <1% | <0.01 | <1% | <1% | <1% |
| Cyprinus carpio | <0.01 | <1% | <0.01 | <1% | <1% | <1% | |
| Esox cisalpinus | <0.01 | <1% | <0.01 | <1% | <1% | <1% | |
| Scardinius erythrophthalmus | <0.01 | <1% | <0.01 | <1% | <1% | <1% | |
| Squalius squalus | <0.01 | <1% | <0.01 | <1% | <1% | <1% | |
| Tinca tinca | <0.01 | <1% | <0.01 | <1% | <1% | <1% | |
| Native | Native | Overlap (SEAc) | % Overlap (SEAc) | Overlap (SEAB) | % Overlap (SEAB) | 95% CI | |
|---|---|---|---|---|---|---|---|
| Anguilla anguilla | Cyprinus carpio | 0.29 | 5.89 | 0.31 | 5.05 | 3.56 | 6.36 |
| Esox cisalpinus | <0.01 | <1% | <0.01 | <1% | <1% | <1% | |
| Scardinius erythrophthalmus | 0.77 | 15.54 | 0.69 | 10.71 | 8.02 | 16.25 | |
| Squalius squalus | 1.21 | 22.88 | 1.28 | 18.14 | 16.07 | 23.24 | |
| Tinca tinca | 1.04 | 11.85 | 0.97 | 11.33 | 8.12 | 12.38 | |
| Scardinius erythrophthalmus | Esox lucius | <0.01 | <1% | <0.01 | <1% | <1% | <1% |
| Cyprinus carpio | 0.02 | 1.72 | <0.01 | 1.6 | 1.25 | 1.93 | |
| Squalius squalus | Esox lucius | <0.01 | <1% | <0.01 | <1% | <1% | <1% |
| Cyprinus carpio | 0.15 | 8.66 | 0.08 | 7.21 | 5.53 | 9.43 | |
| Scardinius erythrophthalmus | 0.31 | 15.12 | 0.37 | 12.62 | 11.72 | 14.89 | |
| Tinca tinca | Scardinius erythrophthalmus | 0.04 | <1% | 0.07 | 1.05 | <1% | 1.16 |
| NIS | NIS | Overlap (SEAc) | % Overlap (SEAc) | Overlap (SEAB) | % Overlap (SEAB) | 95% CI | |
|---|---|---|---|---|---|---|---|
| Atherina boyeri | Ameiurus melas | <0.01 | <1% | <0.01 | <1% | <1% | <1% |
| Carassius auratus | Ameiurus melas | <0.01 | <1% | <0.01 | <1% | <1% | <1% |
| Atherina boyeri | 0.39 | 13.1 | 0.61 | 18.77 | 12.02 | 20.58 | |
| Micropterus salmoides | Ameiurus melas | <0.01 | <1% | <0.01 | <1% | <1% | <1% |
| Atherina boyeri | <0.01 | <1% | <0.01 | <1% | <1% | <1% | |
| Carassius auratus | <0.01 | <1% | <0.01 | <1% | <1% | <1% | |
| Perca fluviatilis | Ameiurus melas | 0.13 | 5.56 | 0.27 | 7.59 | 4.54 | 7.66 |
| Micropterus salmoides | 0.29 | 10.26 | 0.34 | 10.69 | 8.09 | 12.33 | |
| Atherina boyeri | <0.01 | <1% | <0.01 | <1% | <1% | <1% | |
| Carassius auratus | <0.01 | <1% | <0.01 | <1% | <1% | <1% | |
References
- Gherardi, F. Biological Invaders in Inland Waters: Profiles, Distribution, and Threats; Springer: Dordrecht, The Netherlands, 2007; Chapter 1; pp. 3–25. [Google Scholar]
- Dudgeon, D. Freshwater Biodiversity; Cambridge University Press: Cambridge, UK, 2020. [Google Scholar]
- UNEP. Convention on Biological Diversity; UNEP: Nairobi, Kenya, 1992. [Google Scholar]
- IUCN. IUCN Guidelines for the Prevention of Biodiversity Loss Caused by Alien Invasive Species; Species Survival Commission: Gland, CH, USA, 2000. [Google Scholar]
- Blackburn, T.M.; Pyšek, P.; Bacher, S.; Carlton, J.T.; Duncan, R.P.; Jarošík, V.; Wilson, J.R.U.; Richardson, D.M. A proposed unified framework for biological invasions. Trends Ecol. Evol. 2011, 26, 333–339. [Google Scholar] [CrossRef] [PubMed]
- Pyšek, P.; Hulme, P.E.; Simberloff, D.; Bacher, S.; Blackburn, T.M.; Carlton, J.T.; Dawson, W.; Essl, F.; Foxcroft, L.C.; Genovesi, P.; et al. Scientists’ warning on invasive alien species. Biol. Rev. 2020, 95, 1511–1534. [Google Scholar] [CrossRef] [PubMed]
- Crystal-Ornelas, R.; Lockwood, J.L. The ‘known unknowns’ of invasive species impact measurement. Biol. Invasions 2020, 22, 1513–1525. [Google Scholar] [CrossRef]
- Higgins, S.N.; Vander Zanden, M.J. What a difference a species makes: A meta–analysis of dreissenid mussel impacts on freshwater ecosystems. Ecol. Monogr. 2010, 80, 179–196. [Google Scholar] [CrossRef]
- Twardochleb, L.A.; Olden, J.D.; Larson, E.R. A global meta-analysis of the ecological impacts of nonnative crayfish. Freshw. Sci. 2013, 32, 1367–1382. [Google Scholar] [CrossRef]
- Gallardo, B.; Clavero, M.; Sánchez, M.I.; Vilà, M. Global ecological impacts of invasive species in aquatic ecosystems. Glob. Chang. Biol. 2016, 22, 151–163. [Google Scholar] [CrossRef]
- Mollot, G.; Pantel, J.H.; Romanuk, T.N. The effects of invasive species on the decline in species richness: A global meta-analysis. Adv. Ecol. Res. 2017, 56, 61–83. [Google Scholar]
- Strayer, D.L. Alien species in fresh waters: Ecological effects, interactions with other stressors, and prospects for the future. Freshwat. Biol. 2010, 55, 152–174. [Google Scholar] [CrossRef]
- Guareschi, S.; Laini, A.; England, J.; Barrett, J.; Wood, P.J. Multiple co-occurrent alien invaders constrain aquatic biodiversity in rivers. Ecol. Appl. 2021, 31, e02385. [Google Scholar] [CrossRef]
- Simberloff, D.; Von Holle, B. Positive interactions of non-indigenous species: Invasional meltdown? Biol. Invasions 1999, 1, 21–32. [Google Scholar] [CrossRef]
- Preston, D.L.; Henderson, J.S.; Johnson, P.T.J. Community ecology of invasions: Direct and indirect effects of multiple invasive species on aquatic communities. Ecology 2012, 93, 1254–1261. [Google Scholar] [CrossRef] [PubMed]
- Kuebbing, S.E.; Nuñez, M.A.; Simberloff, D. Current mismatch between research and conservation efforts: The need to study co-occurring invasive plant species. Biol. Conserv. 2013, 160, 121–129. [Google Scholar] [CrossRef]
- Liversage, K.; Kotta, J.; Kuprijanov, I.; Rätsep, M.; Nõomaa, K. A trophic cascade facilitates native habitat providers within assemblages of multiple invasive marine species. Ecosphere 2021, 12, e03621. [Google Scholar] [CrossRef]
- Jackson, M.C. Interactions among multiple invasive animals. Ecology 2015, 96, 2035–2041. [Google Scholar] [CrossRef]
- Elton, C.S. The Ecology of Invasions by Animals and Plants; Chapman & Hall: New York, NY, USA, 1958; p. 181. [Google Scholar]
- David, P.; Thébault, E.; Anneville, O.; Duyck, P.F.; Chapuis, E.; Loeuille, N. Impacts of Invasive Species on Food Webs: A Review of Empirical Data. Adv. Ecol. Res. 2017, 56, 1–60. [Google Scholar]
- Jackson, M.C.; Wasserman, R.J.; Grey, J.; Ricciardi, A.; Dick, J.T.A.; Alexander, M.E. Novel and disrupted trophic links following invasion in freshwater ecosystems. Adv. Ecol. Res. 2017, 57, 55–97. [Google Scholar]
- Bartley, T.J.; McCann, K.S.; Bieg, C.; Cazelles, K.; Granados, M.; Guzzo, M.M.; MacDougall, A.S.; Tunney, T.D.; McMeans, B.C. Food web rewiring in a changing world. Nat. Ecol. Evol. 2019, 3, 345–354. [Google Scholar] [CrossRef] [PubMed]
- Hui, C.; Richardson, D.M. How to invade an ecological network. Trends Ecol. Evol. 2019, 34, 121–131. [Google Scholar] [CrossRef]
- Della Bella, V. (Ed.) Caratterizzazione e Diffusione delle Specie Aliene Acquatiche e di Ambienti Umidi in Umbria; ARPA Umbria: Perugia, Italy, 2020; p. 288. [Google Scholar]
- Tran, T.N.Q.; Jackson, M.C.; Sheath, D.; Verreycken, H.; Britton, J.R. Patterns of trophic niche divergence between invasive and native fishes in wild communities are predictable from mesocosm studies. J. Anim. Ecol. 2015, 84, 1071–1080. [Google Scholar] [CrossRef]
- Britton, J.R.; Gutmann Roberts, C.; Amat Trigo, F.; Nolan, E.T.; De Santis, V. Predicting the ecological impacts of an alien invader: Experimental approaches reveal the trophic consequences of competition. J. Anim. Ecol. 2019, 88, 1066–1078. [Google Scholar] [CrossRef]
- Dominguez Almela, V.; South, J.; Britton, J.R. Predicting the competitive interactions and trophic niche consequences of a globally invasive fish with threatened native species. J. Anim. Ecol. 2021, 90, 2651–2662. [Google Scholar] [CrossRef] [PubMed]
- Lorenzoni, M.; Corboli, M.; Dörr, A.J.M.; Giovinazzo, G.; Selvi, S.; Mearelli, M. Diets of Micropterus salmoides Lac. and Esox lucius L. in Lake Trasimeno (Umbria, Italy) and their diet overlap. Bull. Fr. Peche Piscic. 2002, 365–366, 537–547. [Google Scholar] [CrossRef]
- Havens, K.E.; Elia, A.C.; Taticchi, M.I.; Fulton, R.S. Zooplankton–phytoplankton relationships in shallow subtropical versus temperate lakes Apopka (Florida, USA) and Trasimeno (Umbria, Italy). Hydrobiologia 2009, 628, 165–175. [Google Scholar] [CrossRef]
- Pallottini, M.; Pagliarini, S.; Catasti, M.; La Porta, G.; Selvaggi, R.; Gaino, E.; Spacone, L.; Di Giulio, A.M.; Ali, A.; Goretti, E. Population dynamics and seasonal patterns of Chironomus plumosus (Diptera, Chironomidae) in the shallow Lake Trasimeno, Central Italy. Sustainability 2023, 15, 851. [Google Scholar] [CrossRef]
- McMeans, B.C.; McCann, K.S.; Humphries, M.; Rooney, N.; Fisk, A.T. Food web structure in temporally-forced ecosystems. Trends Ecol. Evol. 2015, 30, 662–672. [Google Scholar] [CrossRef]
- McMeans, B.C.; McCann, K.S.; Guzzo, M.M.; Bartley, T.J.; Bieg, C.; Blanchfield, P.J.; Fernandes, T.; Giacomini, H.C.; Middel, T.; Rennie, M.D.; et al. Winter in water: Differential responses and the maintenance of biodiversity. Ecol. Lett. 2020, 23, 922–938. [Google Scholar] [CrossRef] [PubMed]
- Mancinelli, G.; Vizzini, S. Assessing anthropogenic pressures on coastal marine ecosystems using stable CNS isotopes: State of the art, knowledge gaps, and community-scale perspectives. Estuar. Coast. Shelf Sci. 2015, 156, 195–204. [Google Scholar] [CrossRef]
- McCue, M.D.; Javal, M.; Clusella-Trullas, S.; Le Roux, J.J.; Jackson, M.C.; Ellis, A.G.; Richardson, D.M.; Valentine, A.J.; Terblanche, J.S. Using stable isotope analysis to answer fundamental questions in invasion ecology: Progress and prospects. Methods Ecol. Evol. 2020, 11, 196–214. [Google Scholar] [CrossRef]
- Bearhop, S.; Adams, C.E.; Waldron, S.; Fuller, R.A.; Macleod, H. Determining trophic niche width: A novel approach using stable isotope analysis. J. Anim. Ecol. 2004, 73, 1007–1012. [Google Scholar] [CrossRef]
- Newsome, S.D.; Martinez del Rio, C.; Bearhop, S.; Phillips, D.L. A niche for isotopic ecology. Front. Ecol. Environ. 2007, 5, 429–436. [Google Scholar] [CrossRef]
- Rodríguez-Malagón, M.A.; Herrera-Montalvo, L.G. Isotopic niche mirrors trophic niche in a vertebrate island invader. Oecologia 2013, 171, 537–544. [Google Scholar] [CrossRef] [PubMed]
- Sheppard, C.E.; Inger, R.; McDonald, R.A.; Barker, S.; Jackson, A.L.; Thompson, F.J.; Vitikainen, E.I.K.; Cant, M.A.; Marshall, H.H. Intragroup competition predicts individual foraging specialisation in a group-living mammal. Ecol. Lett. 2018, 21, 665–673. [Google Scholar] [CrossRef]
- Stewart, J.D.; Rohner, C.A.; Araujo, G.; Avila, J.; Fernando, D.; Forsberg, K.; Ponzo, A.; Rambahiniarison, J.M.; Kurle, C.M.; Semmens, B.X. Trophic overlap in mobulid rays: Insights from stable isotope analysis. Mar. Ecol. Prog. Ser. 2017, 580, 131–151. [Google Scholar] [CrossRef]
- De Santis, V.; Cicala, D.; Baneschi, I.; Boschi, C.; Brignone, S.; Iaia, M.; Zaupa, S.; Volta, P. Non-native fish assemblages display potential competitive advantages in two protected small and shallow lakes of northern Italy. Glob. Ecol. Conserv. 2022, 35, e02082. [Google Scholar]
- Cicala, D.; Polgar, G.; Mor, J.R.; Piscia, R.; Brignone, S.; Zaupa, S.; Volta, P. Trophic niches, trophic positions, and niche overlaps between non-native and native fish species in a subalpine lake. Water 2020, 12, 3475. [Google Scholar] [CrossRef]
- Ludovisi, A.; Gaino, E. Meteorological and water quality changes in Lake Trasimeno (Umbria, Italy) during the last fifty years. J. Limnol. 2010, 69, 174–188. [Google Scholar] [CrossRef]
- Ludovisi, A.; Poletti, A. Use of thermodynamic indices as ecological indicators of the development state of lake ecosystems. 1. Entropy production indices. Ecol. Modell. 2003, 159, 203–222. [Google Scholar] [CrossRef]
- Bresciani, M.; Pinardi, M.; Free, G.; Luciani, G.; Ghebrehiwot, S.; Laanen, M.; Peters, S.; Della Bella, V.; Padula, R.; Giardino, C. The use of multisource optical sensors to study phytoplankton spatio-temporal variation in a Shallow Turbid Lake. Water 2020, 12, 284. [Google Scholar] [CrossRef]
- Marchegiano, M.; Gliozzi, E.; Ceschin, S.; Mazzini, I.; Adatte, T.; Mazza, R.; Ariztegui, D. Ecology and distribution of living ostracod assemblages in a shallow endorheic lake: The example of the Lake Trasimeno (Umbria, central Italy). J. Limnol. 2017, 76, 469–487. [Google Scholar] [CrossRef][Green Version]
- Parco Regionale del Lago Trasimeno. Aspetti Faunistici–Anfibi Rettili Pesci e Invertebrati. Regione Umbria-Servizio Sistemi Naturalistici e Zootecnia. 2015, p. 55. Available online: https://www.regione.umbria.it/documents/18/2512711/Trasimeno_anfibi_rettili_pesci_inv_ott_15.pdf/359f3c6e-6c97-45b3-9cb9-5b6a57443f7e (accessed on 8 August 2023).
- Carosi, A.; Ghetti, L.; Padula, R.; Lorenzoni, M. Potential effects of global climate change on fisheries in the Trasimeno Lake (Italy), with special reference to the goldfish Carassius auratus invasion and the endemic southern pike Esox cisalpinus decline. Fish. Manag. Ecol. 2019, 26, 500–511. [Google Scholar] [CrossRef]
- Ludovisi, A.; Pandolfi, P.; Illuminata Taticchi, M. The strategy of ecosystem development: Specific dissipation as an indicator of ecosystem maturity. J. Theor. Biol. 2005, 235, 33–43. [Google Scholar] [CrossRef] [PubMed]
- Martinelli, A. Tutela Ambientale del Lago Trasimeno; ARPA Umbria: Perugia, Italy, 2012. [Google Scholar]
- Ludovisi, A.; Minozzo, M.; Pandolfi, P.; Taticchi, M.I. Modelling the horizontal spatial structure of planktonic community in Lake Trasimeno (Umbria, Italy) using multivariate geostatistical methods. Ecol. Modell. 2005, 181, 247–262. [Google Scholar] [CrossRef]
- Ludovisi, A.; Todini, C.; Pandolfi, P.; Taticchi, M.I. Scale patterns of diel distribution of the copepod Cyclops abyssorum Sars in a regulated lake: The relative importance of physical and biological factors. J. Plankton. Res. 2008, 30, 495–509. [Google Scholar] [CrossRef][Green Version]
- Mancinelli, G.; Goretti, E.; Vizzini, S.; Pallottini, M.; Ludovisi, A. Caratterizzazione funzionale delle specie aliene nella rete trofica del lago Trasimeno. In Caratterizzazione e Diffusione delle Specie Aliene Acquatiche e di Ambienti Umidi in Umbria; Della Bella, V., Ed.; ARPA Umbria: Perugia, Italy, 2020; pp. 151–159. [Google Scholar]
- Bianchini, M.L. Species introductions in the aquatic environment: Changes in biodiversity and economics of exploitation. Proc. World Fish. Congr. 1995, 3, 213–222. [Google Scholar]
- Goretti, E.; Marcucci, C.; Di Veroli, A.; Fabrizi, A.; Gaino, E. The tubificids (Annelida, Oligochaeta) of Lake Trasimeno and Lake Piediluco in Central Italy, with a study of SEM morphology of some species. Turk. J. Zool. 2014, 38, 334–341. [Google Scholar] [CrossRef]
- Cianfanelli, S.; Lori, E.; Bodon, M. Non-indigenous freshwater molluscs and their distribution in Italy. In Biological Invaders in Inland Waters: Profiles, Distribution, and Threats; Gherardi, F., Ed.; Springer Netherlands: Dordrecht, The Netherlands, 2007; pp. 103–121. [Google Scholar]
- Natali, M. La carpa erbivora (Ctenopharyngodon idella Val.) nel lago Trasimeno. Risultati a quattro anni dall’immissione sperimentale. Relev. Idrobiol. 1991, 30, 347–356. [Google Scholar]
- Mancinelli, G.; Papadia, P.; Ludovisi, A.; Migoni, D.; Bardelli, R.; Fanizzi, F.P.; Vizzini, S. Beyond the mean: A comparison of trace- and macroelement correlation profiles of two lacustrine populations of the crayfish Procambarus clarkii. Sci. Total Environ. 2018, 624, 1455–1466. [Google Scholar] [CrossRef] [PubMed]
- Mancini, F.; De Giorgi, R.; Ludovisi, A.; Vizzini, S.; Mancinelli, G. Ontogenetic shift in the trophic role of the invasive killer shrimp Dikerogammarus villosus: A stable isotope study. Biol. Invasions 2021, 23, 1803–1817. [Google Scholar] [CrossRef]
- Ludovisi, A.; Goretti, E.; Pallottini, M.; Lucentini, L.; Pizzirani, C.; Vizzini, S.; Mancinelli, G. Stable isotope analysis reveals trophic segregation between the invasive zebra mussel Dreissena polymorpha and the native duck mussel Anodonta anatina in Lake Trasimeno (Italy). Hydrobiologia 2022, 849, 2091–2108. [Google Scholar] [CrossRef]
- R Development Core Team. R: A Language and Environment for Statistical Computing; R Foundation for Statistical Computing: Vienna, Austria, 2023. Available online: http://www.R-project.org/ (accessed on 1 July 2023).
- Anderson, M.J. A new method for non-parametric multivariate analysis of variance. Austral. Ecol. 2001, 26, 32–46. [Google Scholar]
- Gotelli, N.; Hart, E.; Ellison, A. EcoSimR-Null Model Analysis for Ecological Data. R Package Version 0.1.0. 2015. Available online: https://cran.microsoft.com/snapshot/2017-03-22/web/packages/EcoSimR/EcoSimR.pdf (accessed on 1 July 2023).
- Post, D.M.; Layman, C.A.; Arrington, D.A.; Takimoto, G.; Quattrochi, J.; Montana, C.G. Getting to the fat of the matter: Models, methods and assumptions for dealing with lipids in stable isotope analyses. Oecologia 2007, 152, 179–189. [Google Scholar] [CrossRef]
- Logan, J.M.; Jardine, T.D.; Miller, T.J.; Bunn, S.E.; Cunjak, R.A.; Lutcavage, M.E. Lipid corrections in carbon and nitrogen stable isotope analyses: Comparison of chemical extraction and modelling methods. J. Anim. Ecol. 2008, 77, 838–846. [Google Scholar] [CrossRef] [PubMed]
- Jackson, A.L.; Parnell, A.C. SIBER: Stable Isotope Bayesian Ellipses in R. R Package Version 2.1.7. 2023. Available online: http://cran.r-project.org/web/packages/SIBER (accessed on 1 July 2023).
- Jackson, A.L.; Inger, R.; Parnell, A.C.; Bearhop, S. Comparing isotopic niche widths among and within communities: SIBER–Stable Isotope Bayesian Ellipses in R. J. Anim. Ecol. 2011, 80, 595–602. [Google Scholar] [CrossRef] [PubMed]
- Pianka, E.R. The structure of lizard communities. Annu. Rev. Ecol. Syst. 1973, 4, 53–74. [Google Scholar] [CrossRef]
- Schoener, T.W. The Anolis lizards of Bimini: Resource partitioning in a complex fauna. Ecology 1968, 49, 704–726. [Google Scholar] [CrossRef]
- Layman, C.A.; Allgeier, J.E. Characterizing trophic ecology of generalist consumers: A case study of the invasive lionfish in The Bahamas. Mar. Ecol. Prog. Ser. 2012, 448, 131–141. [Google Scholar] [CrossRef]
- Connell, J.H. Diversity and the coevolution of competitors, or the ghost of competition past. Oikos 1980, 35, 131–138. [Google Scholar] [CrossRef]
- Chase, J.; Leibold, M. Ecological Niches: Linking Classical and Contemporary Approaches; University of Chicago Press: Chicago, IL, USA, 2003. [Google Scholar]
- Gotelli, N.J.; Graves, G.R. Null Models in Ecology; Smithsonian Institution Press: Washington, DC, USA, 1996; p. 368. [Google Scholar]
- Soto, I.; Ahmed, D.A.; Balzani, P.; Cuthbert, R.N.; Haubrock, P.J. Sigmoidal curves reflect impacts and dynamics of aquatic invasive species. Sci. Total Environ. 2023, 872, 161818. [Google Scholar] [CrossRef]
- Bøhn, T.; Amundsen, P.-A.; Sparrow, A. Competitive exclusion after invasion? Biol. Invasions 2008, 10, 359–368. [Google Scholar] [CrossRef]
- Lang, I.; Evangelista, C.; Everts, R.M.; Loot, G.; Cucherousset, J. Stable resource polymorphism along the benthic littoral–pelagic axis in an invasive crayfish. Ecol. Evol. 2020, 10, 2650–2660. [Google Scholar] [CrossRef]
- Bøhn, T.; Amundsen, P.-A. The competitive edge of an invading specialist. Ecology 2001, 82, 2150–2163. [Google Scholar] [CrossRef]
- Olsson, K.; Stenroth, P.; Nyström, P.; Granéli, W. Invasions and niche width: Does niche width of an introduced crayfish differ from a native crayfish? Freshwat. Biol. 2009, 54, 1731–1740. [Google Scholar] [CrossRef]
- Brabrand, Å.; Faafeng, B. Habitat shift in roach (Rutilus rutilus) induced by pikeperch (Stizostedion lucioperca) introduction: Predation risk versus pelagic behaviour. Oecologia 1993, 95, 38–46. [Google Scholar] [CrossRef]
- Sharma, C.M.; Borgstrøm, R. Shift in density, habitat use, and diet of perch and roach: An effect of changed predation pressure after manipulation of pike. Fish Res. 2008, 91, 98–106. [Google Scholar] [CrossRef]
- Eloranta, A.P.; Knudsen, R.; Amundsen, P.A. Niche segregation of coexisting Arctic charr (Salvelinus alpinus) and brown trout (Salmo trutta) constrains food web coupling in subarctic lakes. Freshwat. Biol. 2013, 58, 207–221. [Google Scholar] [CrossRef]
- Pacioglu, O.; Zubrod, J.P.; Schulz, R.; Jones, J.I.; Pârvulescu, L. Two is better than one: Combining gut content and stable isotope analyses to infer trophic interactions between native and invasive species. Hydrobiologia 2019, 839, 25–35. [Google Scholar] [CrossRef]
- Haubrock, P.J.; Balzani, P.; Azzini, M.; Inghilesi, A.F.; Veselý, L.; Guo, W.; Tricarico, E. Shared histories of co-evolution may affect trophic interactions in a freshwater community dominated by alien species. Front. Ecol. Evol. 2019, 7, 355. [Google Scholar] [CrossRef]
- Courchamp, F.; Caut, S.; Bonnaud, E.; Bourgeois, K.; Angulo, E.; Watari, Y. Eradication of Alien Invasive Species: Surprise Effects and Conservation Successes. In Island Invasives: Eradication and Management; Veitch, C.R., Clout, M.N., Towns, D.R., Eds.; IUCN: Gland, Switzerland, 2011; pp. 285–289. [Google Scholar]
- Courchamp, F.; Chapuis, J.-L.; Pascal, M. Mammal invaders on islands: Impact, control and control impact. Biol. Rev. 2003, 78, 347–383. [Google Scholar] [CrossRef]
- Bergstrom, D.M.; Lucieer, A.; Kiefer, K.; Wasley, J.; Belbin, L.; Pedersen, T.K.; Chown, S.L. Indirect effects of invasive species removal devastate World Heritage Island. J. Appl. Ecol. 2009, 46, 73–81. [Google Scholar] [CrossRef]
- Russell, J.C.; Kaiser-Bunbury, C.N. Consequences of multispecies introductions on island ecosystems. Annu. Rev. Ecol. Evol. Syst. 2019, 50, 169–190. [Google Scholar] [CrossRef]
- Wang, Y.; Tan, W.; Li, B.; Wen, L.; Lei, G. Habitat alteration facilitates the dominance of invasive species through disrupting niche partitioning in floodplain wetlands. Divers. Distrib. 2021, 27, 1861–1871. [Google Scholar] [CrossRef]
- Alcorlo, P.; Geiger, W.; Otero, M. Feeding preferences and food selection of the red swamp crayfish, Procambarus clarkii, in habitats differing in food item diversity. Crustaceana 2004, 77, 435–453. [Google Scholar]
- Jackson, M.C.; Jones, T.; Milligan, M.; Sheath, D.; Taylor, J.; Ellis, A.; England, J.; Grey, J. Niche differentiation among invasive crayfish and their impacts on ecosystem structure and functioning. Freshw. Biol. 2014, 59, 1123–1135. [Google Scholar] [CrossRef]
- Larson, E.R.; Twardochleb, L.A.; Olden, J.D. Comparison of trophic function between the globally invasive crayfishes Pacifastacus leniusculus and Procambarus clarkii. Limnology 2016, 18, 275–286. [Google Scholar] [CrossRef]
- Chucholl, F.; Chucholl, C. Differences in the functional responses of four invasive and one native crayfish species suggest invader-specific ecological impacts. Freshw. Biol. 2021, 66, 2051–2063. [Google Scholar] [CrossRef]
- Wu, J.; Chen, H.; Jin, B.; Winemiller, K.O.; Wu, S.; Xu, W.; Zhang, H.; Wu, X. Seasonal variation in resource overlap between red swamp crayfish (Procambarus clarkii) and native species in Poyang Lake wetland, China. Front. Environ. Sci. 2022, 10, 923962. [Google Scholar] [CrossRef]
- Gherardi, F.; Barbaresi, S. Feeding opportunism of the red swamp crayfish Procambarus clarkii, an invasive species. Freshw. Crayfish 2008, 16, 77–85. [Google Scholar]
- Hellmann, C.; Worischka, S.; Mehler, E.; Becker, J.; Gergs, R.; Winkelmann, C. The trophic function of Dikerogammarus villosus (Sowinsky, 1894) in invaded rivers: A case study in the Elbe and Rhine. Aquat. Invasions 2015, 10, 385–397. [Google Scholar] [CrossRef]
- Locke, S.A.; Bulté, G.; Forbes, M.R.; Marcogliese, D.J. Estimating diet in individual pumpkinseed sunfish Lepomis gibbosus using stomach contents, stable isotopes and parasites. J. Fish Biol. 2013, 82, 522–537. [Google Scholar] [CrossRef]
- Nikolova, M.; Uzunova, E.; Studenkov, S.; Georgieva, M.; Pehlivanov, L.; Velkov, B. Fееding patterns and seasonal variation in the diet of non-indigenous fish species Lepomis gibbosus L. from shallow eutrophic lakes along River Vit, Bulgaria. Nat. Montenegrina 2008, 7, 71–85. [Google Scholar]
- Godinho, F.; Ferreira, M.T.; Cortes, R.V. The environmental basis of diet variation in pumpkinseed sunfish, Lepomis gibbosus, and largemouth bass, Micropterus salmoides, along an Iberian river basin. Environ. Biol. Fishes 1997, 50, 105–115. [Google Scholar] [CrossRef]
- Andraso, G.M. Summer food habits of pumpkinseeds (Lepomis gibbosus) and bluegills (Lepomis macrochirus) in Presque Isle Bay, Lake Erie. J. Great Lakes Res. 2005, 31, 397–404. [Google Scholar] [CrossRef]
- Rezsu, E.; Specziár, A. Ontogenetic diet profiles and size-dependent diet partitioning of ruffe Gymnocephalus cernuus, perch Perca fluviatilis and pumpkinseed Lepomis gibbosus in Lake Balaton. Ecol. Freshw. Fish 2006, 15, 339–349. [Google Scholar] [CrossRef]
- García-Berthou, E.; Moreno-Amich, R. Rudd (Scardinius erythrophthalmus) introduced to the Iberian peninsula: Feeding ecology in Lake Banyoles. Hydrobiologia 2000, 436, 159–164. [Google Scholar] [CrossRef]
- Ünver, B.; Erk’akan, F. Diet composition of chub, Squalius cephalus (Teleostei: Cyprinidae), in Lake Tödürge, Sivas, Turkey. J. Appl. Ichthyol. 2011, 27, 1350–1355. [Google Scholar] [CrossRef]
- Dörner, H.; Skov, C.; Berg, S.; Schulze, T.; Beare, D.J.; Van der Velde, G. Piscivory and trophic position of Anguilla anguilla in two lakes: Importance of macrozoobenthos density. J. Fish Biol. 2009, 74, 2115–2131. [Google Scholar] [CrossRef] [PubMed]
- Richardson, M.J.; Whoriskey, F.G.; Roy, L.H. Turbidity generation and biological impacts of an exotic fish Carassius auratus, introduced into shallow seasonally anoxic ponds. J. Fish Biol. 1995, 47, 576–585. [Google Scholar] [CrossRef]
- Marić, D. Feeding of Carassius auratus gibelio (Bloch) in Skadar Lake (Montenegro) and competetive relations with autochthonus cyprinid species. Montenegrin Acad. Sci. Arts Glas. Sect. Nat. Sci. 2000, 13, 237–258. [Google Scholar]
- Bissattini, A.M.; Haubrock, P.J.; Buono, V.; Balzani, P.; Borgianni, N.; Stellati, L.; Inghilesi, A.F.; Tancioni, L.; Martinoli, M.; Tricarico, E.; et al. Trophic structure of a pond community dominated by an invasive alien species: Insights from stomach content and stable isotope analyses. Aquat. Conserv. Mar. Freshw. Ecosyst. 2021, 31, 948–963. [Google Scholar] [CrossRef]
- Gaino, E.; Scoccia, F.; Piersanti, S.; Rebora, M.; Bellucci, L.G.; Ludovisi, A. Spicule records of Ephydatia fluviatilis as a proxy for hydrological and environmental changes in the shallow Lake Trasimeno (Umbria, Italy). Hydrobiologia 2012, 679, 139–153. [Google Scholar] [CrossRef]
- Alaş, A.; Altındağ, A.; Yılmaz, M.; Kırpık, M.A.; Ak, A. Feeding habits of tench (Tinca tinca L., 1758) in Beyşehir Lake (Turkey). Turk. J. Fish Aquat. Sci. 2010, 10, 187–194. [Google Scholar] [CrossRef]
- García-Berthou, E. Size- and depth-dependent variation in habitat and diet of the common carp (Cyprinus carpio). Aquat. Sci. 2001, 63, 466–476. [Google Scholar] [CrossRef]
- Rosecchi, E.; Crivelli, A.J. Study of a sand smelt (Atherina boyeri Risso 1810) population reproducing in fresh water. Ecol. Freshw. Fish 1992, 1, 77–85. [Google Scholar] [CrossRef]
- Chrisafi, E.; Kaspiris, P.; Katselis, G. Feeding habits of sand smelt (Atherina boyeri, Risso 1810) in Trichonis Lake (Western Greece). J. Appl. Ichthyol. 2007, 23, 209–214. [Google Scholar] [CrossRef]
- Vizzini, S.; Mazzola, A. Feeding ecology of the sand smelt Atherina boyeri (Risso 1810) (Osteichthyes, Atherinidae) in the western Mediterranean: Evidence for spatial variability based on stable carbon and nitrogen isotopes. Environ. Biol. Fishes 2005, 72, 259–266. [Google Scholar] [CrossRef]
- Vizzini, S.; Mazzola, A. Stable carbon and nitrogen ratios in the sand smelt from a Mediterranean coastal area: Feeding habits and effect of season and size. J. Fish Biol. 2002, 60, 1498–1510. [Google Scholar] [CrossRef]
- Jaćimović, M.; Krpo-Cetković, J.; Skorić, S.; Smederevac-Lalić, M.; Hegedis, A. Seasonal feeding habits and ontogenetic diet shift of black bullhead (Ameiurus melas) in Lake Sava (Serbia). Arch. Biol. Sci. 2021, 73, 513–521. [Google Scholar] [CrossRef]
- Alp, A.; Yeğen, V.; Apaydin Yağci, M.; Uysal, R.; Biçen, E.; Yağci, A. Diet composition and prey selection of the pike, Esox lucius, in Çivril Lake, Turkey. J. Appl. Ichthyol. 2008, 24, 670–677. [Google Scholar] [CrossRef]
- Yazicioglu, O.; Polat, N.; Yilmaz, S. Feeding biology of pike, Esox lucius L., 1758 inhabiting Lake Ladik, Turkey. Turk. J. Fish Aquat. Sci. 2018, 18, 1215–1226. [Google Scholar] [CrossRef] [PubMed]
- Beaudoin, C.P.; Tonn, W.M.; Prepas, E.E.; Wassenaar, L.I. Individual specialization and trophic adaptability of northern pike (Esox lucius): An isotope and dietary analysis. Oecologia 1999, 120, 386–396. [Google Scholar] [CrossRef]
- Landucci, F.; Gigante, D.; Venanzoni, R. An application of the Cocktail method for the classification of the hydrophytic vegetation at Lake Trasimeno (Central Italy). Fitosociologia 2011, 48, 3–22. [Google Scholar]
- Villa, P.; Bresciani, M.; Bolpagni, R.; Pinardi, M.; Giardino, C. A rule-based approach for mapping macrophyte communities using multi-temporal aquatic vegetation indices. Remote Sens. Environ. 2015, 171, 218–233. [Google Scholar] [CrossRef]


| Group | Species | Year of First Record |
|---|---|---|
| Invertebrates | Branchiura sowerbyi Beddard 1892 | <2000 |
| Dikerogammarus villosus Sowinsky 1894 | 2017 | |
| Dreissena polymorpha Pallas 1771 | 1999 | |
| Physella acuta Draparnaud, 1805 # | <1900 | |
| Procambarus clarkii Girard 1852 | 2000 | |
| Sinanodonta woodiana Lea 1834 | 2017 | |
| Fish | Alburnus arborella Bonaparte 1841 | 1975 |
| Ameiurus melas Rafinesque 1820 | 1984 | |
| Atherina boyeri Risso 1810 | 1920 | |
| Carassius auratus Linneus 1758 | 1990 | |
| Ctenopharyngodon idella Valenciennes 1844 * | 1986 | |
| Cyprinus carpio Linneus 1758 # | Roman age | |
| Gambusia holbrooki Girard 1859 | 1927 | |
| Knipowitschia panizzae Verga 1841 | 1976 | |
| Lepomis gibbosus Linneus 1758 | 1926 | |
| Micropterus salmoides Lacépède 1802 | 1990 | |
| Perca fluviatilis Linneus 1758 | 1911 | |
| Pomatoschistus canestrinii Ninni 1883 | 1988 | |
| Pseudorasbora parva Temminck and Schlegels 1825 | 1999 | |
| Sabanejewia larvata De Filippi 1859 | 1970 | |
| Silurus glanis Linneus 1758 * | Unconfirmed |
| Taxon | SEAc | SEAB | 95% | |
|---|---|---|---|---|
| Anodonta anatina | 0.28 | 0.26 | 0.09 | 0.49 |
| Asellus aquaticus | 0.74 | 1.04 | 0.44 | 1.56 |
| Branchiura sowerbyi | 0.36 | 0.35 | 0.19 | 0.67 |
| Chironomus plumosus | 0.08 | 0.08 | 0.03 | 0.16 |
| Dikerogammarus villosus | 2.79 | 2.83 | 2.09 | 3.63 |
| Dreissena polymorpha | 0.23 | 0.23 | 0.09 | 0.42 |
| Echinogammarus veneris | 4.93 | 4.49 | 2.91 | 7.26 |
| Erpobdella octoculata | 0.2 | 0.21 | 0.06 | 0.39 |
| Erythromma sp. | 0.36 | 0.35 | 0.17 | 0.58 |
| Ischnura sp. | 0.07 | 0.08 | 0.04 | 0.22 |
| Palaemonetes antennarius | 1.72 | 1.56 | 0.56 | 3.02 |
| Physella acuta | 4.55 | 4.69 | 1.48 | 8.03 |
| Procambarus clarkii | 16.78 | 16.93 | 9.68 | 25.28 |
| Zooplankton | 1.12 | 1.09 | 0.27 | 2.08 |
| Taxon | SEAc | SEAB | 95% | |
|---|---|---|---|---|
| Ameiurus melas | 0.22 | 0.27 | 0.15 | 0.38 |
| Anguilla anguilla | 4.92 | 3.84 | 1.65 | 5.94 |
| Atherina boyeri | 1.29 | 1.18 | 0.74 | 1.87 |
| Carassius auratus | 2.12 | 1.91 | 1.16 | 2.39 |
| Cyprinus carpio | 0.29 | 0.24 | 0.11 | 0.65 |
| Esox cisalpinus | 0.02 | 0.02 | 0 | 0.03 |
| Lepomis gibbosus | 3.98 | 3.77 | 2.47 | 5.65 |
| Micropterus salmoides | 0.93 | 0.82 | 0.37 | 2.01 |
| Perca fluviatilis | 2.23 | 2.02 | 1.28 | 3.25 |
| Scardinius erythrophthalmus | 0.79 | 0.62 | 0.29 | 1.38 |
| Squalius squalus | 1.57 | 1.35 | 0.93 | 2.17 |
| Tinca tinca | 4.87 | 4.15 | 2.12 | 6.25 |
Disclaimer/Publisher’s Note: The statements, opinions and data contained in all publications are solely those of the individual author(s) and contributor(s) and not of MDPI and/or the editor(s). MDPI and/or the editor(s) disclaim responsibility for any injury to people or property resulting from any ideas, methods, instructions or products referred to in the content. |
© 2023 by the authors. Licensee MDPI, Basel, Switzerland. This article is an open access article distributed under the terms and conditions of the Creative Commons Attribution (CC BY) license (https://creativecommons.org/licenses/by/4.0/).
Share and Cite
Cicala, D.; Guerra, M.T.; Bardelli, R.; Di Muri, C.; Ludovisi, A.; Vizzini, S.; Mancinelli, G. Isotopic Overlap of Invasive and Native Consumers in the Food Web of Lake Trasimeno (Central Italy). Biology 2023, 12, 1270. https://doi.org/10.3390/biology12091270
Cicala D, Guerra MT, Bardelli R, Di Muri C, Ludovisi A, Vizzini S, Mancinelli G. Isotopic Overlap of Invasive and Native Consumers in the Food Web of Lake Trasimeno (Central Italy). Biology. 2023; 12(9):1270. https://doi.org/10.3390/biology12091270
Chicago/Turabian StyleCicala, Davide, Maria Teresa Guerra, Roberta Bardelli, Cristina Di Muri, Alessandro Ludovisi, Salvatrice Vizzini, and Giorgio Mancinelli. 2023. "Isotopic Overlap of Invasive and Native Consumers in the Food Web of Lake Trasimeno (Central Italy)" Biology 12, no. 9: 1270. https://doi.org/10.3390/biology12091270
APA StyleCicala, D., Guerra, M. T., Bardelli, R., Di Muri, C., Ludovisi, A., Vizzini, S., & Mancinelli, G. (2023). Isotopic Overlap of Invasive and Native Consumers in the Food Web of Lake Trasimeno (Central Italy). Biology, 12(9), 1270. https://doi.org/10.3390/biology12091270