
Information-Theoretic Approaches in EEG Correlates of Auditory Perceptual Awareness under Informational Masking


Simple Summary
Abstract
1. Introduction
2. Materials and Methods
2.1. Participants
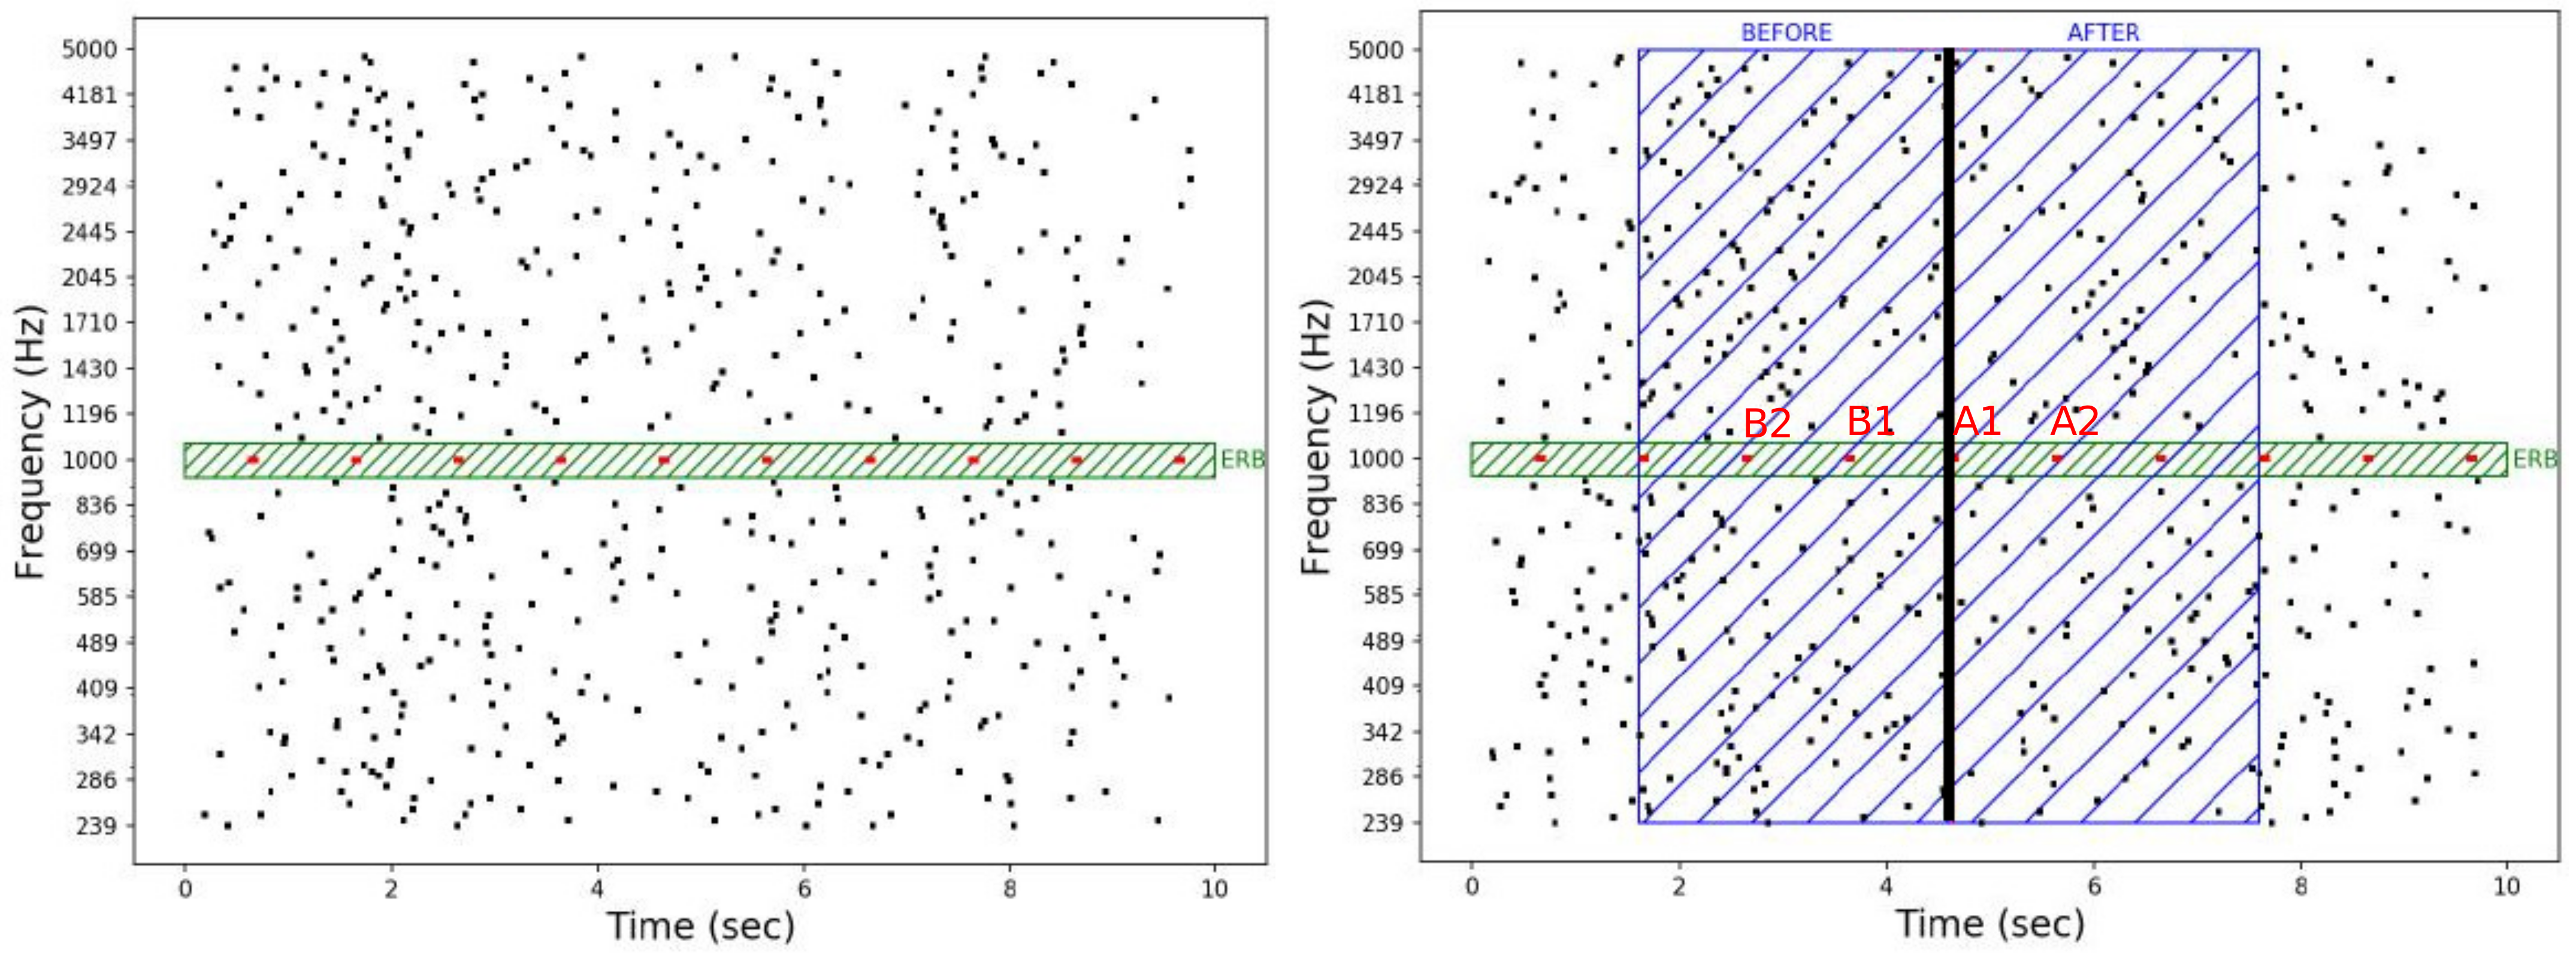
2.2. Stimuli
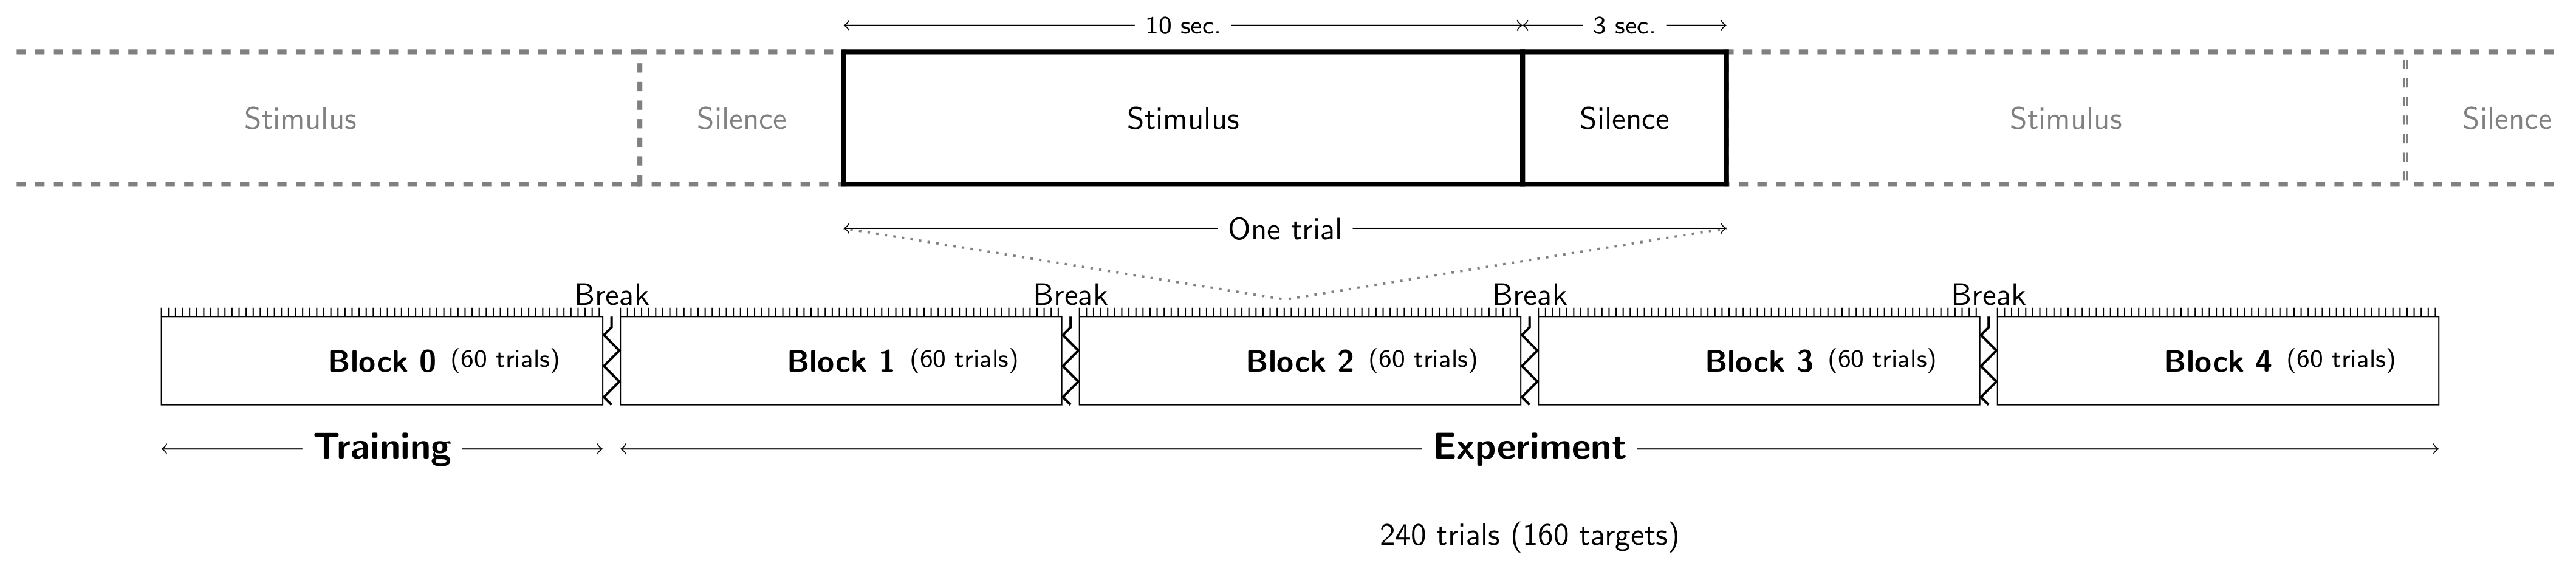
2.3. Experimental Task and Procedure
2.4. Behavioral Responses
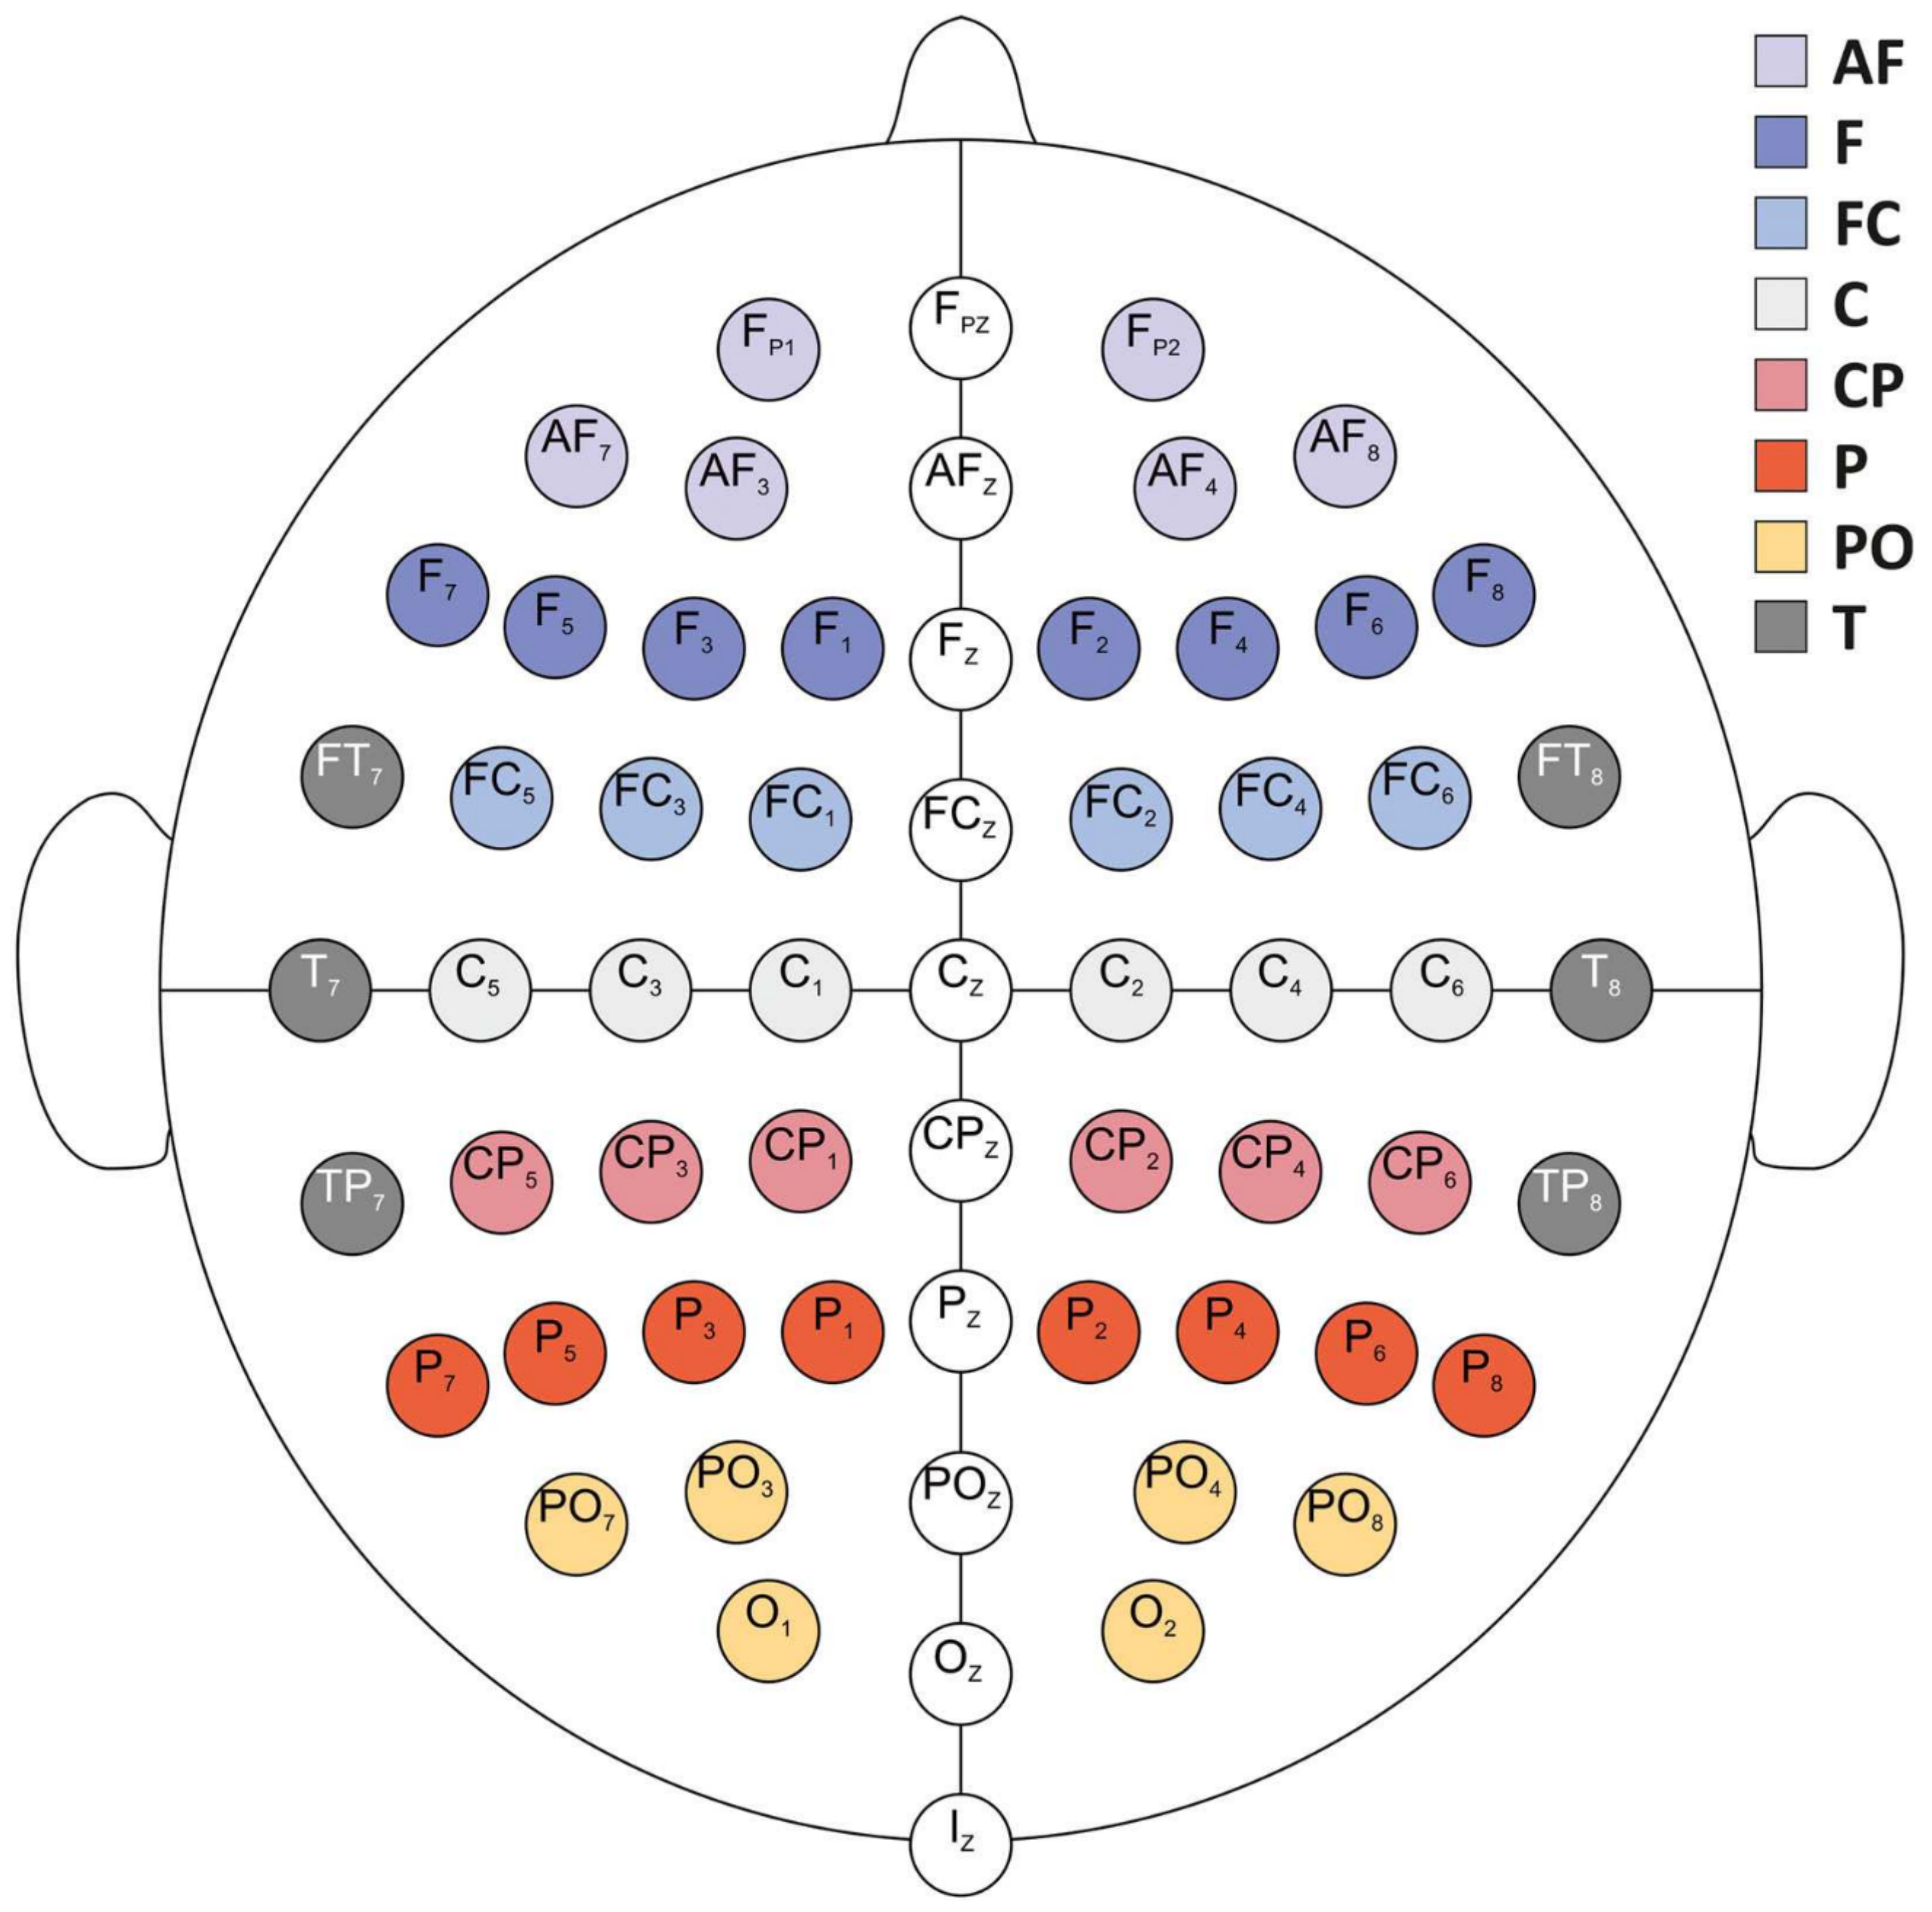
2.5. Electroencephalogram Recordings
2.6. Processing of EEG Recordings

2.7. Statistical Analyses
3. Results
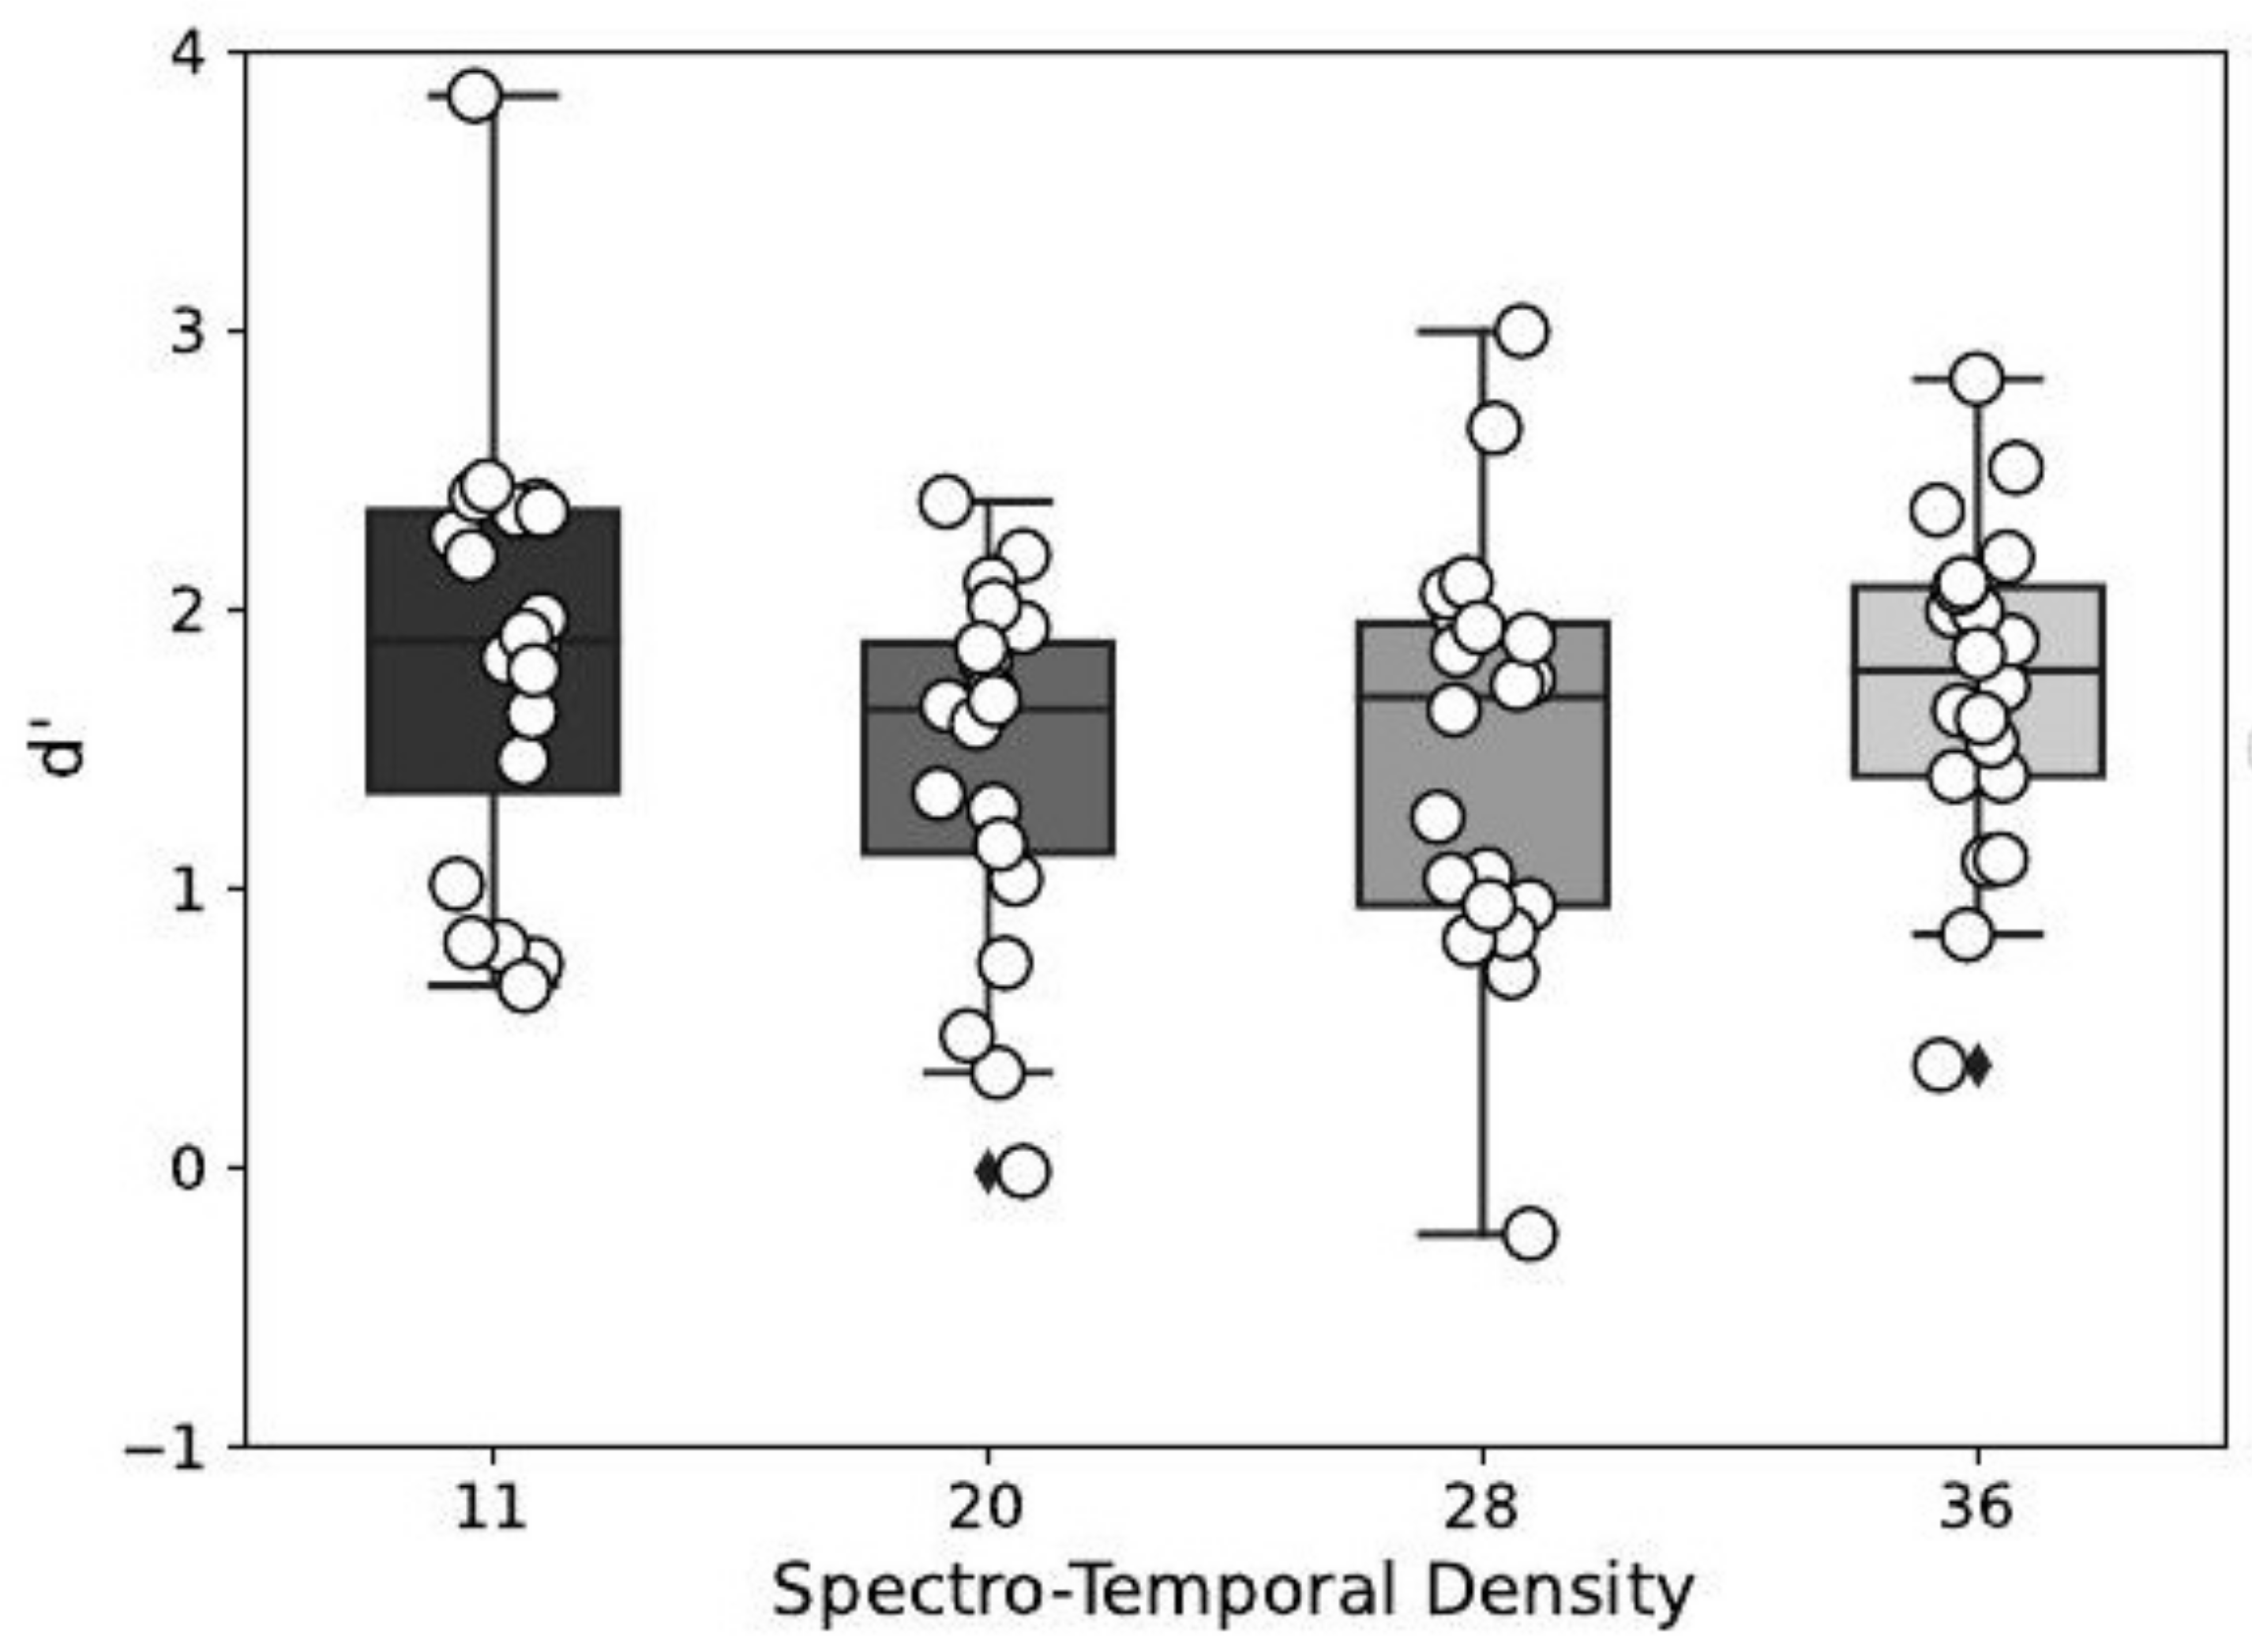
3.1. Behavioral Data
3.2. Electrophysiological Data
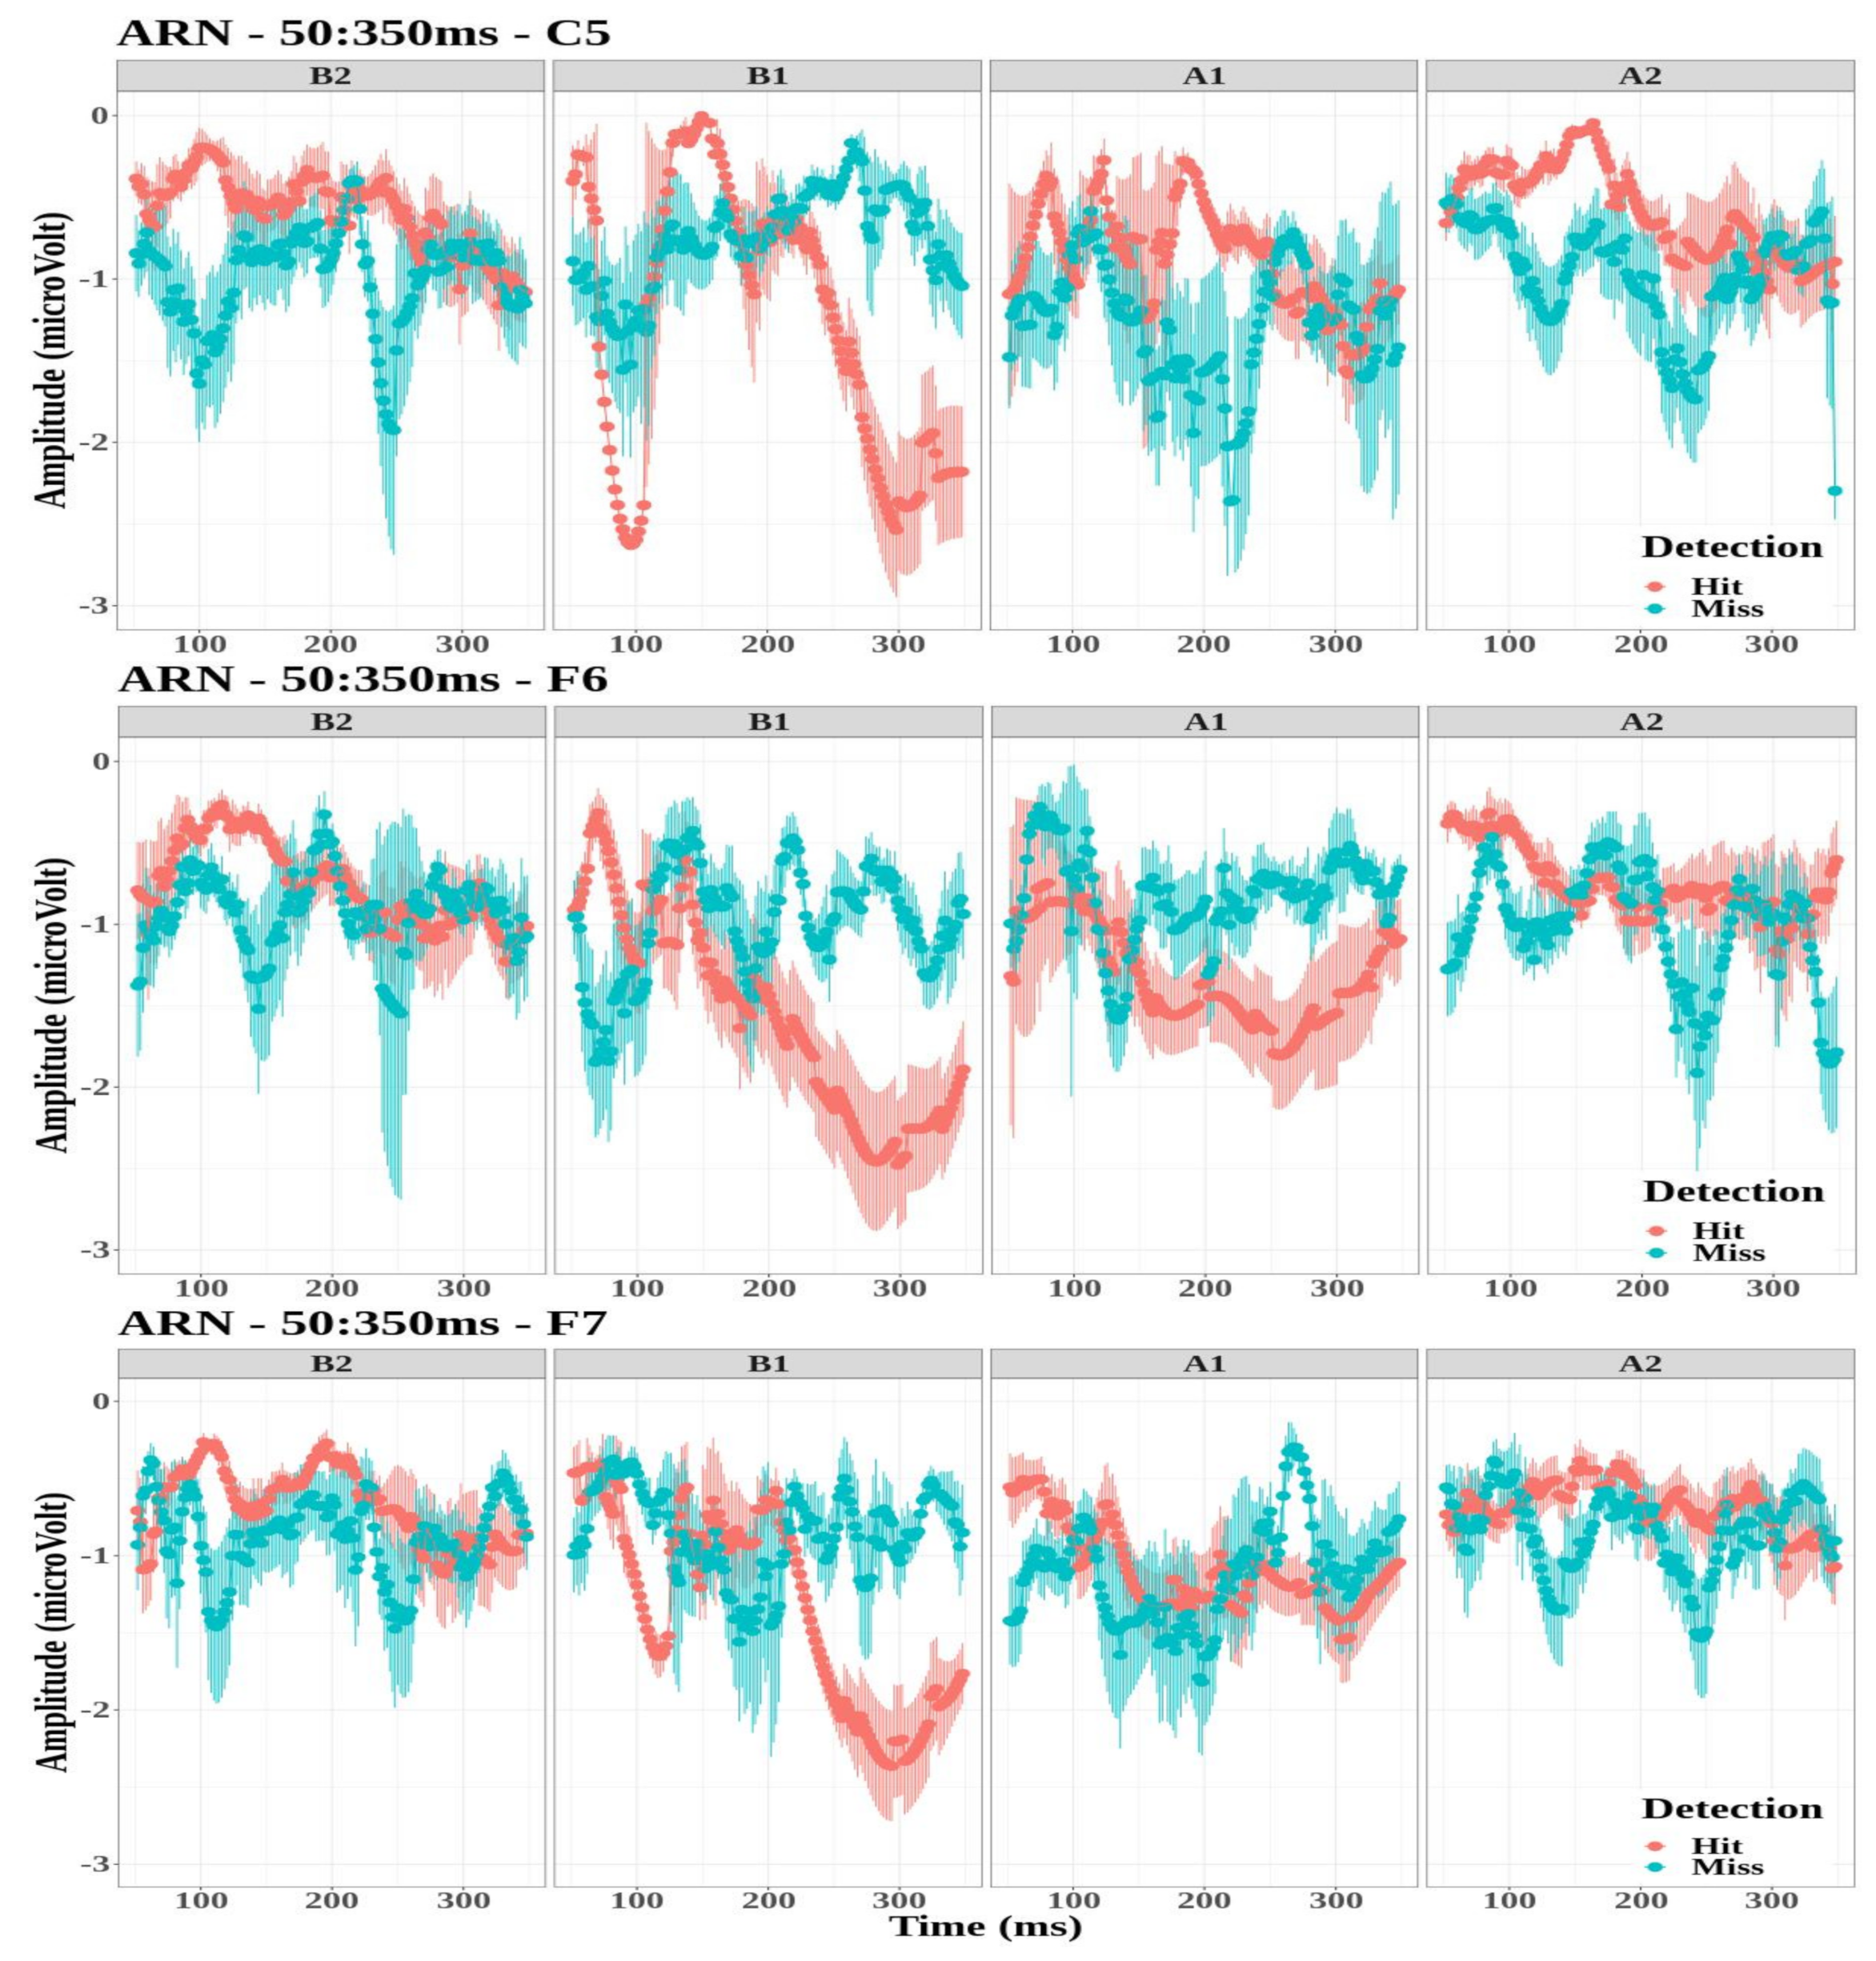
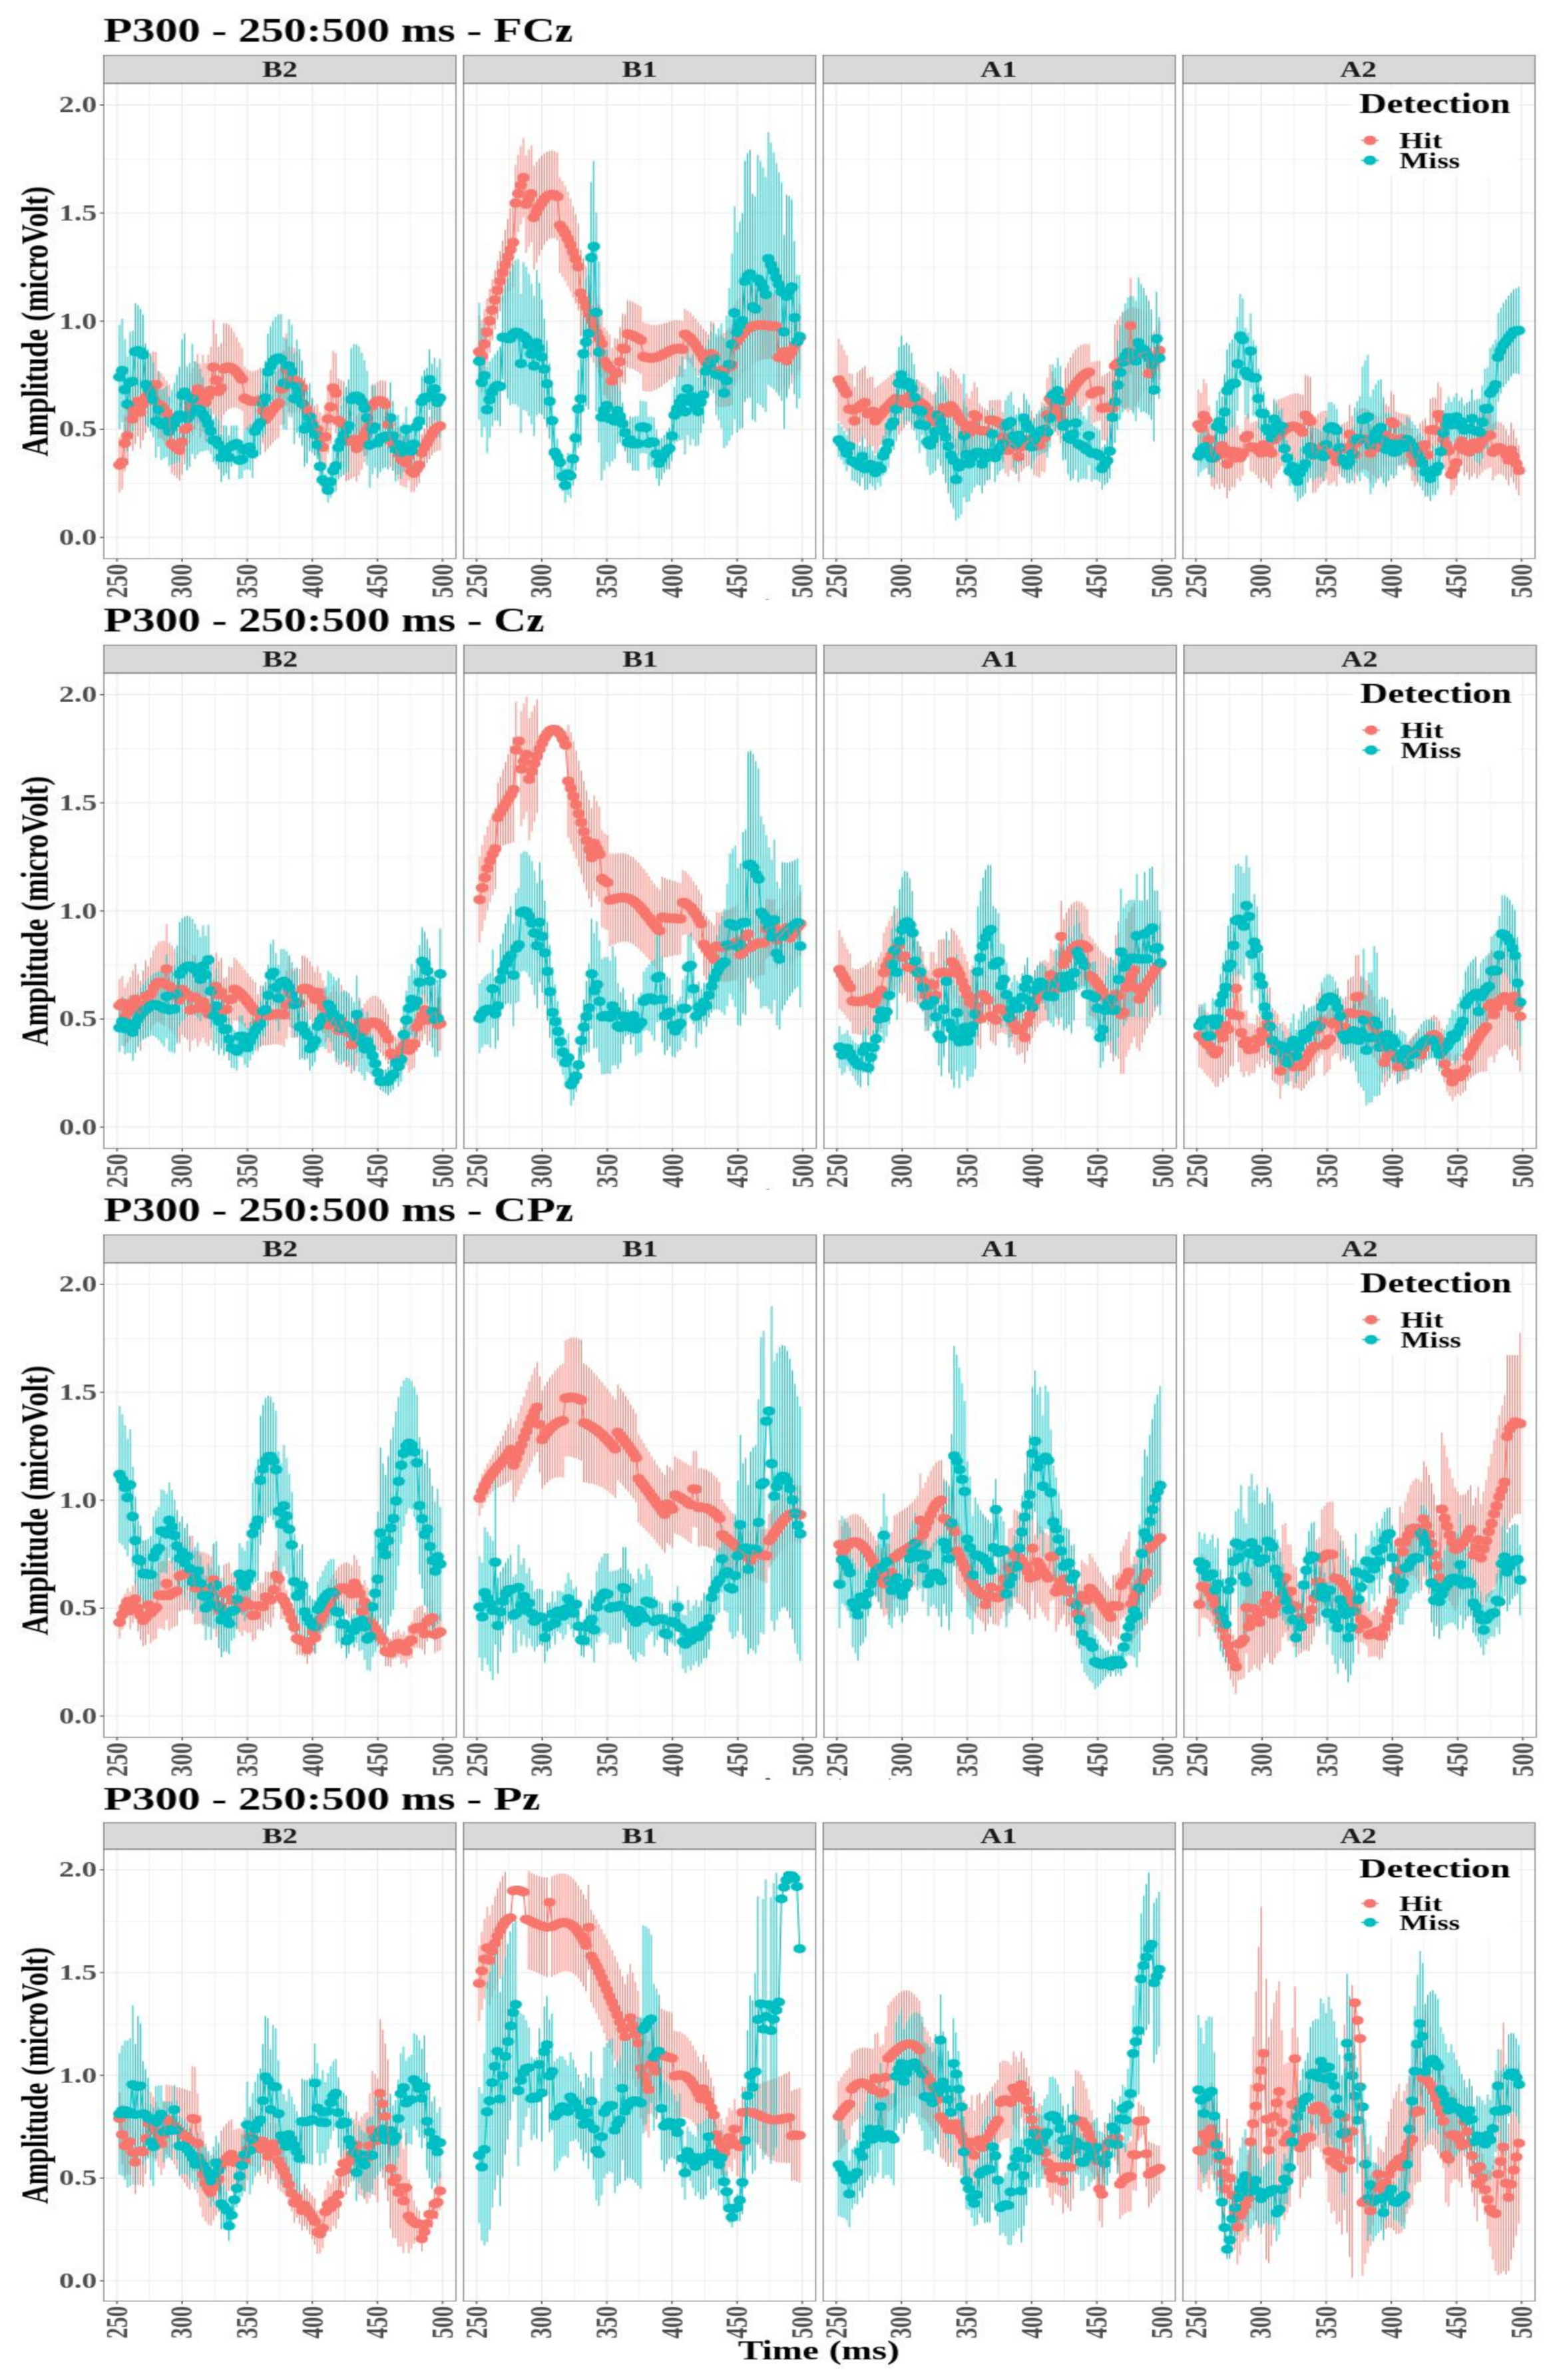
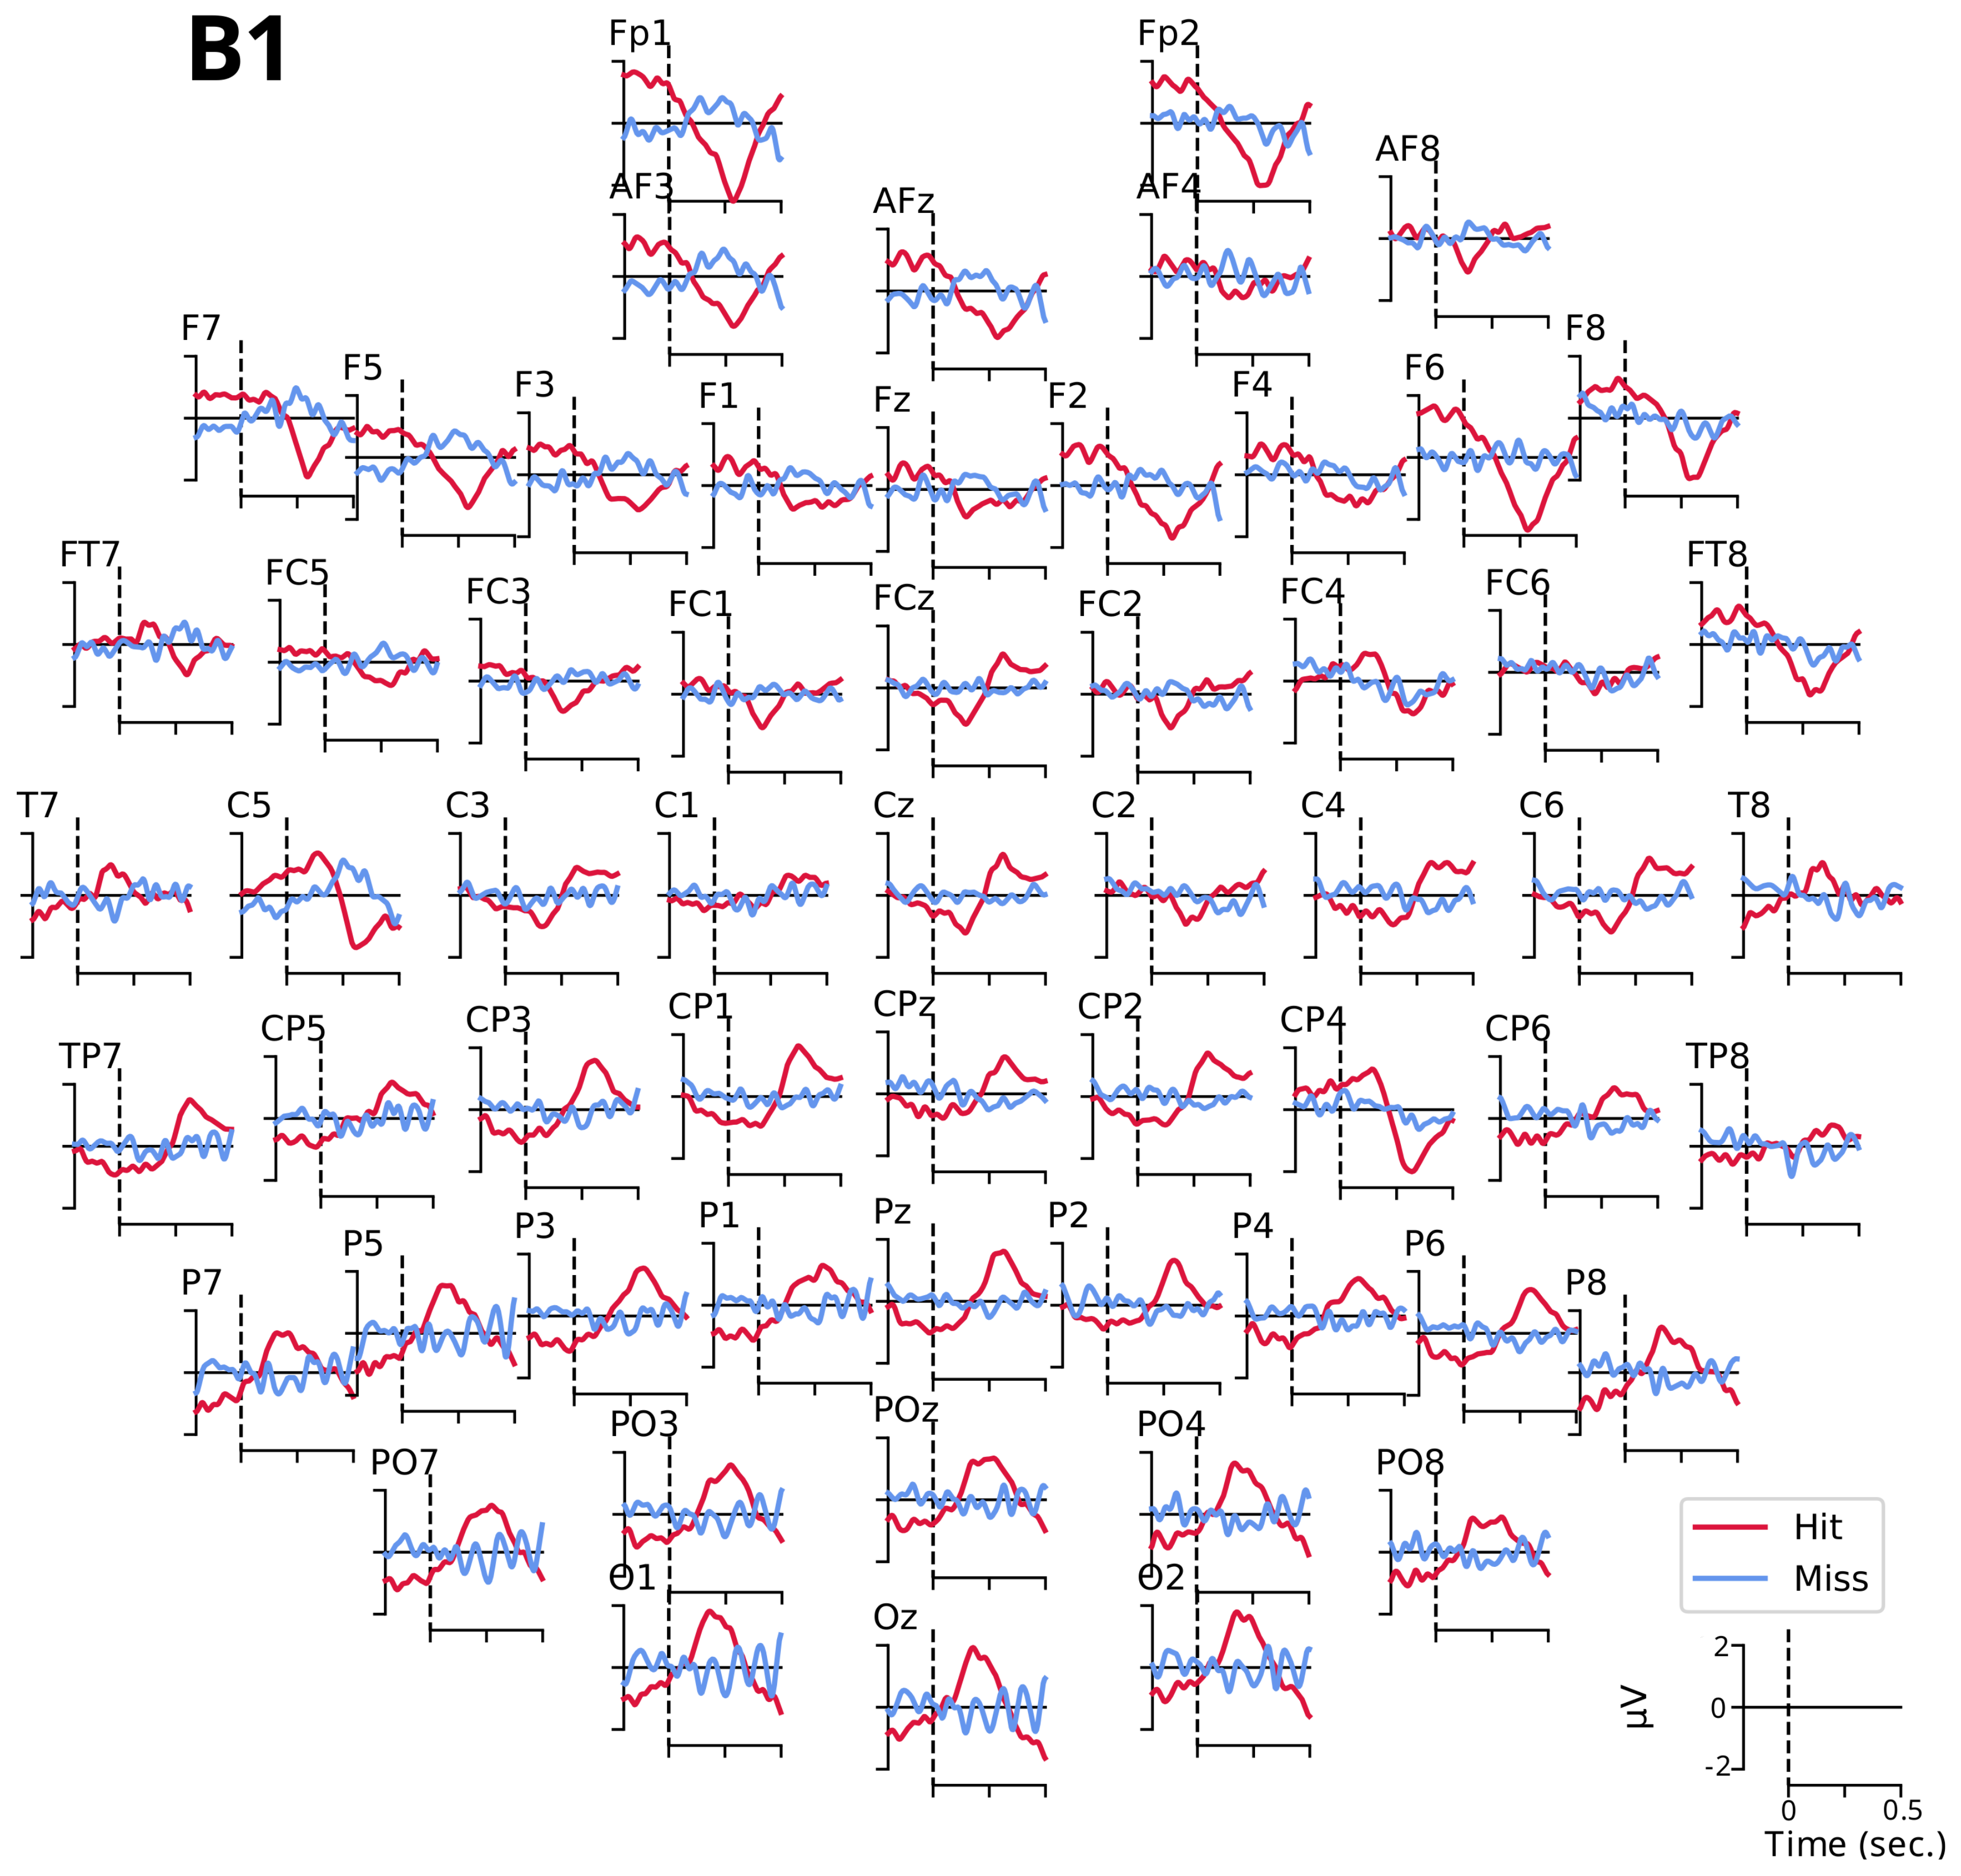
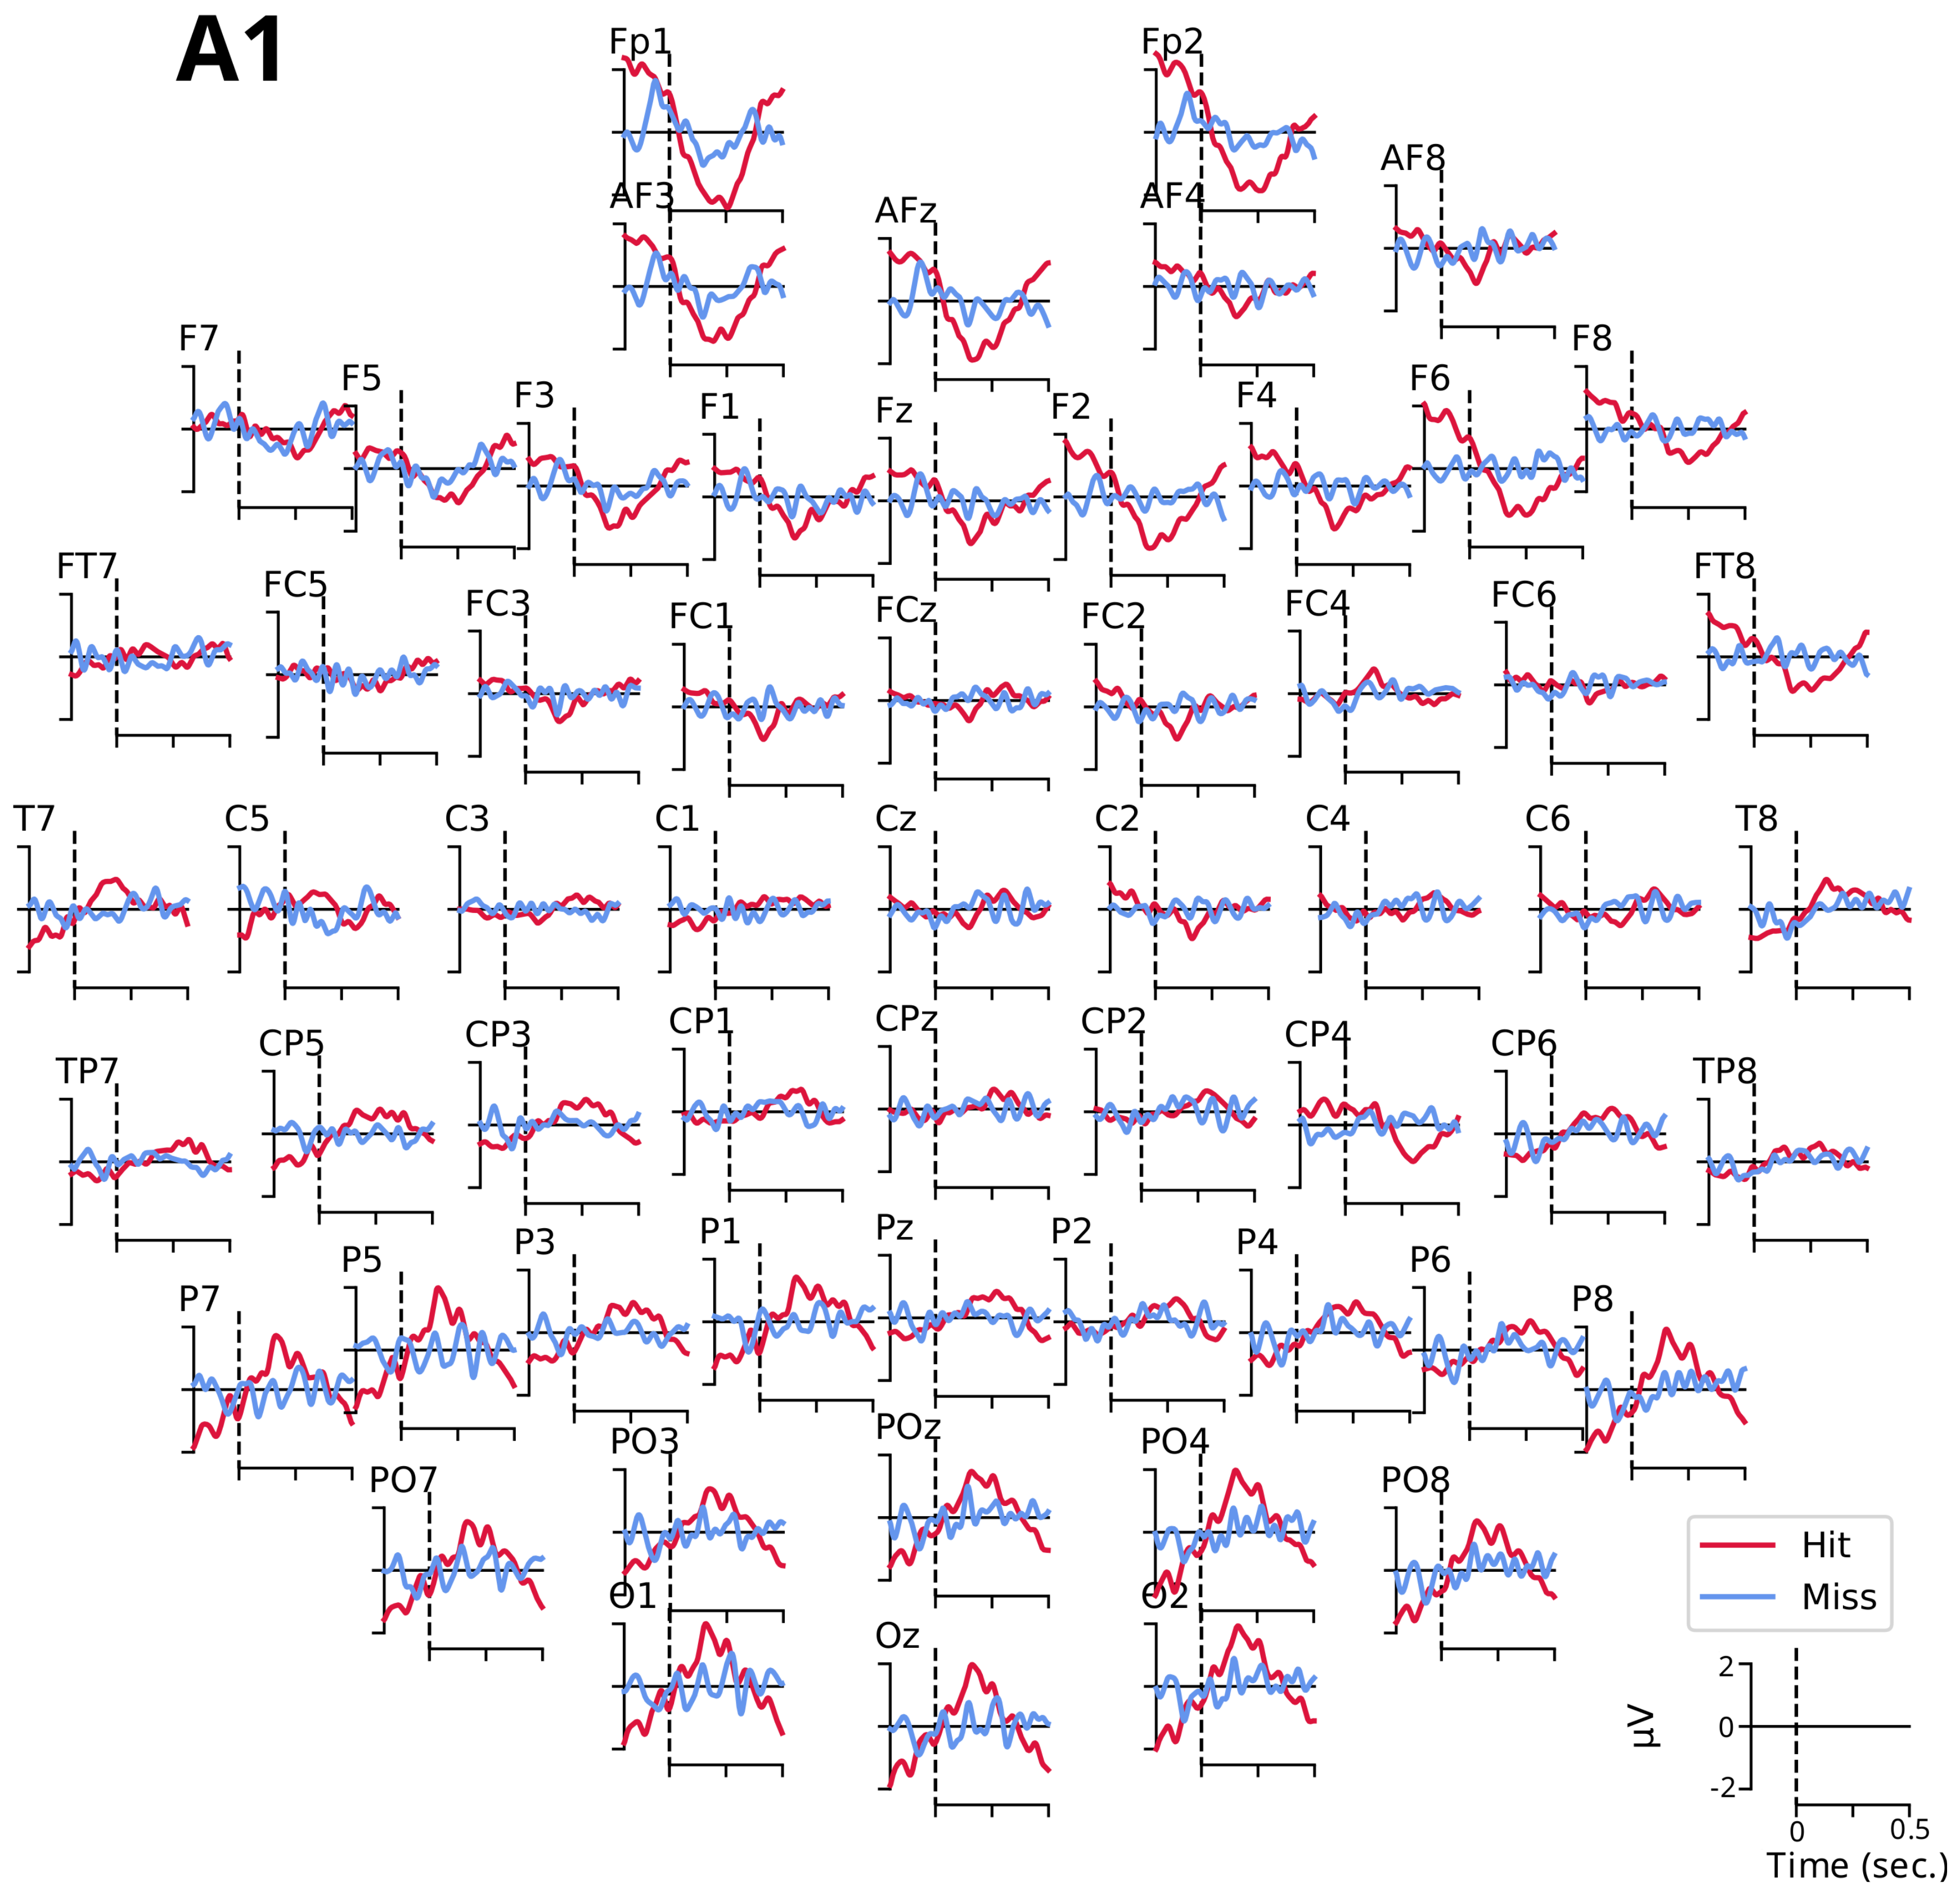
3.2.1. Event-Related Potentials ARN and P300
- The ARN amplitude did not differ significantly between detection conditions for the three electrodes (C5: , ; F6: , ; and F7: , ).
- However, the tone factor had a significant effect on the ARN amplitude for the F6 and F7 electrodes (, , and , , , respectively), while no significant effect was observed for the C5 electrode (, ).
- The interaction between the detection and the tone factors was significant for the three electrodes (C5: , , ; F6: , , ; and F7: , , ).
- The P300 amplitude did not differ significantly between detection conditions for the four electrodes (FCz: , ; Cz: , ; CPz: , ; and Pz: , ).
- The tone factor had a significant effect on the amplitude of P300 for the FCz, Cz, and Pz electrodes (, , ; , , ; and , , , respectively) but not for the CPz electrode (, ).
- The interaction between the detection and the tone factors was significant for all four electrodes (FCz: , , ; Cz: , , ; CPz: , , ; and Pz: , , ).
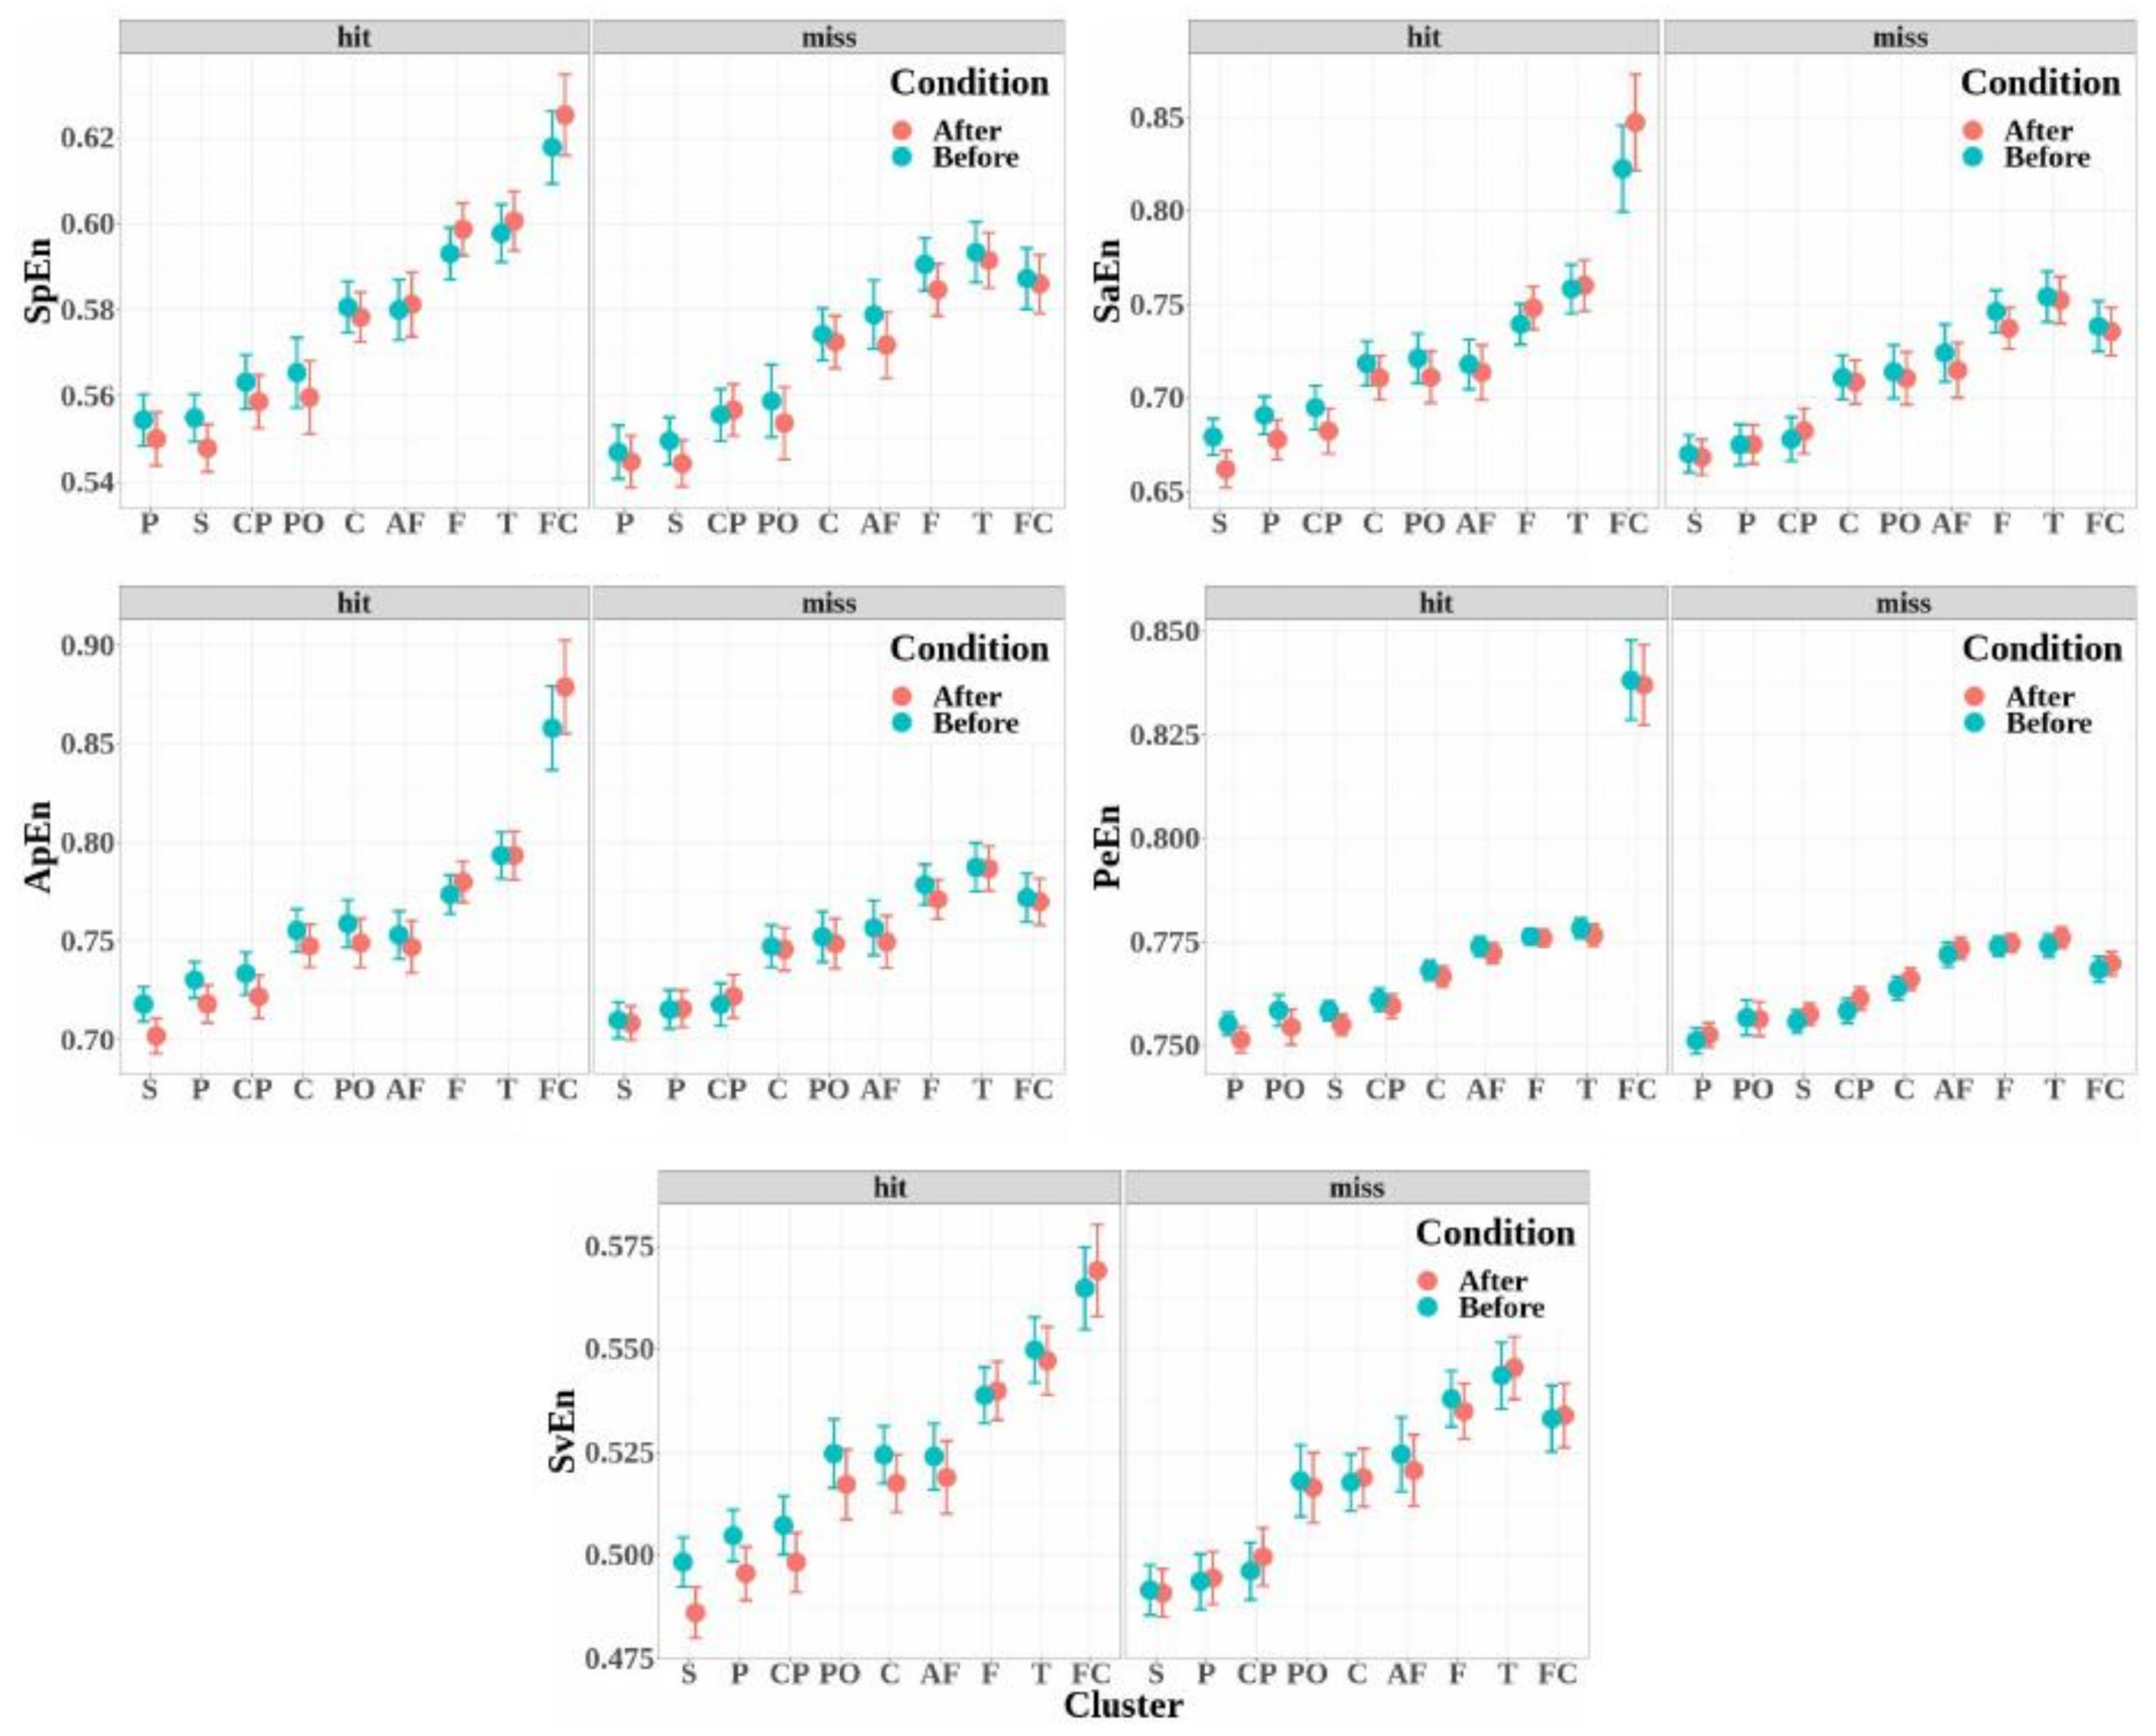
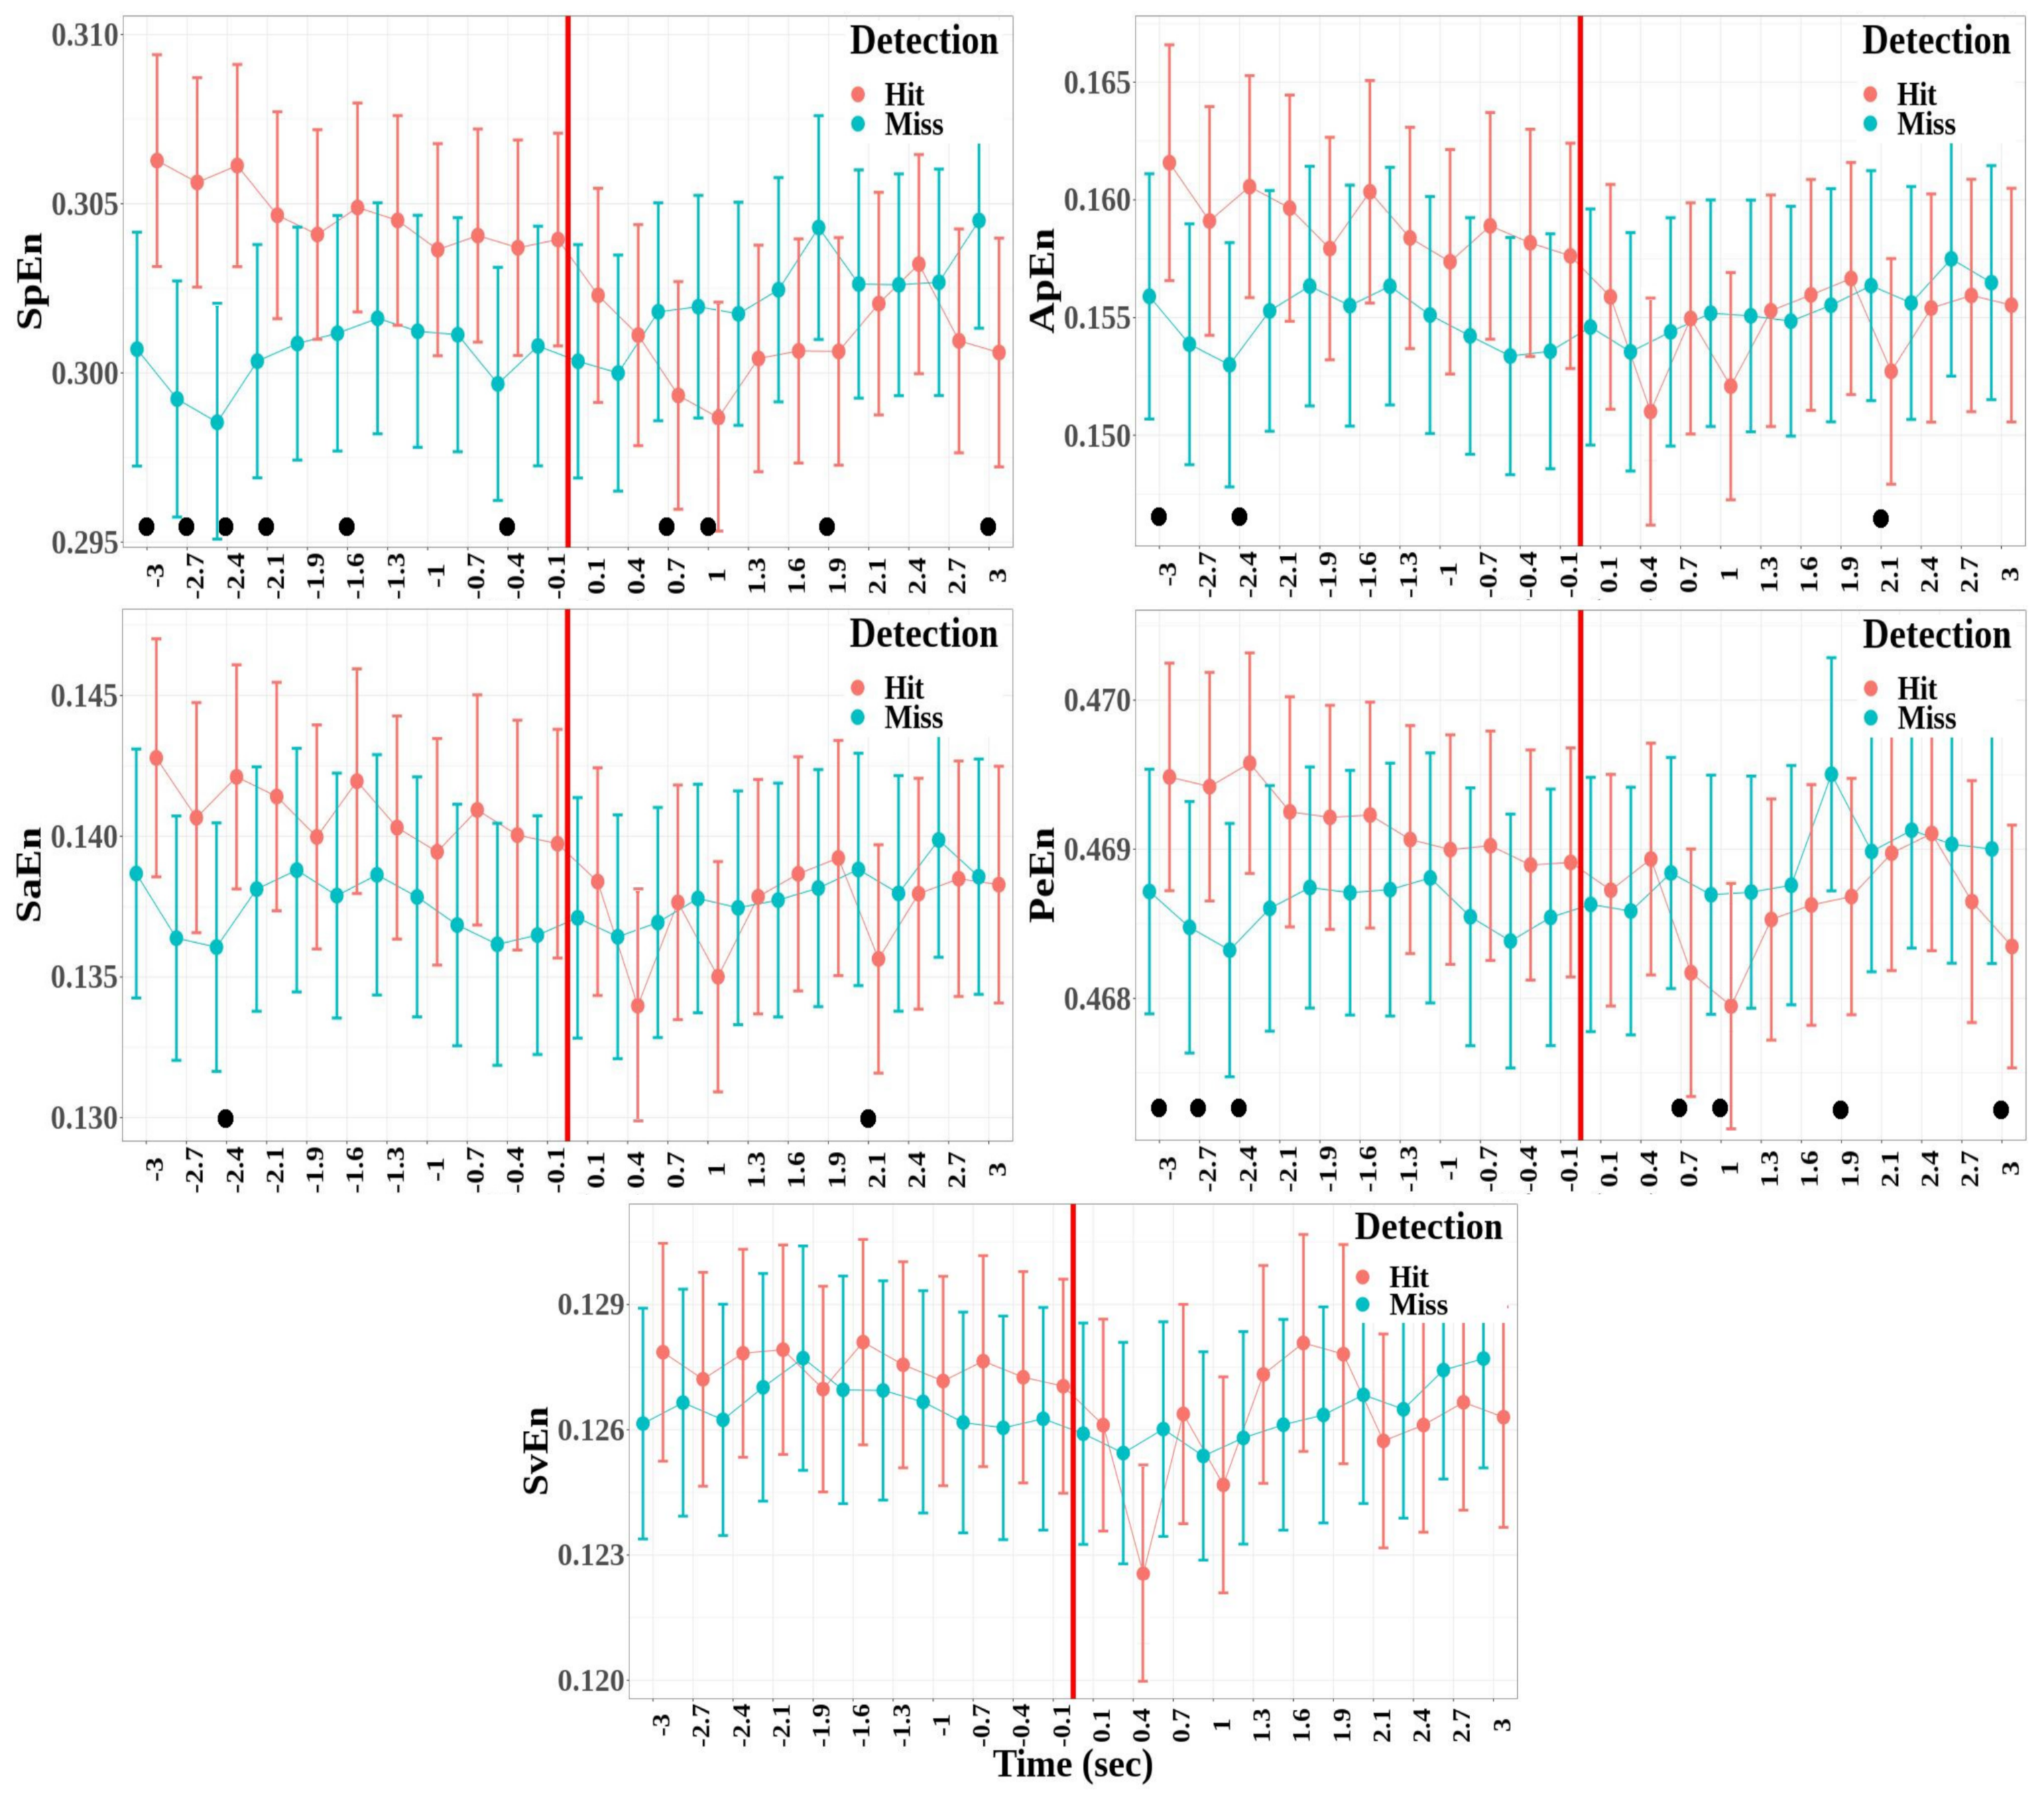
3.2.2. Information Content Measures
- The entropies obtained for the electrode clusters differed significantly for the five entropy measures (SpEn: , , ; ApEn: , , ; SaEn: , , ; PeEn: , , ; and SvEn: , , ). Moreover, the four electrode clusters that depicted the highest entropy values were the same for all the entropy measures, and entropy increased from the antero-frontal cluster to the fronto-central cluster through the frontal and temporal cluster.
- The entropy measures were significantly higher when the target was detected (hits) than when the target was not detected (miss), except for the singular-value entropy (SpEn: , , ; ApEn: , , ; SaEn: , , ; PeEn: , , ; and SvEn: , ).
- No significant effect was observed for the condition factor for all the entropy measures (SpEn: , ; ApEn: , ; SaEn: , ; PeEn: , ; and SvEn: , ).
- The interaction of the detection factor and cluster was significant for all the entropy measures (SpEn: , , ; ApEn: , , ; SaEn: , , ; PeEn: , , ; and SvEn: , , ).
- The effect of the interaction between detection and condition was significant for the permutation entropy only (SpEn: , ; ApEn: , ; SaEn: , ; PeEn: , , ; and SvEn: , ).
- The effect of the interaction between condition and cluster was not significant (SpEn: , ; ApEn: , ; SaEn: , ; PeEn: , ; and SvEn: , ).
- The effect of the triple interaction between detection, condition, and electrode cluster factors was not significant (SpEn: , ; ApEn: , ; SaEn: , ; PeEn: , ; and SvEn: , ).
- There was no significant difference between the hit and miss trials for all the entropy measures (SpEn: , ; ApEn: , ; SaEn: , ; PeEn: , ; and SvEn: , )
- A significant effect of the window factor was found for the approximate, the sample, and the singular-value entropies, but not for the spectral and permutation entropies (SpEn: , ; ApEn: , , ; SaEn: , , ; PeEn: , ; and SvEn: , , ).
- A significant effect was also reported for the interaction between detection and window for all the entropy measures except for the singular-value decomposition entropy (SpEn: , , ; ApEn: , , ; SaEn: , , ; PeEn: , , ; and SvEn: , ).

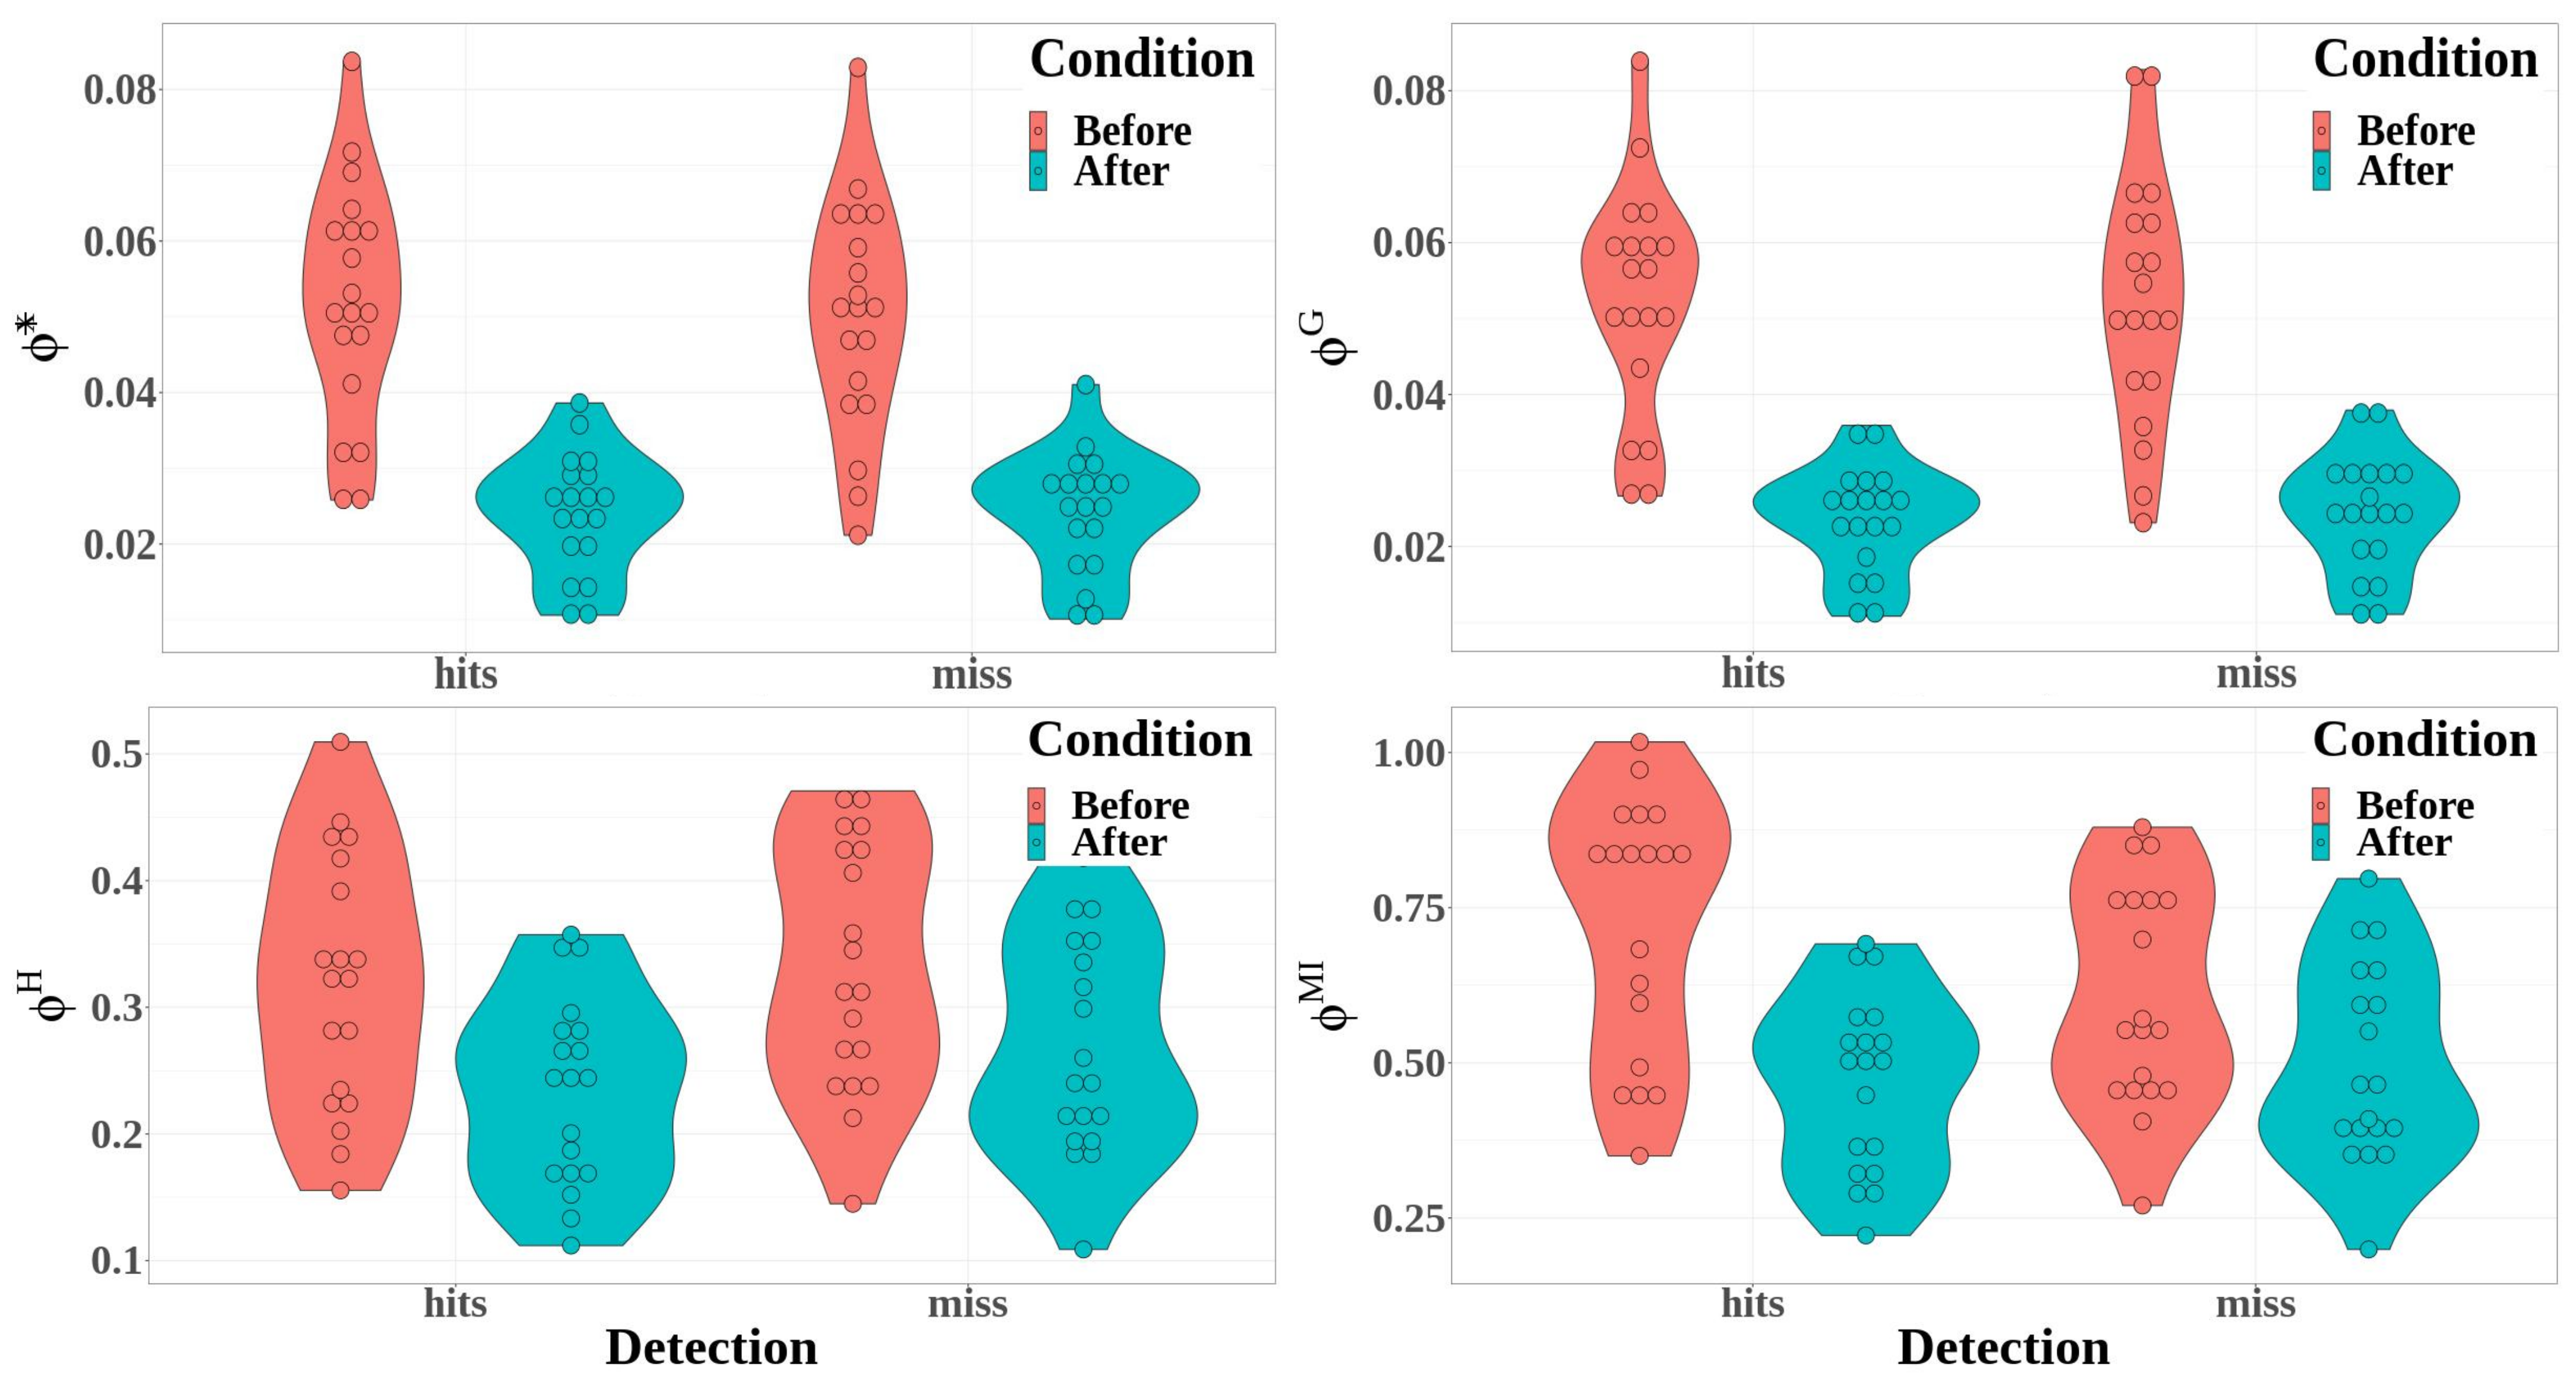
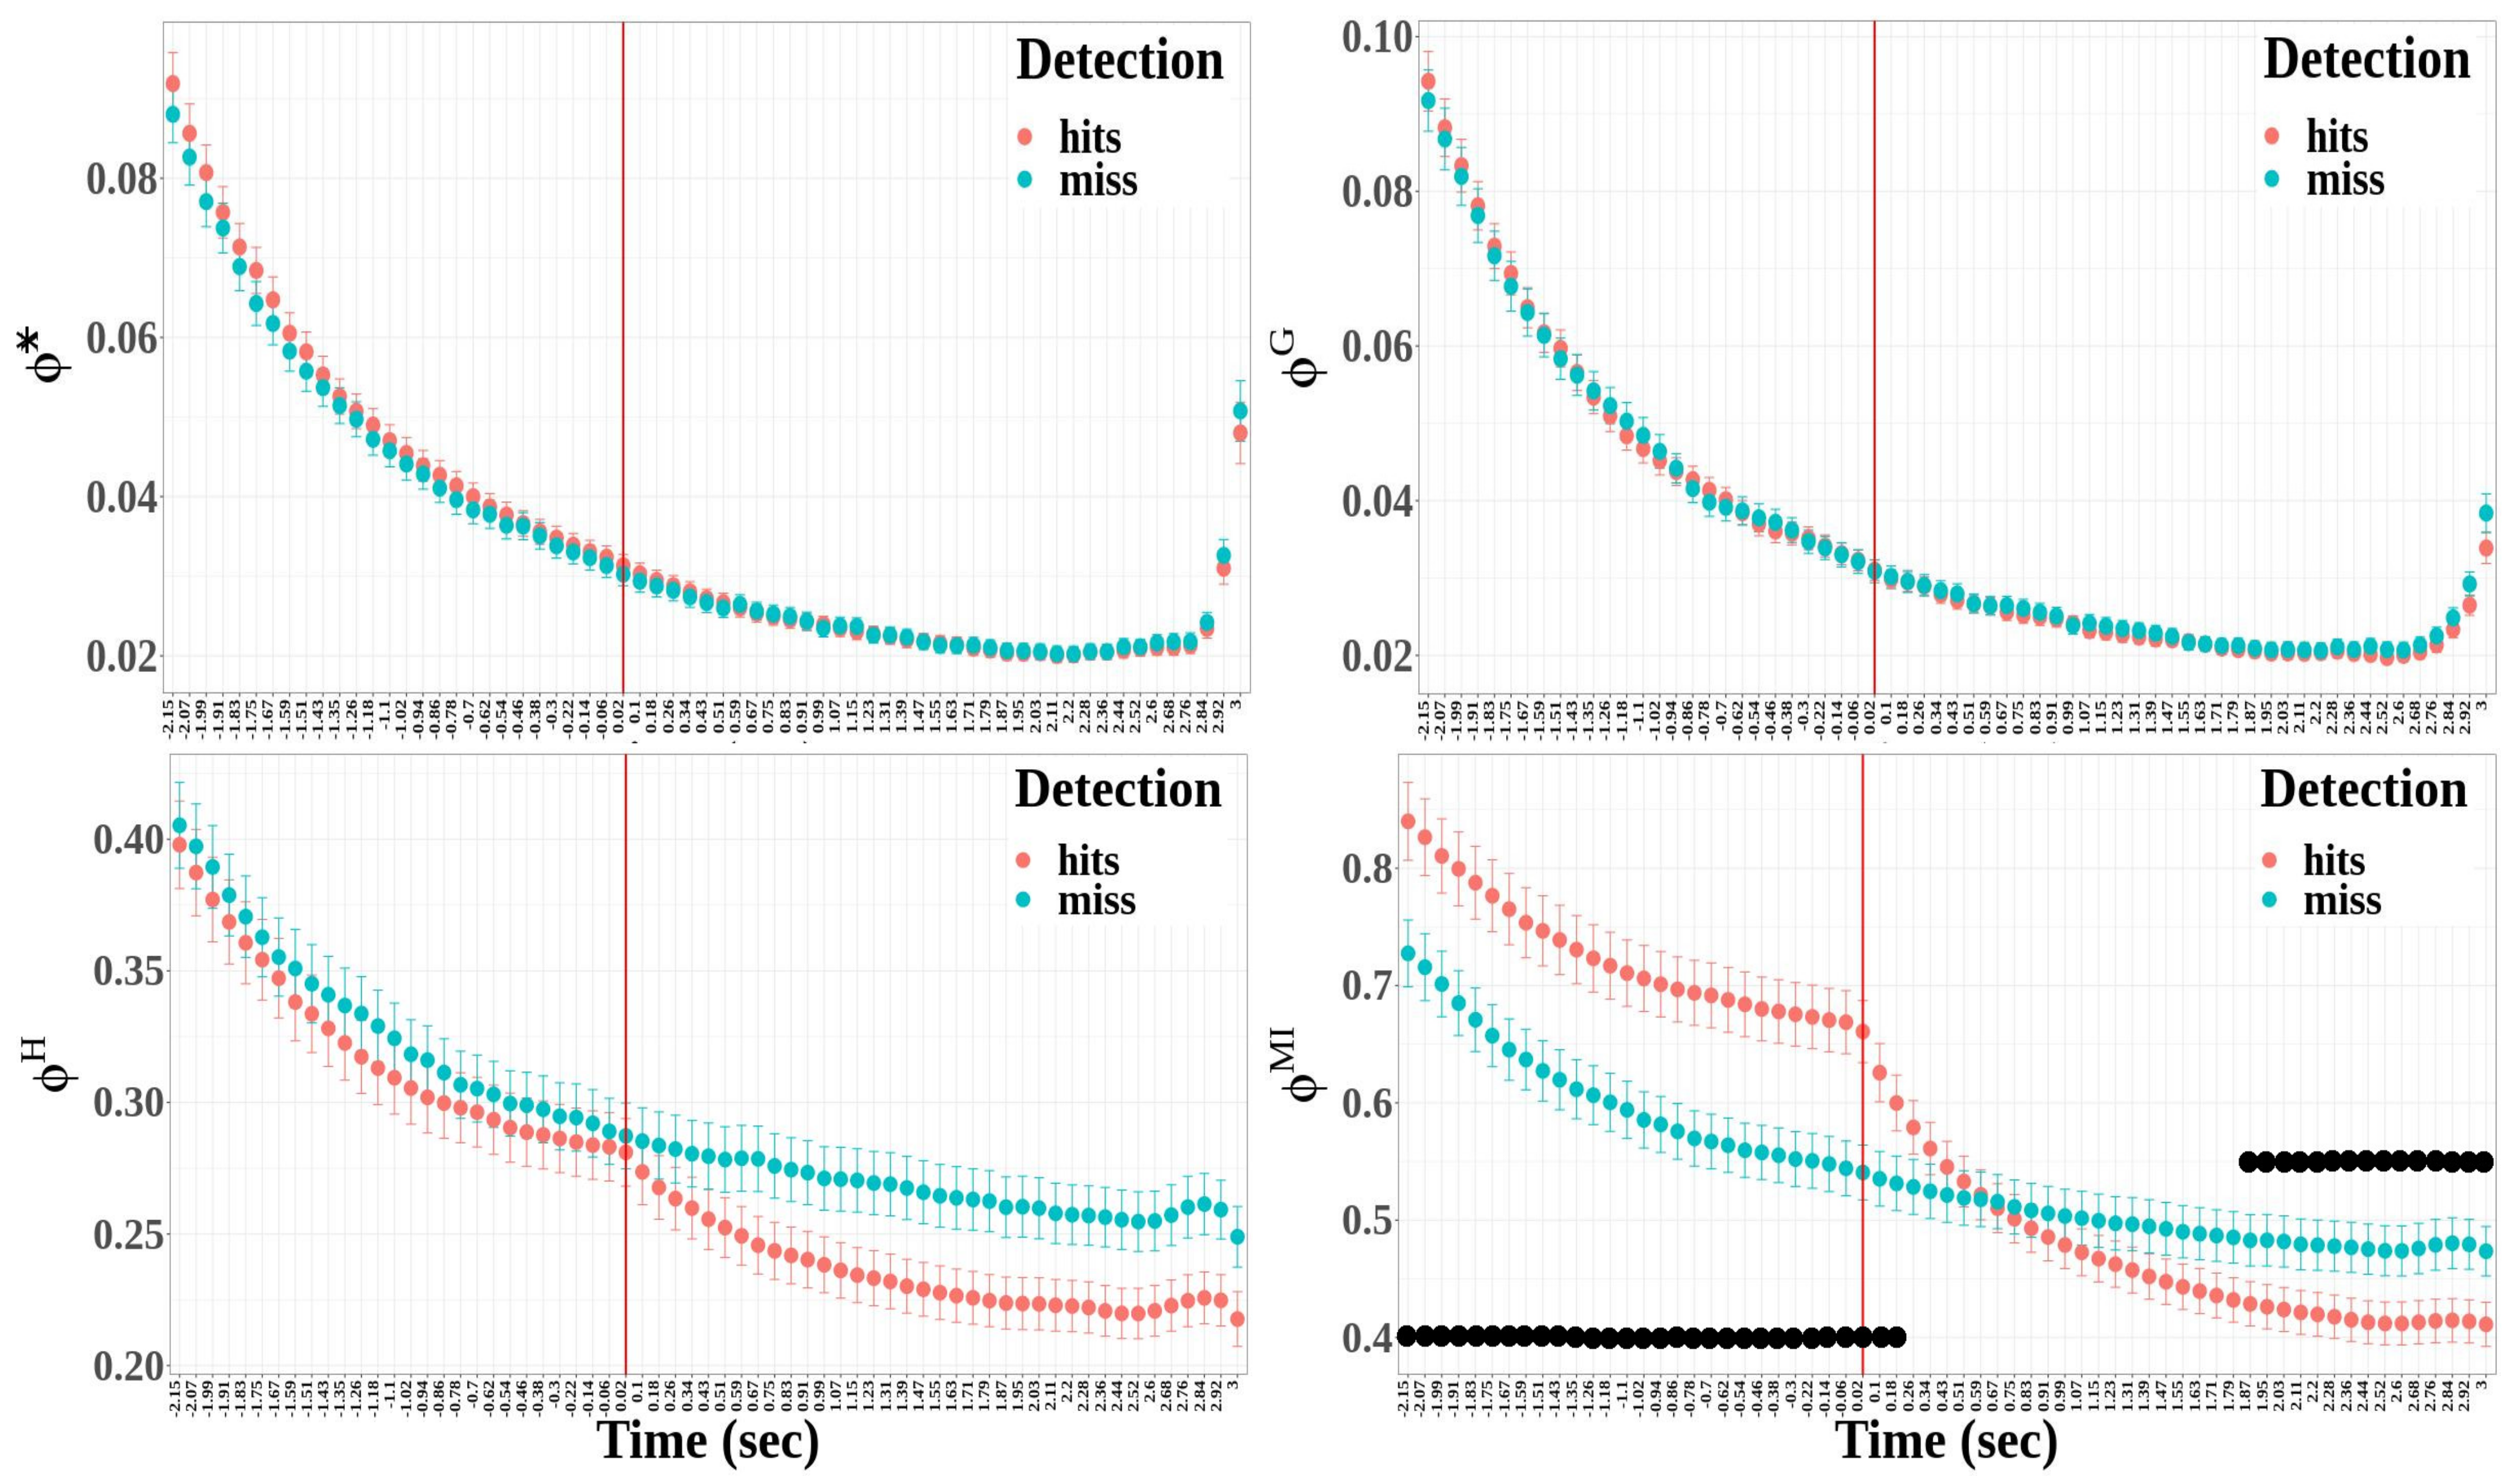
3.2.3. Integrated Information Measures
- The difference between hit and miss trials was significant for stochastic integrated information and multi-information, whereas it was not significant for the decoding-based and geometric integrated information (*: , ; : , ; : , , ; : , , )
- Integrated information decreased significantly between before and after the time reference for the four measures of integrated information (*: , , ; : , , ; : , , ; and : , , ).
- The interaction between detection and condition was significant for the multi-information only (*: , ; : , ; : , ; and : , , ).
- Except for the geometric integrated information, the integrated information significantly differed between hit and miss trials (*: , , ) : , ; : , , ; and : , , ).
- The time window factor had a significant effect for the four integrated information measures (*: , , ; : , , ; : , , ; and : , , ).
- The effect of the interaction between detection and time windows was significant only for the multi-information (*: , ; : , ; : , ; and : , , ).
4. Discussion
5. Conclusions
Author Contributions
Funding
Institutional Review Board Statement
Informed Consent Statement
Data Availability Statement
Acknowledgments
Conflicts of Interest
Appendix A. Behavioral Results

| Subject Id. | Hit | Miss | FA | CR | HIR (%) | FAR (%) | d’ | DT (ms) | DT (ms) |
|---|---|---|---|---|---|---|---|---|---|
| 1 | 125 | 31 | 2 | 78 | 79 | 3 | 2.70 | 3016 | 1266 |
| 2 | 93 | 40 | 1 | 79 | 69 | 1 | 2.60 | 2928 | 1521 |
| 3 | 96 | 35 | 8 | 72 | 73 | 9 | 1.93 | 3277 | 1452 |
| 4 | 105 | 44 | 4 | 76 | 70 | 5 | 2.12 | 2874 | 1461 |
| 5 | 120 | 34 | 2 | 78 | 77 | 3 | 2.63 | 2631 | 1093 |
| 6 | 97 | 22 | 7 | 73 | 81 | 8 | 2.28 | 2891 | 1623 |
| 7 | 63 | 81 | 1 | 79 | 43 | 1 | 1.92 | 4006 | 1926 |
| 8 | 132 | 28 | 0 | 80 | 82 | 0 | 3.42 | 4046 | 1691 |
| 9 | 69 | 31 | 7 | 73 | 68 | 6 | 1.96 | 3003 | 1393 |
| 10 | 150 | 10 | 0 | 80 | 93 | 0 | 4.01 | 4467 | 2077 |
| 11 | 113 | 44 | 39 | 41 | 71 | 48 | 0.60 | 3609 | 1458 |
| 12 | 82 | 78 | 0 | 80 | 51 | 0 | 2.53 | 4629 | 1806 |
| 13 | 91 | 61 | 2 | 78 | 59 | 3 | 2.11 | 2693 | 1186 |
| 14 | 136 | 1 | 25 | 55 | 98 | 31 | 2.77 | 2843 | 1106 |
| 15 | 120 | 31 | 3 | 77 | 79 | 4 | 2.53 | 2857 | 1380 |
| 16 | 123 | 37 | 7 | 73 | 76 | 9 | 2.05 | 3391 | 1559 |
| 17 | 68 | 92 | 14 | 66 | 42 | 17 | 0.73 | 4540 | 2304 |
| 18 | 120 | 40 | 37 | 43 | 74 | 46 | 0.76 | 4849 | 1932 |
| 19 | 117 | 37 | 3 | 77 | 75 | 4 | 2.41 | 3318 | 1704 |
| 20 | 78 | 38 | 26 | 54 | 67 | 26 | 1.07 | 3115 | 1684 |
| Total | 2098 | 815 | 188 | 1412 | — | — | — | — | — |
| Mean | 105 | 41 | 9 | 71 | 71 | 11 | 2.15 | 3449 | 1581 |
Appendix B. Event-Related Potentials ARN and P300


Appendix C. Entropy Measures
Appendix C.1. Spectral Entropy: SpEn
- 1.
- Compute the spectrum of the signal.
- 2.
- Calculate the spectral power density of the signal via the square of its amplitude and normalize by the defined number of bins N.
- 3.
- Normalize the computed spectral power density so that it can be viewed as a probability mass function:
- 4.
- SpEn can then be calculated using Shannon’s standard entropy formula.
Appendix C.2. Approximate Entropy: ApEn
Appendix C.3. Sample Entropy: SaEn
- 1.
- Let be a time series of length N;
- 2.
- Let be the integrated series for , vectors of length m:
- 3.
- Let be the number of vectors at a distance r from the vectors , where and to exclude self-similar patterns;
- 4.
- Let , which is times the number of , be defined as the probability that all is at a distance r from ;
- 5.
- Let be the average degree of similarity that can be calculated as
- 6.
- Similarly, can be computed for the embedding dimension of :
Appendix C.4. Permutation Entropy: PeEn
- 1.
- Given an input time series , and an embedding dimension ;
- 2.
- For each subsequence extracted at time t, , a rank model relative to t is obtained in the form ;
- 3.
- This rank pattern is defined by an order pattern ;
- 4.
- For all possible permutations, each probability is estimated as the relative frequency of each different pattern found;
- 5.
- Once all these probabilities have been obtained, the final value of the permutation entropy (PeEn) is given by
Appendix C.5. Singular-Value Decomposition Entropy: SvEn
Appendix D. Integrated Information Measures
Appendix D.1. Decoding-Based Integrated Information Φ*
Appendix D.2. Geometric Integrated Information ΦG
Appendix D.3. Stochastic Integrated Information ΦH
Appendix D.4. Redundancy-Based Integrated Information or “Multi-Information” ΦMI
References
- Cherry, E.C. Some experiments on the recognition of speech, with one and with two ears. J. Acoust. Soc. Am. 1953, 25, 975–979. [Google Scholar] [CrossRef]
- McDermott, J.H. The cocktail party problem. Curr. Biol. 2009, 19, R1024–R1027. [Google Scholar] [CrossRef] [PubMed]
- Bregman, A.S. Auditory Scene Analysis: The Perceptual Organization of Sound; MIT Press: Cambridge, MA, USA, 1994. [Google Scholar]
- Micheyl, C.; Tian, B.; Carlyon, R.P.; Rauschecker, J.P. Perceptual organization of tone sequences in the auditory cortex of awake macaques. Neuron 2005, 48, 139–148. [Google Scholar] [CrossRef] [PubMed]
- Deike, S.; Heil, P.; Bockmann-Barthel, M.; Brechmann, A. The build-up of auditory stream segregation: A different perspective. Front. Psychol. 2012, 3, 461. [Google Scholar] [CrossRef] [PubMed]
- Pressnitzer, D.; Sayles, M.; Micheyl, C.; Winter, I.M. Perceptual organization of sound begins in the auditory periphery. Curr. Biol. 2008, 18, 1124–1128. [Google Scholar] [CrossRef]
- Kidd, G.; Mason, C.R.; Deliwala, P.S.; Woods, W.S.; Colburn, H.S. Reducing informational masking by sound segregation. J. Acoust. Soc. Am. 1994, 95, 3475–3480. [Google Scholar] [CrossRef]
- Neff, D.L.; Jesteadt, W. Intensity discrimination in the presence of random-frequency, multicomponent maskers and broadband noise. J. Acoust. Soc. Am. 1996, 100, 2289–2298. [Google Scholar] [CrossRef]
- Kidd, G.; Mason, C.R.; Richards, V.M.; Gallun, F.J.; Durlach, N.I. Informational masking. In Auditory Perception of Sound Sources; Springer: New York, NY, USA, 2008; pp. 143–189. [Google Scholar]
- Gutschalk, A.; Micheyl, C.; Oxenham, A.J. Neural correlates of auditory perceptual awareness under informational masking. PLoS Biol. 2008, 6, e138. [Google Scholar] [CrossRef]
- Chang, A.C.; Lutfi, R.; Lee, J.; Heo, I. A detection-theoretic analysis of auditory streaming and its relation to auditory masking. Trends Hear. 2016, 20, 2331216516664343. [Google Scholar] [CrossRef]
- Lutfi, R.A.; Chang, A.C.; Stamas, J.; Gilbertson, L. A detection-theoretic framework for modeling informational masking. J. Acoust. Soc. Am. 2012, 132, EL109–EL113. [Google Scholar] [CrossRef]
- Lutfi, R.A.; Gilbertson, L.; Heo, I.; Chang, A.C.; Stamas, J. The information-divergence hypothesis of informational masking. J. Acoust. Soc. Am. 2013, 134, 2160–2170. [Google Scholar] [CrossRef]
- Demertzi, A.; Soddu, A.; Laureys, S. Consciousness supporting networks. Curr. Opin. Neurobiol. 2013, 23, 239–244. [Google Scholar] [CrossRef]
- Dykstra, A.R.; Cariani, P.A.; Gutschalk, A. A roadmap for the study of conscious audition and its neural basis. Philos. Trans. R. Soc. B Biol. Sci. 2017, 372, 20160103. [Google Scholar] [CrossRef]
- Eklund, R. Electrophysiological Correlates of Consciousness. Ph.D. Thesis, Department of Psychology, Stockholm University, Stockholm, Sweden, 2019. [Google Scholar]
- Eriksson, J.; Larsson, A.; Åhlström, K.R.; Nyberg, L. Similar frontal and distinct posterior cortical regions mediate visual and auditory perceptual awareness. Cereb. Cortex 2007, 17, 760–765. [Google Scholar] [CrossRef]
- Eriksson, J. Activity in part of the neural correlates of consciousness reflects integration. Conscious. Cogn. 2017, 55, 26–34. [Google Scholar] [CrossRef]
- Giani, A.S.; Belardinelli, P.; Ortiz, E.; Kleiner, M.; Noppeney, U. Detecting tones in complex auditory scenes. Neuroimage 2015, 122, 203–213. [Google Scholar] [CrossRef]
- Wiegand, K.; Heiland, S.; Uhlig, C.H.; Dykstra, A.R.; Gutschalk, A. Cortical networks for auditory detection with and without informational masking: Task effects and implications for conscious perception. Neuroimage 2018, 167, 178–190. [Google Scholar] [CrossRef]
- Akram, S.; Englitz, B.; Elhilali, M.; Simon, J.Z.; Shamma, S.A. Investigating the neural correlates of a streaming percept in an informational-masking paradigm. PLoS ONE 2014, 9, e114427. [Google Scholar] [CrossRef]
- Elhilali, M.; Xiang, J.; Shamma, S.A.; Simon, J.Z. Interaction between attention and bottom-up saliency mediates the representation of foreground and background in an auditory scene. PLoS Biol. 2009, 7, e1000129. [Google Scholar] [CrossRef]
- Averbeck, B.B.; Latham, P.E.; Pouget, A. Neural correlations, population coding and computation. Nat. Rev. Neurosci. 2006, 7, 358. [Google Scholar] [CrossRef]
- Fan, J. An information theory account of cognitive control. Front. Hum. Neurosci. 2014, 8, 680. [Google Scholar] [CrossRef] [PubMed]
- Zylberberg, J.; Pouget, A.; Latham, P.E.; Shea-Brown, E. Robust information propagation through noisy neural circuits. PLoS Comput. Biol. 2017, 13, e1005497. [Google Scholar] [CrossRef] [PubMed]
- Wiegand, K.; Gutschalk, A. Correlates of perceptual awareness in human primary auditory cortex revealed by an informational masking experiment. Neuroimage 2012, 61, 62–69. [Google Scholar] [CrossRef] [PubMed]
- Dykstra, A.R.; Halgren, E.; Gutschalk, A.; Eskandar, E.N.; Cash, S.S. Neural correlates of auditory perceptual awareness and release from informational masking recorded directly from human cortex: A case study. Front. Neurosci. 2016, 10, 472. [Google Scholar] [CrossRef] [PubMed]
- Dehaene, S.; Changeux, J.P.; Naccache, L.; Sackur, J.; Sergent, C. Conscious, preconscious, and subliminal processing: A testable taxonomy. Trends Cogn. Sci. 2006, 10, 204–211. [Google Scholar] [CrossRef]
- Del Cul, A.; Baillet, S.; Dehaene, S. Brain dynamics underlying the nonlinear threshold for access to consciousness. PLoS Biol. 2007, 5, e260. [Google Scholar] [CrossRef]
- Sergent, C.; Dehaene, S. Neural processes underlying conscious perception: Experimental findings and a global neuronal workspace framework. J. Physiol.-Paris 2004, 98, 374–384. [Google Scholar] [CrossRef]
- Sergent, C.; Baillet, S.; Dehaene, S. Timing of the brain events underlying access to consciousness during the attentional blink. Nat. Neurosci. 2005, 8, 1391–1400. [Google Scholar] [CrossRef]
- Parasuraman, R.; Beatty, J. Brain events underlying detection and recognition of weak sensory signals. Science 1980, 210, 80–83. [Google Scholar] [CrossRef]
- Paul, D.D.; Sutton, S. Evoked potential correlates of response criterion in auditory signal detection. Science 1972, 177, 362–364. [Google Scholar] [CrossRef]
- Squires, K.C.; Hillyard, S.A.; Lindsay, P.H. Vertex potentials evoked during auditory signal detection: Relation to decision criteria. Percept. Psychophys. 1973, 14, 265–272. [Google Scholar] [CrossRef]
- Chhabra, A.; Subramaniam, R.; Srivastava, A.; Prabhakar, H.; Kalaivani, M.; Paranjape, S. Spectral entropy monitoring for adults and children undergoing general anaesthesia. Cochrane Database Syst. Rev. 2016, 3, CD010135. [Google Scholar] [CrossRef]
- Engemann, D.A.; Raimondo, F.; King, J.R.; Rohaut, B.; Louppe, G.; Faugeras, F.; Annen, J.; Cassol, H.; Gosseries, O.; Fernandez-Slezak, D.; et al. Robust EEG-based cross-site and cross-protocol classification of states of consciousness. Brain 2018, 141, 3179–3192. [Google Scholar] [CrossRef]
- Helakari, H.; Kananen, J.; Huotari, N.; Raitamaa, L.; Tuovinen, T.; Borchardt, V.; Rasila, A.; Raatikainen, V.; Starck, T.; Hautaniemi, T.; et al. Spectral entropy indicates electrophysiological and hemodynamic changes in drug-resistant epilepsy—A multimodal MREG study. Neuroimage Clin. 2019, 22, 101763. [Google Scholar] [CrossRef]
- Liang, Z.; Wang, Y.; Sun, X.; Li, D.; Voss, L.J.; Sleigh, J.W.; Hagihira, S.; Li, X. EEG entropy measures in anesthesia. Front. Comput. Neurosci. 2015, 9, 16. [Google Scholar] [CrossRef]
- Uriguen, J.A.; García-Zapirain, B.; Artieda, J.; Iriarte, J.; Valencia, M. Comparison of background EEG activity of different groups of patients with idiopathic epilepsy using Shannon spectral entropy and cluster-based permutation statistical testing. PLoS ONE 2017, 12, e0184044. [Google Scholar] [CrossRef]
- Sitt, J.D.; King, J.R.; El Karoui, I.; Rohaut, B.; Faugeras, F.; Gramfort, A.; Cohen, L.; Sigman, M.; Dehaene, S.; Naccache, L. Large scale screening of neural signatures of consciousness in patients in a vegetative or minimally conscious state. Brain 2014, 137, 2258–2270. [Google Scholar] [CrossRef]
- Colominas, M.A.; Jomaa, M.E.S.H.; Jrad, N.; Humeau-Heurtier, A.; Van Bogaert, P. Time-varying time–frequency complexity measures for epileptic eeg data analysis. IEEE Trans. Biomed. Eng. 2017, 65, 1681–1688. [Google Scholar] [CrossRef]
- Satapathy, S.K.; Dehuri, S.; Jagadev, A.K. EEG signal classification using PSO trained RBF neural network for epilepsy identification. Inform. Med. Unlocked 2017, 6, 1–11. [Google Scholar] [CrossRef]
- Wu, J.; Zhou, T.; Li, T. Detecting epileptic seizures in EEG signals with complementary ensemble empirical mode decomposition and extreme gradient boosting. Entropy 2020, 22, 140. [Google Scholar] [CrossRef]
- Benzy, V.; Jasmin, E.; Koshy, R.C. Approximate entropy and wavelet entropy based depth of anesthesia monitoring. In Proceedings of the 2015 International Conference on Control Communication & Computing India (ICCC), Trivandrum, India, 19–21 November 2015; pp. 371–374. [Google Scholar]
- Giannakakis, G.; Sakkalis, V.; Pediaditis, M.; Farmaki, C.; Vorgia, P.; Tsiknakis, M. An approach to absence epileptic seizures detection using approximate entropy. In Proceedings of the 2013 35th Annual International Conference of the IEEE Engineering in Medicine and Biology Society (EMBC), Osaka, Japan, 3–7 July 2013; pp. 413–416. [Google Scholar]
- Schneider, G.; Jordan, D.; Schwarz, G.; Bischoff, P.; Kalkman, C.J.; Kuppe, H.; Rundshagen, I.; Omerovic, A.; Kreuzer, M.; Stockmanns, G.; et al. Monitoring depth of anesthesia utilizing a combination of electroencephalographic and standard measures. Anesthesiology 2014, 120, 819–828. [Google Scholar] [CrossRef] [PubMed]
- Ferenets, R.; Vanluchene, A.; Lipping, T.; Heyse, B.; Struys, M.M. Behavior of entropy/complexity measures of the electroencephalogram during propofol-induced sedation: Dose-dependent effects of remifentanil. J. Am. Soc. Anesthesiol. 2007, 106, 696–706. [Google Scholar] [CrossRef] [PubMed]
- Curley, W.H.; Forgacs, P.B.; Voss, H.U.; Conte, M.M.; Schiff, N.D. Characterization of EEG signals revealing covert cognition in the injured brain. Brain 2018, 141, 1404–1421. [Google Scholar] [CrossRef] [PubMed]
- Engemann, D.A.; Kozynets, O.; Sabbagh, D.; Lemaître, G.; Varoquaux, G.; Liem, F.; Gramfort, A. Combining magnetoencephalography with magnetic resonance imaging enhances learning of surrogate-biomarkers. elife 2020, 9, e54055. [Google Scholar] [CrossRef] [PubMed]
- Altıntop, Ç.G.; Latifoğlu, F.; Akın, A.K.; Bayram, A.; Çiftçi, M. Classification of Depth of Coma Using Complexity Measures and Nonlinear Features of Electroencephalogram Signals. Int. J. Neural Syst. 2022, 32, 2250018. [Google Scholar] [CrossRef] [PubMed]
- Chan, H.; Lin, M.; Fang, S. Linear and nonlinear analysis of electroencephalogram of the coma. In Proceedings of the The 26th Annual International Conference of the IEEE Engineering in Medicine and Biology Society, San Francisco, CA, USA, 1–5 September 2004; Volume 1, pp. 593–595. [Google Scholar]
- Gosseries, O.; Schnakers, C.; Ledoux, D.; Vanhaudenhuyse, A.; Bruno, M.A.; Demertzi, A.; Noirhomme, Q.; Lehembre, R.; Damas, P.; Goldman, S.; et al. Automated EEG entropy measurements in coma, vegetative state/unresponsive wakefulness syndrome and minimally conscious state. Funct. Neurol. 2011, 26, 25. [Google Scholar]
- Ni, L.; Cao, J.; Wang, R. Analyzing EEG of quasi-brain-death based on dynamic sample entropy measures. Comput. Math. Methods Med. 2013, 2013, 618743. [Google Scholar] [CrossRef]
- Noirhomme, Q.; Lehembre, R.; Lugo, Z.d.R.; Lesenfants, D.; Luxen, A.; Laureys, S.; Oddo, M.; Rossetti, A.O. Automated analysis of background EEG and reactivity during therapeutic hypothermia in comatose patients after cardiac arrest. Clin. EEG Neurosci. 2014, 45, 6–13. [Google Scholar] [CrossRef]
- Jordan, D.; Stockmanns, G.; Kochs, E.F.; Pilge, S.; Schneider, G. Electroencephalographic order pattern analysis for the separation of consciousness and unconsciousnessan analysis of approximate entropy, permutation entropy, recurrence rate, and phase coupling of order recurrence plots. Anesthesiol. J. Am. Soc. Anesthesiol. 2008, 109, 1014–1022. [Google Scholar]
- Li, D.; Liang, Z.; Wang, Y.; Hagihira, S.; Sleigh, J.W.; Li, X. Parameter selection in permutation entropy for an electroencephalographic measure of isoflurane anesthetic drug effect. J. Clin. Monit. Comput. 2013, 27, 113–123. [Google Scholar] [CrossRef]
- Zhu, G.; Li, Y.; Wen, P.P.; Wang, S.; Xi, M. Epileptogenic focus detection in intracranial EEG based on delay permutation entropy. In AIP Conference Proceedings; American Institute of Physics: College Park, MD, USA, 2013; Volume 1559, pp. 31–36. [Google Scholar]
- Fraiwan, M.; Alafeef, M.; Almomani, F. Gauging human visual interest using multiscale entropy analysis of EEG signals. J. Ambient. Intell. Humaniz. Comput. 2021, 12, 2435–2447. [Google Scholar] [CrossRef]
- Tononi, G.; Sporns, O. Measuring information integration. BMC Neurosci. 2003, 4, 31. [Google Scholar] [CrossRef]
- Tononi, G. An information integration theory of consciousness. BMC Neurosci. 2004, 5, 42. [Google Scholar] [CrossRef]
- Tononi, G.; Boly, M.; Massimini, M.; Koch, C. Integrated information theory: From consciousness to its physical substrate. Nat. Rev. Neurosci. 2016, 17, 450. [Google Scholar] [CrossRef]
- Seth, A. Models of consciousness. Scholarpedia 2007, 2, 1328. [Google Scholar] [CrossRef]
- Haun, A.M.; Oizumi, M.; Kovach, C.K.; Kawasaki, H.; Oya, H.; Howard, M.A.; Adolphs, R.; Tsuchiya, N. Conscious Perception as Integrated Information Patterns in Human Electrocorticography. eneuro 2017, 4, e0085-17. [Google Scholar] [CrossRef]
- Isler, J.R.; Stark, R.I.; Grieve, P.G.; Welch, M.G.; Myers, M.M. Integrated information in the EEG of preterm infants increases with family nurture intervention, age, and conscious state. PLoS ONE 2018, 13, e0206237. [Google Scholar] [CrossRef]
- Kim, H.; Hudetz, A.G.; Lee, J.; Mashour, G.A.; Lee, U.; Avidan, M.S.; Bel-Bahar, T.; Blain-Moraes, S.; Golmirzaie, G.; Janke, E.; et al. Estimating the integrated information measure phi from high-density electroencephalography during states of consciousness in humans. Front. Hum. Neurosci. 2018, 12, 42. [Google Scholar] [CrossRef]
- Kim, H.; Lee, U. Criticality as a determinant of integrated information Φ in human brain networks. Entropy 2019, 21, 981. [Google Scholar] [CrossRef]
- Oizumi, M.; Amari, S.i.; Yanagawa, T.; Fujii, N.; Tsuchiya, N. Measuring integrated information from the decoding perspective. PLoS Comput. Biol. 2016, 12, e1004654. [Google Scholar] [CrossRef]
- Toker, D.; Sommer, F.T. Information integration in large brain networks. PLoS Comput. Biol. 2019, 15, e1006807. [Google Scholar] [CrossRef] [PubMed]
- Oizumi, M.; Tsuchiya, N.; Amari, S.i. Unified framework for information integration based on information geometry. Proc. Natl. Acad. Sci. USA 2016, 113, 14817–14822. [Google Scholar] [CrossRef] [PubMed]
- Kitazono, J.; Kanai, R.; Oizumi, M. Efficient algorithms for searching the minimum information partition in integrated information theory. Entropy 2018, 20, 173. [Google Scholar] [CrossRef] [PubMed]
- Veyrié, A. Dynamique de la Construction de la Perception Auditive Consciente: Aspects Électrophysiologiques et Corrélats Informationnels Neuronaux. Ph.D. Thesis, Université d’Aix-Marseille, Aix-Marseille, France, 2023. [Google Scholar]
- Green, P.; MacLeod, C.J. SIMR: An R package for power analysis of generalized linear mixed models by simulation. Methods Ecol. Evol. 2016, 7, 493–498. [Google Scholar] [CrossRef]
- Enzler, F.; Fournier, P.; Noreña, A. A psychoacoustic test for diagnosing hyperacusis based on ratings of natural sounds. Hear. Res. 2021, 400, 108124. [Google Scholar] [CrossRef]
- Königs, L.; Gutschalk, A. Functional lateralization in auditory cortex under informational masking and in silence. Eur. J. Neurosci. 2012, 36, 3283–3290. [Google Scholar] [CrossRef]
- Neff, D.L.; Green, D.M. Masking produced by spectral uncertainty with multicomponent maskers. Percept. Psychophys. 1987, 41, 409–415. [Google Scholar] [CrossRef]
- Veyrié, A.; Noreña, A.; Sarrazin, J.C.; Pezard, L. Investigating the influence of masker and target properties on the dynamics of perceptual awareness under informational masking. PLoS ONE 2023, 18, e0282885. [Google Scholar] [CrossRef]
- Glasberg, B.R.; Moore, B.C. Derivation of auditory filter shapes from notched-noise data. Hear. Res. 1990, 47, 103–138. [Google Scholar] [CrossRef]
- Moore, B. Frequency analysis and masking. Hearing 1995, 161, 205. [Google Scholar]
- Van Rossum, G. Python Programming Language. In Proceedings of the USENIX Annual Technical Conference, Santa Clara, CA, USA, 17–22 June 2007; Volume 41, p. 36. [Google Scholar]
- Green, D.M.; Swets, J.A. Signal Detection Theory and Psychophysics; Wiley: New York, NY, USA, 1966; Volume 1. [Google Scholar]
- Macmillan, N.A.; Creelman, C.D. Detection Theory: A User’s Guide; Psychology Press: London, UK, 2004. [Google Scholar]
- Chatrian, G.; Lettich, E.; Nelson, P. Ten percent electrode system for topographic studies of spontaneous and evoked EEG activities. Am. J. EEG Technol. 1985, 25, 83–92. [Google Scholar] [CrossRef]
- Oostenveld, R.; Praamstra, P. The five percent electrode system for high-resolution EEG and ERP measurements. Clin. Neurophysiol. 2001, 112, 713–719. [Google Scholar] [CrossRef]
- Gramfort, A.; Luessi, M.; Larson, E.; Engemann, D.A.; Strohmeier, D.; Brodbeck, C.; Goj, R.; Jas, M.; Brooks, T.; Parkkonen, L.; et al. MEG and EEG data analysis with MNE-Python. Front. Neurosci. 2013, 7, 267. [Google Scholar] [CrossRef]
- Jas, M.; Engemann, D.; Raimondo, F.; Bekhti, Y.; Gramfort, A. Automated rejection and repair of bad trials in MEG/EEG. In Proceedings of the 2016 International Workshop on Pattern Recognition in Neuroimaging (PRNI), Trento, Italy, 22–24 June 2016; pp. 1–4. [Google Scholar]
- Jas, M.; Engemann, D.A.; Bekhti, Y.; Raimondo, F.; Gramfort, A. Autoreject: Automated artifact rejection for MEG and EEG data. NeuroImage 2017, 159, 417–429. [Google Scholar] [CrossRef]
- Gärtner, K.; Gutschalk, A. Auditory cortex activity related to perceptual awareness versus masking of tone sequences. NeuroImage 2021, 228, 117681. [Google Scholar] [CrossRef]
- Bruhn, J.; Ropcke, H.; Hoeft, A. Approximate entropy as an electroencephalographic measure of anesthetic drug effect during desflurane anesthesia. J. Am. Soc. Anesthesiol. 2000, 92, 715–726. [Google Scholar] [CrossRef]
- Pincus, S.M. Approximate entropy as a measure of system complexity. Proc. Natl. Acad. Sci. USA 1991, 88, 2297–2301. [Google Scholar] [CrossRef]
- Wang, F.; Wang, H.; Fu, R. Real-time ECG-based detection of fatigue driving using sample entropy. Entropy 2018, 20, 196. [Google Scholar] [CrossRef]
- Zhang, Y.; Wei, S.; Long, Y.; Liu, C. Performance analysis of multiscale entropy for the assessment of ECG signal quality. J. Electr. Comput. Eng. 2015, 2015. [Google Scholar] [CrossRef]
- Zurek, S.; Grabowski, W.; Kosmider, M.; Jurga, S.; Guzik, P.; Piskorski, J. Bootstrapping the empirical bounds on the variability of sample entropy in 24-hour ECG recordings for 1 h segments. J. Appl. Math. Comput. Mech. 2018, 17, 105–113. [Google Scholar] [CrossRef]
- Vallat, R. Antropy. 2022. Available online: https://raphaelvallat.com/antropy/build/html/index.html (accessed on 23 June 2023).
- Bao, F.S.; Liu, X.; Zhang, C. PyEEG: An open source python module for EEG/MEG feature extraction. Comput. Intell. Neurosci. 2011, 2011, 406391. [Google Scholar] [CrossRef] [PubMed]
- Barrett, A.B.; Seth, A.K. Practical measures of integrated information for time-series data. PLoS Comput. Biol. 2011, 7, e1001052. [Google Scholar] [CrossRef]
- Mediano, P.; Seth, A.; Barrett, A. Measuring integrated information: Comparison of candidate measures in theory and simulation. Entropy 2019, 21, 17. [Google Scholar] [CrossRef] [PubMed]
- Grabner, R.H.; De Smedt, B. Oscillatory EEG correlates of arithmetic strategies: A training study. Front. Psychol. 2012, 3, 428. [Google Scholar] [CrossRef] [PubMed]
- Bates, D.; Machler, M.; Bolker, B.; Walker, S. Fitting linear mixed-effects models using lme4. arXiv 2014, arXiv:1406.5823. [Google Scholar]
- Pinheiro, J.; Bates, D.; DebRoy, S.; Sarkar, D.; R Core Team. nlme: Linear and Nonlinear Mixed Effects Models; R Package Version; R Foundation for Statistical Computing: Vienna, Austria, 2012. [Google Scholar]
- R Core Team. R: A Language and Environment for Statistical Computing; R Foundation for Statistical Computing: Vienna, Austria, 2021. [Google Scholar]
- Searle, S.; Speed, F.; Milliken, G. Population marginal means in the linear model: An alternative to least squares means. Am. Stat. 1980, 34, 216–221. [Google Scholar]
- Eklund, R.; Wiens, S. Auditory awareness negativity is an electrophysiological correlate of awareness in an auditory threshold task. Conscious. Cogn. 2019, 71, 70–78. [Google Scholar] [CrossRef]
- Dembski, C.; Koch, C.; Pitts, M. Perceptual awareness negativity: A physiological correlate of sensory consciousness. Trends Cogn. Sci. 2021, 25, 660–670. [Google Scholar] [CrossRef]
- Dehaene, S.; Changeux, J.P. Experimental and theoretical approaches to conscious processing. Neuron 2011, 70, 200–227. [Google Scholar] [CrossRef]
- Cohen, M.A.; Ortego, K.; Kyroudis, A.; Pitts, M. Distinguishing the neural correlates of perceptual awareness and postperceptual processing. J. Neurosci. 2020, 40, 4925–4935. [Google Scholar] [CrossRef]
- Fishman, Y.I.; Lee, W.W.; Sussman, E. Learning to predict: Neuronal signatures of auditory expectancy in human event-related potentials. NeuroImage 2021, 225, 117472. [Google Scholar] [CrossRef]
- Pitts, M.A.; Padwal, J.; Fennelly, D.; Martínez, A.; Hillyard, S.A. Gamma band activity and the P3 reflect post-perceptual processes, not visual awareness. Neuroimage 2014, 101, 337–350. [Google Scholar] [CrossRef]
- Pitts, M.A.; Metzler, S.; Hillyard, S.A. Isolating neural correlates of conscious perception from neural correlates of reporting one’s perception. Front. Psychol. 2014, 5, 1078. [Google Scholar] [CrossRef]
- Tsuchiya, N.; Wilke, M.; Frässle, S.; Lamme, V.A. No-report paradigms: Extracting the true neural correlates of consciousness. Trends Cogn. Sci. 2015, 19, 757–770. [Google Scholar] [CrossRef]
- Anier, A.; Lipping, T.; Jäntti, V.; Puumala, P.; Huotari, A.M. Entropy of the EEG in transition to burst suppression in deep anesthesia: Surrogate analysis. In Proceedings of the 2010 Annual International Conference of the IEEE Engineering in Medicine and Biology, Buenos Aires, Argentina, 31 August–4 September 2010; pp. 2790–2793. [Google Scholar]
- Jordan, D.; Stockmanns, G.; Kochs, E.; Schneider, G. Is detection of different anesthetic levels related to nonlinearity of the electroencephalogram? In Proceedings of the 4th European Conference of the International Federation for Medical and Biological Engineering, Antwerp, Belgium, 23–27 November 2009; pp. 335–339. [Google Scholar]
- Kreuzer, M. EEG based monitoring of general anesthesia: Taking the next steps. Front. Comput. Neurosci. 2017, 11, 56. [Google Scholar] [CrossRef]
- Aru, J.; Bachmann, T.; Singer, W.; Melloni, L. Distilling the neural correlates of consciousness. Neurosci. Biobehav. Rev. 2012, 36, 737–746. [Google Scholar] [CrossRef]
- Geschwind, N.; Levitsky, W. Human brain: Left-right asymmetries in temporal speech region. Science 1968, 161, 186–187. [Google Scholar] [CrossRef]
- Overath, T.; Cusack, R.; Kumar, S.; Von Kriegstein, K.; Warren, J.D.; Grube, M.; Carlyon, R.P.; Griffiths, T.D. An information theoretic characterisation of auditory encoding. PLoS Biol. 2007, 5, e288. [Google Scholar] [CrossRef]
- Shen, Y. Auditory sequential accumulation of spectral information. Hear. Res. 2017, 356, 118–126. [Google Scholar] [CrossRef]
- Barniv, D.; Nelken, I. Auditory streaming as an online classification process with evidence accumulation. PLoS ONE 2015, 10, e0144788. [Google Scholar] [CrossRef]
- Nguyen, Q.A.; Rinzel, J.; Curtu, R. Buildup and bistability in auditory streaming as an evidence accumulation process with saturation. PLoS Comput. Biol. 2020, 16, e1008152. [Google Scholar] [CrossRef] [PubMed]
- Inouye, T.; Shinosaki, K.; Sakamoto, H.; Toi, S.; Ukai, S.; Iyama, A.; Katsuda, Y.; Hirano, M. Quantification of EEG irregularity by use of the entropy of the power spectrum. Electroencephalogr. Clin. Neurophysiol. 1991, 79, 204–210. [Google Scholar] [CrossRef] [PubMed]
- Pincus, S.M.; Gladstone, I.M.; Ehrenkranz, R.A. A regularity statistic for medical data analysis. J. Clin. Monit. 1991, 7, 335–345. [Google Scholar] [CrossRef] [PubMed]
- Kantz, H.; Schreiber, T. Nonlinear Time Series Analysis; Cambridge University Press: Cambridge, UK, 2004; Volume 7. [Google Scholar]
- Richman, J.S.; Moorman, J.R. Physiological time-series analysis using approximate entropy and sample entropy. Am. J. Physiol.-Heart Circ. Physiol. 2000, 278, H2039–H2049. [Google Scholar] [CrossRef] [PubMed]
- Bandt, C.; Pompe, B. Permutation entropy: A natural complexity measure for time series. Phys. Rev. Lett. 2002, 88, 174102. [Google Scholar] [CrossRef]
- Cuesta-Frau, D.; Murillo-Escobar, J.P.; Orrego, D.A.; Delgado-Trejos, E. Embedded dimension and time series length. Practical influence on permutation entropy and its applications. Entropy 2019, 21, 385. [Google Scholar] [CrossRef]
- Varshavsky, R.; Gottlieb, A.; Linial, M.; Horn, D. Novel unsupervised feature filtering of biological data. Bioinformatics 2006, 22, e507–e513. [Google Scholar] [CrossRef]
- Banerjee, M.; Pal, N.R. Feature selection with SVD entropy: Some modification and extension. Inf. Sci. 2014, 264, 118–134. [Google Scholar] [CrossRef]
- Alvarez-Ramirez, J.; Rodriguez, E. A singular value decomposition entropy approach for testing stock market efficiency. Phys. A Stat. Mech. Its Appl. 2021, 583, 126337. [Google Scholar] [CrossRef]
- Amari, S.I. Information geometry on hierarchy of probability distributions. IEEE Trans. Inf. Theory 2001, 47, 1701–1711. [Google Scholar] [CrossRef]
- Ay, N. Information geometry on complexity and stochastic interaction. Entropy 2015, 17, 2432–2458. [Google Scholar] [CrossRef]
- McGill, W. Multivariate information transmission. Trans. IRE Prof. Group Inf. Theory 1954, 4, 93–111. [Google Scholar] [CrossRef]
- Shannon, C.E. A mathematical theory of communication. Bell Syst. Tech. J. 1948, 27, 379–423. [Google Scholar] [CrossRef]


| Estimate | Std. Error | z Value | Pr(>|z|) | |
|---|---|---|---|---|
| 20–11 | −0.39 | 0.12 | −3.23 | 0.01 |
| 28–11 | −0.34 | 0.12 | −2.80 | 0.03 |
| 36–11 | −0.11 | 0.12 | −0.91 | 0.80 |
| 28–20 | 0.05 | 0.12 | 0.43 | 0.97 |
| 36–20 | 0.28 | 0.12 | 2.32 | 0.09 |
| 36–28 | 0.23 | 0.12 | 1.89 | 0.23 |
| Electrode | Tone | Pairs | Estimate | SE | df | t-Ratio | p-Value |
|---|---|---|---|---|---|---|---|
| ARN | |||||||
| B2 | H—M | 0.697 | 0.338 | 81 | 2.05 | 0.170 | |
| B1 | H—M | −1.193 | 0.335 | 81 | −3.56 | 0.002 | |
| C5 | A1 | H—M | 0.154 | 0.323 | 81 | 0.47 | 1.000 |
| A2 | H—M | 0.341 | 0.346 | 81 | 0.98 | 1.000 | |
| B2 | H—M | 0.308 | 0.300 | 95 | 1.02 | 1.000 | |
| B1 | H—M | −1.120 | 0.291 | 95 | −3.84 | <0.001 | |
| F6 | A1 | H—M | −0.341 | 0.288 | 95 | −1.18 | 0.958 |
| A2 | H—M | 1.154 | 0.296 | 95 | 3.89 | <0.001 | |
| B2 | H—M | 0.517 | 0.335 | 90 | 1.54 | 0.505 | |
| B1 | H—M | −1.277 | 0.331 | 90 | −3.85 | <0.001 | |
| F7 | A1 | H—M | 0.216 | 0.319 | 90 | 0.67 | 1.000 |
| A2 | H—M | 0.543 | 0.336 | 90 | 1.61 | 0.438 | |
| P300 | |||||||
| B2 | H—M | −0.156 | 0.145 | 101 | −1.07 | 1.000 | |
| B1 | H—M | 0.636 | 0.149 | 101 | 4.25 | <0.001 | |
| FCz | A1 | H—M | −0.034 | 0.143 | 101 | −0.23 | 1.000 |
| A2 | H—M | −0.445 | 0.143 | 101 | −3.10 | <0.01 | |
| B2 | H—M | −0.100 | 0.164 | 102 | −0.61 | 1.000 | |
| B1 | H—M | 0.780 | 0.166 | 102 | 4.69 | <0.001 | |
| Cz | A1 | H—M | −0.178 | 0.164 | 102 | −1.08 | 1.000 |
| A2 | H—M | −0.501 | 0.168 | 102 | −2.97 | <0.01 | |
| B2 | H—M | −0.546 | 0.173 | 99 | −3.15 | <0.01 | |
| B1 | H—M | 0.999 | 0.177 | 99 | 5.63 | <0.001 | |
| CPz | A1 | H—M | −0.169 | 0.173 | 99 | −0.97 | 1.000 |
| A2 | H—M | −0.283 | 0.173 | 99 | −1.63 | 0.42 | |
| B2 | H—M | −0.293 | 0.195 | 101 | −1.50 | 0.546 | |
| B1 | H—M | 1.003 | 0.198 | 101 | 5.06 | <0.001 | |
| Pz | A1 | H—M | −0.054 | 0.195 | 101 | −0.27 | 1.00 |
| A2 | H—M | −0.655 | 0.203 | 101 | −3.21 | <0.01 |
| Cluster | Measure | Pairs | Estimate | SE | df | t-Ratio | p-Value |
|---|---|---|---|---|---|---|---|
| Antero-Frontal | SpEn | H—M | −0.004 | 0.005 | 647 | −0.727 | 1.000 |
| ApEn | H—M | −0.017 | 0.010 | 647 | −1.817 | 0.627 | |
| SaEn | H—M | −0.018 | 0.011 | 647 | −1.706 | 0.796 | |
| PeEn | H—M | −0.008 | 0.002 | 647 | −3.388 | 0.006 | |
| SvEn | H—M | −0.008 | 0.006 | 647 | −1.265 | 1.000 | |
| Central | SpEn | H—M | −0.003 | 0.005 | 647 | −0.588 | 1.000 |
| ApEn | H—M | −0.009 | 0.010 | 647 | −0.981 | 1.000 | |
| SaEn | H—M | −0.010 | 0.011 | 647 | −0.903 | 1.000 | |
| PeEn | H—M | −0.006 | 0.002 | 647 | −2.526 | 0.106 | |
| SvEn | H—M | −0.004 | 0.006 | 647 | −0.627 | 1.000 | |
| Centro-Parietal | SpEn | H—M | −0.004 | 0.005 | 647 | −0.817 | 1.000 |
| ApEn | H—M | −0.006 | 0.010 | 647 | −0.679 | 1.000 | |
| SaEn | H—M | −0.006 | 0.011 | 647 | −0.571 | 1.000 | |
| PeEn | H—M | −0.008 | 0.002 | 647 | −3.351 | 0.007 | |
| SvEn | H—M | −0.002 | 0.006 | 647 | −0.253 | 1.000 | |
| Frontal | SpEn | H—M | −0.001 | 0.005 | 647 | −0.177 | 1.000 |
| ApEn | H—M | −0.012 | 0.010 | 647 | −1.290 | 1.000 | |
| SaEn | H—M | −0.012 | 0.011 | 647 | −1.169 | 1.000 | |
| PeEn | H—M | −0.007 | 0.002 | 647 | −2.834 | 0.042 | |
| SvEn | H—M | −0.003 | 0.006 | 647 | −0.588 | 1.000 | |
| Fronto-Central | SpEn | H—M | 0.026 | 0.005 | 647 | 4.714 | <0.001 |
| ApEn | H—M | 0.083 | 0.010 | 647 | 8.709 | <0.001 | |
| SaEn | H—M | 0.083 | 0.011 | 647 | 7.882 | <0.001 | |
| PeEn | H—M | 0.060 | 0.002 | 647 | 24.726 | <0.001 | |
| SvEn | H—M | 0.027 | 0.006 | 647 | 4.545 | <0.001 | |
| Parietal | SpEn | H—M | −0.003 | 0.005 | 647 | −0.527 | 1.000 |
| ApEn | H—M | −0.006 | 0.010 | 647 | −0.582 | 1.000 | |
| SaEn | H—M | −0.005 | 0.011 | 647 | −0.501 | 1.000 | |
| PeEn | H—M | −0.007 | 0.002 | 647 | −2.937 | 0.030 | |
| SvEn | H—M | −0.000 | 0.006 | 647 | −0.045 | 1.000 | |
| Parieto-Occipital | SpEn | H—M | −0.003 | 0.005 | 647 | −0.545 | 1.000 |
| ApEn | H—M | −0.011 | 0.010 | 647 | −1.129 | 1.000 | |
| SaEn | H—M | −0.011 | 0.011 | 647 | −0.998 | 1.000 | |
| PeEn | H—M | −0.009 | 0.002 | 647 | −3.578 | 0.003 | |
| SvEn | H—M | −0.003 | 0.006 | 647 | −0.452 | 1.000 | |
| Sagittal | SpEn | H—M | −0.005 | 0.005 | 647 | −0.881 | 1.000 |
| ApEn | H—M | −0.013 | 0.010 | 647 | −1.400 | 1.000 | |
| SaEn | H—M | −0.013 | 0.011 | 647 | −1.237 | 1.000 | |
| PeEn | H—M | −0.009 | 0.002 | 647 | −3.536 | 0.003 | |
| SvEn | H—M | −0.005 | 0.006 | 647 | −0.911 | 1.000 | |
| Temporal | SpEn | H—M | −0.002 | 0.005 | 647 | −0.452 | 1.000 |
| ApEn | H—M | −0.008 | 0.010 | 647 | −0.831 | 1.000 | |
| SaEn | H—M | −0.008 | 0.011 | 647 | −0.797 | 1.000 | |
| PeEn | H—M | −0.006 | 0.002 | 647 | −2.577 | 0.091 | |
| SvEn | H—M | −0.002 | 0.006 | 647 | −0.405 | 1.000 |
Disclaimer/Publisher’s Note: The statements, opinions and data contained in all publications are solely those of the individual author(s) and contributor(s) and not of MDPI and/or the editor(s). MDPI and/or the editor(s) disclaim responsibility for any injury to people or property resulting from any ideas, methods, instructions or products referred to in the content. |
© 2023 by the authors. Licensee MDPI, Basel, Switzerland. This article is an open access article distributed under the terms and conditions of the Creative Commons Attribution (CC BY) license (https://creativecommons.org/licenses/by/4.0/).
Share and Cite
Veyrié, A.; Noreña, A.; Sarrazin, J.-C.; Pezard, L. Information-Theoretic Approaches in EEG Correlates of Auditory Perceptual Awareness under Informational Masking. Biology 2023, 12, 967. https://doi.org/10.3390/biology12070967
Veyrié A, Noreña A, Sarrazin J-C, Pezard L. Information-Theoretic Approaches in EEG Correlates of Auditory Perceptual Awareness under Informational Masking. Biology. 2023; 12(7):967. https://doi.org/10.3390/biology12070967
Chicago/Turabian StyleVeyrié, Alexandre, Arnaud Noreña, Jean-Christophe Sarrazin, and Laurent Pezard. 2023. "Information-Theoretic Approaches in EEG Correlates of Auditory Perceptual Awareness under Informational Masking" Biology 12, no. 7: 967. https://doi.org/10.3390/biology12070967
APA StyleVeyrié, A., Noreña, A., Sarrazin, J.-C., & Pezard, L. (2023). Information-Theoretic Approaches in EEG Correlates of Auditory Perceptual Awareness under Informational Masking. Biology, 12(7), 967. https://doi.org/10.3390/biology12070967