1. Introduction
Approximately 8–12% of patients with metastatic colorectal cancer (mCRC) have BRAFV600E mutation, which is associated with significantly worse response to chemotherapy and poor prognosis [
1]. The BRAFV600E inhibitor vemurafenib has shown only modest efficacy as monotherapy in BRAF-mutated mCRC relative to melanoma carrying BRAFV600E mutation due to the development of primary or secondary resistance [
2]. In addition, it has been shown that acquired resistance to EGFR/BRAF inhibitors occurs within 4–6 months in individuals who were initially responsive [
3]. It has been previously shown that the targeted tumor therapy-induced secretome is involved in phenotypic changes in drug-resistant cancer cell clones that underly metastatic dissemination [
4]. Indeed, the cancer cell secretome contains the collection of proteins secreted or shed from cancer cells and has been studied to identify potential novel cancer biomarkers and therapeutic targets [
5]. Proteins secreted from cancer cells enter body fluids such as blood or urine, which enables their detection by non-invasive assays [
6]. These potentially novel protein biomarkers secreted from cancer cells could aid the identification and the design of novel pharmacological strategies for overcoming the resistance to BRAFV600E inhibition, especially when tumor tissue samples are not readily available.
Preponderant experimental evidence has demonstrated that secreted signals from BRAFV600E-mutated cancer cells play an important role in mediating the response and the development of resistance to targeted therapies. For example, co-culture of vemurafenib-resistant human melanoma cells and sensitive cells treated with vemurafenib significantly augments the growth of resistant cells [
4]. Importantly, conditioned media from vemurafenib-sensitive melanoma cells cultured in the presence of vemurafenib facilitate the proliferation of drug-resistant cells [
4]. The same study has also revealed that conditioned media from vemurafenib-treated cells exert pro-survival and anti-apoptotic effects in vemurafenib-sensitive melanoma cells treated with vemurafenib. Findings from this study indicate that BRAFV600E mutant melanoma cells respond to BRAF inhibition-induced stress by secreting factors that enable the survival of vemurafenib-sensitive cells and facilitate the growth of vemurafenib-resistant clones. Some of these secreted growth-promoting factors were identified in a similar study in the secretome of BRAF inhibitor-resistant melanoma cells, where endothelin-1 was identified as a molecular factor contributing to paracrine protection of resistant cells from BRAF inhibition [
7]. Similarly, a shift of BRAF mutant thyroid cancer cells to more invasive phenotype induced by acquired resistance to Src inhibition was accompanied by changes in the secretome, which again indicates that the secretome composition mirrors phenotypic switching in cancer drug resistance [
8].
In this study, we screened the alterations in the secretome accompanying the development of resistance to BRAFV600E inhibition by vemurafenib in BRAFV600E-mutated colon cancer cells. In line with this, we presented data from comparative proteomics profiling of the secretome from vemurafenib-sensitive in comparison with vemurafenib-resistant RKO colon cancer cells harboring BRAFV600E mutation, which were obtained by two complementary proteomics approaches including two-dimensional gel electrophoresis coupled with MALDI-TOF/TOF mass spectrometry and label-free quantitative LC-MS/MS analysis. Gene ontology analysis revealed important groups of secreted proteins within the regulators of DNA replication and the endoplasmic reticulum (ER) homeostasis linked with the unfolded protein response that could be associated with the development of resistance to vemurafenib. Protein–protein interaction (PPI) network analysis and in silico evaluation of selected protein features using the BRAFV600E-mutated colon adenocarcinoma dataset in the Cancer Genome Atlas (TCGA) database pointed to replication protein A1 (RPA1) and heat shock protein family A (Hsp70) member 5 (HSPA5/GRP78) regulating DNA replication and the unfolded protein response, respectively, as potentially interesting protein targets associated with vemurafenib resistance. Further studies are required to investigate the potential of RPA1 and HSPA5/GRP78 in the real-world setting using clinical samples and to examine their roles in determining cancer cell response to BRAFV600E inhibition, not only in colon cancer but also in other BRAFV600E-mutated cancers.
2. Materials and Methods
2.1. Cell Culturing Conditions and the Development of Vemurafenib-Resistant RKO Colon Cancer Cell Line
The RKO human colon carcinoma cell line harboring BRAFV600E mutation was purchased from the ATCC and maintained in Eagle’s Minimum Essential Medium (Lonza, Switzerland) supplemented with 10% fetal bovine serum (Capricorn Scientific, Ebsdorfergrund, Germany), 2 mM L-glutamine (Capricorn Scientific, Ebsdorfergrund, Germany), penicillin (100 U/mL) (Capricorn Scientific, Ebsdorfergrund, Germany) and streptomycin (100 µg/mL) (Capricorn Scientific, Ebsdorfergrund, Germany) in a humified atmosphere with 5% CO2 at 37 °C.
The vemurafenib-resistant RKO cell line was developed by exposing the parental (sensitive) RKO cell line to successively increasing concentrations of Vemurafenib (PLX4032) (MedChemExpress, Monmouth Junction, New York City, NJ, USA) in the period of about 6 months until stable resistance to a clinically relevant concentration of 11.52 µM had been achieved. Established resistance phenotype was confirmed by the MTT assay showing an increase in the IC
50 value by 10-fold in the resistant RKO cells in comparison with their sensitive counterparts and by microscopic evaluation of the cell morphology as previously reported [
9].
2.2. Collection of Conditioned Media for the Secretome Analyses
Cells were plated at a seeding density of 4 × 10⁶ into 10 cm Petri dishes in the absence of vemurafenib and grown for 48 h under standard growth conditions. Adhered cells were then washed three times with PBS and two times with EMEM followed by a one-hour incubation in the serum-free medium (SFM). The latter was removed, fresh SFM was added to adherent cells and the cells were grown for the additional 24 h in the absence of vemurafenib in SFM. Conditioned medium was then collected and centrifuged 10 min at 500 rpm and 4 °C followed by second centrifugation at 3000 rpm for 15 min. Adherent cells were detached by trypsin and their viability was examined by the Trypan Blue Exclusion Test. The viability above 95% was the selection criteria for downstream proteomics analyses of conditioned media. Two percent sodium deoxycholate (Sigma-Aldrich, St. Louis, MO, USA) was added to 20 mL of conditioned media to a final concentration of 0.2% sodium deoxycholate followed by incubation on ice for 30 min. Trichloroacetic acid (Sigma-Aldrich, St. Louis, MO, USA) was added to a final concentration of 7.5% (v/v) and the supernatants were mixed and incubated on ice for 1 h. Proteins were precipitated and centrifuged @ 15,000× g for 20 min at 4 °C. Fifty percent of the initial volume of ice-cold (−20 °C) tetrahydrofuran (Sigma-Aldrich, St. Louis, MO, USA) was added to dissolve the pellets and left at −20 °C for 5 min. After centrifugation, 25% of the final volume of ice-cold (−20 °C) tetrahydrofuran was added to the pellets and left at −20 °C for 5 min. After centrifugation, the pellets were air-dried and protein concentration measured by a Qubit™ Protein Assay Kit (ThermoFisher Scientific, Waltham, MA, USA) using a Qubit Fluorometer (ThermoFisher Scientific, Waltham, MA, USA).
2.3. Two-Dimensional Gel Electrophoresis (2-DE) and Image Analysis
A total of 300 µg proteins was dissolved in 125 µL 2-DE rehydration buffer containing 7M urea, 2M thiourea, 4% (w/v) CHAPS, 10% (w/v) DTT and 0.2% (w/v) BioLyte® 3/10 Ampholyte (BIO-RAD, Irvine, CA, USA). Dissolved protein samples were loaded onto 7 cm, pH 4–7 ReadyStrip™ IPG Strips (BIO-RAD, Irvine, CA, USA) and the strips were overlaid with mineral oil (BIO-RAD, Irvine, CA, USA). Isoelectric focusing was performed using PROTEAN IEF cell (BIO-RAD, Irvine, CA, USA) under the following conditions: 50 V for 14 h (active rehydration), 250 V rapid for 20 min, 4000 V gradual for 1 h and 4000 V rapid for 15,000 VHours. Proteins were resolved in the second dimension using 12% SDS-polyacrylamide gels at 200 V for 1 h by Mini-PROTEAN Tetra Cell (BIO-RAD, Irvine, CA, USA) followed by gel staining by Coomassie Brilliant Blue G-250 (Sigma-Aldrich, Louis, MO, USA). Gel imaging was performed by ChemiDoc XRS+ Imager (BIO-RAD, Irvine, CA, USA). 2-DE gel image analysis was performed by Progenesis SameSpots 4.0 (TotalLab, Newcastle upon Tyne, Newcastle upon Tyne, UK). The analysis was carried out in triplicate for each condition. Statistically significant differences in protein abundance between the datasets were determined by ANOVA analyses followed by post hoc Tukey’s test.
2.4. MALDI-TOF/TOF Mass Spectrometry Analysis
Protein spots of interest were excised from the gel and destained using acetonitrile (Honeywell, Charlotte, NC, USA) and 100 mM ammonium bicarbonate (ABC, Sigma-Aldrich, St. Louis, MO, USA). The samples were then dried in a vacuum concentrator to complete dryness. In-gel tryptic digestion was performed by incubating the gel in 50 mM ABC containing 10 ng/µL trypsin (sequencing grade, Promega, Madison, WI, USA) at 4 °C overnight. Supernatant was collected and the tryptic peptides were extracted by incubation firstly in 65% acetonitrile/5% formic acid solution with shaking and sonication, and then followed by incubation in miliQ water and 100% acetonitrile with shaking and sonication. The collected supernatants were dried in a vacuum concentrator, redissolved in 0.1% trifluoroacetic acid and purified by C18 ZipTip (MerckMillipore, Burlington, MA, USA). The obtained sample was mixed with matrix solution composed of α-cyano-4-hydroxycinnamic acid (0.3 g/L CHCA in the solution containing 2:1 ethanol:acetone, v/v) at the ratio of 1:10. A volume of 1 µL of the sample/matrix solution mixture was spotted onto the MALDI plate (AnchorChip 800 μm, Bruker Daltonics, Bremen, Germany) and left at room temperature to crystallize. UltrafleXtreme MALDI-TOF/TOF mass spectrometer (Bruker Daltonics, Billerica, MA, USA) was used for MS analyses, where the reflector mode in the m/z range of 700–3500 Da was selected. The MS spectra were externally calibrated using the commercial mixture of Peptide Calibration Standard and Protein Calibration Standard I (Bruker Daltonics, Billerica, MA, USA). FlexControl 3.4 software (Bruker Daltonics, Billerica, MA, USA) was used for acquiring and processing spectra. FlexAnalysis 3.4 (Bruker Daltonics, Billerica, MA, USA) was used for protein database search. Proteins were identified by Mascot 2.4.1 search engine (Matrix Science, London, UK) using the following search parameters: enzyme: trypsin; fixed modifications: carbamidomethylation on cysteine; variable modifications: oxidation on methionine; protein mass: unrestricted; peptide mass tolerance: ±50 ppm; maximum missed cleavage: 2.
2.5. LC-MS/MS Sample Preparation
For each conditioned media sample, the volume corresponding to 20 µg of protein was taken and supplemented with 20% sodium dodecyl sulfate (SDS) to a final concentration of 4%. The samples were boiled at 95 °C for 10 min while shaking at 800 rpm on a Thermoshaker (Eppendorf). The samples were reduced with 5 mM dithiothreitol for 30 min at room temperature followed by alkylation with 15 mM iodoacetamide at 50 °C for 30 min in the dark. Samples were processed using the single-pot solid-phase enhanced sample preparation (SP3) [
10,
11]. In short, protein purification, digestion and peptide clean-up were performed using a KingFisher Flex System (Thermo Fisher Scientific) and carboxylate-modified magnetic particles (GE Life Sciences; GE65152105050250, GE45152105050250) after the manufacturer’s instructions. Resulting digest solution and water elution were combined, dried and re-solubilized in 15 µL of MS sample buffer (3% acetonitrile, 0.1% formic acid).
2.6. LC-MS/MS Data Acquisition
Mass spectrometry analysis was carried out using a Q Exactive HF mass spectrometer (Thermo Scientific) equipped with a Digital PicoView source (Waltham, MA, USA) and coupled to a M-Class UPLC (Waters, Milford, MA, USA). Composition of the solvent at the two channels was 0.1% formic acid (channel A) and 0.1% formic acid, 99.9% acetonitrile (channel B). Column temperature was set to 50 °C. For each sample, a total volume of 2 μL was loaded on the ACQUITY UPLC M-Class Symmetry C18 Trap Column (100 Å, 5 µm, 180 µm × 20 mm, Waters) followed by ACQUITY UPLC M-Class HSS T3 Column (100 Å, 1.8 µm, 75 µm × 250 mm, Waters). Peptide elution was performed at a flow rate of 300 nL/min. After a 3 min initial hold at 5% B, a gradient from 5 to 24% B in 80 min and 24 to 36% B in an additional 10 min was applied. The column was cleaned after the run by increasing to 95% B and holding 95% B for 10 min prior to re-establishing loading conditions. Samples were measured in randomized order. The mass spectrometer was operated in data-dependent mode (DDA) on the 12 most abundant ions using Xcalibur (tune version 2.9), with spray voltage set to 2.3 kV, funnel RF level at 60% and heated capillary temperature at 275 °C. Full-scan MS spectra (350−1500
m/z) were acquired at a resolution of 120,000 at 200
m/z after accumulation to an automated gain control (AGC) target value of 100,000 or for a maximum injection time of 50 ms. Precursors with an intensity above 4500 were selected for MS/MS. Ions were isolated using a quadrupole mass filter with 1.2
m/z isolation window and fragmented by higher-energy collisional dissociation (HCD) using a normalized collision energy of 28%. MS2 spectra were recorded at a resolution of 35,000 and a maximum injection time of 54 ms. Charge state screening was enabled, and singly, unassigned charge states and charge states higher than seven were excluded. Precursor masses previously selected for MS/MS measurement were excluded from further selection for 30 s, applying a mass tolerance of 10 ppm. The samples were acquired using internal lock mass calibration on
m/z 371.1012 and 445.1200. The mass spectrometry data were handled using the local laboratory information management system (LIMS) [
12].
2.7. LC-MS/MS Data Analysis
Raw MS data were processed using MaxQuant (version 1.6.2.3), and proteins were identified by an integrated Andromeda search engine [
13]. Spectra were searched against the Uniprot Homo sapiens reference proteome (taxonomy 9606, canonical version from 9 July 2019), where carbamidomethylation of cysteine was set as fixed modification and methionine oxidation and N-terminal protein acetylation were set as variable. Enzyme specificity was selected to trypsin/P with a minimal peptide length of 7 amino acids and a maximum of two missed cleavages. MaxQuant Orbitrap default search settings were applied. The maximum false discovery rate (FDR) was fixed at 0.01 and 0.05 for peptides and proteins, respectively. Label-free quantification was run and a 2 min window for match between the runs was employed. Individual quantitative values were obtained by the MaxQuant quantitative proteomics software package. Protein fold changes were calculated using the Intensity values from the proteinGroups.txt file. A set of functions in the R package SRMService [
14] was applied for selecting proteins with 2 or more peptides, data normalization and calculation of
p-values (the
t-test with pooled variance was used). Pseudo fold change was calculated replacing the missing group average by the mean of 10% smallest protein intensities if all measurements of a protein were missing in one of the conditions.
The mass spectrometry proteomics data are deposited to the ProteomeXchange Consortium via the PRIDE [
15] partner repository with the dataset identifier PXD039766.
2.8. Bioinformatics Analyses
Gene Ontology (GO) enrichment analysis using the DAVID functional annotation tool (
https://david.ncifcrf.gov/ accessed on 15 December 2022) [
16,
17,
18,
19] was used to elucidate the biological functions of identified proteins, where enriched GO terms with
p < 0.05 were considered statistically significant.
The Search Tool for Retrieval of Interacting Genes (STRING) (
http://string-db.org/ accessed on 15 December 2022) [
20] online tool was applied to construct the PPI network, where the confidence score was set to 0.900 (highest confidence). The PPI network was visualized by Cytoscape (
https://cytoscape.org/ accessed on 15 December 2022) [
21], an open-source software platform for visualizing complex networks. Each node corresponds to a protein, whereas the edges represent the interactions between proteins that contribute to the same biochemical function or pathway. In order to analyze and select significant modules of the PPI network, the Molecular Complex Detection (MCODE) [
22] plugin of Cytoscape was employed. To further identify the hub proteins in selected significant modules (clusters), we used Cytohubba [
23], a Cytoscape plugin.
In silico evaluation of selected candidate proteins at the mRNA and protein level was conducted using the Cancer Genome Atlas (TCGA) dataset (Colorectal Adenocarcinoma, TCGA, PanCancer Atlas) and the Clinical Proteomic Tumor Analysis Consortium (CPTAC) data, respectively, provided by the cBioPortal for Cancer Genomics (
https://www.cbioportal.org/ accessed on 15 December 2022) [
24,
25]. The total expression of selected proteins in colon cancer was analyzed based on tumor histology using data from the Clinical Proteomic Tumor Analysis Consortium (CPTAC) and the International Cancer Proteogenome Consortium (ICPC) datasets by the means of UALCAN (
http://ualcan.path.uab.edu/index.html accessed on 15 December 2022) [
26].
4. Discussion
In the present study, we screened the alterations in the secretome profiles of vemurafenib-sensitive vs. vemurafenib-resistant RKO colon cancer cells carrying BRAFV600E mutation. Although a similar study has already been conducted in BRAFV600E human melanoma cells [
30], there are no literature data available on the secretory features concurrent with the development of resistance to BRAFV600E inhibitors in colon cancer. The methodological approach we employed here was based on combining two complementary proteomics platforms including 2-DE/MALDI TOF/TOF MS and LC-MS/MS, which ensured increased proteome coverage and bypassed the limitations inherent to each individual analytical approach. Obtained proteomics datasets were subjected to bioinformatics analyses followed by in silico evaluation of selected up- and down-regulated proteins using the public cancer data repository The Cancer Genome Atlas (TCGA) to examine their expression status specifically in colon cancer patients with BRAFV600E mutation. Such an approach enabled the identification of several promising protein candidates which require further functional and clinical validation to assess their translational value. Biological and cellular functions of these proteins pertinent to the studied cell model will be briefly discussed below.
One of the most relevant upregulated secretome features associated with vemurafenib resistance in BRAF-mutated RKO colon cancer cells identified in this study included DNA replication and repair, where all highly scored hub proteins from the upregulated PPI network play an essential role. Although localized to the nucleus, these proteins were detected in the secretome of colon cancer cells in our study. This finding shows good congruence with a recent study which provided evidence that nuclear proteins regulating DNA replication and repair are enriched in the repertoire of unconventionally secreted proteins from different types of cancer cells [
29]. A previous study in breast cancer cells suggested that several nuclear proteins were secreted through exosomes, one of the best characterized routes of non-classical secretory pathways [
27], which could also, at least partially, explain why we were able to detect nuclear proteins in cancer cell secretomes. Another explanation why nuclear proteins can be found in cancer cell line secretomes could be provided by the previous findings demonstrating the ability of some secretome proteins classified as nuclear by gene ontology to change their cellular localization to the cytoplasm and extracellular space [
27,
29].
Previously, the role of DNA replication was demonstrated in the mechanisms governing the resistance of BRAFV600E-mutated colon cancer cells to the MEK inhibitor selumetinib [
31]. It was shown that acquisition of MEK inhibitor resistance arose through de novo BRAFV600E amplification resulting from DNA replication during prolonged selumetinib treatment [
31]. The same study also revealed that decreasing the frequency of DNA replication during selumetinib treatment suppressed the emergence of resistant clones. Given that MEK is a major downstream mediator of oncogenic BRAF in the MAPK signaling pathway, we cannot exclude the possibility that the same mechanism is involved in the development of resistance to BRAF inhibitor vemurafenib in RKO colon cancer cells harboring BRAFV600E mutation.
The DNA replication licensing system was found to be essential in the progression of cancer. Several DNA replication licensing factors including MCM2, MCM3, MCM5 and MCM6 were found to be significantly upregulated in the secretome from vemurafenib-resistant RKO cells in our study as well. Similarly, prolonged activity of MCM2 was shown to be associated with vemurafenib resistance in melanoma cells [
32]. A similar study on BRAFV600E inhibitor-addicted melanoma cells revealed downregulation of MCM2, MCM3 and MCM5 upon drug withdrawal in correlation with reduced cell viability ensuing from discontinued drug treatment [
33].
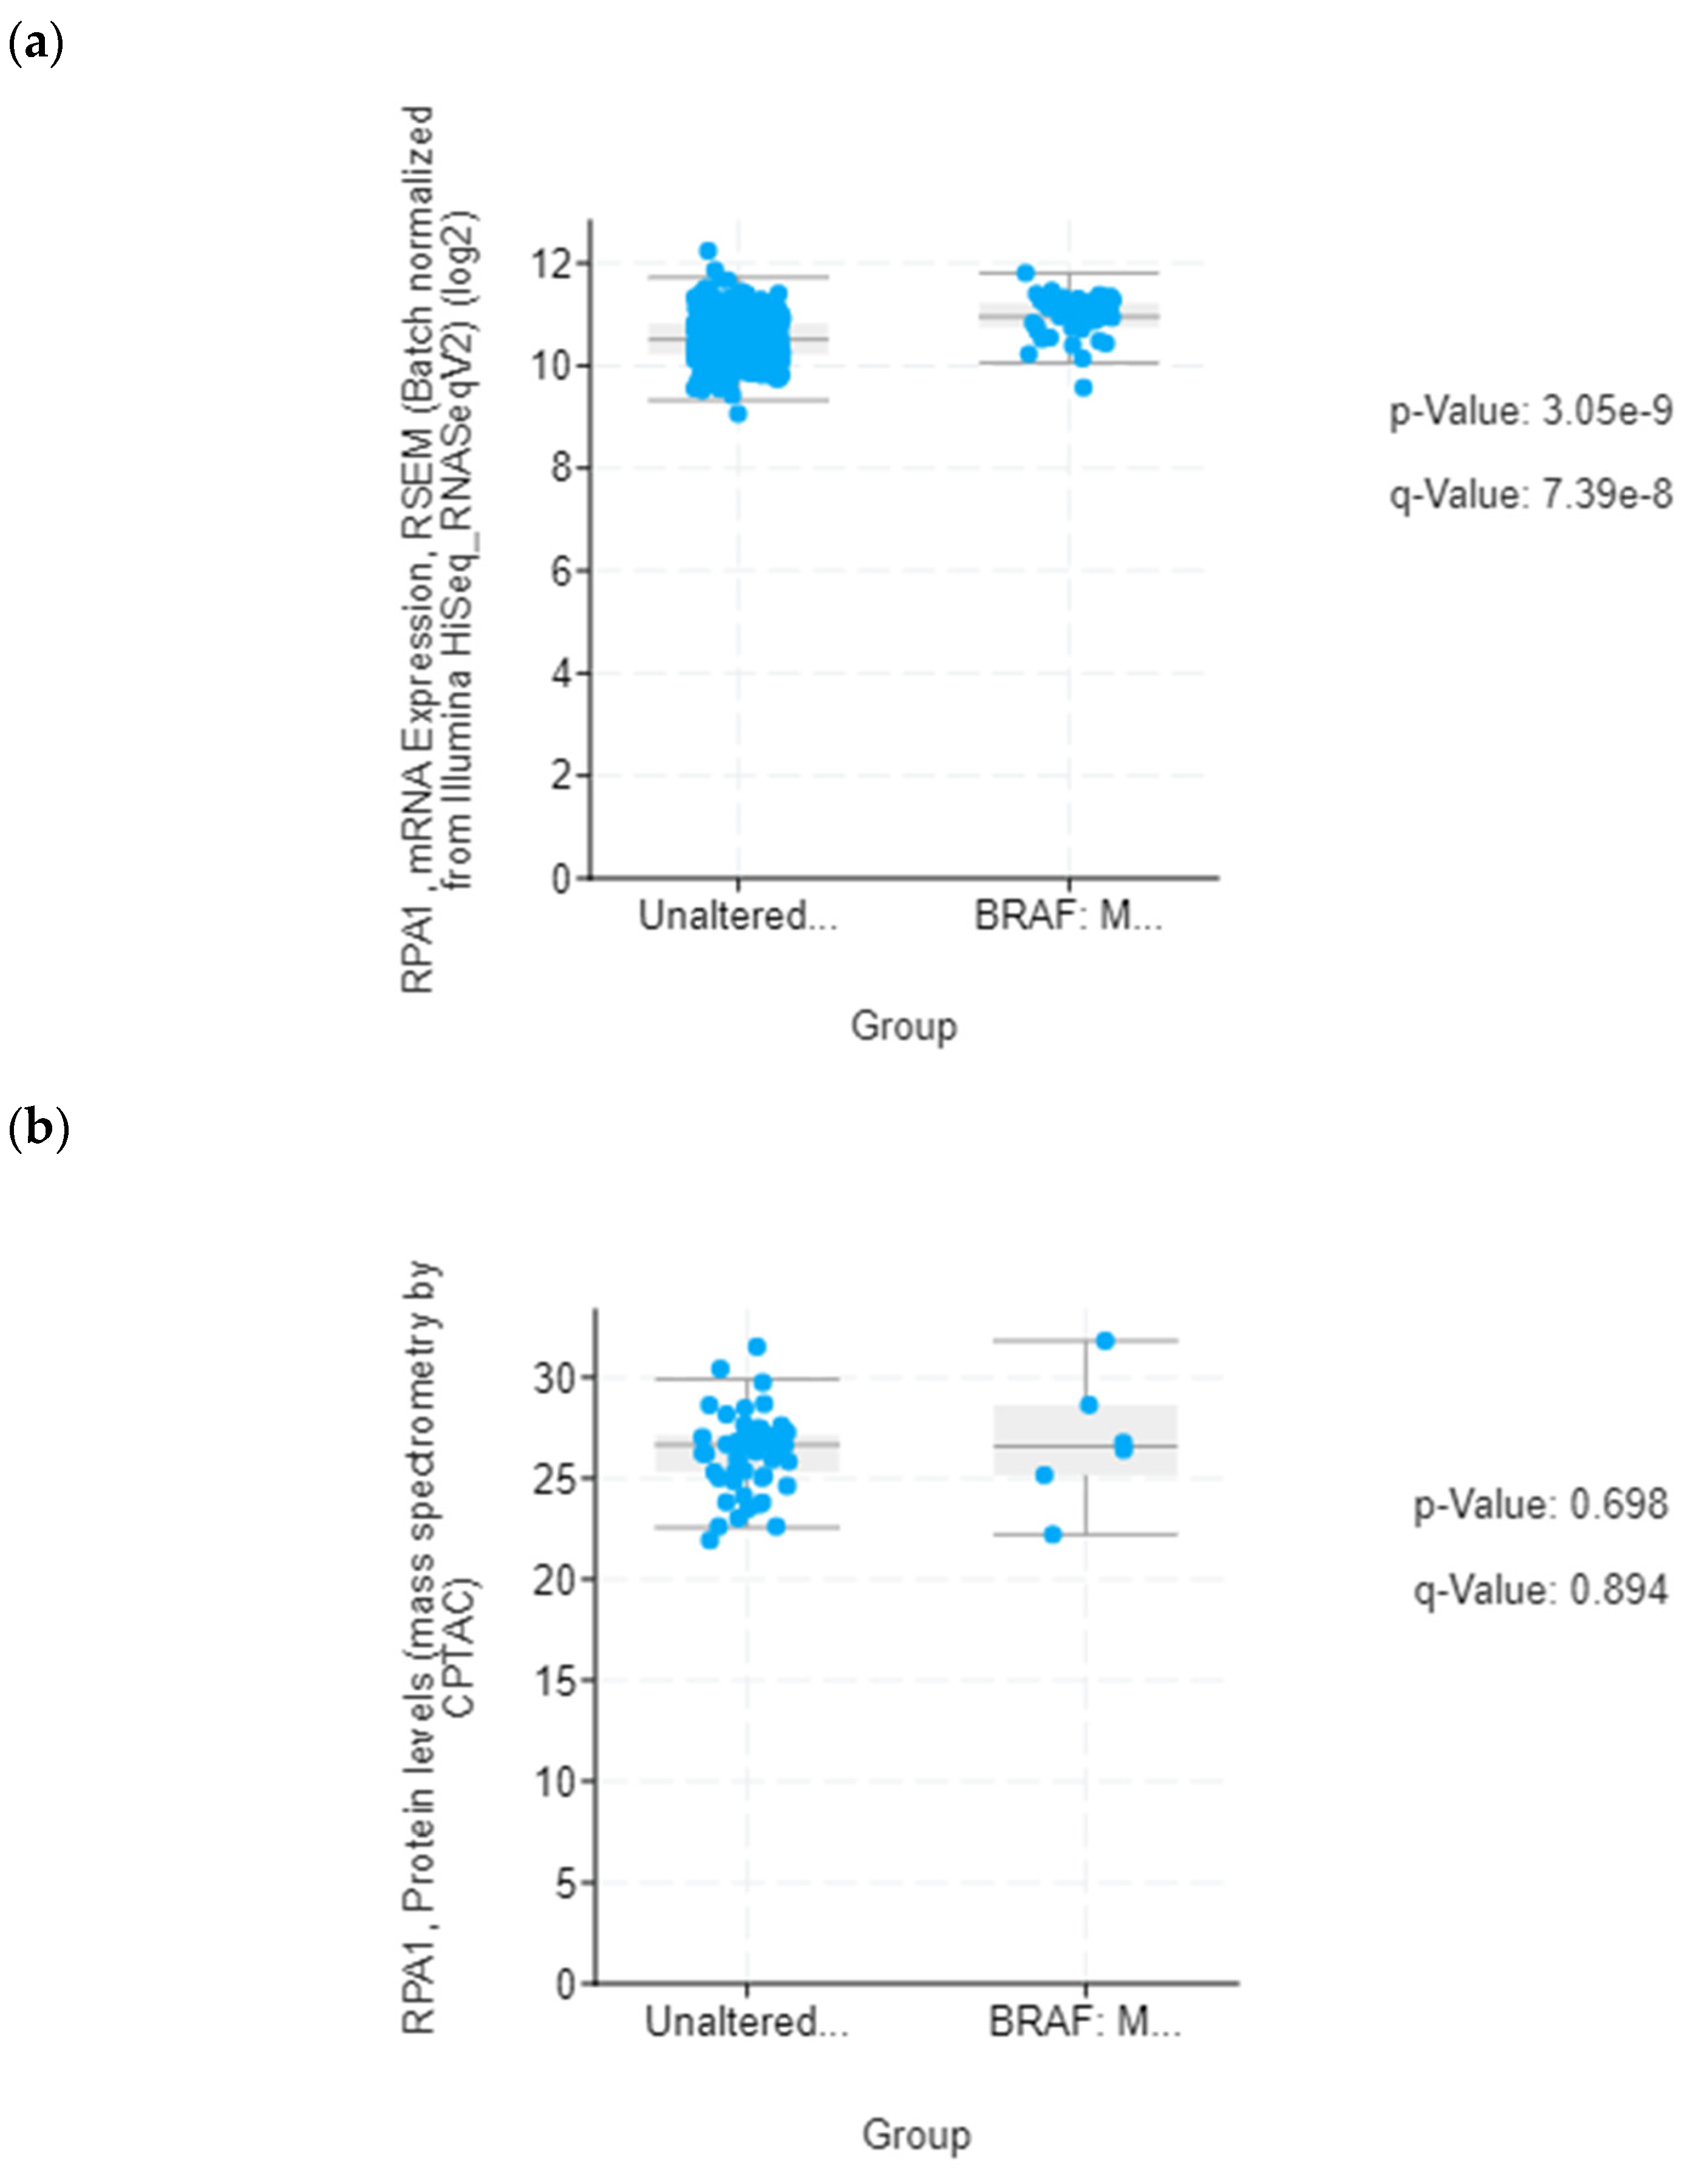
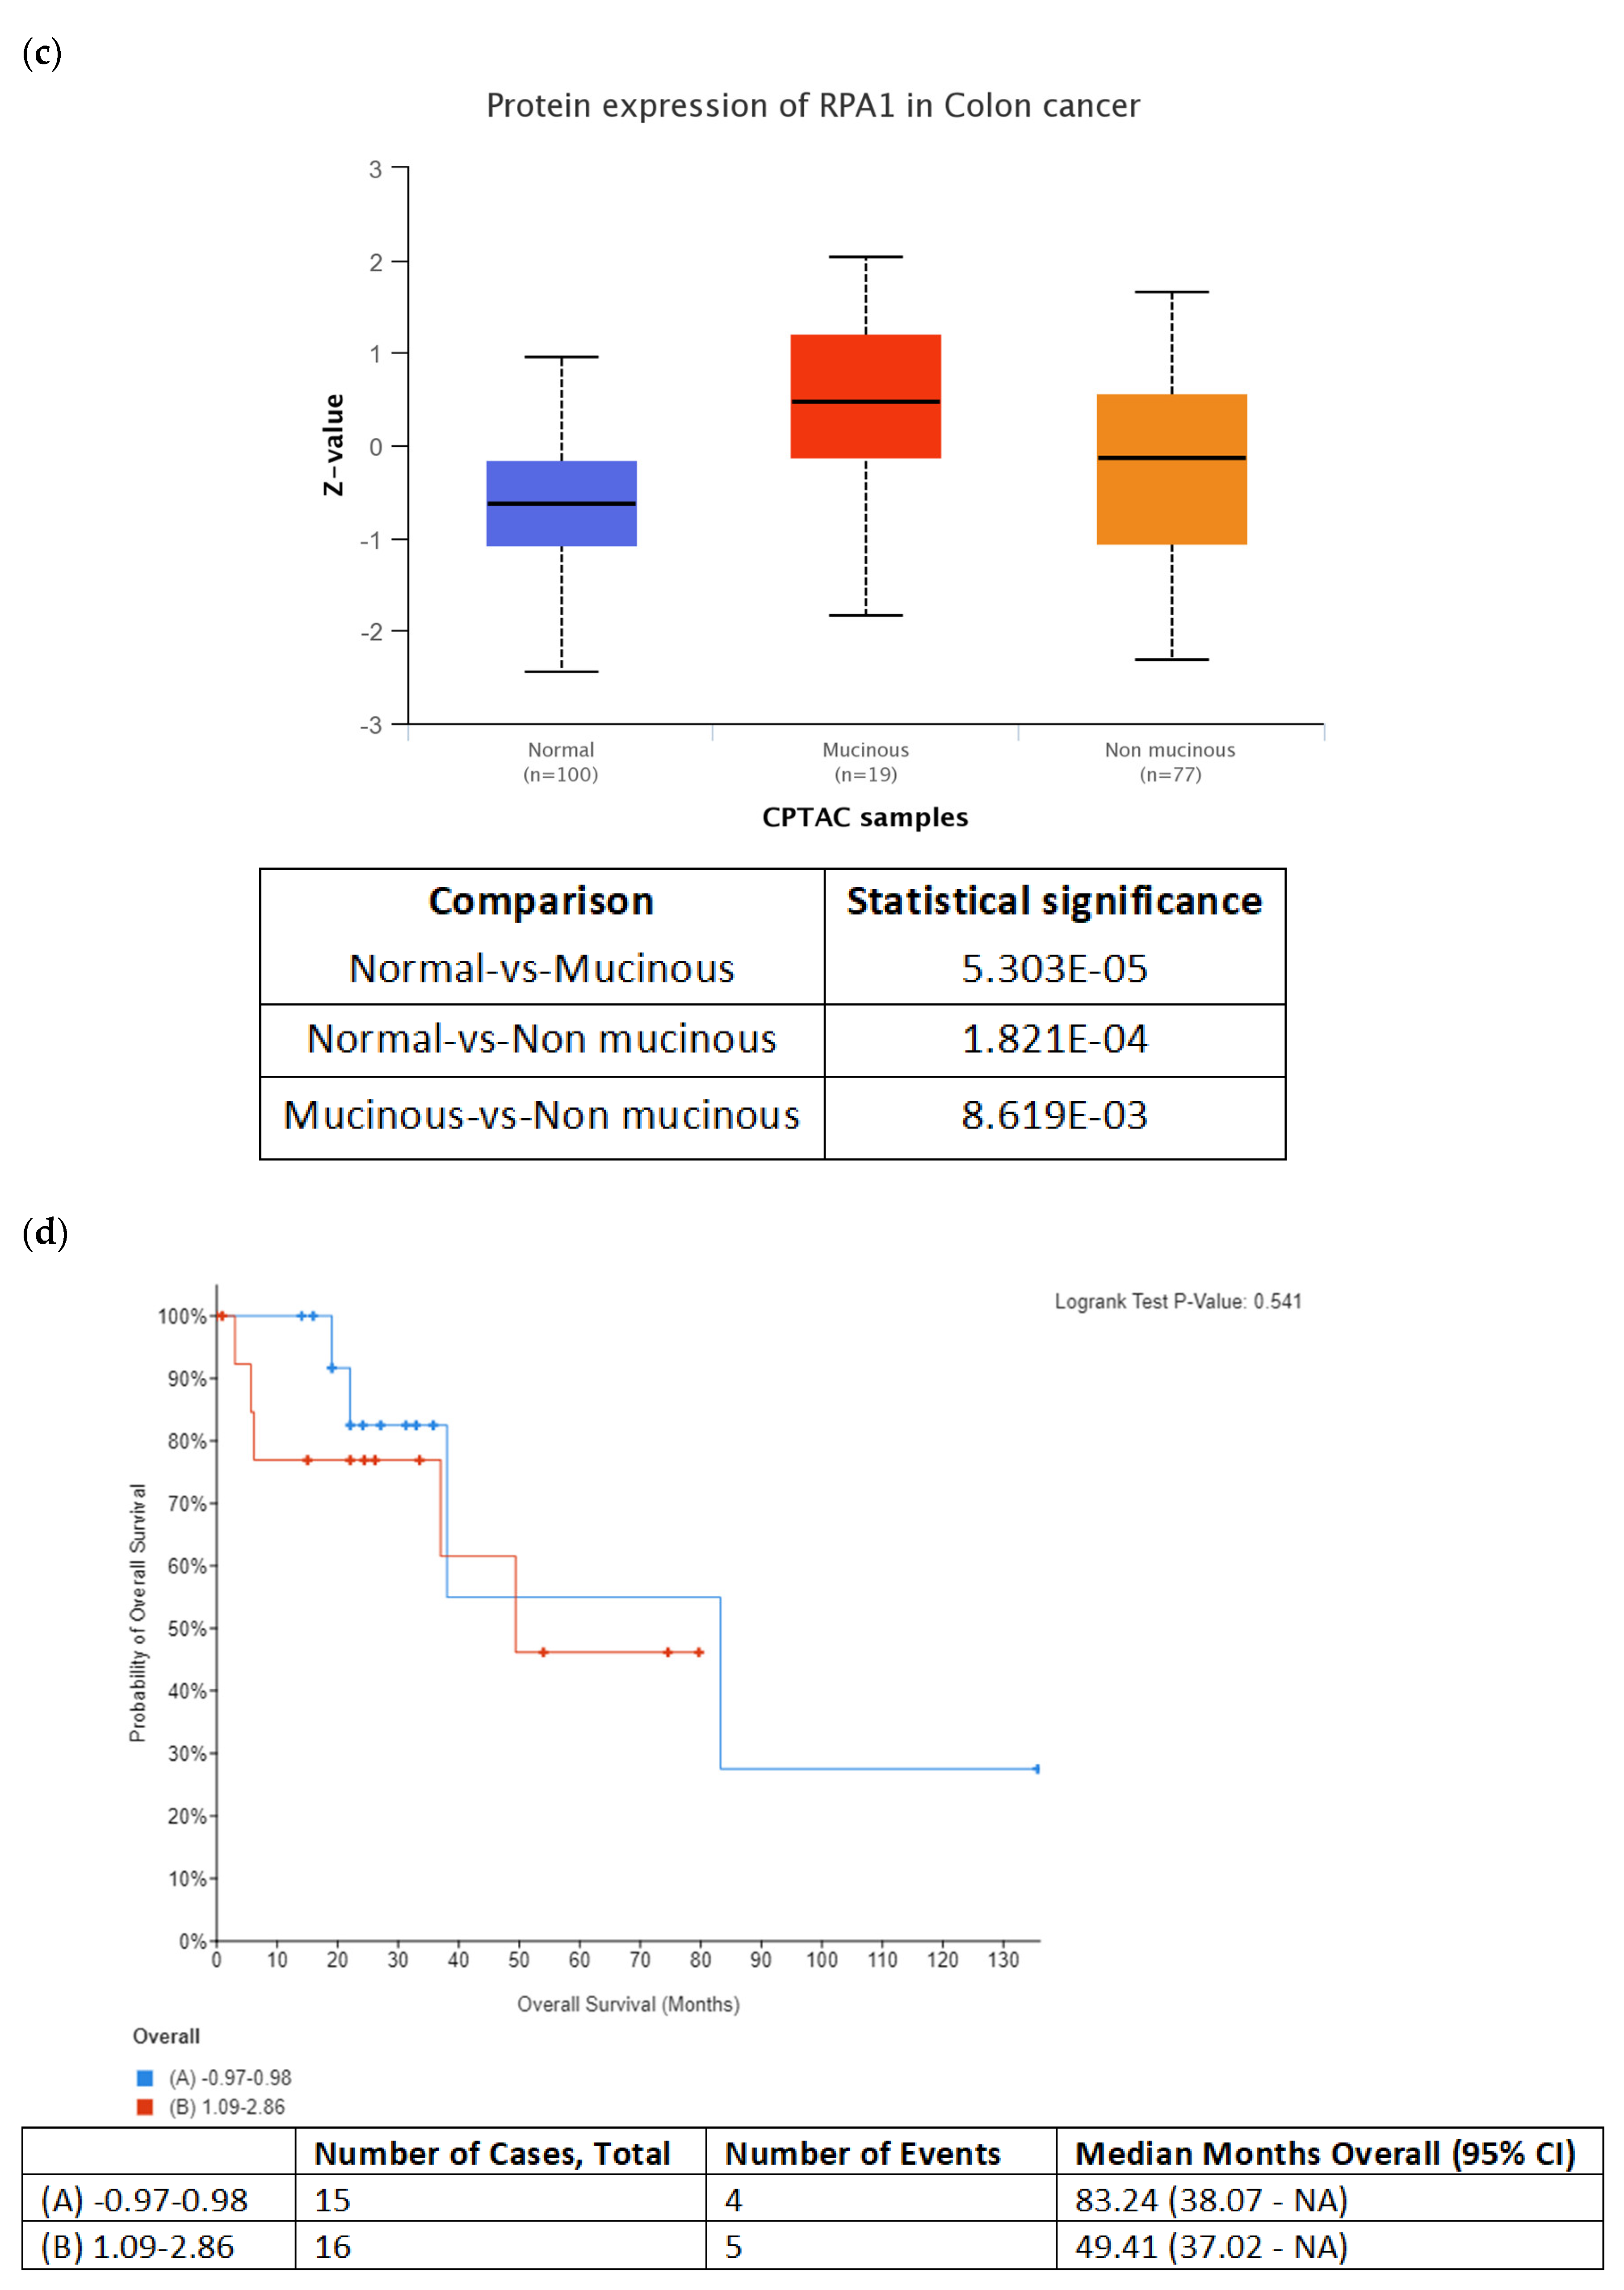
In addition to DNA replication licensing factors, several other proteins involved in the DNA replication process were also found to be increased in the secretome from resistant RKO cells, including FEN1, PCNA and RPA1. However, among all these proteins, RPA1 stands out as the most interesting candidate for future studies as increased RPA1 protein expression in tumor samples from the TCGA colon adenocarcinoma dataset was associated with BRAFV600E genotype and mucinous adenocarcinoma histology characteristic of BRAF mutation tumors. Importantly, our in silico analysis also showed that increased RPA1 expression at the gene level was correlated with poor survival outcomes in BRAFV600E-mutated patients with colon adenocarcinoma and mucinous adenocarcinoma of the colon. Similarly, it was previously reported that RPA1 protein may be used as a prognostic factor in colon cancer patients where increased expression of RPA1 protein was significantly associated with shorter overall survival [
34]. Since RPA1 has been shown to act as an oncogene during colorectal cancer development [
35], it could potentially serve as diagnostic indicator for colon cancer. Our data encourage further studies to explore the possibility of using circulating RPA1 in monitoring treatment response in BRAFV600E- mutated colon cancer.
In addition, a previous study on colon cancer cells has shown an association between the levels of RPA1 protein and DNA synthesis rate since the reduction in the in vitro DNA replication activity resulting from tirapazamine (TPZ)-induced inhibition of DNA synthesis was associated with a decrease in the protein level of RPA1 in cytoplasmic extracts of tirapazamine-treated cells [
36]. Moreover, the addition of recombinant RPA to the extracts of TPZ-treated cells was able to restore the DNA replication activity to control levels, which suggests that RPA1 mediates the effects of chemotherapeutic agents that inhibit DNA replication. Congruent with these findings, we postulate that increased protein levels of RPA1 detected in the secretome from resistant RKO cells could be potentially indicative of aberrant DNA replication that permits persistent proliferation of resistant cells under prolonged exposure to vemurafenib. Indeed, RPA1 has been previously shown to promote proliferation of colon cancer cells, since knockdown of
RPA1 substantially decreased the rate of cell proliferation, whereas overexpression of
RPA1 substantially raised the cell proliferation rate of colon cancer cells [
37]. Importantly,
RPA1 knockdown potentiated the anti-proliferative effect of oxaliplatin in colon cancer cells, which could be ascribed to inhibition of DNA synthesis evidenced by reduced number of cells in the S phase [
37]. Altogether, these findings posit that RPA1 could serve as a novel target for chemosensitization in colon cancer. This hypothesis has already been proven in BRAFV600E-mutated colon cancer by showing that knockdown of
RPA1 augments cytotoxic effects of 5-fluorouracil (5-FU) in BRAFV600E-mutated HT-29 colon cancer cells by significantly reducing the proliferative capability of cells measured by the colony formation assay and enhancing 5-FU-induced apoptosis [
35].
In addition to mediating the effects of chemotherapy, protein machinery involved in DNA replication plays an important role as downstream effectors of cytotoxic effects of radiation in BRAF-mutated colon cancer cells. For example, radiation induces a dose-dependent increase in the chromatin-bound RPA70 (Replication protein A 70 kDa DNA-binding subunit) protein content in RKO cells [
38]. Importantly, decreased level of the KIN17 protein implicated in DNA replication improves radiosensitivity in RKO cells. Thus, the concept based on interfering with the DNA replication proteins could prove beneficial to improving the effectiveness of chemotherapy in treating BRAFV600E-mutated colon cancer. In this context, targeting RPA1 may represent a novel and promising strategy to overcome resistance to BRAFV600E inhibition in colon cancer. This possibility should be additionally explored in future studies.
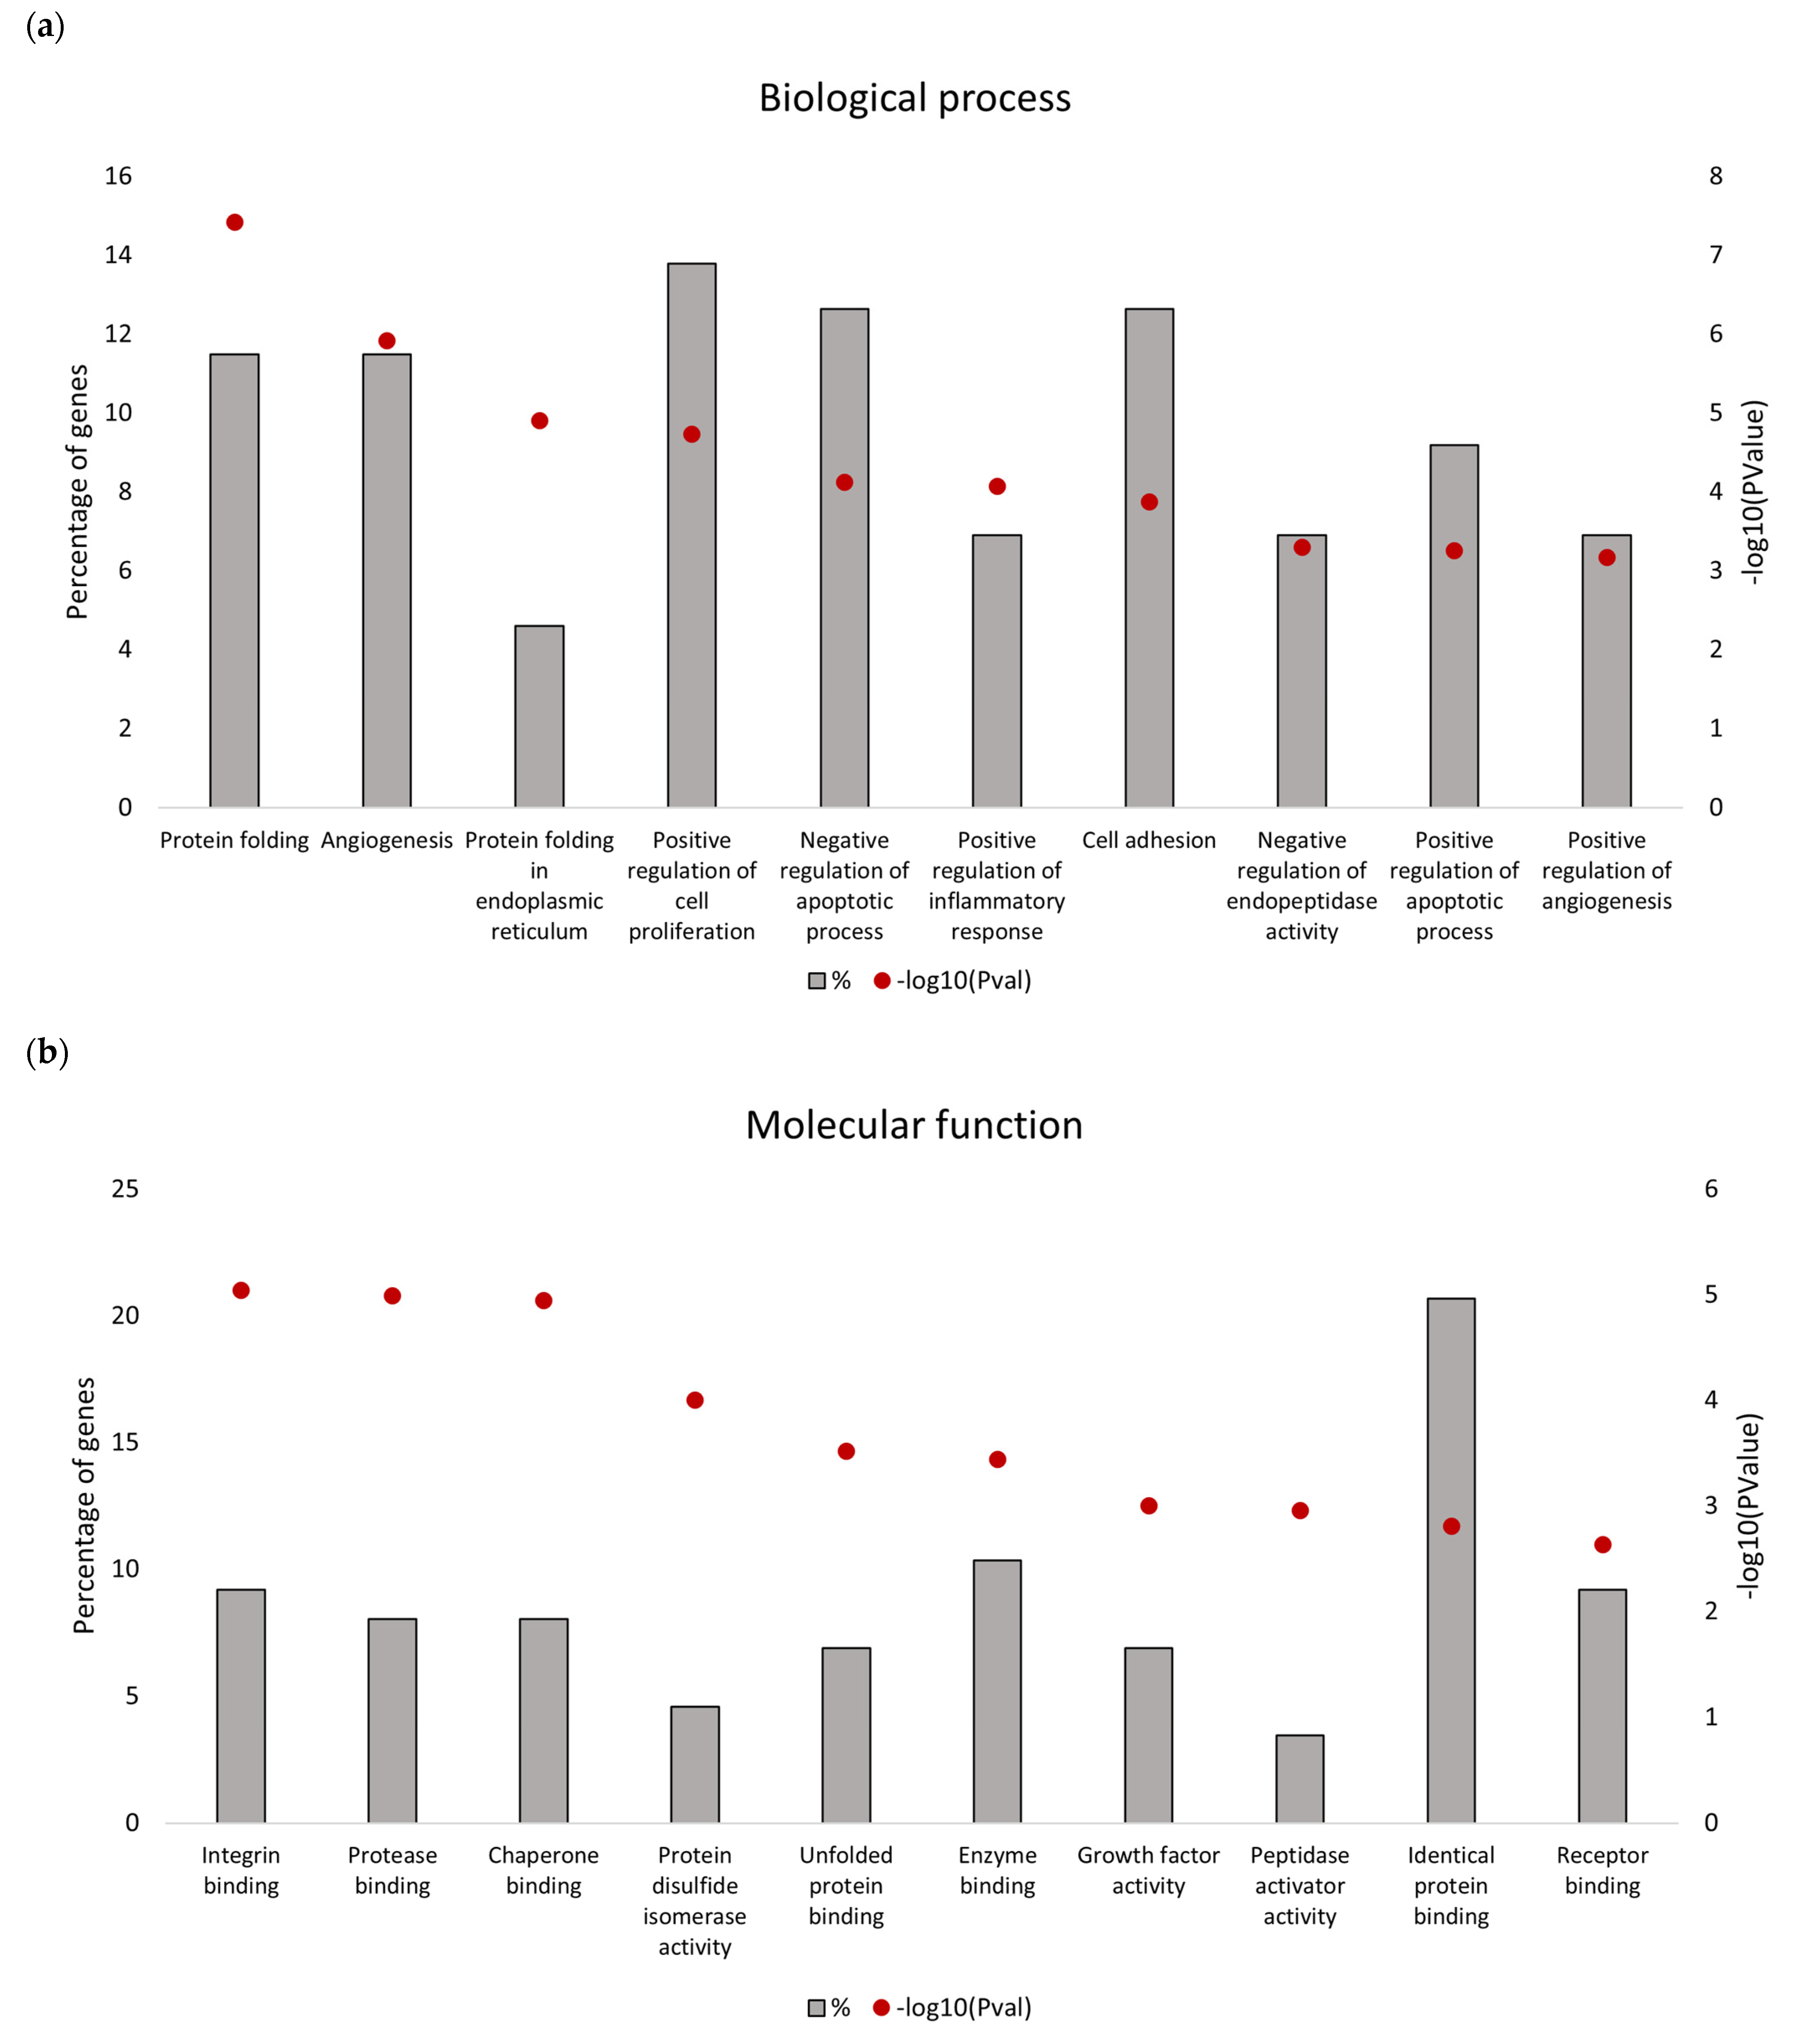
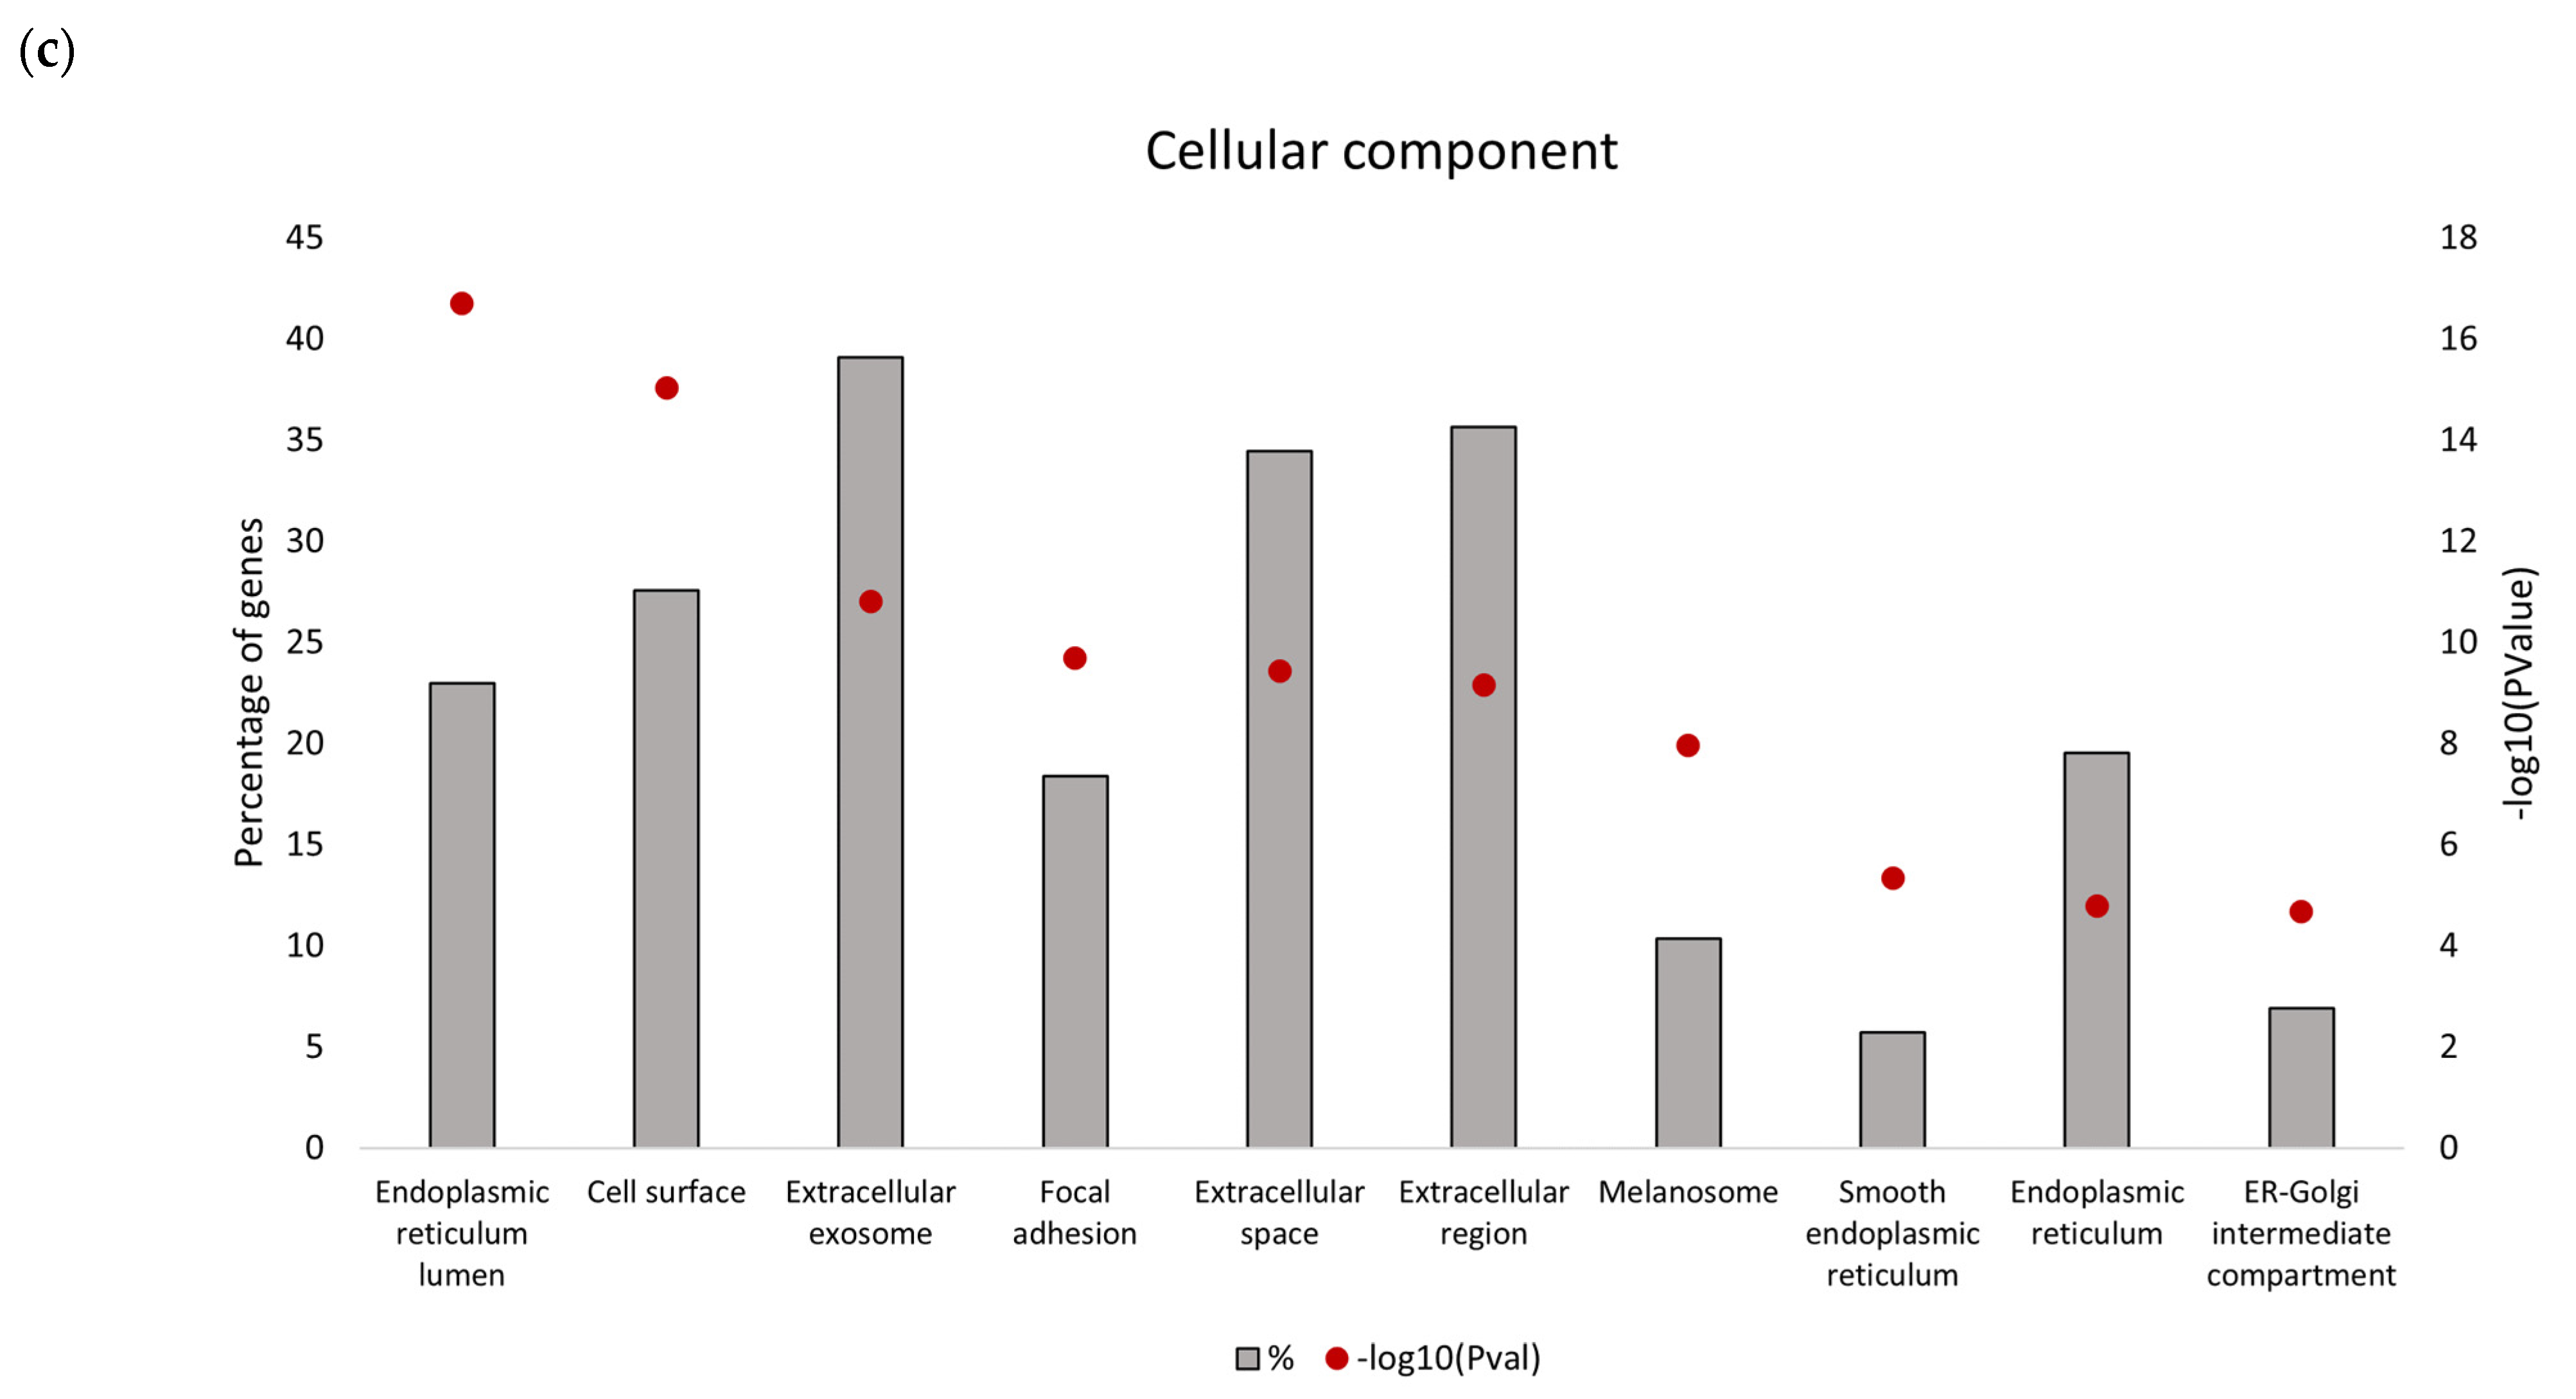
Downregulated proteins identified in the secretome from resistant RKO cells were mostly related to the endoplasmic reticulum (ER) function associated with protein folding and processing in the endoplasmic reticulum and the unfolded protein response (UPR). Bioinformatics analysis identified that the five most significant hub proteins in the downregulated dataset are involved in ER stress and the unfolded protein response (HSPA5/GRP78, HSP90B1, PDIA4 and CALR) and cell adhesion (ITGB1). Thus, aberrant regulation of the ER function could be associated with the BRAFV600E genotype in colon cancer. Indeed, previous findings have demonstrated that oncogenic BRAF induces chronic ER stress in BRAF-mutated colon cancer cells [
39]. In addition, the UPR was previously identified as a pathway significantly associated with the BRAF-mutated colorectal cancer subgroup with poor prognosis [
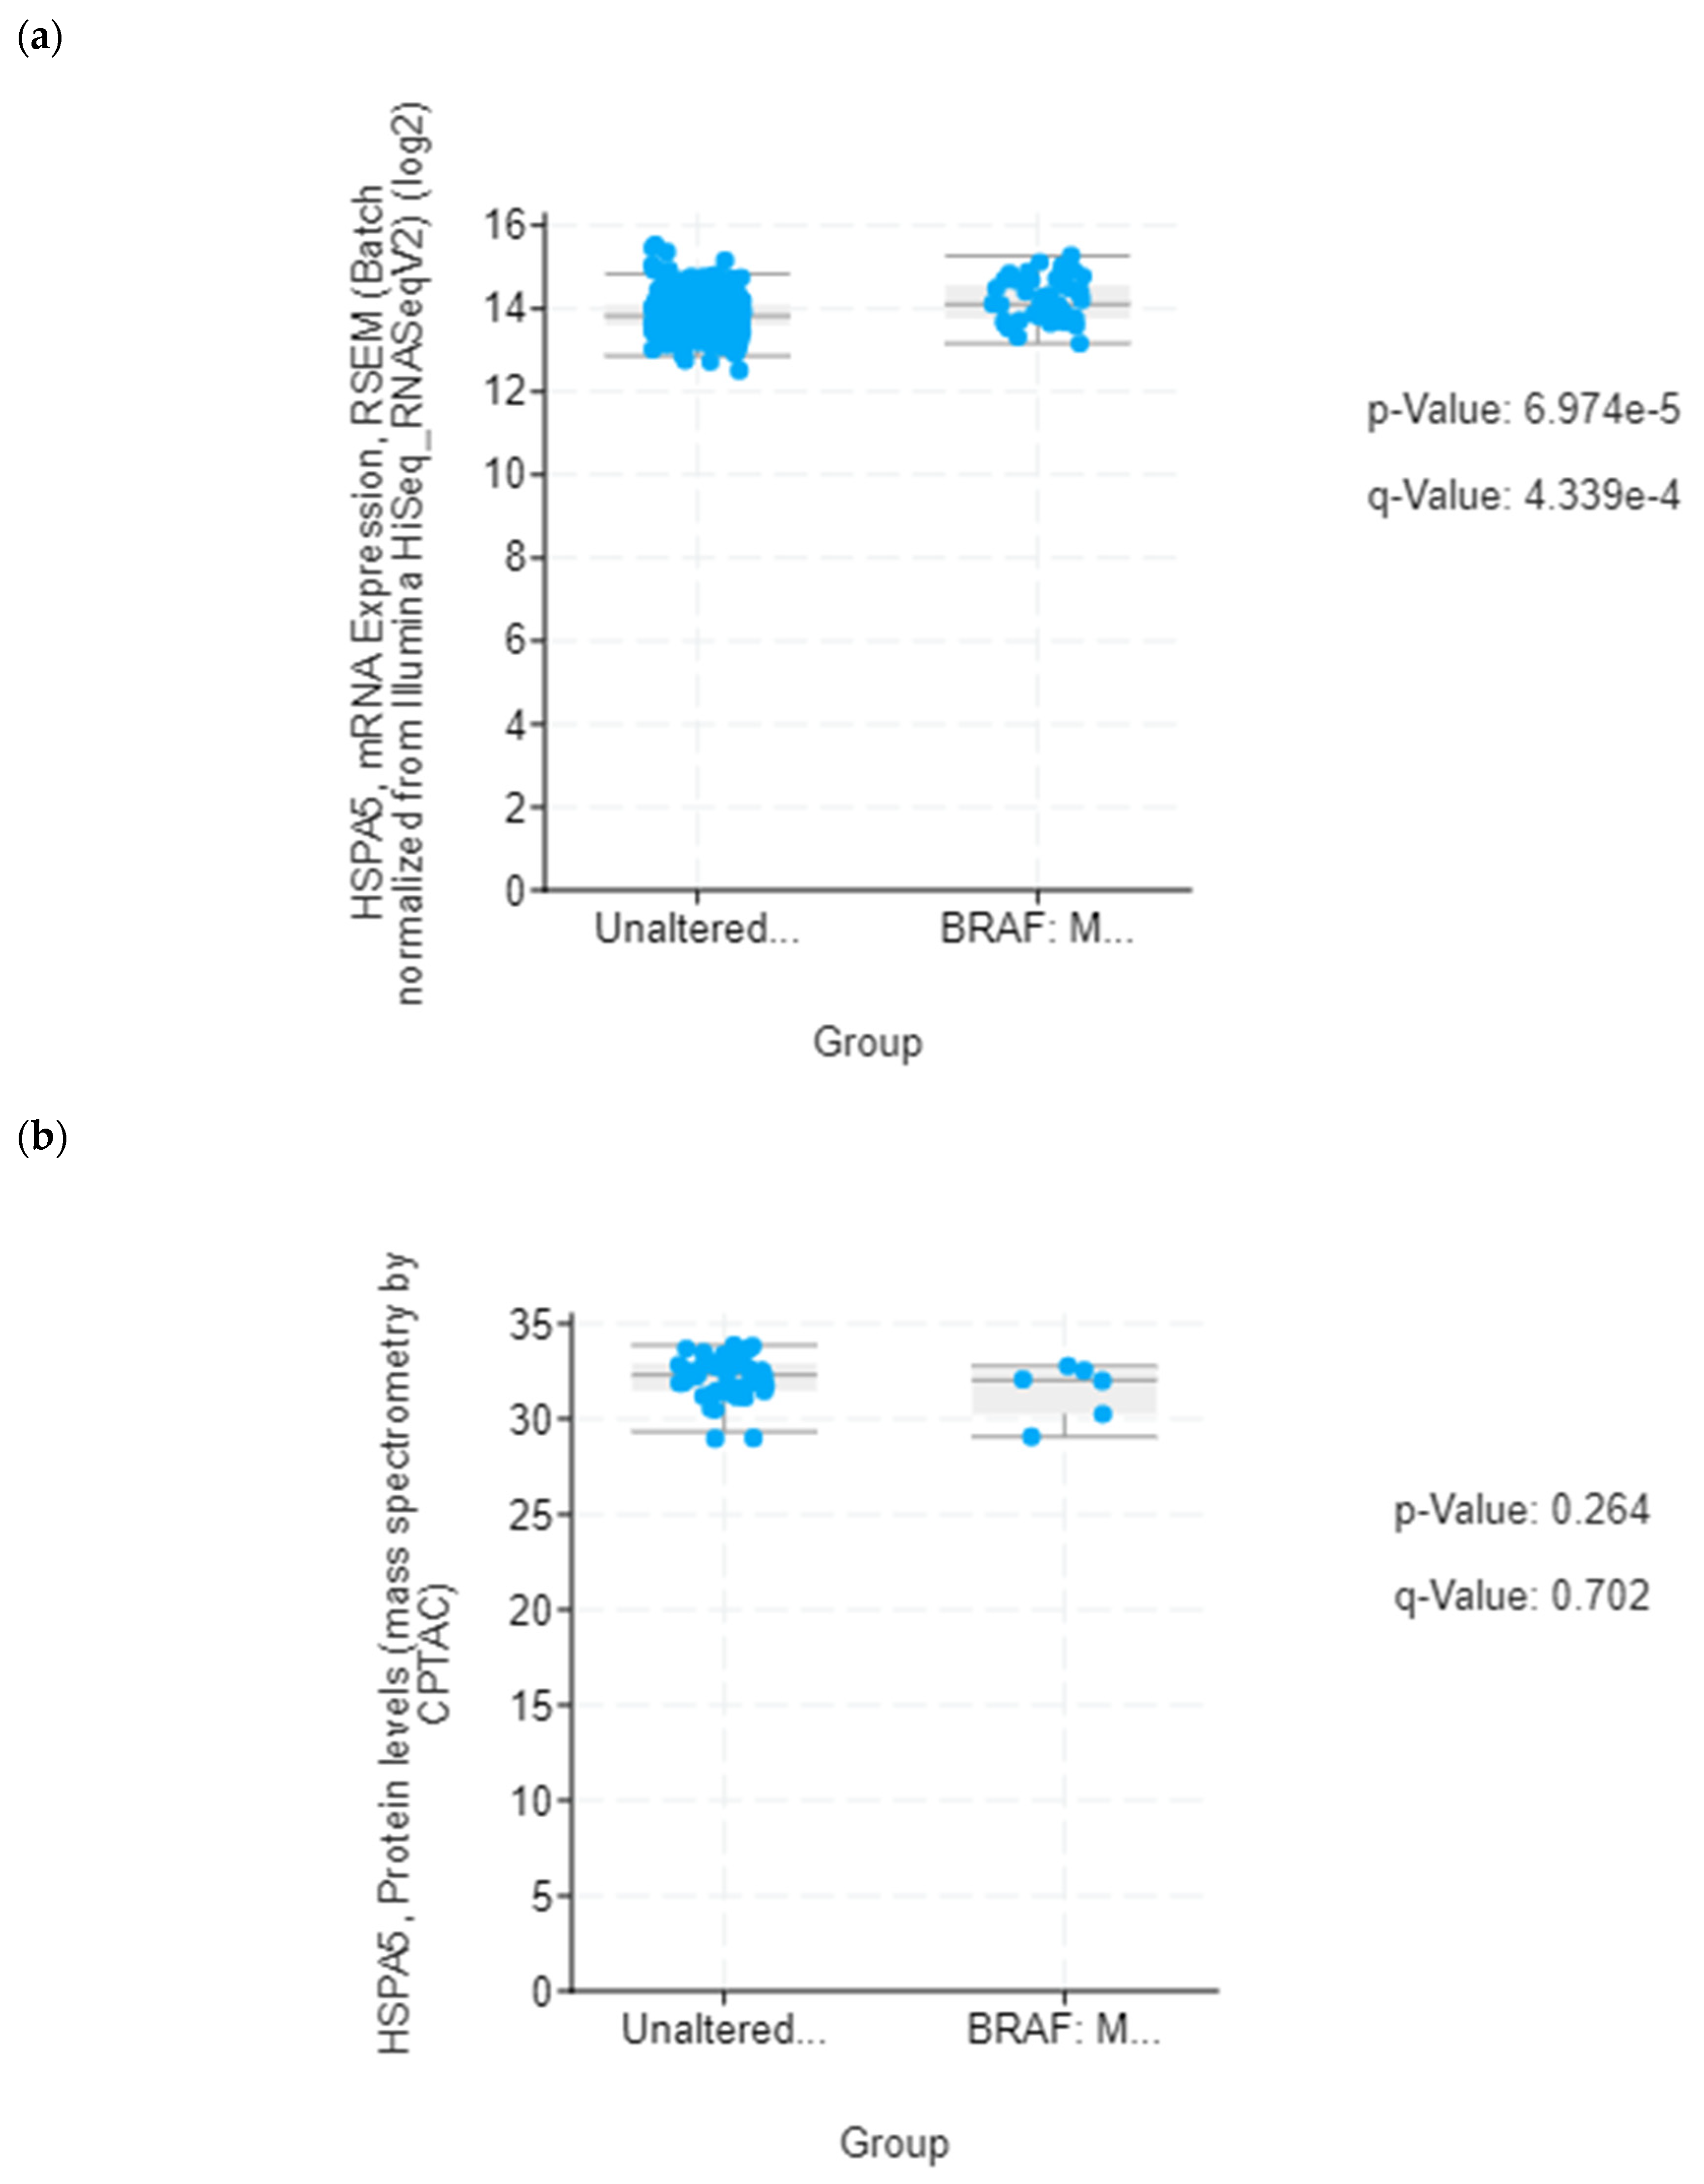
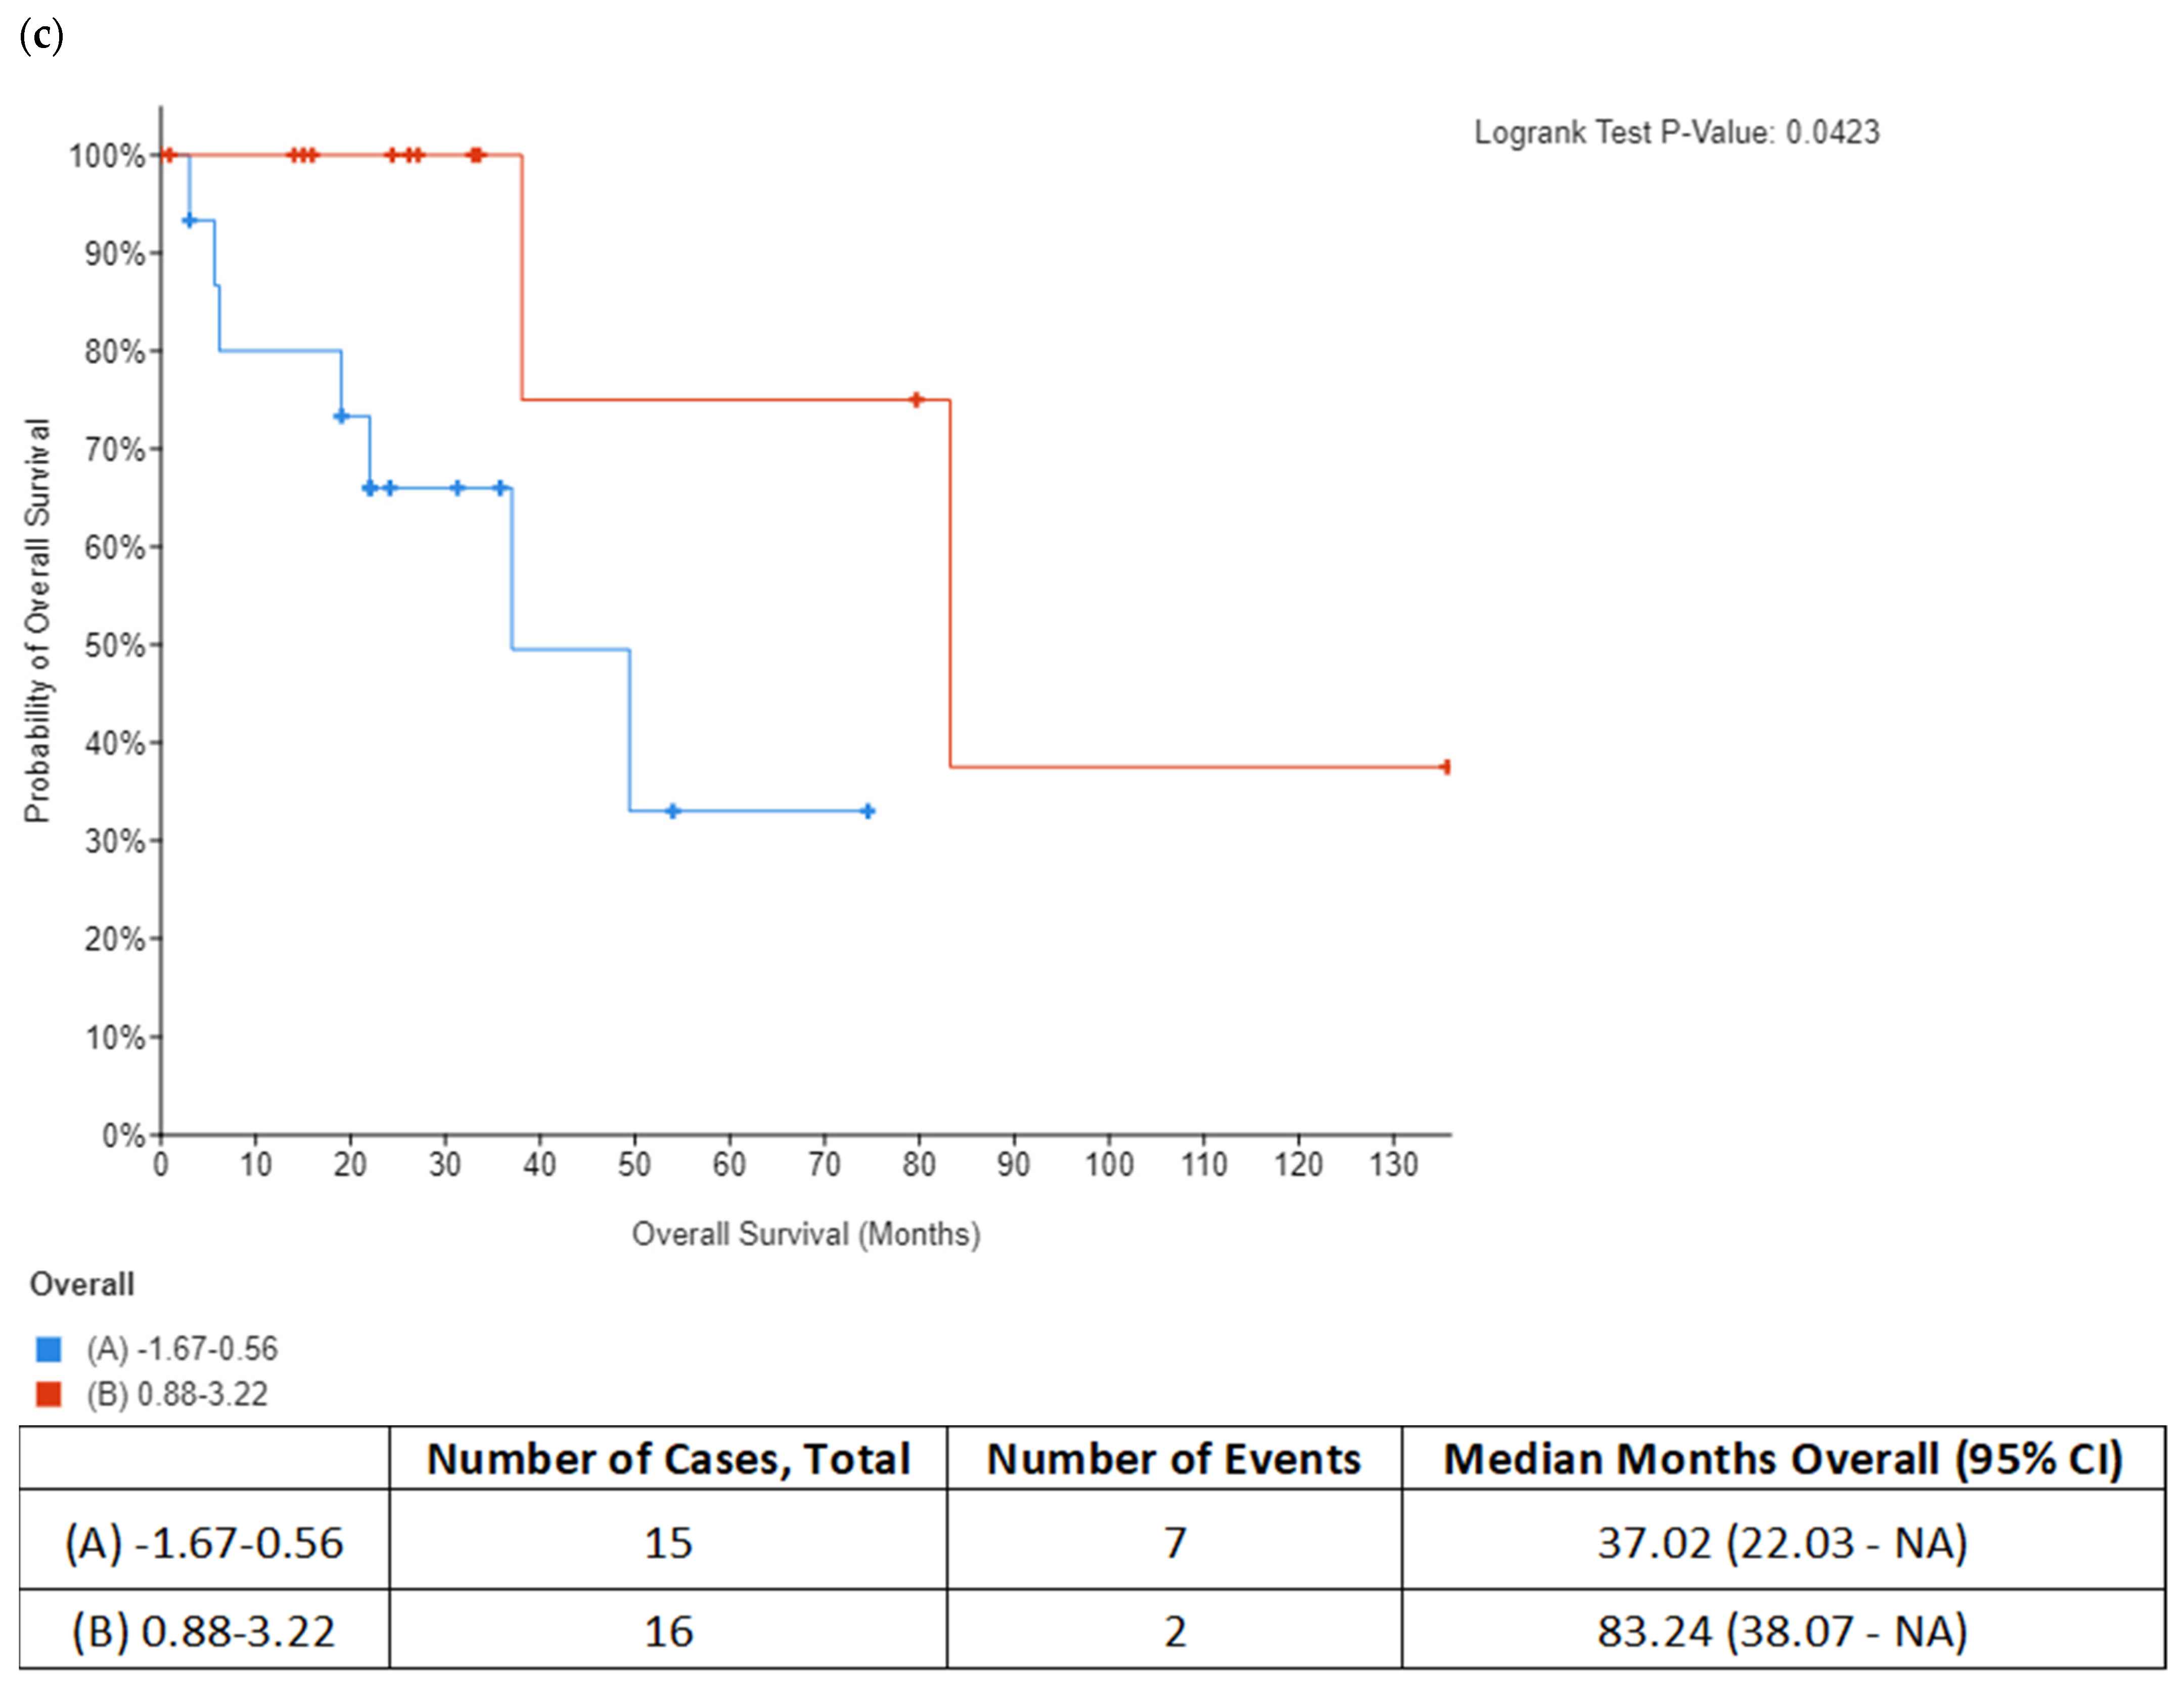
39]. Although lower mRNA expression levels of several UPR-related proteins identified in this study were found in association with poorer median overall survival of BRAF-mutated colon cancer patients, it was only for HSPA5/GRP78 that this correlation was statistically significant. Based on this in silico finding, we propose that reduced level of secreted HSPA5/GRP78 should be further investigated as a potential indicator of treatment outcomes in BRAF-mutated colon cancer.
HSPA5 or Glucose-Regulated Protein 78 kDa (GRP78) is a pivotal regulator of the unfolded protein response and the apoptotic machinery linked with the ER [
40]. HSPA5/GRP78 regulates the UPR by binding to and inactivating ER stress sensors under non-stressed conditions. When misfolded proteins accumulate in the ER leading to ER stress, HSPA5/GRP78 binds to misfolded proteins, releases the UPR sensors and triggers the UPR. Heijmans et al. [
41] reported that depletion or inactivation of HSPA5/GRP78 induced the UPR in LS174T colorectal cancer cells, and suggested that depletion of HSPA5/GRP78 can serve as a bona fide model to study ER stress signaling. Although HSPA5/GRP78 is mostly localized to the ER lumen, ER stress promotes the translocation of a subfraction of HSPA5/GRP78 to the cell surface and its secretion [
40]. Based on these studies, we hypothesize that decreased expression of HSPA5/GRP78 secreted in the conditioned medium from vemurafenib-resistant RKO cells could be indicative of activation of the UPR resulting from ER stress under long-term vemurafenib exposure. Previously, it was demonstrated that HSPA5/GRP78 inhibition evoked ER stress and apoptosis in a panel of BRAFV600E-mutated colon cancer cell lines [
39]. Similarly, downregulation of the HSPA5/GRP78 protein expression reduced the viability of BRAF mutant colon cancer cells [
39,
42], which indicates that BRAF-mutated colon cancer cells are dependent on the UPR for survival. Knowing that UPR activation resulting from continuous exposure to mild ER stress allows cell survival [
39,
42,
43], we propose that downregulation of HSPA5/GRP78 in resistant RKO cells could be a part of adaptive response to chronic stress induced by prolonged exposure to a low concentration (11.52 µM) of vemurafenib, conferring a growth advantage to resistant cells. Further studies are required to corroborate the involvement of ER stress and the UPR in the development of resistance to vemurafenib and to elucidate the role of circulating HSPA5/GRP78 in drug resistance mechanisms in BRAFV600E-mutated colon cancer.
In summary, increased level of secreted RPA1 protein was identified in this study as a prominent secretory feature of vemurafenib-resistant phenotype in BRAFV600E mutant colon cancer cells and detected in additional in silico analyses as a molecular trait of tumors from BRAFV600E-mutated colon cancer patients associated with unfavorable survival outcome. Thus, upregulation of secreted RPA1 protein could represent an important prognostic factor and a potential novel target for chemosensitization in BRAFV600E-mutated colon cancer. Likewise, down-regulation of secretory HSPA5/GRP78 protein emerged in our study as a significant feature associated with chemoresistant phenotype, which was also found in in silico analyses to be correlated with BRAFV600E genotype and poor survival rates in colon cancer patients. These findings warrant further validation in clinical samples, which are currently limited by a small number of metastatic colon cancer patients receiving therapy with BRAFV600E inhibitors in national clinical centers that could provide further clinical support to our findings due to the relatively low incidence of BRAFV600E mutation among the colon cancer patient population and high costs of the therapy. To address these challenges, multi-centric validation studies will be required.
Given that the mechanisms underlying primary resistance to BRAFV600E inhibitors in BRAF-mutated metastatic colon cancer are not fully elucidated due to heterogeneity in drug response derived from molecular heterogeneity of BRAFV600E-mutated colorectal cancers [
44] and knowing that no currently established biomarkers predict primary resistance to anti-BRAF therapy in colon cancer [
45], our findings could lay the groundwork for future studies to identify clinically relevant blood protein candidates with a predictive value that could guide the clinical management of colon cancer patients on anti-BRAF therapy. This is particularly important for patients with surgically unresectable disease and aggressive disease with metastases where tumor tissue is not readily available; circulatory markers, such as RPA1 and HSPA5/GRP78 proteins, may represent an informative tool to monitor the response to BRAF inhibitors and navigate clinical decision-making.


 and
and 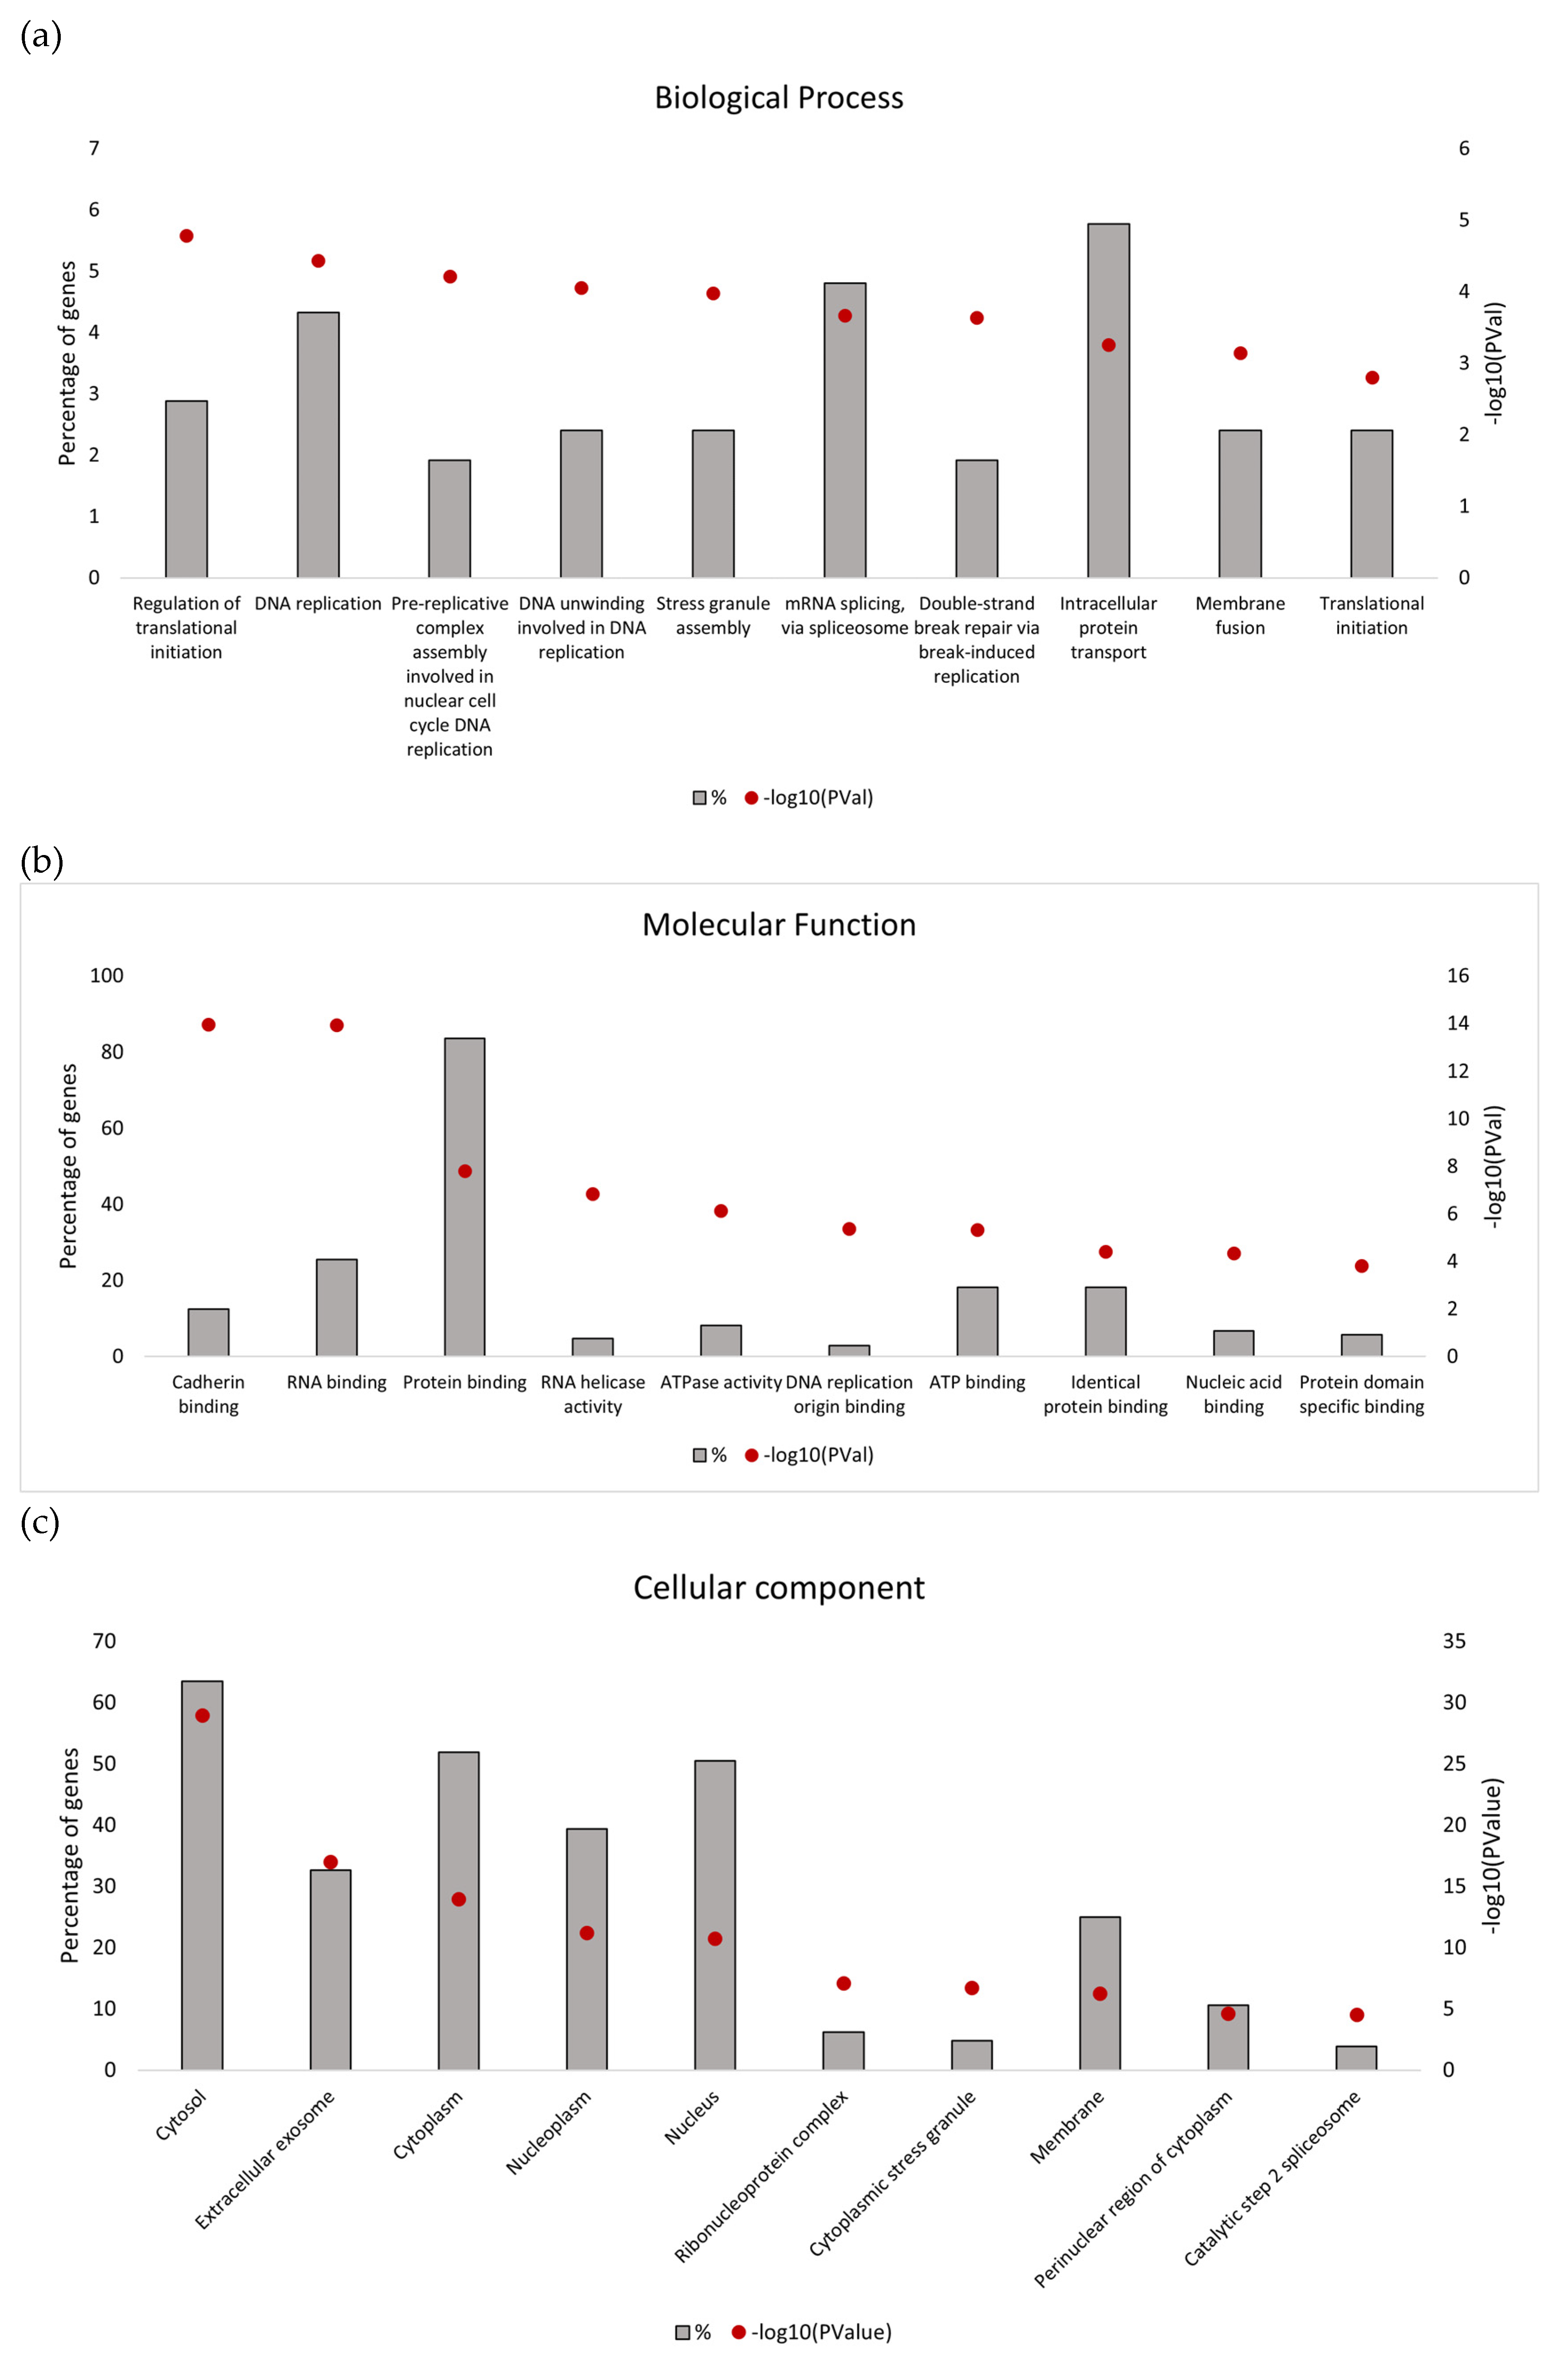


