


Error Size Shape Relationships between Motor Variability and Implicit Motor Adaptation

Abstract
Simple Summary
Abstract
1. Introduction
2. Materials and Methods
2.1. Participants
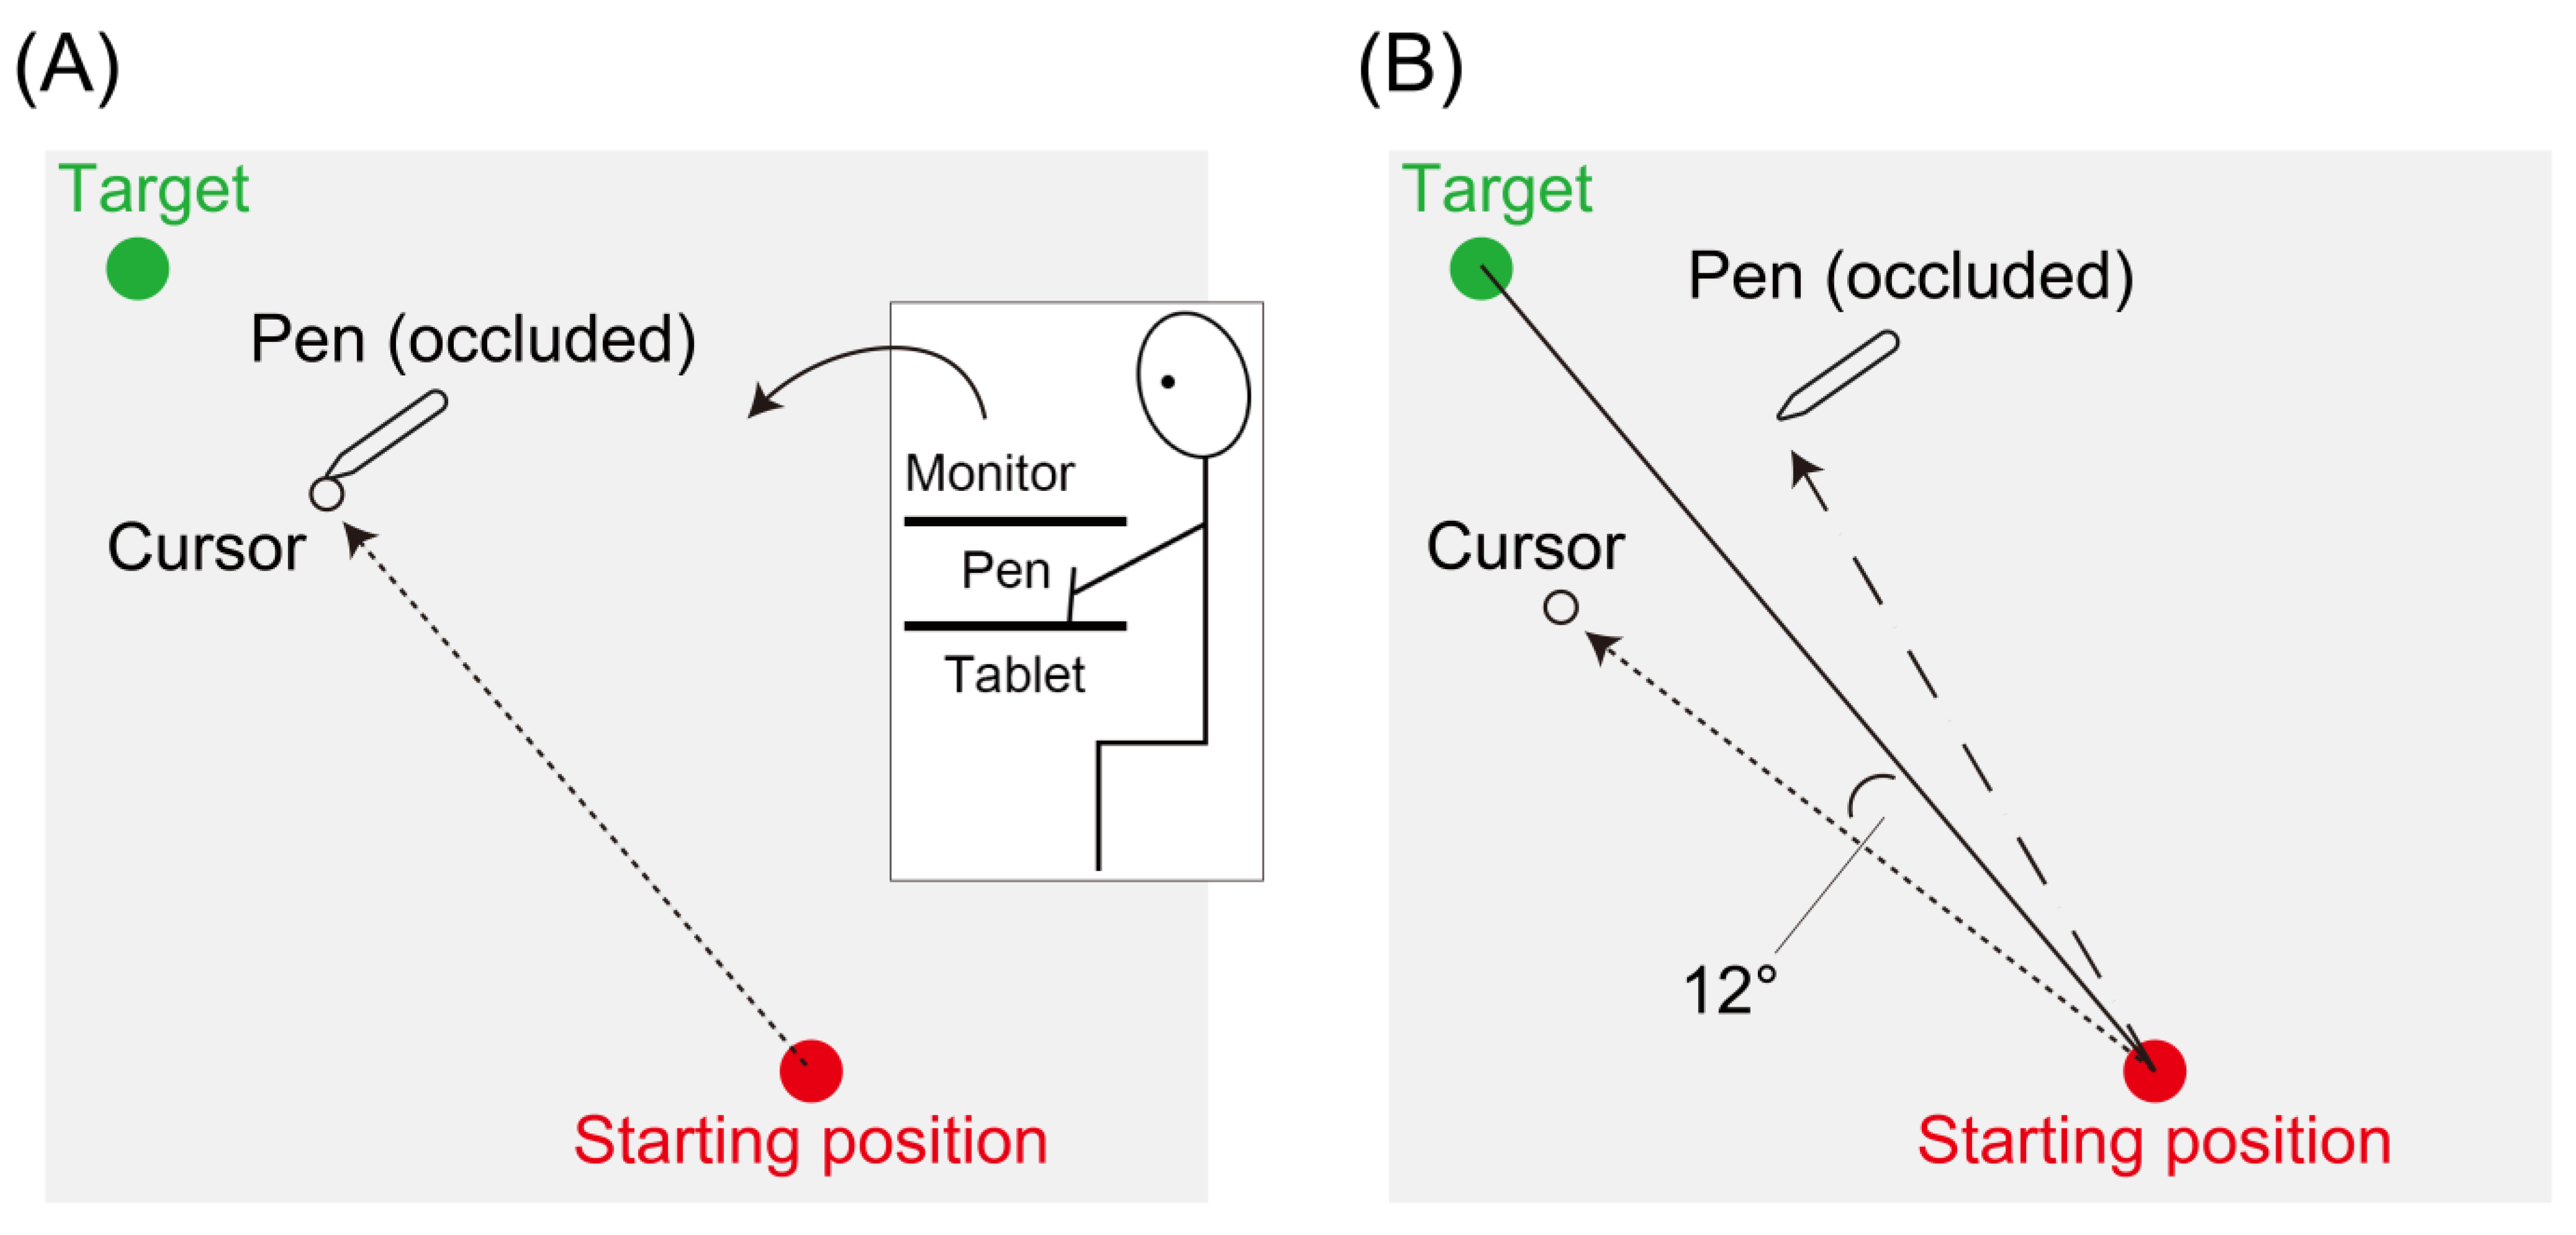
2.2. Experimental Task
2.3. Experimental Feedback
2.4. Experimental Protocol
2.5. Data Analysis
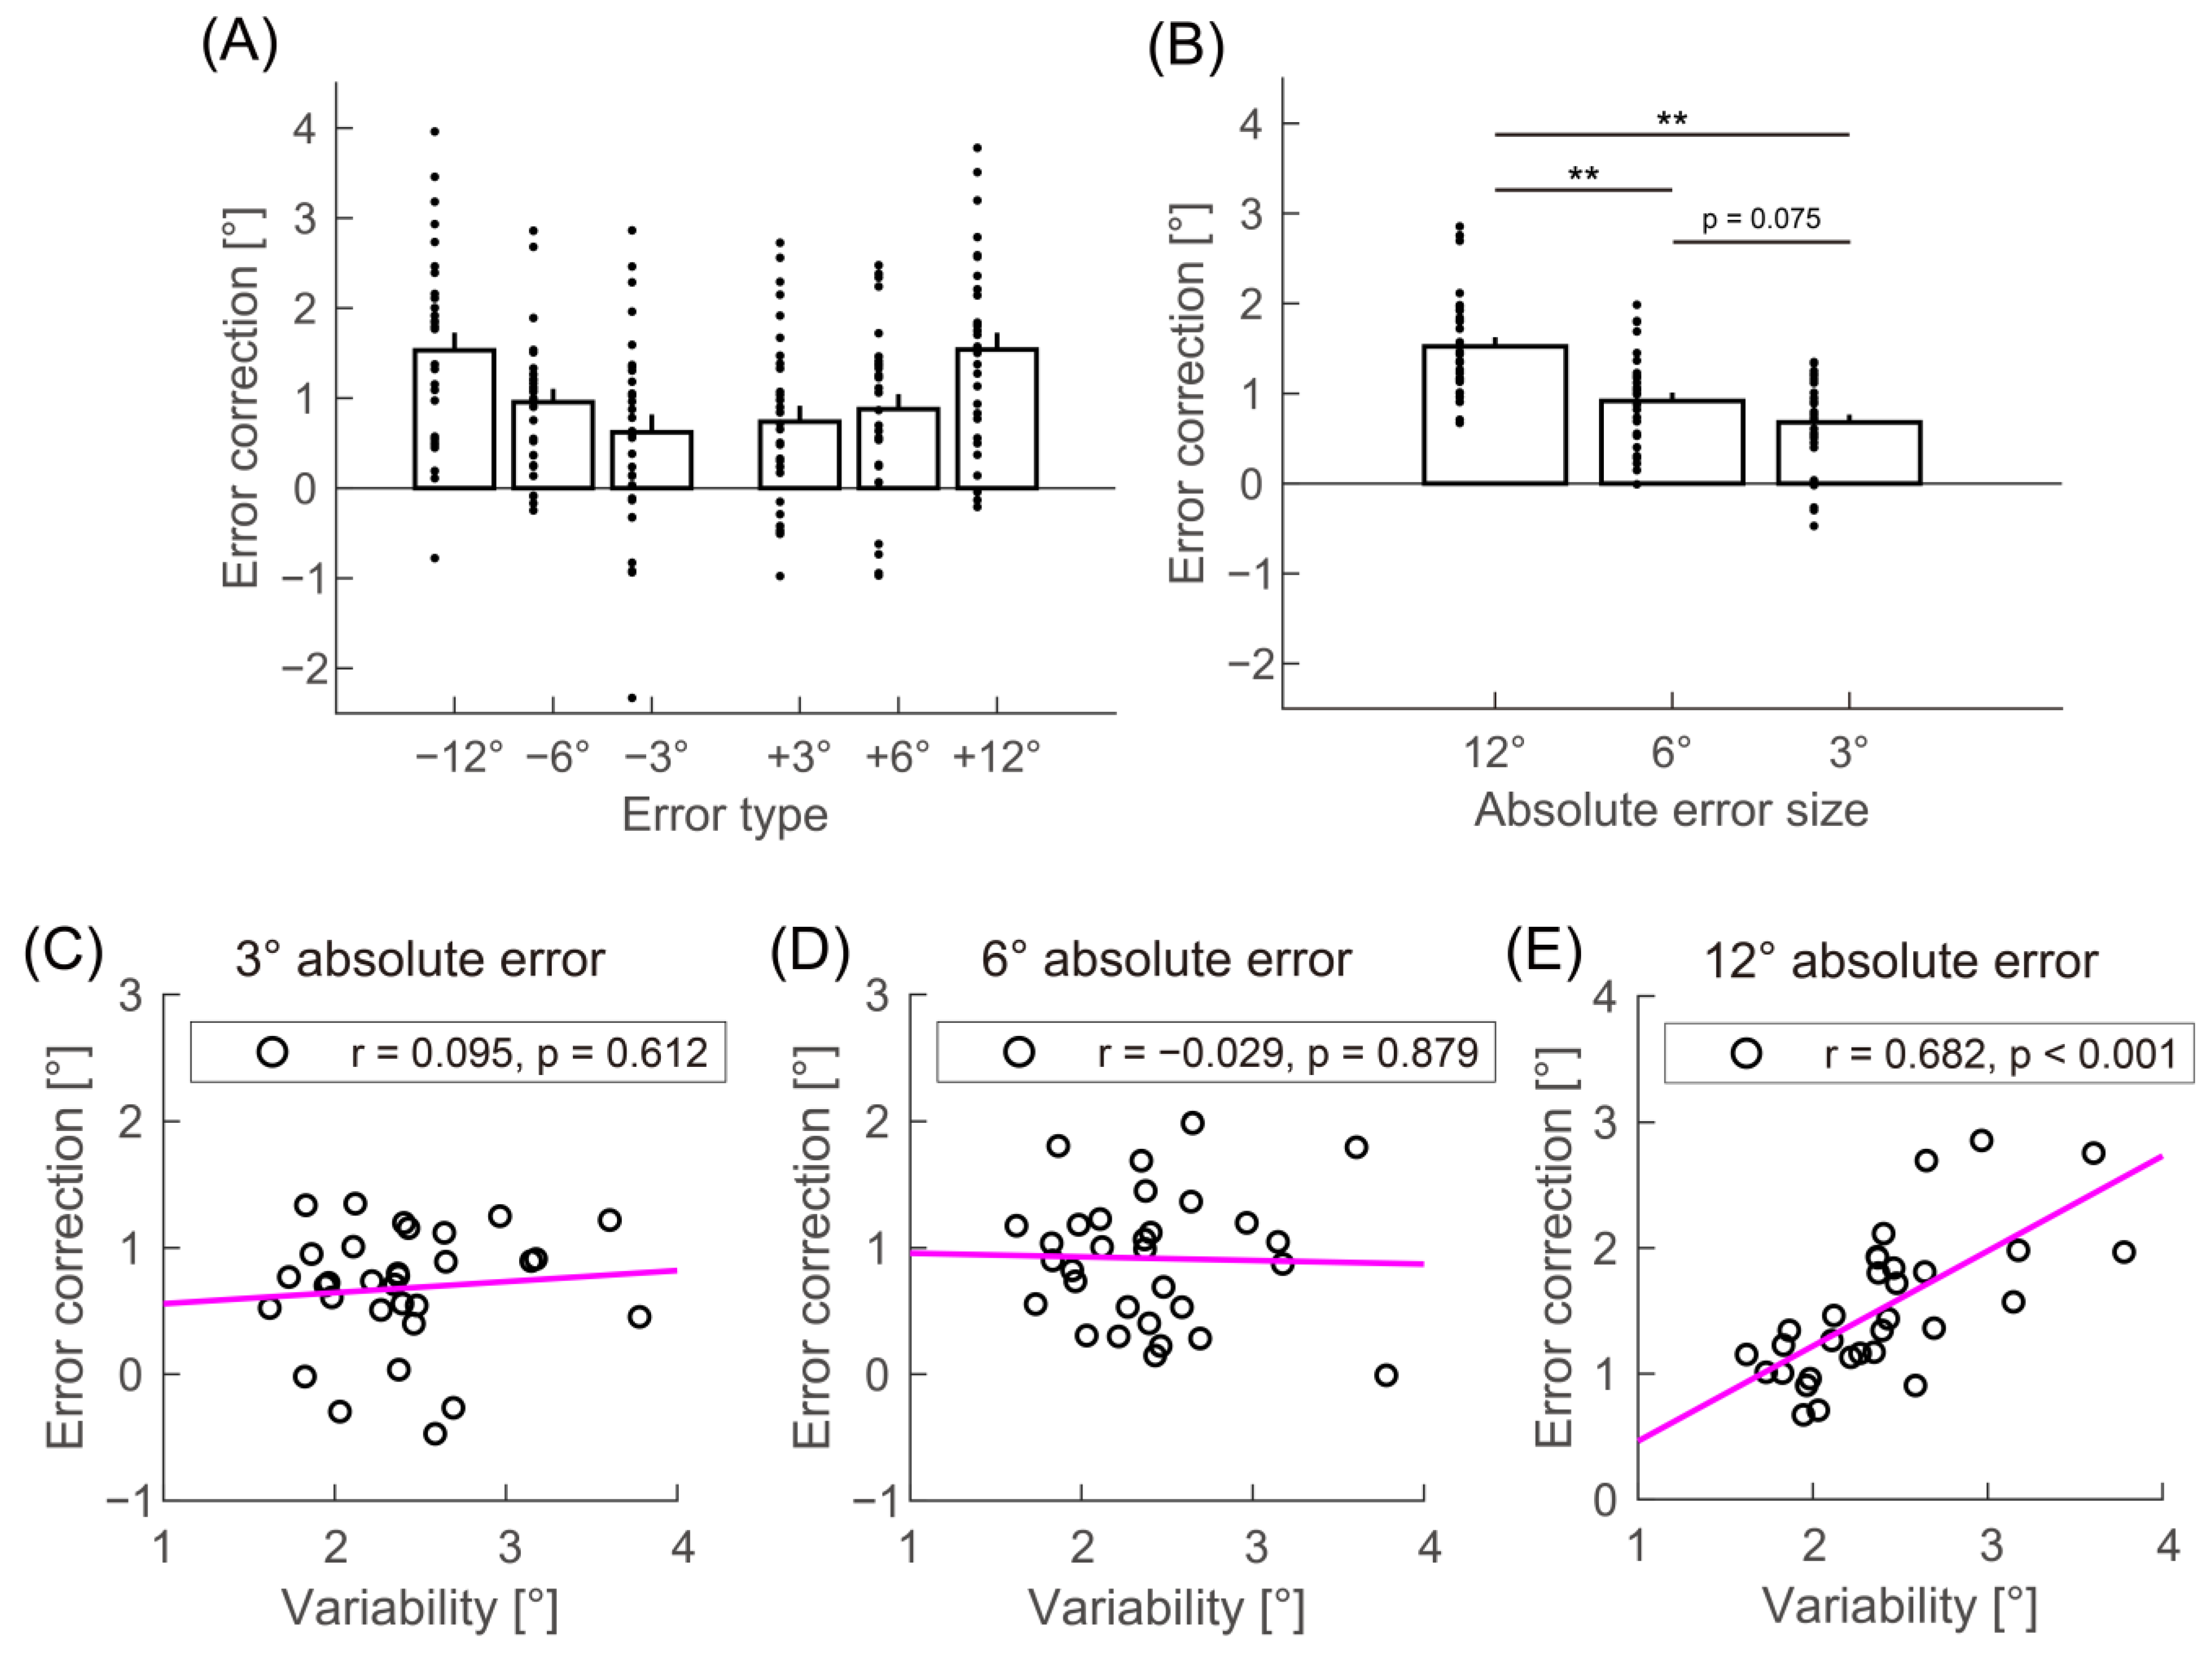
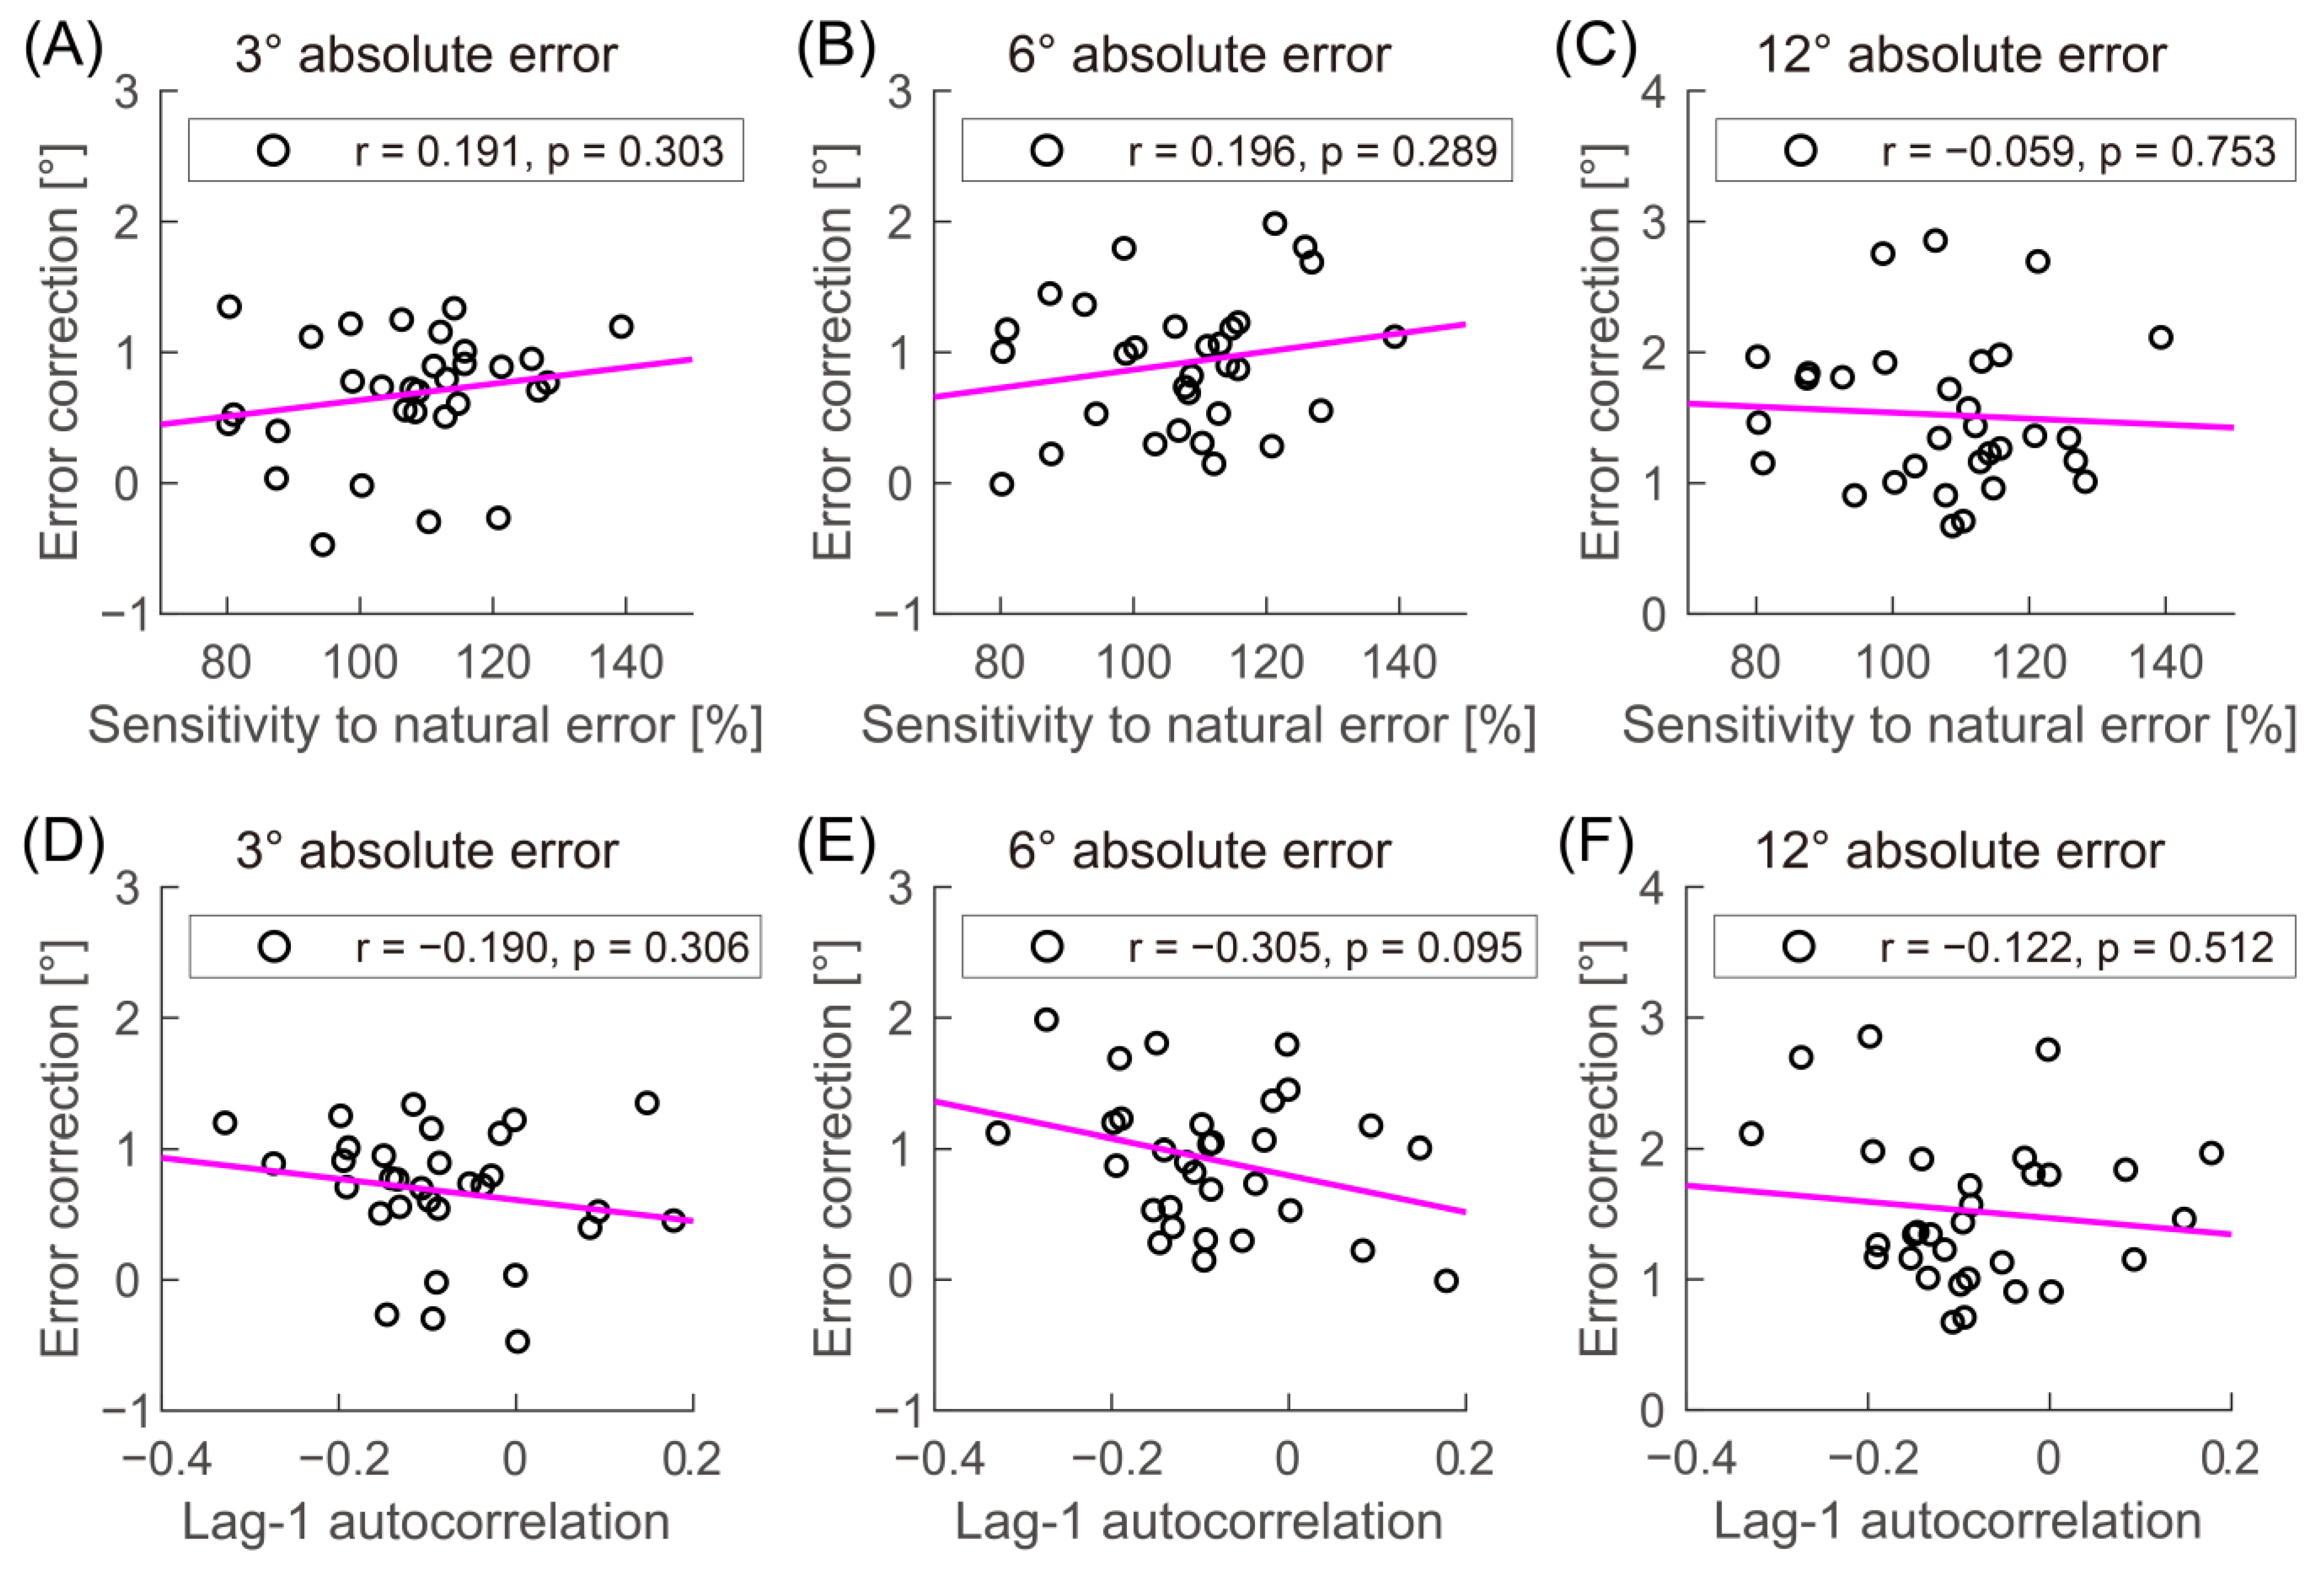
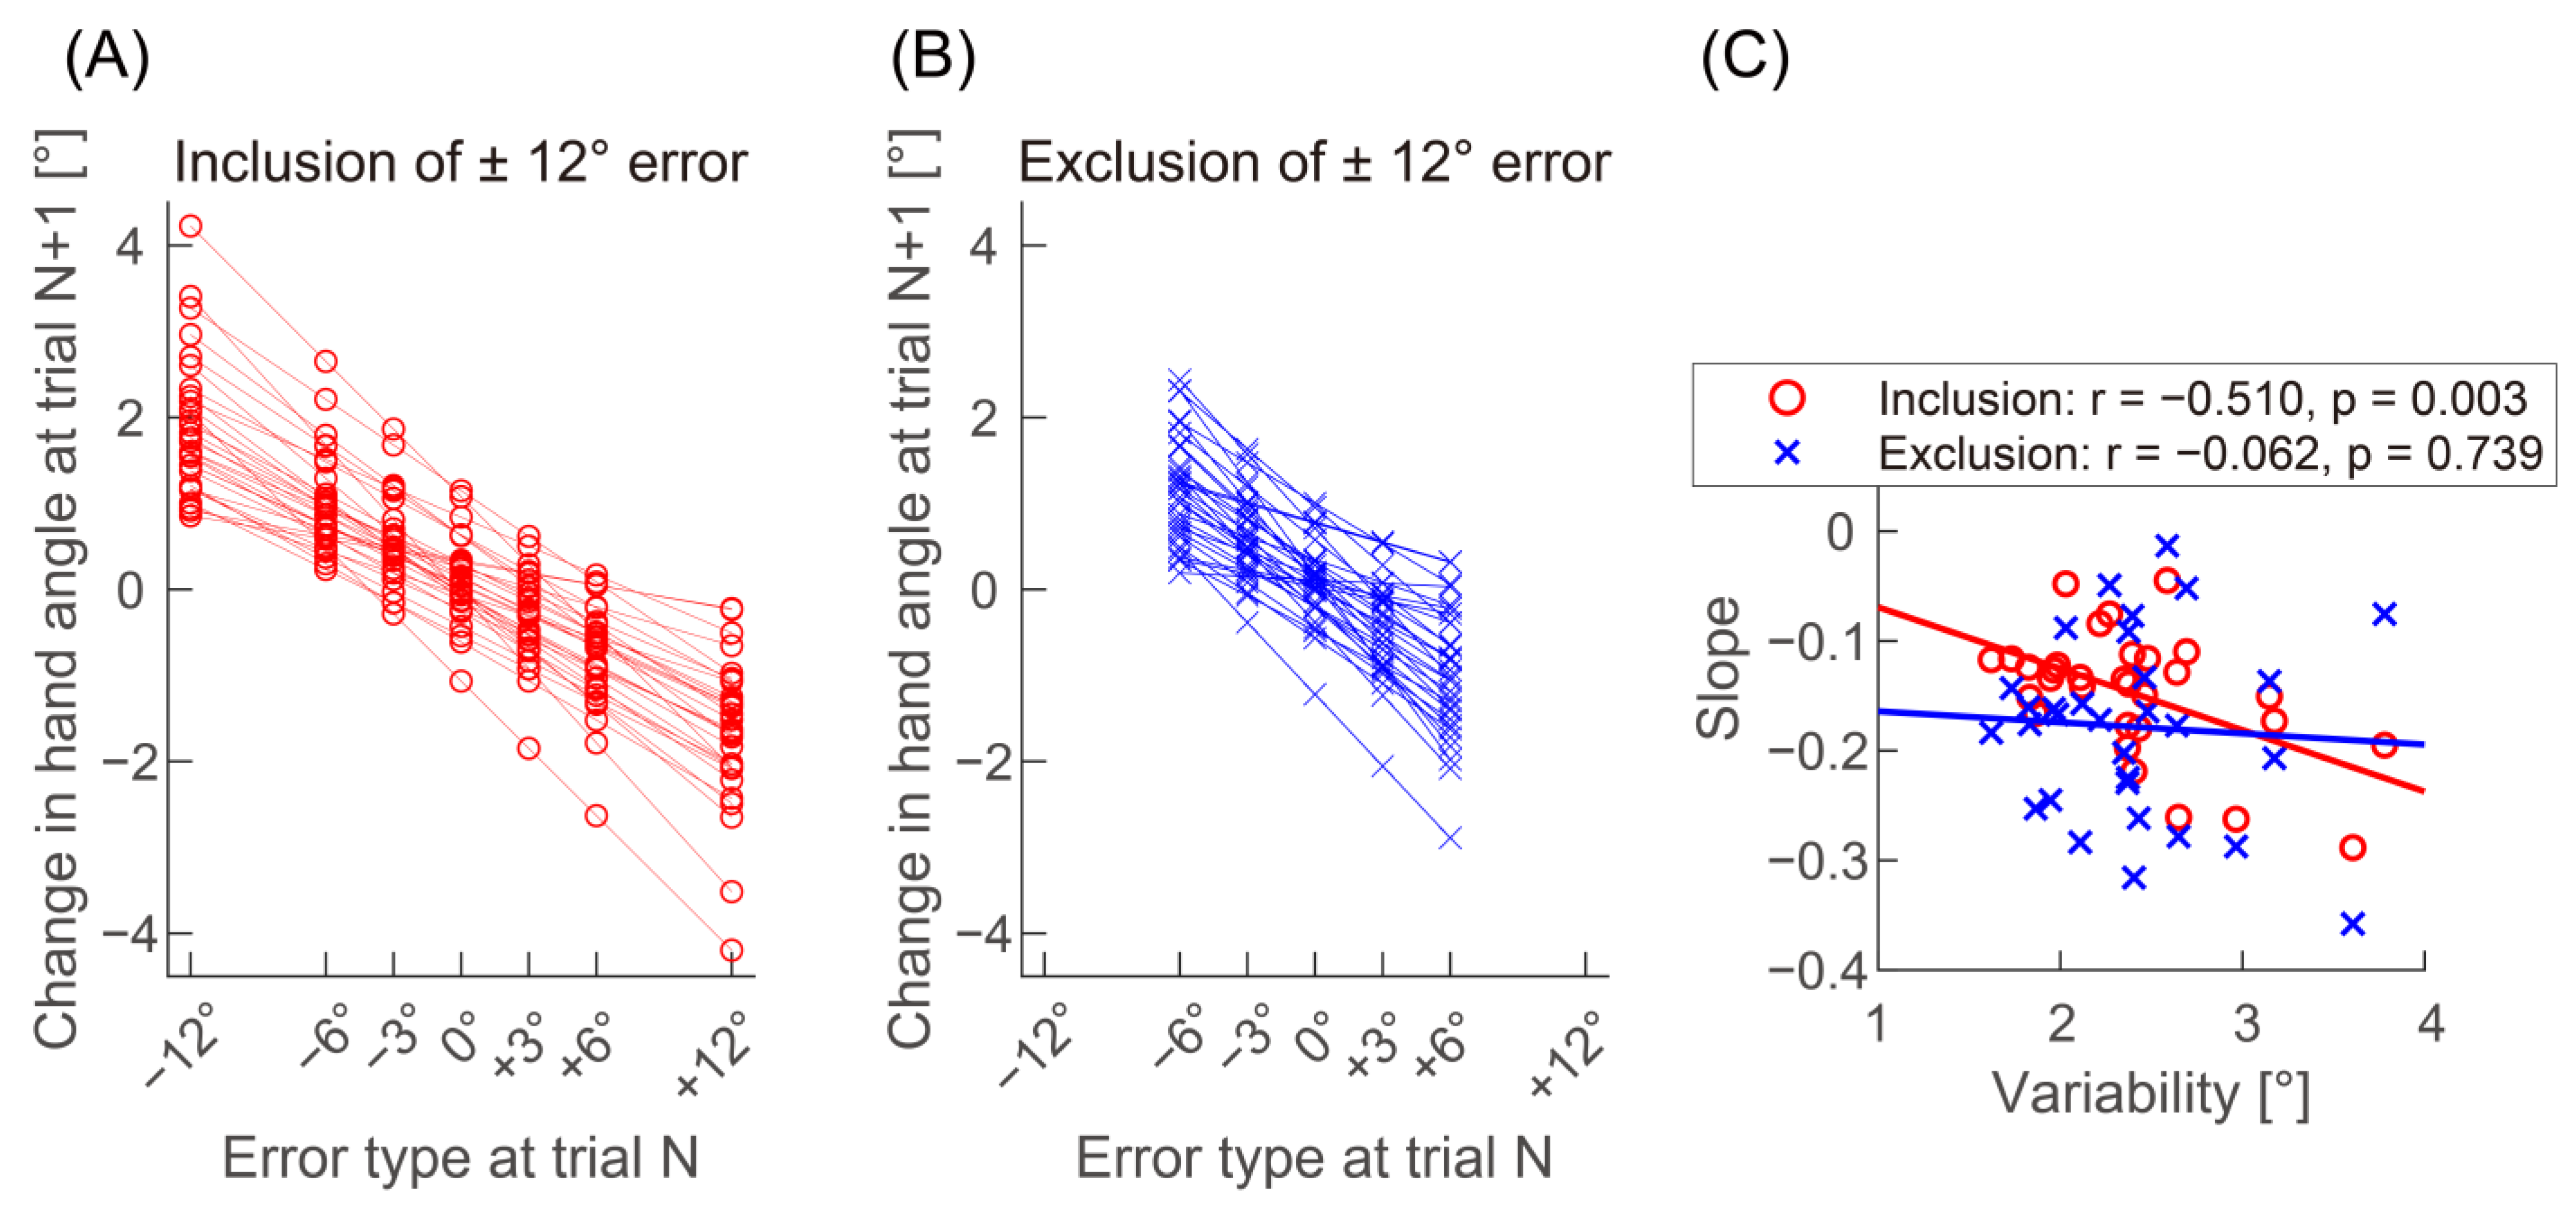
3. Results
4. Discussion
5. Conclusions
Supplementary Materials
Author Contributions
Funding
Institutional Review Board Statement
Informed Consent Statement
Data Availability Statement
Conflicts of Interest
Appendix A

References
- Sternad, D. It’s Not (Only) the Mean That Matters: Variability, Noise and Exploration in Skill Learning. Curr. Opin. Behav. Sci. 2018, 20, 183–195. [Google Scholar] [CrossRef]
- Wu, H.G.; Miyamoto, Y.R.; Castro, L.N.G.; Ölveczky, B.P.; Smith, M.A. Temporal Structure of Motor Variability Is Dynamically Regulated and Predicts Motor Learning Ability. Nat. Neurosci. 2014, 17, 312–321. [Google Scholar] [CrossRef] [PubMed]
- Knelange, E.B.; López-Moliner, J. Increased Error-Correction Leads to Both Higher Levels of Variability and Adaptation. PLoS ONE 2020, 15, e0227913. [Google Scholar] [CrossRef] [PubMed]
- Dhawale, A.K.; Smith, M.A.; Ölveczky, B.P. The Role of Variability in Motor Learning. Annu. Rev. Neurosci. 2017, 40, 479–498. [Google Scholar] [CrossRef] [PubMed]
- Caballero, C.; Moreno, F.J.; Reina, R.; Roldan, A.; Coves, A.; Barbado, D. The Role of Motor Variability in Motor Control and Learning Depends on the Nature of the Task and The Individual’s Capabilities. Eur. J. Hum. Mov. 2017, 38, 12–26. [Google Scholar]
- Stark-Inbar, A.; Raza, M.; Taylor, J.A.; Ivry, R.B. Individual Differences in Implicit Motor Learning: Task Specificity in Sensorimotor Adaptation and Sequence Learning. J. Neurophysiol. 2017, 117, 412–428. [Google Scholar] [CrossRef]
- van der Vliet, R.; Frens, M.A.; de Vreede, L.; Jonker, Z.D.; Ribbers, G.M.; Selles, R.W.; van der Geest, J.N.; Donchin, O. Individual Differences in Motor Noise and Adaptation Rate Are Optimally Related. eNeuro 2018, 5, ENEURO.0170-18.2018. [Google Scholar] [CrossRef]
- He, K.; Liang, Y.; Abdollahi, F.; Fisher Bittmann, M.; Kording, K.; Wei, K. The Statistical Determinants of the Speed of Motor Learning. PLoS Comput. Biol. 2016, 12, e1005023. [Google Scholar] [CrossRef]
- Wei, K.; Körding, K. Relevance of Error: What Drives Motor Adaptation? J. Neurophysiol. 2009, 101, 655–664. [Google Scholar] [CrossRef]
- Kasuga, S.; Hirashima, M.; Nozaki, D. Simultaneous Processing of Information on Multiple Errors in Visuomotor Learning. PLoS ONE 2013, 8, e72741. [Google Scholar] [CrossRef]
- Marko, M.K.; Haith, A.M.; Harran, M.D.; Shadmehr, R. Sensitivity to Prediction Error in Reach Adaptation. J. Neurophysiol. 2012, 108, 1752–1763. [Google Scholar] [CrossRef]
- Morehead, J.R.; Taylor, J.A.; Parvin, D.E.; Ivry, R.B. Characteristics of Implicit Sensorimotor Adaptation Revealed by Task-Irrelevant Clamped Feedback. J. Cogn. Neurosci. 2017, 29, 1061–1074. [Google Scholar] [CrossRef] [PubMed]
- Izawa, J.; Shadmehr, R. Learning from Sensory and Reward Prediction Errors during Motor Adaptation. PLoS Comput. Biol. 2011, 7, e1002012. [Google Scholar] [CrossRef]
- Taylor, J.A.; Krakauer, J.W.; Ivry, R.B. Explicit and Implicit Contributions to Learning in a Sensorimotor Adaptation Task. J. Neurosci. 2014, 34, 3023–3032. [Google Scholar] [CrossRef] [PubMed]
- Verstynen, T.; Sabes, P.N. How Each Movement Changes the Next: An Experimental and Theoretical Study of Fast Adaptive Priors in Reaching. J. Neurosci. 2011, 31, 10050–10059. [Google Scholar] [CrossRef] [PubMed]
- McDougle, S.D.; Bond, K.M.; Taylor, J.A. Explicit and Implicit Processes Constitute the Fast and Slow Processes of Sensorimotor Learning. J. Neurosci. 2015, 35, 9568–9579. [Google Scholar] [CrossRef]
- Bond, K.M.; Taylor, J.A. Flexible Explicit but Rigid Implicit Learning in a Visuomotor Adaptation Task. J. Neurophysiol. 2015, 113, 3836–3849. [Google Scholar] [CrossRef]
- Leow, L.-A.; Loftus, A.M.; Hammond, G.R. Impaired Savings despite Intact Initial Learning of Motor Adaptation in Parkinson’s Disease. Exp. Brain Res. 2012, 218, 295–304. [Google Scholar] [CrossRef]
- Taylor, J.A.; Ivry, R.B. Cerebellar and Prefrontal Cortex Contributions to Adaptation, Strategies, and Reinforcement Learning. Prog. Brain Res. 2014, 210, 217–253. [Google Scholar]
- Tsay, J.S.; Parvin, D.E.; Ivry, R.B. Continuous Reports of Sensed Hand Position during Sensorimotor Adaptation. J. Neurophysiol. 2020, 124, 1122–1130. [Google Scholar] [CrossRef]
- Oldfield, R.C. The Assessment and Analysis of Handedness: The Edinburgh Inventory. Neuropsychologia 1971, 9, 97–113. [Google Scholar] [CrossRef] [PubMed]
- Kleiner, M.; Brainard, D.H.; Pelli, D.G.; Broussard, C.; Wolf, T.; Niehorster, D. What’s New in Psychtoolbox-3? Perception 2007, 36, 1–16. [Google Scholar]
- van Beers, R.J. Motor Learning Is Optimally Tuned to the Properties of Motor Noise. Neuron 2009, 63, 406–417. [Google Scholar] [CrossRef] [PubMed]
- Avraham, G.; Keizman, M.; Shmuelof, L. Environmental Consistency Modulation of Error Sensitivity during Motor Adaptation Is Explicitly Controlled. J. Neurophysiol. 2020, 123, 57–69. [Google Scholar] [CrossRef] [PubMed]
- Hutter, S.A.; Taylor, J.A. Relative Sensitivity of Explicit Reaiming and Implicit Motor Adaptation. J. Neurophysiol. 2018, 120, 2640–2648. [Google Scholar] [CrossRef]
- Wei, K.; Körding, K. Uncertainty of Feedback and State Estimation Determines the Speed of Motor Adaptation. Front. Comput. Neurosci 2010, 4, 11. [Google Scholar] [CrossRef]
- Shyr, M.C.; Joshi, S.S. Validation of the Bayesian Sensory Uncertainty Model of Motor Adaptation with a Remote Experimental Paradigm. In Proceedings of the 2021 IEEE International Conference on Human-Machine Systems, ICHMS 2021, Magdeburg, Germany, 8 September 2021; pp. 1–6. [Google Scholar] [CrossRef]
- Tsay, J.S.; Haith, A.M.; Ivry, R.B.; Kim, H.E. Interactions between Sensory Prediction Error and Task Error during Implicit Motor Learning. PLoS Comput. Biol. 2022, 18, e1010005. [Google Scholar] [CrossRef]
- Herzfeld, D.J.; Vaswani, P.A.; Marko, M.K.; Shadmehr, R. A Memory of Errors in Sensorimotor Learning. Science 2014, 345, 1349–1353. [Google Scholar] [CrossRef]
- Fernandez-Ruiz, J.; Wong, W.; Armstrong, I.T.; Flanagan, J.R. Relation between Reaction Time and Reach Errors during Visuomotor Adaptation. Behav. Brain Res. 2011, 219, 8–14. [Google Scholar] [CrossRef]
- Krakauer, J.W.; Hadjiosif, A.M.; Xu, J.; Wong, A.L.; Haith, A.M. Motor Learning. Compr. Physiol. 2019, 9, 613–663. [Google Scholar] [CrossRef] [PubMed]
- Tsay, J.S.; Kim, H.; Haith, A.M.; Ivry, R.B. Understanding Implicit Sensorimotor Adaptation as a Process of Proprioceptive Re-Alignment. Elife 2022, 11, e76639. [Google Scholar] [CrossRef] [PubMed]
- Cressman, E.K.; Henriques, D.Y.P. Sensory Recalibration of Hand Position Following Visuomotor Adaptation. J. Neurophysiol. 2009, 102, 3505–3518. [Google Scholar] [CrossRef]
- Ruttle, J.E.; ’t Hart, B.M.; Henriques, D.Y.P. Implicit Motor Learning within Three Trials. Sci. Rep 2021, 11, 1627. [Google Scholar] [CrossRef] [PubMed]
- Synofzik, M.; Thier, P.; Leube, D.T.; Schlotterbeck, P.; Lindner, A. Misattributions of Agency in Schizophrenia Are Based on Imprecise Predictions about the Sensory Consequences of One’s Actions. Brain 2010, 133, 262–271. [Google Scholar] [CrossRef] [PubMed]
- Tsay, J.S.; Kim, H.E.; Parvin, D.E.; Stover, A.R.; Ivry, R.B. Individual Differences in Proprioception Predict the Extent of Implicit Sensorimotor Adaptation. J. Neurophysiol. 2021, 125, 1307–1321. [Google Scholar] [CrossRef]
- Singh, P.; Jana, S.; Ghosal, A.; Murthy, A. Exploration of Joint Redundancy but Not Task Space Variability Facilitates Supervised Motor Learning. Proc. Natl. Acad. Sci. USA 2016, 113, 14414–14419. [Google Scholar] [CrossRef]
- van Beers, R.J. How Does Our Motor System Determine Its Learning Rate? PLoS ONE 2012, 7, e49373. [Google Scholar] [CrossRef]
- Ranganathan, R.; Cone, S.; Fox, B. Predicting Individual Differences in Motor Learning: A Critical Review. Neurosci. Biobehav. Rev. 2022, 141, 104852. [Google Scholar] [CrossRef]


Disclaimer/Publisher’s Note: The statements, opinions and data contained in all publications are solely those of the individual author(s) and contributor(s) and not of MDPI and/or the editor(s). MDPI and/or the editor(s) disclaim responsibility for any injury to people or property resulting from any ideas, methods, instructions or products referred to in the content. |
© 2023 by the authors. Licensee MDPI, Basel, Switzerland. This article is an open access article distributed under the terms and conditions of the Creative Commons Attribution (CC BY) license (https://creativecommons.org/licenses/by/4.0/).
Share and Cite
Matsuda, N.; Abe, M.O. Error Size Shape Relationships between Motor Variability and Implicit Motor Adaptation. Biology 2023, 12, 404. https://doi.org/10.3390/biology12030404
Matsuda N, Abe MO. Error Size Shape Relationships between Motor Variability and Implicit Motor Adaptation. Biology. 2023; 12(3):404. https://doi.org/10.3390/biology12030404
Chicago/Turabian StyleMatsuda, Naoyoshi, and Masaki O. Abe. 2023. "Error Size Shape Relationships between Motor Variability and Implicit Motor Adaptation" Biology 12, no. 3: 404. https://doi.org/10.3390/biology12030404
APA StyleMatsuda, N., & Abe, M. O. (2023). Error Size Shape Relationships between Motor Variability and Implicit Motor Adaptation. Biology, 12(3), 404. https://doi.org/10.3390/biology12030404