

Transcriptome Analysis of Thiram-Treated Zebrafish (Danio rerio) Embryos Reveals Disruption of Reproduction Signaling Pathways


Simple Summary
Abstract
1. Introduction
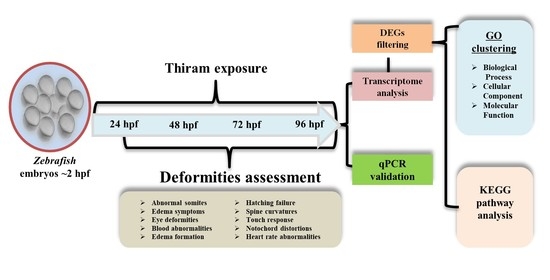
2. Results
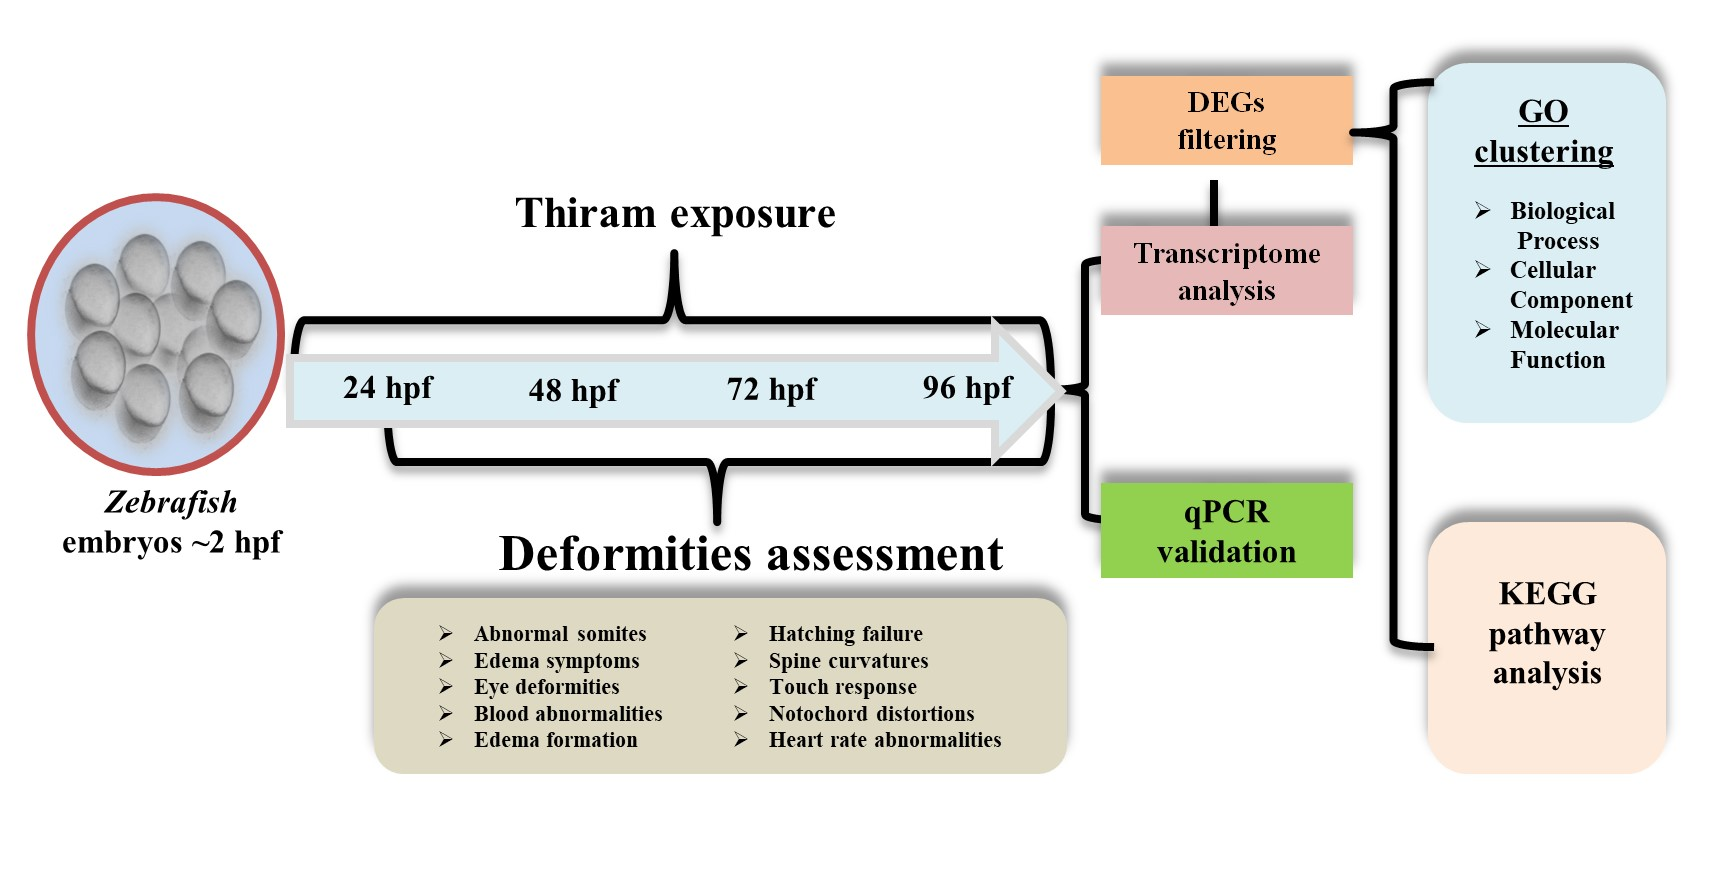
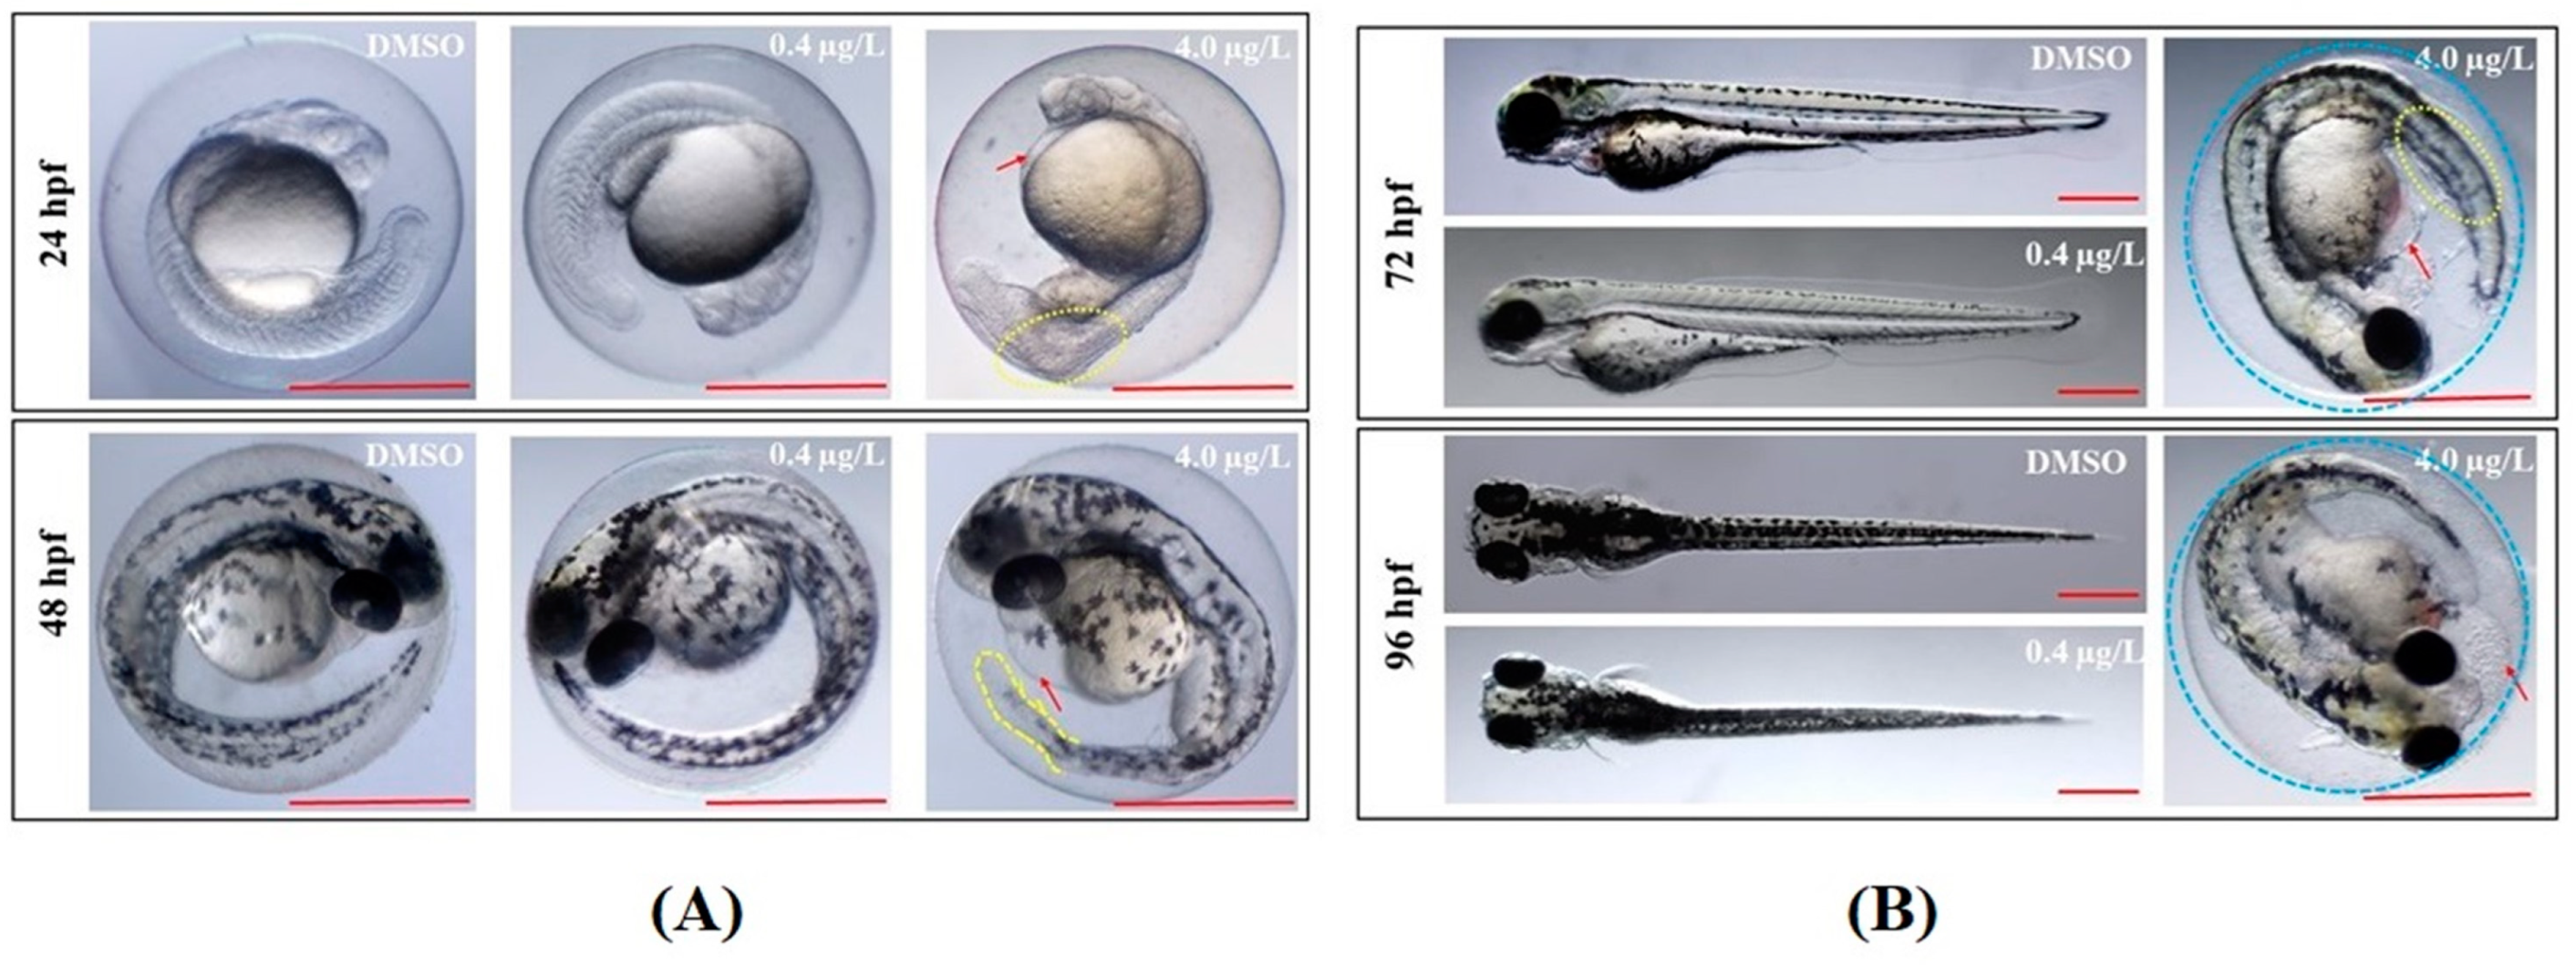
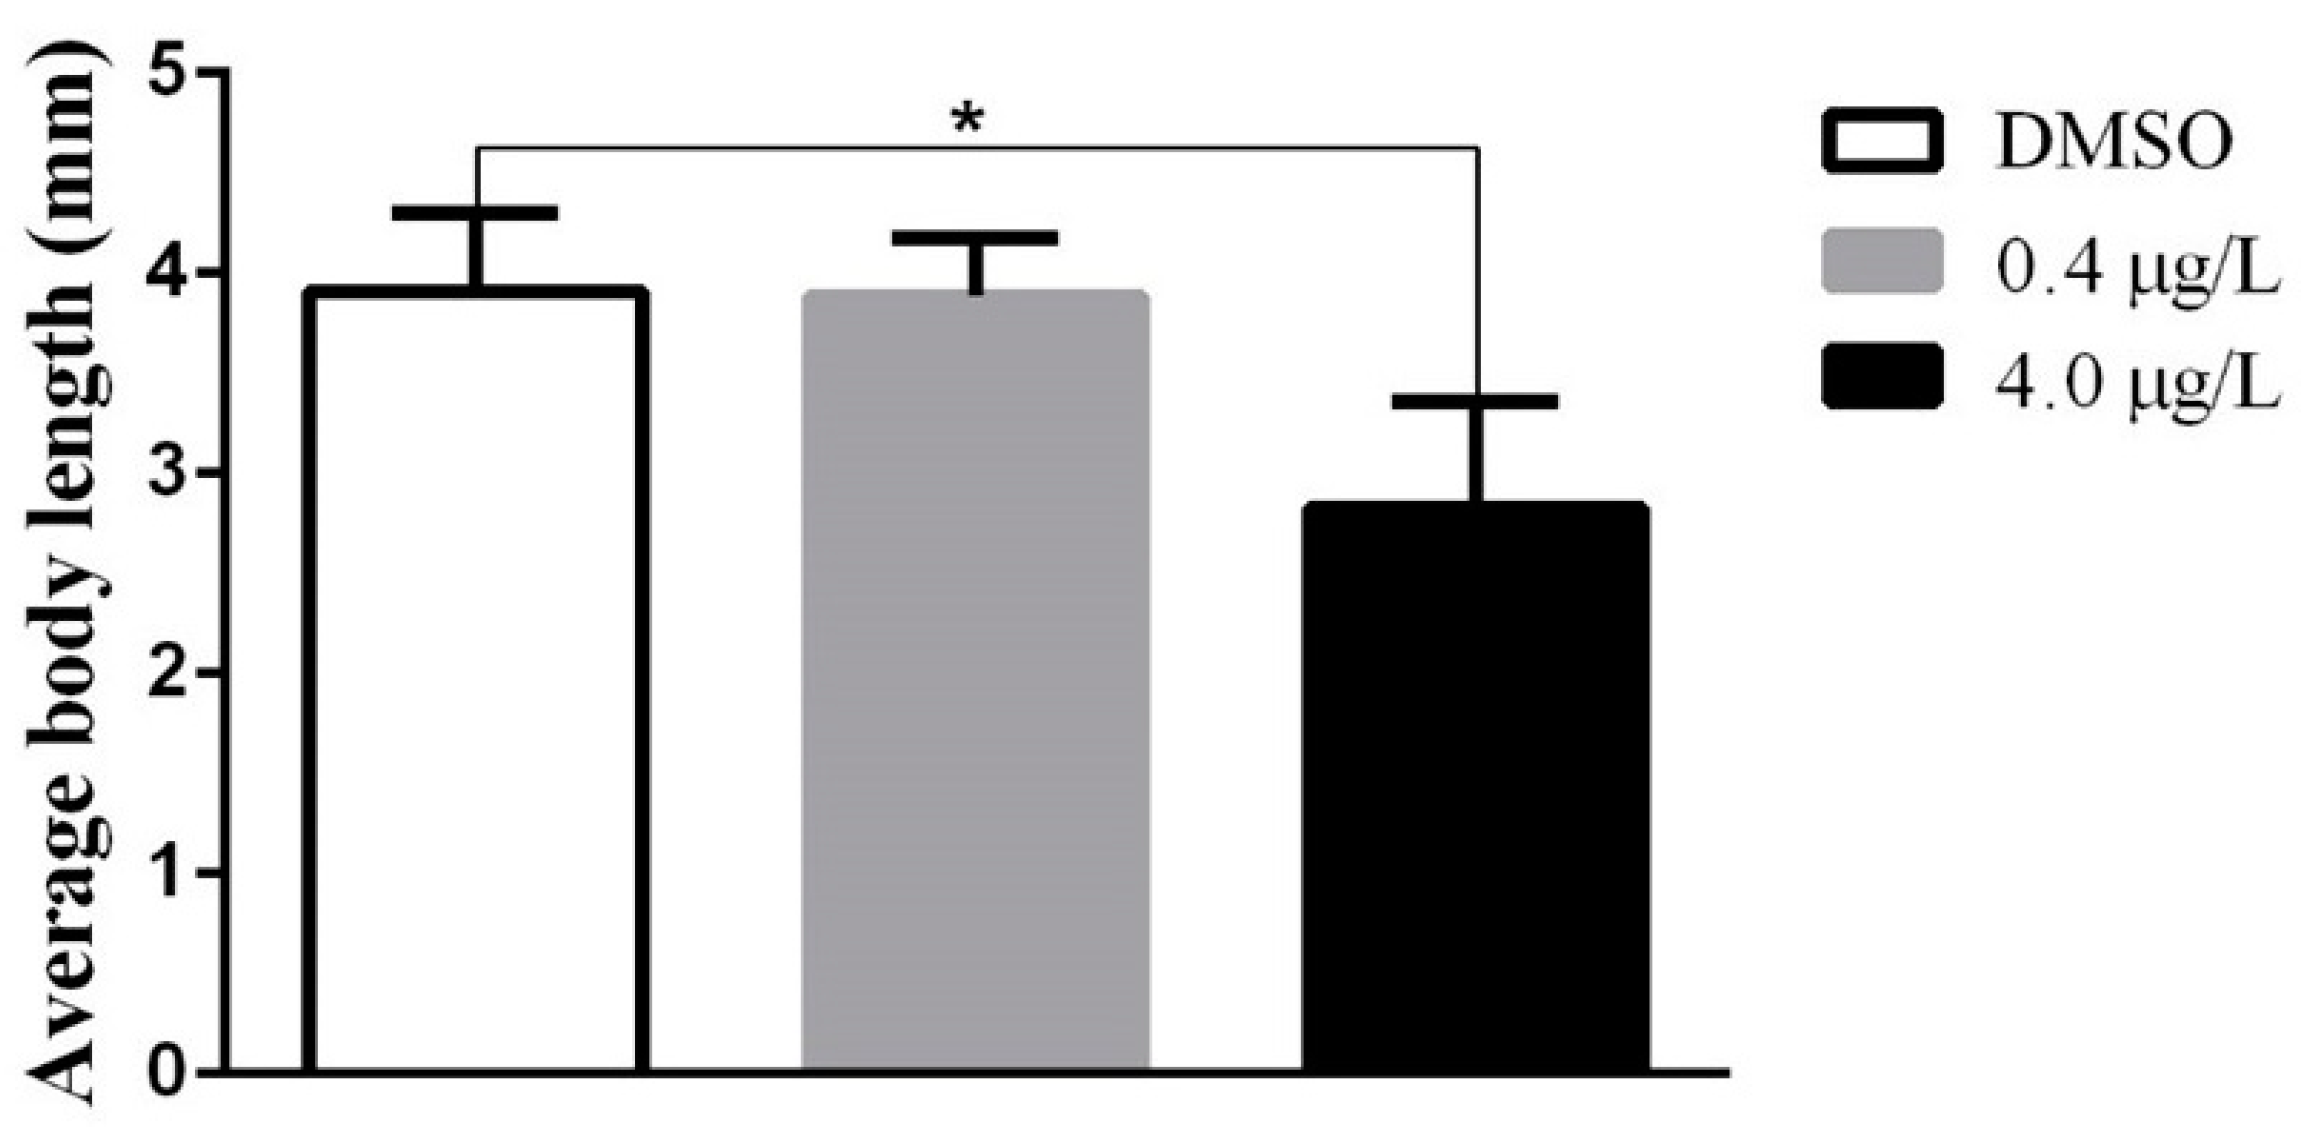
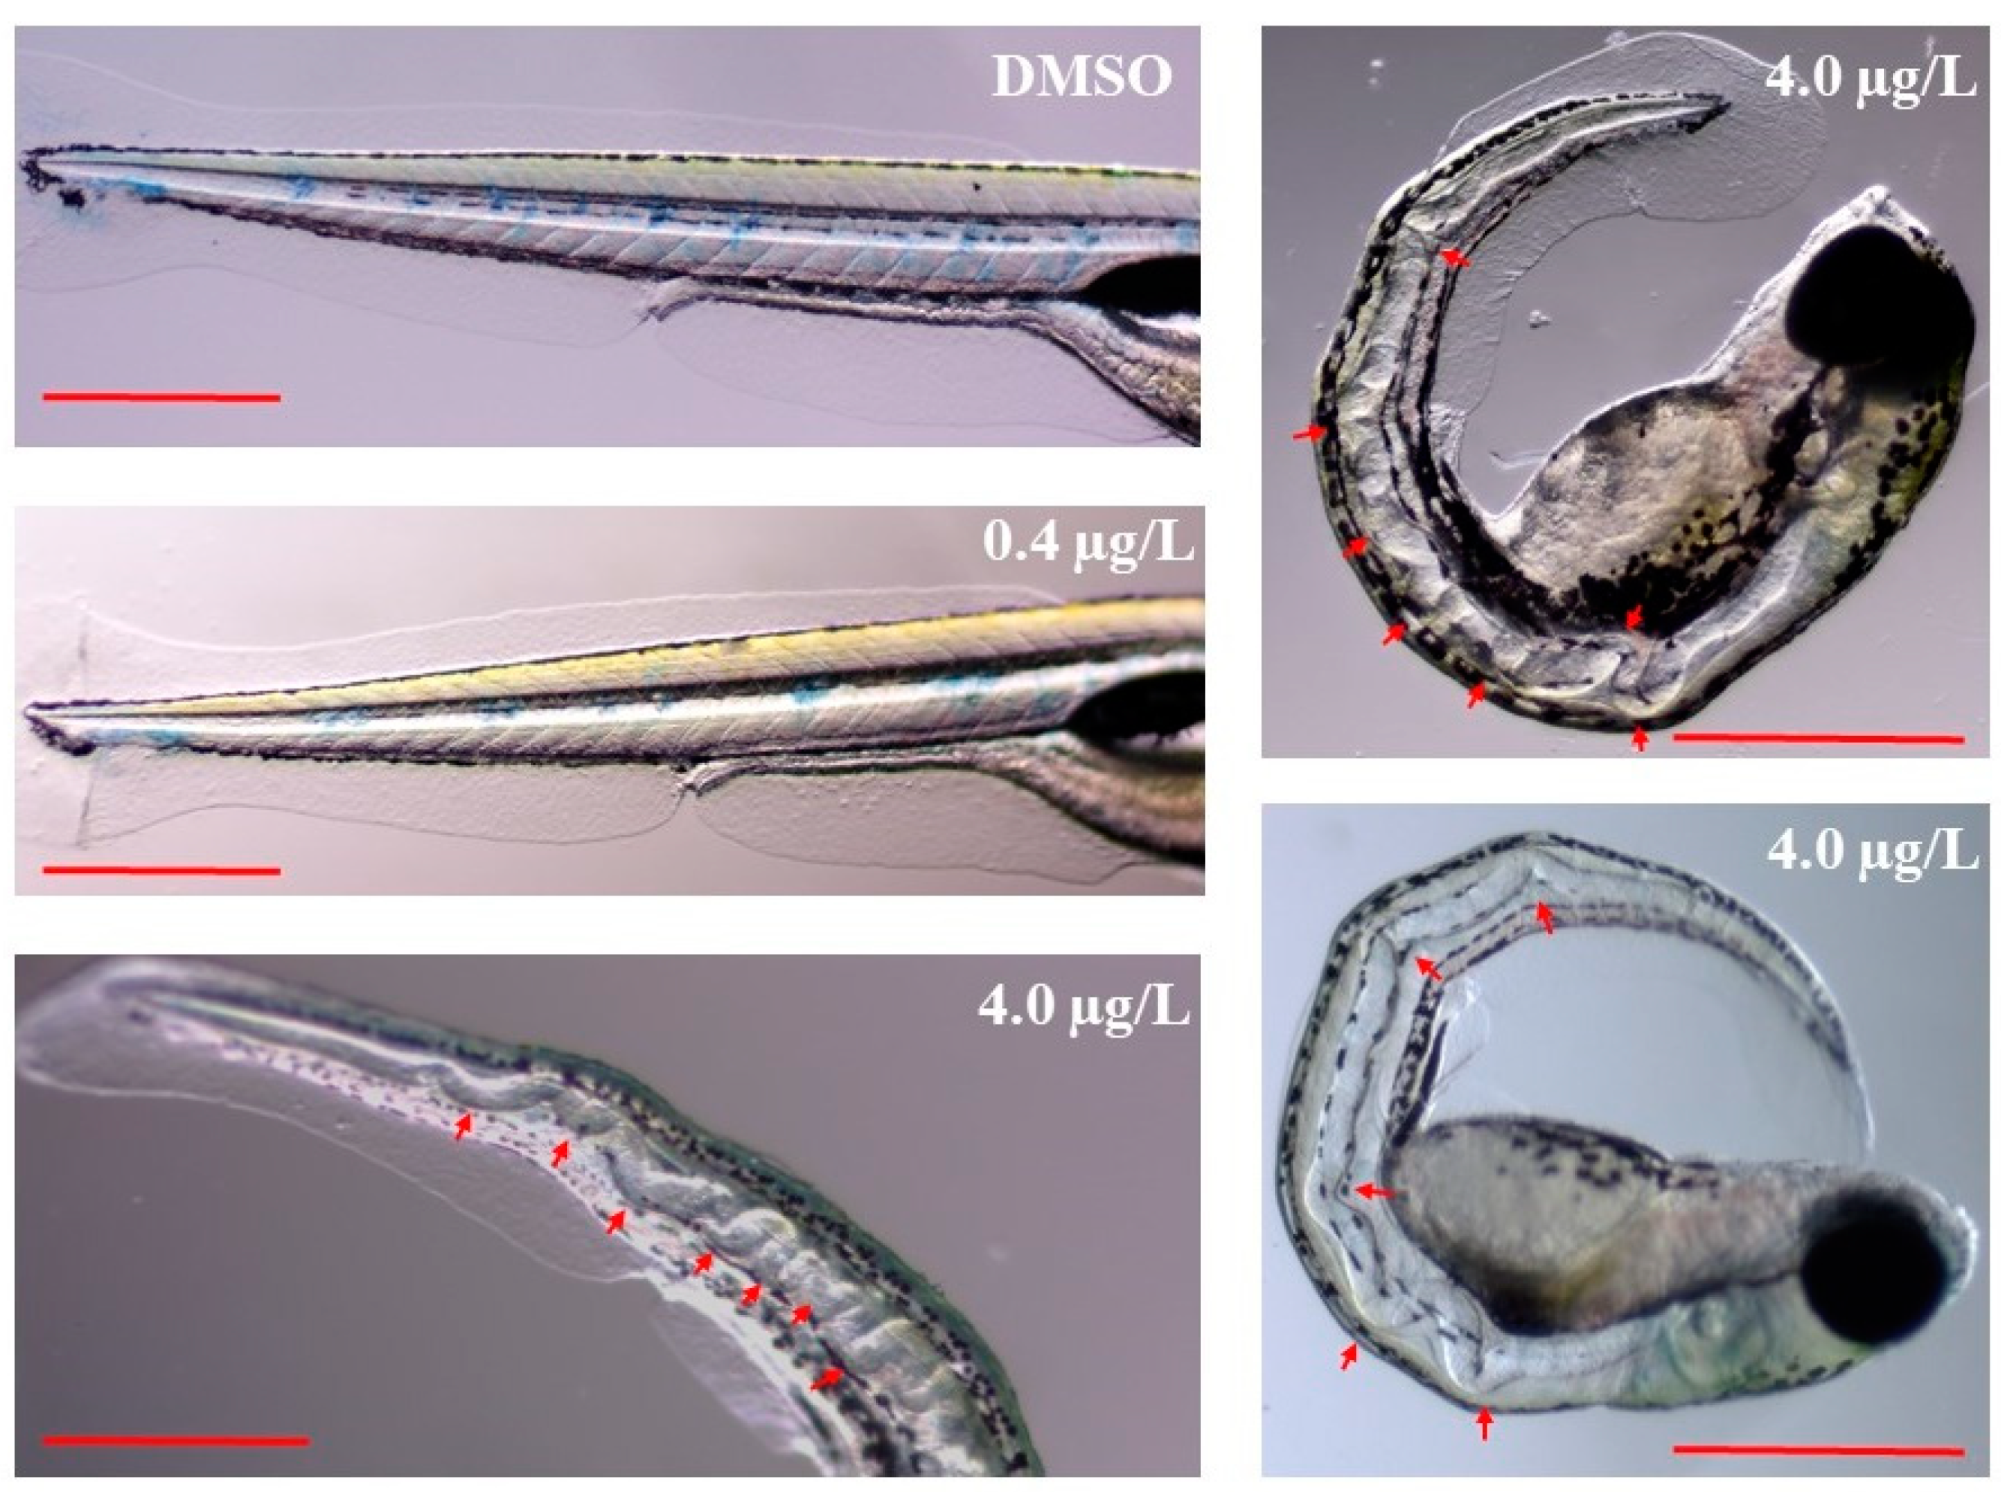
2.1. Developmental Toxicity Study
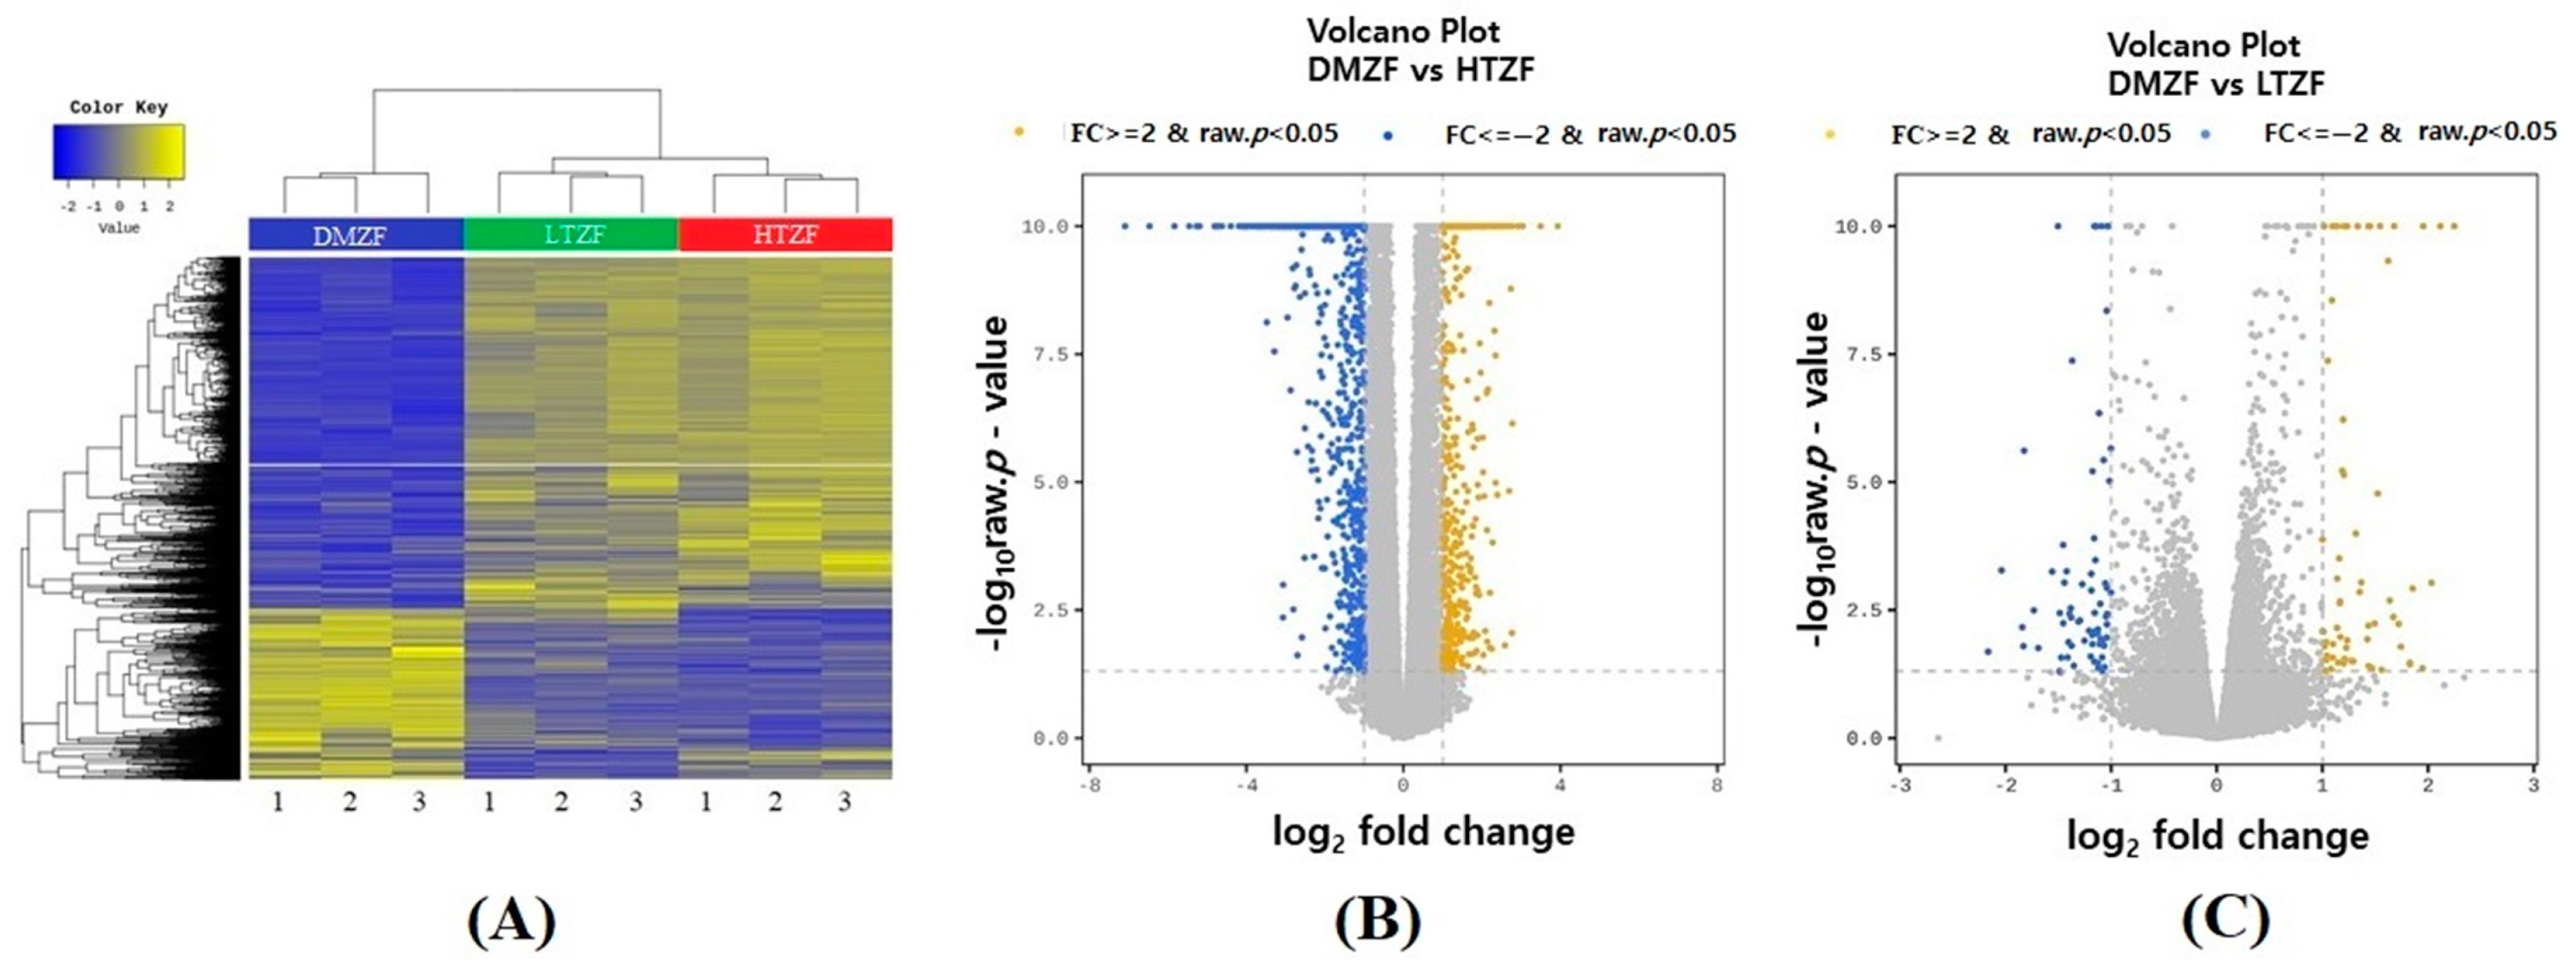
2.2. Whole-Transcriptome Analysis
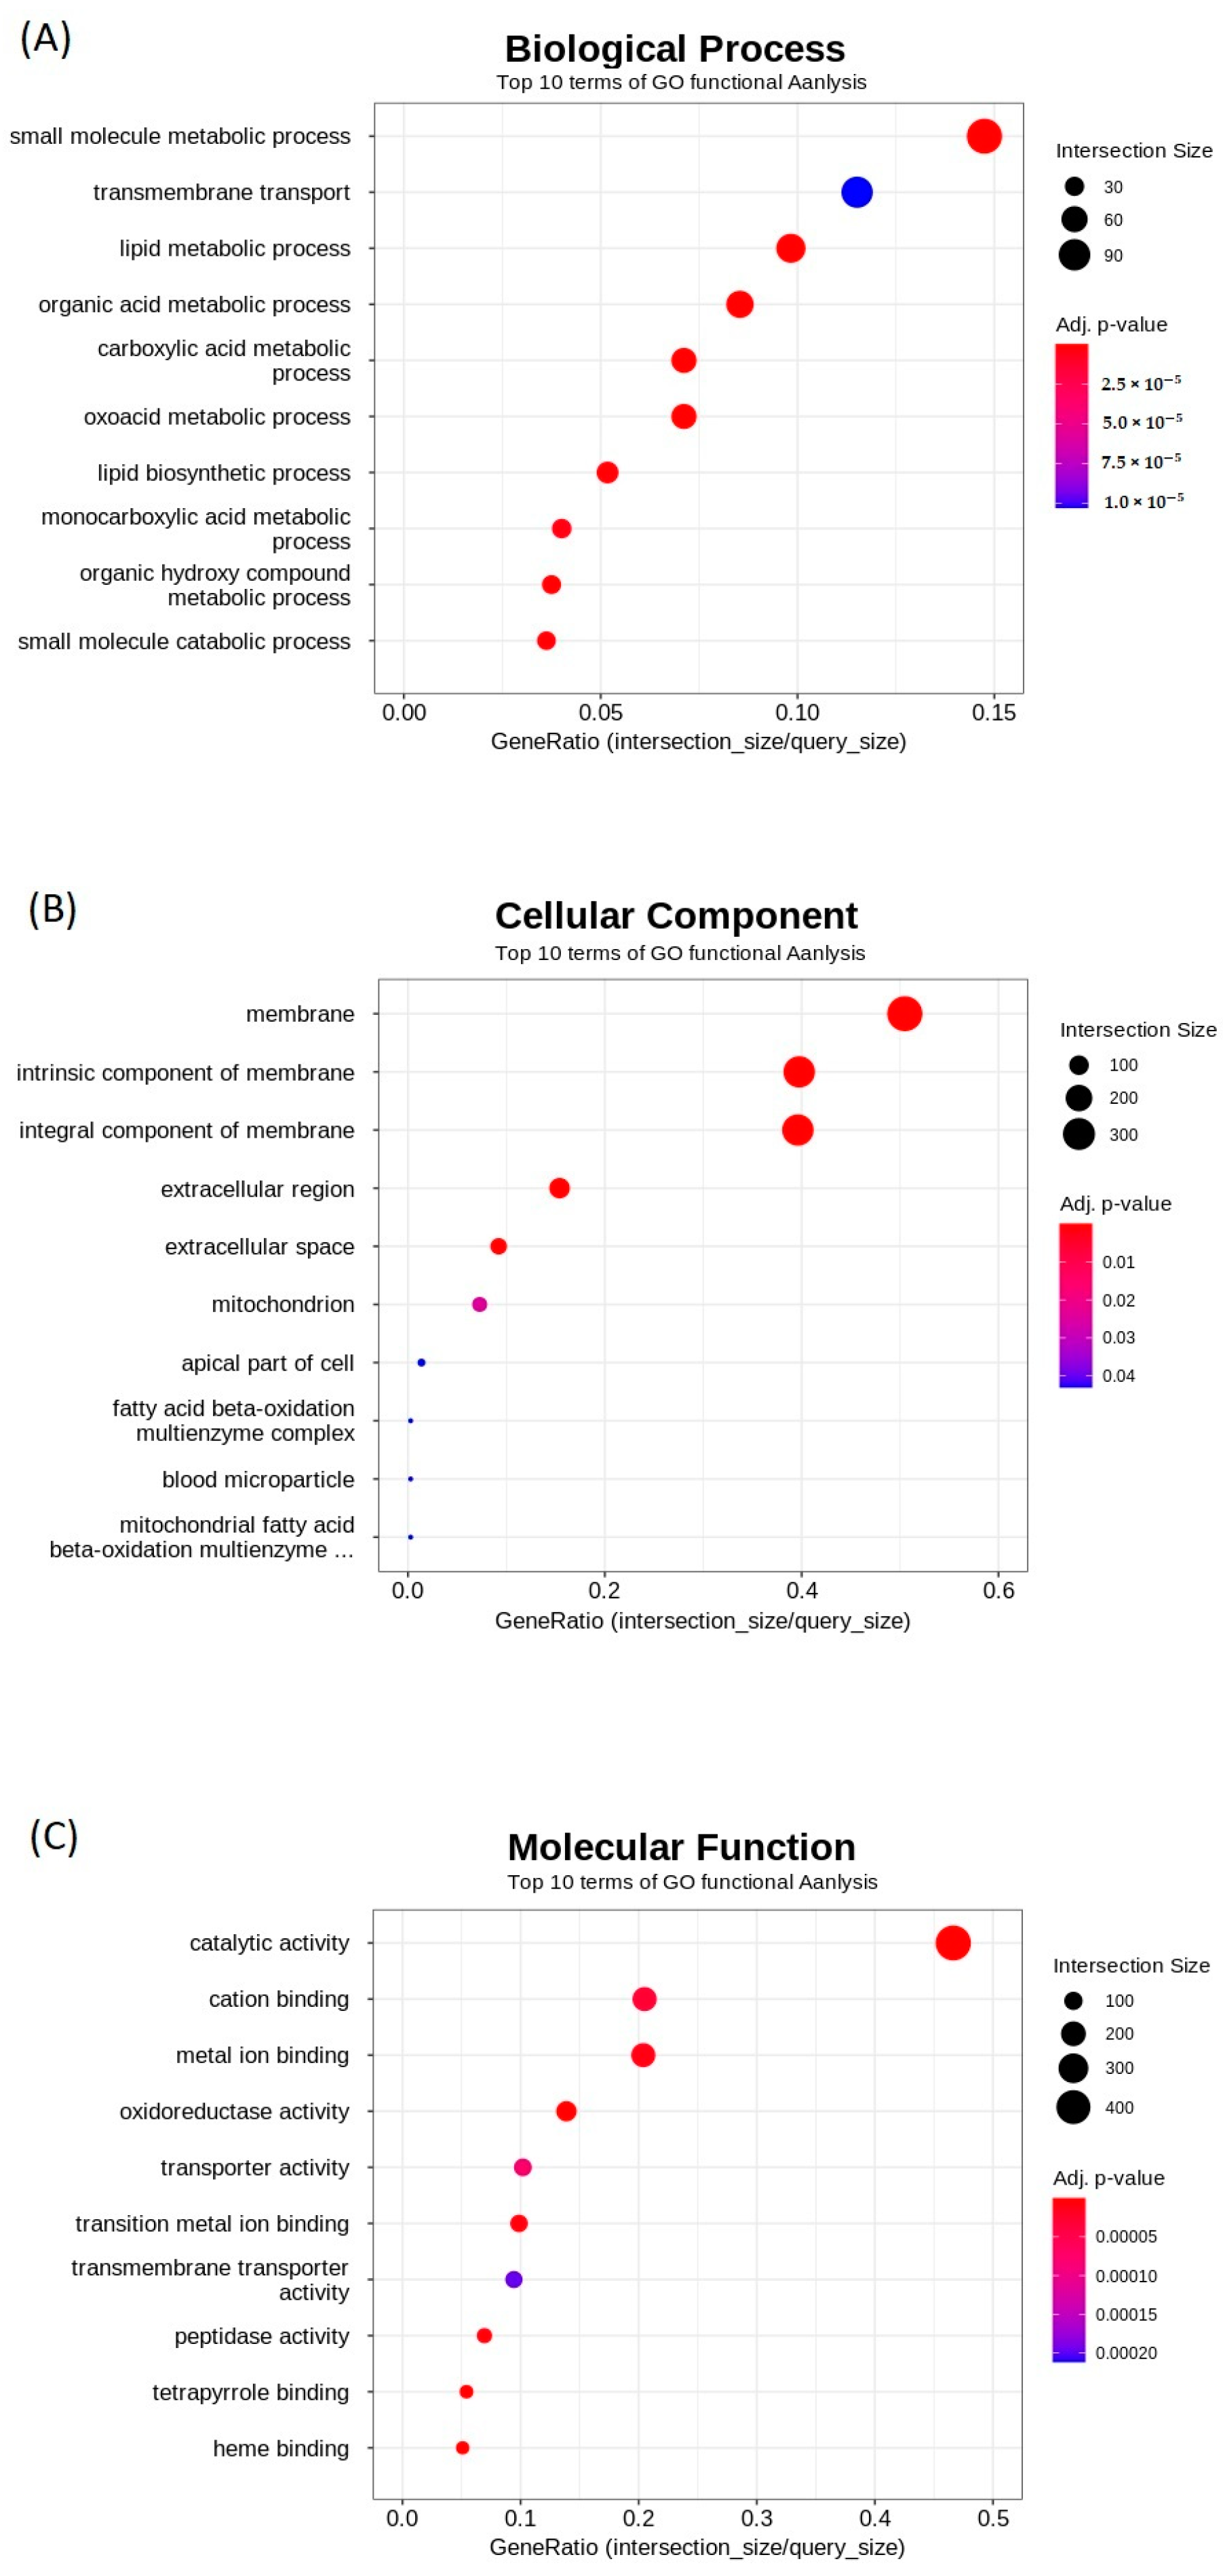
2.3. Gene Ontology (GO) Enrichment Analysis
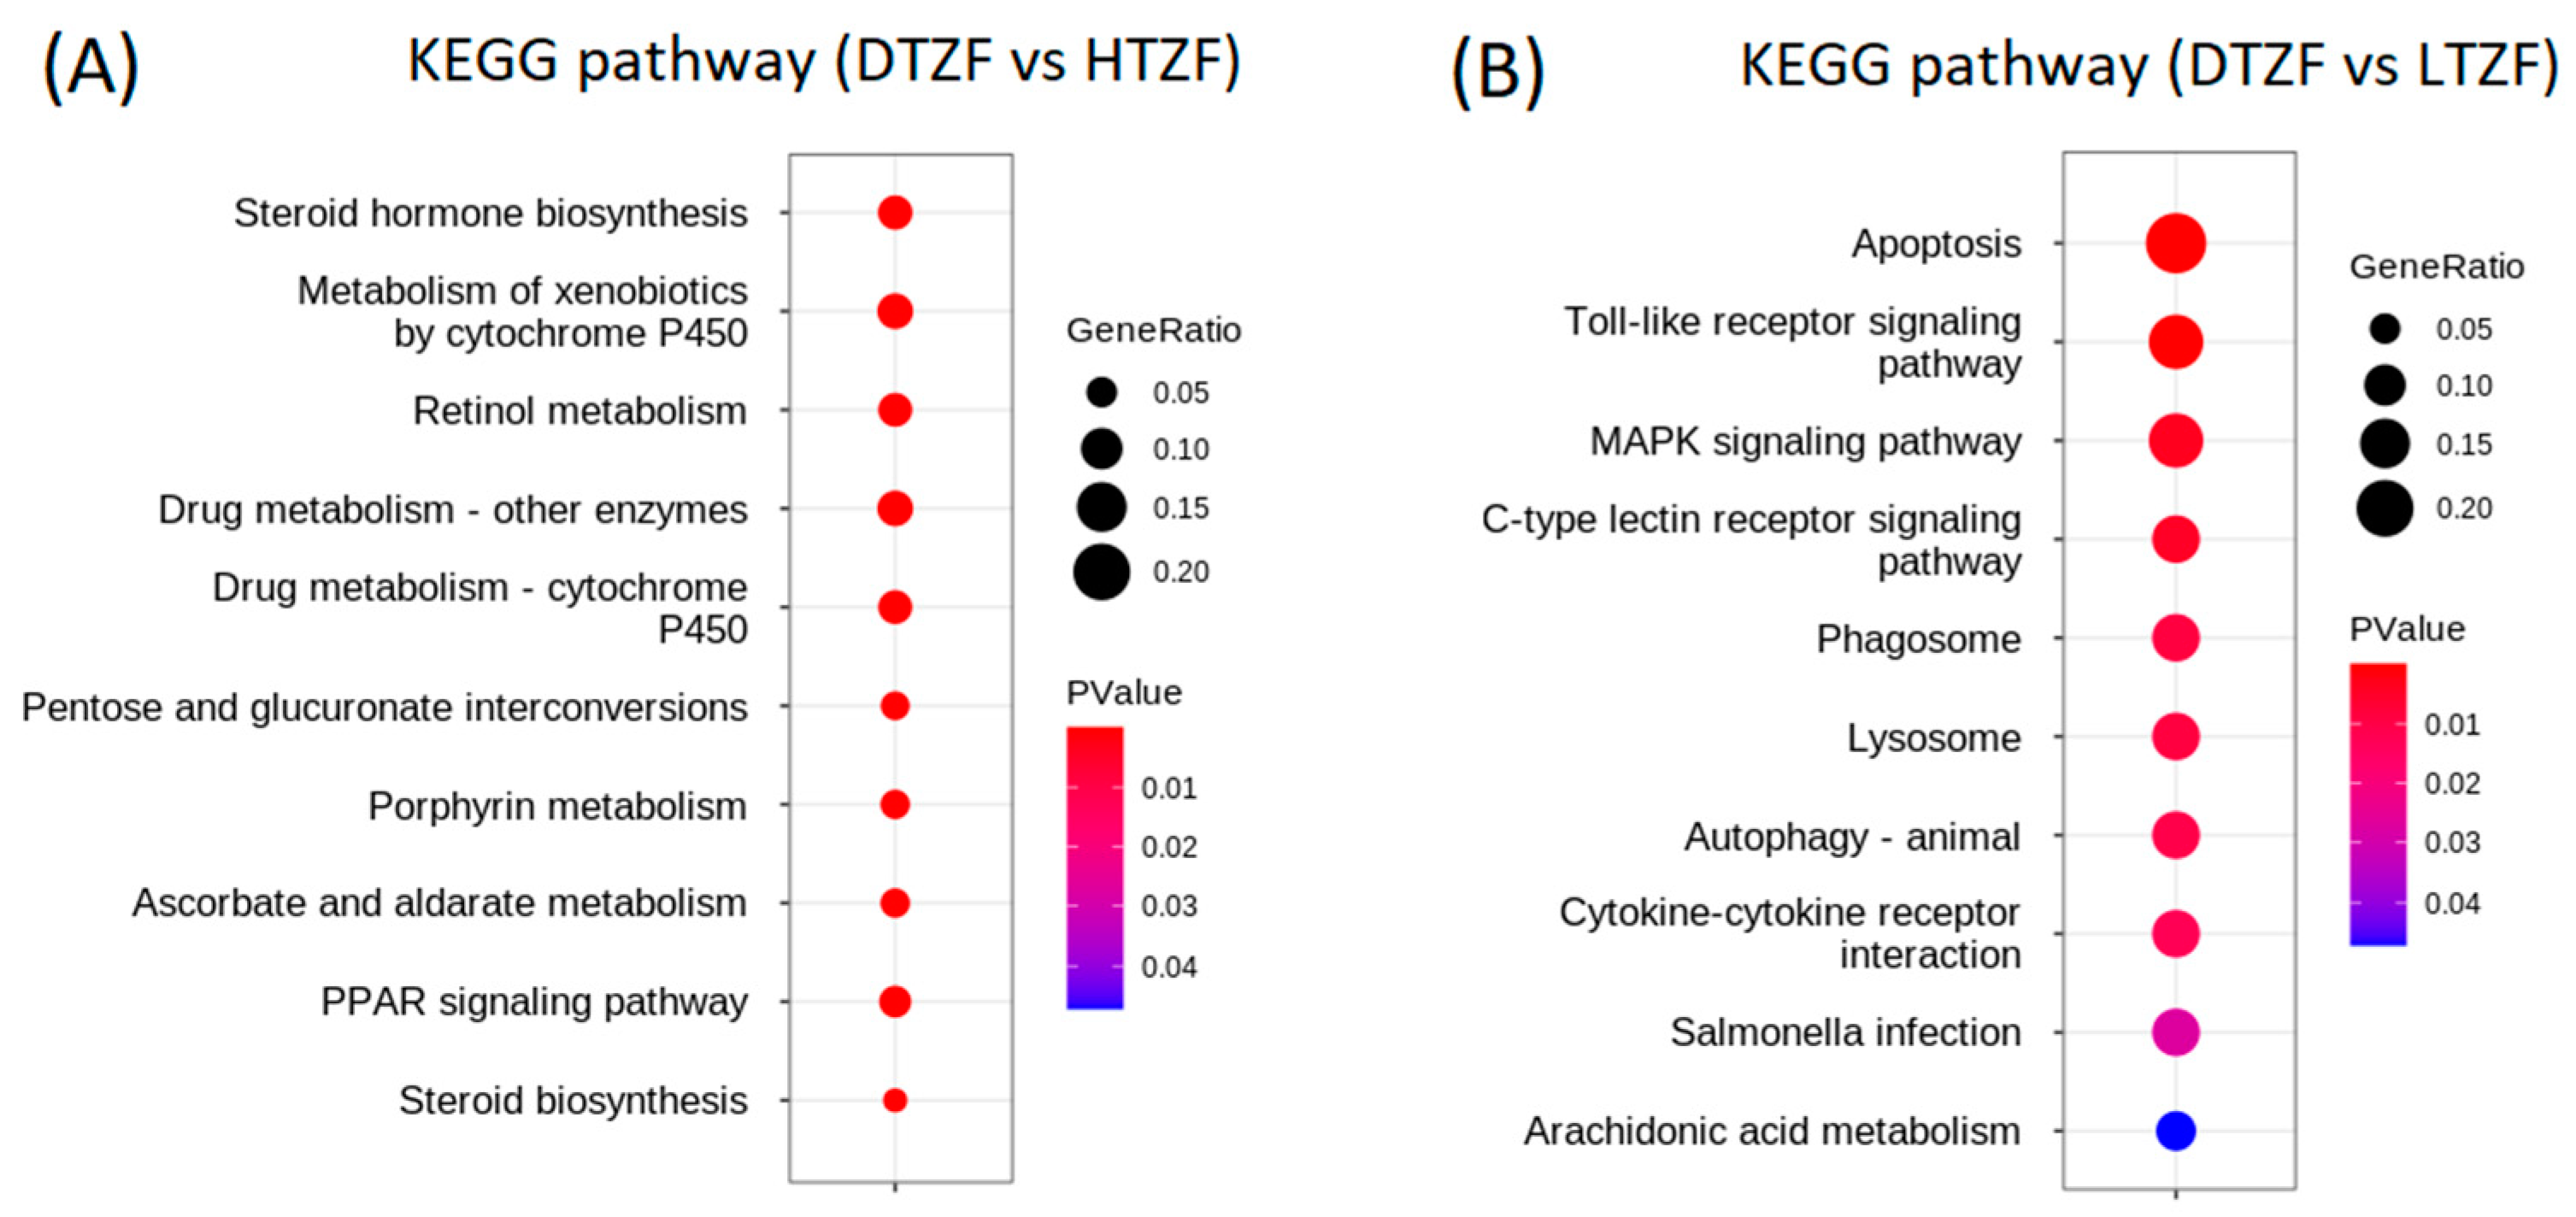
2.4. Kyoto Encyclopedia of Genes and Genomes (KEGG) Pathway Enrichment Analysis
2.5. Quantitative Real-Time Polymerase Chain Reaction (qPCR) Validation of Transcriptome Data
3. Discussion
4. Materials and Methods
4.1. Ethics Statement
4.2. ZF Husbandry and Embryo Selection
4.3. Thiram Treatment and Scoring of Developmental Deformities
4.4. Heartbeat Survey
4.5. Touch-Evoked Escape Response (TEER)
4.6. Body Length Survey
4.7. Statistical Analysis
4.8. RNA-Sequencing
4.9. DEG Selection
4.10. DEG Analysis
4.11. Quantitative Reverse Transcription-Polymerase Chain Reaction Validation
5. Conclusions
Supplementary Materials
Author Contributions
Funding
Institutional Review Board Statement
Informed Consent Statement
Data Availability Statement
Conflicts of Interest
References
- Das, S.K. Mode of action of pesticides and the novel trends—A critical review. Int. Res. J. Agric. Soil Sci. 2013, 3, 393–401. [Google Scholar] [CrossRef]
- Tudi, M.; Daniel Ruan, H.; Wang, L.; Lyu, J.; Sadler, R.; Connell, D.; Chu, C.; Phung, D.T. Agriculture Development, Pesticide Application and Its Impact on the Environment. Int. J. Environ. Res. Public Health 2021, 18, 1112. [Google Scholar] [CrossRef]
- Zubrod, J.P.; Bundschuh, M.; Arts, G.; Brühl, C.A.; Imfeld, G.; Knäbel, A.; Payraudeau, S.; Rasmussen, J.J.; Rohr, J.; Scharmüller, A.; et al. Fungicides: An Overlooked Pesticide Class? Environ. Sci. Technol. 2019, 53, 3347–3365. [Google Scholar] [CrossRef]
- Wang, Y.; Ning, X.; Li, G.; Sang, N. New insights into potential estrogen agonistic activity of triazole fungicides and coupled metabolic disturbance. J. Hazard. Mater. 2022, 424, 127479. [Google Scholar] [CrossRef]
- Robens, J.F. Teratologic studies of carbaryl, diazinon, norea, disulfiram, and thiram in small laboratory animals. Toxicol. Appl. Pharmacol. 1969, 15, 152–163. [Google Scholar] [CrossRef]
- van Boxtel, A.L.; Pieterse, B.; Cenijn, P.; Kamstra, J.H.; Brouwer, A.; van Wieringen, W.; de Boer, J.; Legler, J. Dithiocarbamates Induce Craniofacial Abnormalities and Downregulate sox9a during Zebrafish Development. Toxicol. Sci. 2010, 117, 209–217. [Google Scholar] [CrossRef]
- Nageswara, R.N.R.; Srinivasa, N.B.; Jagadish, M.N. Thiram a fungicide induced toxicity on glycogen and blood glucose level of freshwater fish Cyprinus carpio (Hamilton). Int. J. Fish. Aquat. Stud. 2017, 5, 93–96. [Google Scholar]
- Park, H.; You, H.H.; Song, G. Multiple toxicity of propineb in developing zebrafish embryos: Neurotoxicity, vascular toxicity, and notochord defects in normal vertebrate development. Comp. Biochem. Physiol. Part C Toxicol. Pharmacol. 2021, 243, 108993. [Google Scholar] [CrossRef]
- United States Environmental Protection Agency. Reregistration Eligibility Decision Facts, Thiram. 2004. Available online: https://www3.epa.gov/pesticides/chem_search/reg_actions/reregistration/fs_PC-079801_1-Sep-04.pdf (accessed on 15 October 2022).
- Nieuwenhuizen, P.J.; Reedijk, J.; van Duin, M.; McGill, W.J. Thiuram-and Dithiocarbamate-Accelerated Sulfur Vulcanization from the Chemist’s Perspective; Methods, Materials and Mechanisms Reviewed. Rubber Chem. Technol. 1997, 70, 368–429. [Google Scholar] [CrossRef]
- Maznah, Z.; Halimah, M.; Ismail, B.S. Evaluation of the Persistence and Leaching Behaviour of Thiram Fungicide in Soil, Water and Oil Palm Leaves. Bull. Environ. Contam. Toxicol. 2018, 100, 677–682. [Google Scholar] [CrossRef]
- Cherpak, V.; Bezuglyĭ, V.; Kaskevich, L.M. Health and hygienic characteristics of the working conditions and state of health of persons working with tetramethylthiuramdisulfide (TMTD). Vrach. Delo 1971, 10, 136–139. [Google Scholar]
- Kaskevich, L.; Bezuglyĭ, V.P. Clinical aspects of chronic intoxications induced by TMTD. Vrach. Delo 1973, 6, 128–130. [Google Scholar]
- Hayes, W.J.; Laws, E.R. Handbook of Pesticide Toxicology, 3rd ed.; Academic Press: San Diego, CA, USA, 1991; p. 1576. [Google Scholar]
- Matthiaschk, G. The influence of L-cysteine on the teratogenicity caused by thiram (TMTD) in MMRI mice. Arch. Toxicol 1973, 30, 251. [Google Scholar] [CrossRef]
- Liu, K.; Li, Y.; Iqbal, M.; Tang, Z.; Zhang, H. Thiram exposure in environment: A critical review on cytotoxicity. Chemosphere 2022, 295, 133928. [Google Scholar] [CrossRef]
- Belaid, C.; Sbartai, I. Assessing the effects of Thiram to oxidative stress responses in a freshwater bioindicator cladoceran (Daphnia magna). Chemosphere 2021, 268, 128808. [Google Scholar] [CrossRef]
- Pesticide Properties DataBase, Thiram (Ref: ENT 987). Available online: https://sitem.herts.ac.uk/aeru/ppdb/en/Reports/642.htm (accessed on 20 November 2022).
- Chen, X.; Fang, M.; Chernick, M.; Wang, F.; Yang, J.; Yu, Y.; Zheng, N.; Teraoka, H.; Nanba, S.; Hiraga, T.; et al. The case for thyroid disruption in early life stage exposures to thiram in zebrafish (Danio rerio). Gen. Comp. Endocrinol. 2019, 271, 73–81. [Google Scholar] [CrossRef]
- Vasamsetti, B.M.K.; Chon, K.; Kim, J.; Oh, J.-A.; Yoon, C.-Y.; Park, H.-H. Developmental Toxic Effects of Thiram on Developing Zebrafish (Danio rerio) Embryos. Toxics 2022, 10, 369. [Google Scholar] [CrossRef]
- Park, M.Y.; Krishna Vasamsetti, B.M.; Kim, W.S.; Kang, H.J.; Kim, D.-Y.; Lim, B.; Cho, K.; Kim, J.S.; Chee, H.K.; Park, J.H.; et al. Comprehensive Analysis of Cardiac Xeno-Graft Unveils Rejection Mechanisms. Int. J. Mol. Sci. 2021, 22, 751. [Google Scholar] [CrossRef]
- Bailey, J.; Oliveri, A.; Levin, E.D. Zebrafish model systems for developmental neurobehavioral toxicology. Birth Defects Res. Part C Embryo Today Rev. 2013, 99, 14–23. [Google Scholar] [CrossRef]
- Vasamsetti, B.M.K.; Chon, K.; Kim, J.; Oh, J.-A.; Yoon, C.-Y.; Park, H.-H. Transcriptome-Based Identification of Genes Responding to the Organophosphate Pesticide Phosmet in Danio rerio. Genes 2021, 12, 1738. [Google Scholar] [CrossRef]
- Horzmann, K.A.; Freeman, J.L. Making Waves: New Developments in Toxicology With the Zebrafish. Toxicol. Sci. 2018, 163, 5–12. [Google Scholar] [CrossRef]
- Gierten, J.; Pylatiuk, C.; Hammouda, O.T.; Schock, C.; Stegmaier, J.; Wittbrodt, J.; Gehrig, J.; Loosli, F. Automated High-throughput Heartbeat Quantification in Medaka and Zebrafish Embryos Under Physiological Conditions. Sci. Rep. 2020, 10, 2046. [Google Scholar] [CrossRef]
- Lushchak, V.I.; Matviishyn, T.M.; Husak, V.V.; Storey, J.M.; Storey, K.B. Pesticide toxicity: A mechanistic approach. EXCLI J. 2018, 17, 1101. [Google Scholar] [CrossRef]
- Stoker, T.E.; Goldman, J.M.; Cooper, R.L. The dithiocarbamate fungicide thiram disrupts the hormonal control of ovulation in the female rat. Reprod. Toxicol. 1993, 7, 211–218. [Google Scholar] [CrossRef]
- Schiffer, L.; Barnard, L.; Baranowski, E.S.; Gilligan, L.C.; Taylor, A.E.; Arlt, W.; Shackleton, C.H.L.; Storbeck, K.-H. Human steroid biosynthesis, metabolism and excretion are differentially reflected by serum and urine steroid metabolomes: A comprehensive review. J. Steroid Biochem. Mol. Biol. 2019, 194, 105439. [Google Scholar] [CrossRef]
- Silva, M.; Carvalho, M.D.G. Detoxification enzymes: Cellular metabolism and susceptibility to various diseases. Rev. Assoc. Med. Bras. 2018, 64, 307–310. [Google Scholar] [CrossRef]
- Chouinard, S.; Yueh, M.-F.; Tukey, R.H.; Giton, F.; Fiet, J.; Pelletier, G.; Barbier, O.; Bélanger, A. Inactivation by UDP-glucuronosyltransferase enzymes: The end of androgen signaling. J. Steroid Biochem. Mol. Biol. 2008, 109, 247–253. [Google Scholar] [CrossRef]
- Tsuchiya, Y.; Nakajima, M.; Yokoi, T. Cytochrome P450-mediated metabolism of estrogens and its regulation in human. Cancer Lett. 2005, 227, 115–124. [Google Scholar] [CrossRef]
- García-García, M.; Sánchez-Hernández, M.; García-Hernández, M.P.; García-Ayala, A.; Chaves-Pozo, E. Role of 5α-dihydrotestosterone in testicular development of gilthead seabream following finasteride administration. J. Steroid Biochem. Mol. Biol. 2017, 174, 48–55. [Google Scholar] [CrossRef]
- Ozaki, Y.; Higuchi, M.; Miura, C.; Yamaguchi, S.; Tozawa, Y.; Miura, T. Roles of 11β-Hydroxysteroid Dehydrogenase in Fish Spermatogenesis. Endocrinology 2006, 147, 5139–5146. [Google Scholar] [CrossRef]
- Männistö, P.T.; Ulmanen, I.; Lundström, K.; Taskinen, J.; Tenhunen, J.; Tilgmann, C.; Kaakkola, S. Characteristics of catechol O-methyltransferase (COMT) and properties of selective COMT inhibitors. In Progress in Drug Research/Fortschritte der Arzneimittelforschung/Progrès des Recherches Pharmaceutiques; Birkhäuser Basel: Basel, Switzerland, 1992; pp. 291–350. [Google Scholar]
- Phoenix, C.H.; Goy, R.W.; Gerall, A.A.; Young, W.C. Organizing action of prenatally administered testosterone propionate on the tissues mediating mating behavior in the female guinea pig 1. Endocrinology 1959, 65, 369–382. [Google Scholar] [CrossRef]
- van den Hurk, R.; Schoonen, W.G.E.J.; van Zoelen, G.A.; Lambert, J.G.D. The biosynthesis of steroid glucuronides in the testis of the zebrafish, Brachydanio rerio, and their pheromonal function as ovulation inducers. Gen. Comp. Endocrinol. 1987, 68, 179–188. [Google Scholar] [CrossRef] [PubMed]
- DeAngelis, A.M.; Roy-O’Reilly, M.; Rodriguez, A. Genetic Alterations Affecting Cholesterol Metabolism and Human Fertility1. Biol. Reprod. 2014, 91, 1–10. [Google Scholar] [CrossRef]
- Sharpe, L.J.; Brown, A.J. Controlling Cholesterol Synthesis beyond 3-Hydroxy-3-methylglutaryl-CoA Reductase (HMGCR). J. Biol. Chem. 2013, 288, 18707–18715. [Google Scholar] [CrossRef] [PubMed]
- Huff, M.; Telford, D. Lord of the rings—The mechanism for oxidosqualene:lanosterol cyclase becomes crystal clear. Trends Pharmacol. Sci. 2005, 26, 335–340. [Google Scholar] [CrossRef]
- Labit-Le Bouteiller, C.; Jamme, M.F.; David, M.; Silve, S.; Lanau, C.; Dhers, C.; Picard, C.; Rahier, A.; Taton, M.; Loison, G.; et al. Antiproliferative effects of SR31747A in animal cell lines are mediated by inhibition of cholesterol biosynthesis at the sterol isomerase step. Eur. J. Biochem. 1998, 256, 342–349. [Google Scholar] [CrossRef] [PubMed]
- Horling, A.; Müller, C.; Barthel, R.; Bracher, F.; Imming, P. A New Class of Selective and Potent 7-Dehydrocholesterol Reductase Inhibitors. J. Med. Chem. 2012, 55, 7614–7622. [Google Scholar] [CrossRef]
- Alsop, D.; Matsumoto, J.; Brown, S.; Van Der Kraak, G. Retinoid requirements in the reproduction of zebrafish. Gen. Comp. Endocrinol. 2008, 156, 51–62. [Google Scholar] [CrossRef]
- Clagett-Dame, M.; Knutson, D. Vitamin A in Reproduction and Development. Nutrients 2011, 3, 385–428. [Google Scholar] [CrossRef]
- Hardy, D.M.; Garbers, D.L. A Sperm Membrane Protein That Binds in a Species-specific Manner to the Egg Extracellular Matrix Is Homologous to von Willebrand Factor. J. Biol. Chem. 1995, 270, 26025–26028. [Google Scholar] [CrossRef]
- Keskus, A.G.; Tombaz, M.; Arici, B.I.; Dincaslan, F.B.; Nabi, A.; Shehwana, H.; Konu, O.K. ace2 expression is higher in intestines and liver while being tightly regulated in development and disease in zebrafish. bioRxiv 2020. [Google Scholar] [CrossRef]
- Gansner, J.M.; Mendelsohn, B.A.; Hultman, K.A.; Johnson, S.L.; Gitlin, J.D. Essential role of lysyl oxidases in notochord development. Dev. Biol. 2007, 307, 202–213. [Google Scholar] [CrossRef]
- Chen, Y.-H.; Lin, J.-S. A novel zebrafish mutant with wavy-notochord: An effective biological index for monitoring the copper pollution of water from natural resources. Environ. Toxicol. 2011, 26, 103–109. [Google Scholar] [CrossRef]
- Brum, A.M.; van der Leije, C.S.; Schreuders-Koedam, M.; Chaibi, S.; van Leeuwen, J.P.; van der Eerden, B.C. Mucin 1 (Muc1) Deficiency in Female Mice Leads to Temporal Skeletal Changes During Aging. JBMR Plus 2018, 2, 341–350. [Google Scholar] [CrossRef]
- Anderson, R.A.; Schwalbach, K.T.; Mui, S.R.; LeClair, E.E.; Topczewska, J.M.; Topczewski, J. Zebrafish models of skeletal dysplasia induced by cholesterol biosynthesis deficiency. Dis. Model. Mech. 2020, 13, dmm042549. [Google Scholar] [CrossRef]
- Aughton, D.J.; Kelley, R.I.; Metzenberg, A.; Pureza, V.; Pauli, R.M. X-linked dominant chondrodysplasia punctata (CDPX2) caused by single gene mosaicism in a male. Am. J. Med. Genet. Part A 2003, 116, 255–260. [Google Scholar] [CrossRef]
- Tang, W.J.; Fernandez, J.G.; Sohn, J.J.; Amemiya, C.T. Chitin is Endogenously Produced in Vertebrates. Curr. Biol. 2015, 25, 897–900. [Google Scholar] [CrossRef]
- Semino, C.E.; Allende, M.L. Chitin oligosaccharides as candidate patterning agents in zebrafish embryogenesis. Int. J. Dev. Biol. 2000, 44, 183–193. [Google Scholar]
- Schütte, A.; Lottaz, D.; Sterchi, E.E.; Stöcker, W.; Becker-Pauly, C. Two α subunits and one β subunit of meprin zinc-endopeptidases are differentially expressed in the zebrafish Danio rerio. Biol. Chem. 2007, 388, 523–531. [Google Scholar] [CrossRef]
- Schütte, A.; Hedrich, J.; Stöcker, W.; Becker-Pauly, C. Let It Flow: Morpholino Knockdown in Zebrafish Embryos Reveals a Pro-Angiogenic Effect of the Metalloprotease Meprin α2. PLoS ONE 2010, 5, e8835. [Google Scholar] [CrossRef]
- Avcilar-Kucukgoze, I.; Kashina, A. Hijacking tRNAs from Translation: Regulatory Functions of tRNAs in Mammalian Cell Physiology. Front. Mol. Biosci. 2020, 7, 610617. [Google Scholar] [CrossRef]
- Reverendo, M.; Soares, A.R.; Pereira, P.M.; Carreto, L.; Ferreira, V.; Gatti, E.; Pierre, P.; Moura, G.R.; Santos, M.A. TRNA mutations that affect decoding fidelity deregulate development and the proteostasis network in zebrafish. RNA Biol. 2014, 11, 1199–1213. [Google Scholar] [CrossRef]
- Vasamsetti, B.M.K.; Liu, Z.; Park, Y.-S.; Cho, N.J. Muscarinic acetylcholine receptors regulate the dephosphorylation of eukaryotic translation elongation factor 2 in SNU-407 colon cancer cells. Biochem. Biophys. Res. Commun. 2019, 516, 424–429. [Google Scholar] [CrossRef]
- Park, Y.-S.; Liu, Z.; Vasamsetti, B.M.K.; Cho, N.J. The ERK1/2 and mTORC1 Signaling Pathways Are Involved in the Muscarinic Acetylcholine Receptor-Mediated Proliferation of SNU-407 Colon Cancer Cells. J. Cell. Biochem. 2016, 117, 2854–2863. [Google Scholar] [CrossRef]
- Solingen, C.; Bijkerk, R.; de Boer, H.; Rabelink, T.; van Zonneveld, A. The Role of microRNA-126 in Vascular Homeostasis. Curr. Vasc. Pharmacol. 2015, 13, 341–351. [Google Scholar] [CrossRef]
- Chen, J.; Zhu, R.-F.; Li, F.-F.; Liang, Y.-L.; Wang, C.; Qin, Y.-W.; Huang, S.; Zhao, X.-X.; Jing, Q. MicroRNA-126a Directs Lymphangiogenesis Through Interacting With Chemokine and Flt4 Signaling in Zebrafish. Arterioscler. Thromb. Vasc. Biol. 2016, 36, 2381–2393. [Google Scholar] [CrossRef]
- Indrieri, A.; Carrella, S.; Carotenuto, P.; Banfi, S.; Franco, B. The Pervasive Role of the miR-181 Family in Development, Neurodegeneration, and Cancer. Int. J. Mol. Sci. 2020, 21, 2092. [Google Scholar] [CrossRef]
- Yin, V.P.; Lepilina, A.; Smith, A.; Poss, K.D. Regulation of zebrafish heart regeneration by miR-133. Dev. Biol. 2012, 365, 319–327. [Google Scholar] [CrossRef]
- Mishima, Y.; Abreu-Goodger, C.; Staton, A.A.; Stahlhut, C.; Shou, C.; Cheng, C.; Gerstein, M.; Enright, A.J.; Giraldez, A.J. Zebrafish miR-1 and miR-133 shape muscle gene expression and regulate sarcomeric actin organization. Genes Dev. 2009, 23, 619–632. [Google Scholar] [CrossRef]
- Sant, K.E.; Timme-Laragy, A.R. Zebrafish as a Model for Toxicological Perturbation of Yolk and Nutrition in the Early Embryo. Curr. Environ. Health Rep. 2018, 5, 125–133. [Google Scholar] [CrossRef]
- Helvik, J.V.; Walther, B.T. Development of hatchability in halibut (Hippoglossus hippoglossus) embryos. Int. J. Dev. Biol. 1993, 37, 487–490. [Google Scholar]
- Kimmel, C.B.; Ballard, W.W.; Kimmel, S.R.; Ullmann, B.; Schilling, T.F. Stages of embryonic development of the zebrafish. Dev. Dyn. 1995, 203, 253–310. [Google Scholar] [CrossRef] [PubMed]
- Cao, F.; Souders, C.L.; Li, P.; Pang, S.; Liang, X.; Qiu, L.; Martyniuk, C.J. Developmental neurotoxicity of maneb: Notochord defects, mitochondrial dysfunction and hypoactivity in zebrafish (Danio rerio) embryos and larvae. Ecotoxicol. Environ. Saf. 2019, 170, 227–237. [Google Scholar] [CrossRef]
- Cao, F.; Souders, C.L.; Li, P.; Adamovsky, O.; Pang, S.; Qiu, L.; Martyniuk, C.J. Developmental toxicity of the fungicide ziram in zebrafish (Danio rerio). Chemosphere 2019, 214, 303–313. [Google Scholar] [CrossRef] [PubMed]
- Trikić, M.Z.; Monk, P.; Roehl, H.; Partridge, L.J. Regulation of Zebrafish Hatching by Tetraspanin cd63. PLoS ONE 2011, 6, e19683. [Google Scholar] [CrossRef] [PubMed]
- Vasamsetti, B.M.K.; Kim, N.S.; Chon, K.; Park, H.-H. Developmental Toxic Effects of Phosmet on Zebrafish (Danio rerio) Embryos. Korean J. Pestic. Sci. 2020, 24, 343–351. [Google Scholar] [CrossRef]
- Vasamsetti, B.M.K.; Kim, N.-S.; Chon, K.; Park, H.-H. Teratogenic and developmental toxic effects of etridiazole on zebrafish (Danio rerio) embryos. Appl. Biol. Chem. 2020, 63, 80. [Google Scholar] [CrossRef]
- Sogard, S. Size-selective mortality in the juvenile stage of teleost fishes: A review. Bull. Mar. Sci. 1997, 60, 1129–1157. [Google Scholar]
- Strähle, U.; Scholz, S.; Geisler, R.; Greiner, P.; Hollert, H.; Rastegar, S.; Schumacher, A.; Selderslaghs, I.; Weiss, C.; Witters, H.; et al. Zebrafish embryos as an alternative to animal experiments—A commentary on the definition of the onset of protected life stages in animal welfare regulations. Reprod. Toxicol. 2012, 33, 128–132. [Google Scholar] [CrossRef] [PubMed]
- Nagel, R. DarT: The embryo test with the zebrafish Danio rerio--a general model in ecotoxicology and toxicology. ALTEX 2002, 19, 38–48. [Google Scholar]


| Time | Deformity (%) | DMZF (DMSO) | LTZF (0.4 µg/L Thiram) | HTZF (4.0 µg/L Thiram) |
|---|---|---|---|---|
| 24 hpf | Edema symptoms | 1.71 ± 1.48 | 1.71 ± 2.96 | 12.80 ± 5.47 |
| Abnormal somites | 1.66 ± 1.44 | 3.40 ± 1.50 | 50.83 ± 6.29 * | |
| 48 hpf | Low retina pigment | 3.42 ± 1.59 | 2.59 ± 2.56 | 31.84 ± 8.07 * |
| Abnormal tail blood flow | 3.42 ± 1.59 | 1.71 ± 2.96 | 22.16 ± 4.45 * | |
| 72 hpf | Unhatched embryos | 0.88 ± 1.52 | 3.47 ± 1.44 | 99.05 ± 1.65 * |
| Pericardial edema | 1.69 ± 1.46 | 6.08 ± 1.41 | 32.20 ± 6.38 * | |
| Yolk sac edema | 0 | 2.56 ± 2.56 | 37.10 ± 5.49 * | |
| 96 hpf | Unhatched embryos | 0.88 ± 1.52 | 1.78 ± 1.54 | 99.02 ± 1.70 * |
| 144 hpf | Body curvature | 0 | 0 | 100.00 * |
| Wavy distortions of notochord | 0 | 0 | 99.02 ± 1.70 * | |
| Abnormal touch response | 0 | 0 | 46.10 ± 6.95 * |
| Samples | Total Reads | Clean Reads | Mapped Reads | Mapped Rate (%) | GC (%) | Q20 (%) | Q30 (%) |
|---|---|---|---|---|---|---|---|
| DMZF-1 | 63,609,300 | 62,755,930 | 55,712,761 | 88.78 | 43.38 | 98.16 | 94.43 |
| DMZF-2 | 74,512,768 | 73,530,624 | 65,089,037 | 88.52 | 43.07 | 98.22 | 94.65 |
| DMZF-3 | 80,690,306 | 79,497,952 | 70,496,653 | 88.68 | 43.37 | 98.02 | 94.11 |
| LTZF-1 | 80,299,462 | 79,177,492 | 70,038,625 | 88.46 | 43.65 | 98.18 | 94.57 |
| LTZF-2 | 75,717,900 | 74,610,672 | 66,263,993 | 88.81 | 43.82 | 98.04 | 94.17 |
| LTZF-3 | 78,087,892 | 76,903,732 | 67,627,127 | 87.94 | 43.11 | 97.96 | 93.97 |
| HTZF-1 | 77,703,262 | 76,496,736 | 64,893,724 | 84.83 | 43.35 | 98.05 | 94.27 |
| HTZF-2 | 76,694,784 | 75,460,228 | 63,576,050 | 84.25 | 43.23 | 97.99 | 94.13 |
| HTZF-3 | 74,987,914 | 73,935,572 | 61,222,810 | 82.81 | 43.68 | 98.18 | 94.55 |
| Term | Genes | p-Values | FDR |
|---|---|---|---|
| Metabolism of xenobiotics by cytochrome P450 | ugt5a2, ugt5a4, ugt5a1, gsto1, ugt1a1, ugt1a7, ugt5b3, ugt1ab, zgc:77938, gstp2, ugt5d1, ugt5b4, ugt2a1, ugt2a4, ugt1a4, ugt1a5, ugt1a2, ugt1a6, gsta.1, ugt5b1, ugt1b2, ugt2b1, mgst1.2, cbr1, gstt1a, cbr1l, akr7a3, ugt2b3, ugt5g1, hsd11b1la, dhdhl, gsto2, ephx1, gstt2, gstt1b, adh8b | 3.0421 × 10−40 | 4.2893 × 10−38 |
| Drug metabolism—cytochrome P450 | gstt18, gstt33, gstt16, gstt9, gstt17, gstt23, gstt31, gstt7, gstt5, gstt11, gstt32, gstt19, gstt21, gstt20, gstt29, gstt27, gstt22, gstt26, gstt6, gstt30, gstt24, gstt25, gstt8, gstt13, gstt14, gstt28, gstt15, gstt12, gstt10, gstt2, gstt3, gstt4 | 1.2906 × 10⁻³⁴ | 9.1369 × 10⁻³³ |
| Drug metabolism—other enzymes | gstt52, gstt68, gstt50, gstt41, gstt51, gstt58, gstt66, gstt39, gstt45, gstt67, gstt53, gstt55, gstt54, gstt64, gstt47, gstt62, gstt69, gstt57, gstt61, gstt38, gstt65, gstt37, gstt59, gstt60, gstt40, gstt48, gstt56, gstt46, gstt63, gstt49, gstt42, gstt44, gstt43, gstt35, gstt36, gstt34 | 2.9616 × 10⁻³⁴ | 1.3919 × 10⁻³² |
| Steroid hormone biosynthesis | ugt5a2, ugt5a4, cyp3a65, ugt5a1, cyp3c3, ugt1a1, ugt1a7, cyp3c4, ugt5b3, cyp7a1, srd5a2a, ugt1ab, ugt5d1, ugt5b4, zgc:92630, ugt2a1, ugt2a4, ugt1a4, ugt1a5, ugt1a2, sult2st2, ugt1a6, dhrs11b, ugt5b1, ugt1b2, ugt2b1, hsd3b1, ugt2b3, ugt5g1, hsd11b1la, cyp7a1b, comta, hsd17b7 | 5.2260 × 10⁻³⁴ | 1.8421 × 10⁻³² |
| Retinol metabolism | ugt5a2, ugt5a4, si:ch1073-13h15.3, cyp3a65, ugt5a1, cyp3c3, bco1l, ugt1a1, ugt1a7, cyp3c4, ugt5b3, ugt1ab, zgc:77938, ugt5d1, ugt5b4, si:ch211-107o10.3, ugt2a1, ugt2a4, ugt1a4, ugt1a5, ugt1a2, ugt1a6, dgat1a, ugt5b1, ugt1b2, ugt2b1, retsat, ugt2b3, ugt5g1 adh8b, lrata | 1.8112 × 10⁻³⁰ | 5.1092 × 10⁻²⁹ |
| PPAR signaling pathway | fabp6, cd36, fabp2, cyp7a1, fads2, cyp8b1, fabp1b.1, acsl5, cyp8b3, cyp8b2, si:ch211-113j14.1, acsl1b, acadm, acox1, slc27a4, cyp7a1b, zgc:101540, cpt2, slc27a2b, scp2a, si:dkey-91i10.3, acsbg1, hmgcs1, acadl, aqp7, slc27a2a, LOC568656, plin1 | 1.0274 × 10⁻²⁴ | 2.4144 × 10⁻²³ |
| Ascorbate and aldarate metabolism | ugt5a2, ugt5a4, ugt5a1, ugt1a1, ugt1a7, ugt5b3, ugt1ab, ugt5d1, ugt5b4, ugt2a1, ugt2a4, ugt1a4, ugt1a5, ugt1a2, ugt1a6, ugt5b1, ugt1b2, ugt2b1, ugdh, ugt2b3, ugt5g1, aldh7a1, aldh3a2b | 1.2422 × 10⁻²³ | 2.5021 × 10⁻²² |
| Pentose and glucuronate interconversions | ugt5a2, ugt5a4, ugt5a1, ugt1a1, ugt1a7, ugt5b3, ugt1ab, ugt5d1, ugt5b4, ugt2a1, ugt2a4, ugt1a4, ugt1a5, ugt1a2, ugt1a6, ugt5b1, ugt1b2, ugt2b1, ugdh, ugt2b3, ugt5g1, dhdhl | 2.6641 × 10⁻²² | 4.6954 × 10⁻²¹ |
| Porphyrin metabolism | ugt5a2, ugt5a4, ugt5a1, ugt1a1, ugt1a7, ugt5b3, ugt1ab, ugt5d1, ugt5b4, ugt2a1, ugt2a4, ugt1a4, ugt1a5, ugt1a2, ugt1a6, ugt5b1, ugt1b2, ugt2b1, fech, blvra, ugt2b3, ugt5g1, alas2 | 8.1199 × 10⁻²² | 1.2721 × 10⁻²⁰ |
| Steroid biosynthesis | cel.2, cel.1, msmo1, ebp, sc5d, nsdhl, cyp2r1, lss, cyp51, sqlea, hsd17b7, dhcr7, soat2, cyp24a1 | 1.3069 × 10⁻¹⁷ | 1.8427 × 10⁻¹⁷ |
| Gene Symbol | Fold Change (RNA-seq) | Fold Change (qPCR) (Mean ± SD) |
|---|---|---|
| hbae5 | 15.26 | 31.01 ± 9.62 |
| socs3a | 8.22 | 7.99 ± 2.33 |
| Tcap | 7.69 | 6.35 ± 2.98 |
| egln3 | 6.14 | 3.57 ± 3.24 |
| jdp2b | 5.73 | 4.67 ± 1.15 |
| Smtlb | 5.10 | 4.67 ± 2.07 |
| ela2 | −57.17 | −47.72 ± 15.61 |
| chia.2 | −38.59 | −25.56 ± 11.17 |
| aoc1 | −27.60 | −3.21 ± 1.13 |
| ugt5a4 | −24.68 | -22.54 ± 3.75 |
Disclaimer/Publisher’s Note: The statements, opinions and data contained in all publications are solely those of the individual author(s) and contributor(s) and not of MDPI and/or the editor(s). MDPI and/or the editor(s) disclaim responsibility for any injury to people or property resulting from any ideas, methods, instructions or products referred to in the content. |
© 2023 by the authors. Licensee MDPI, Basel, Switzerland. This article is an open access article distributed under the terms and conditions of the Creative Commons Attribution (CC BY) license (https://creativecommons.org/licenses/by/4.0/).
Share and Cite
Vasamsetti, B.M.K.; Chon, K.; Choi, J.-Y.; Kim, J.; Yoon, C.-Y. Transcriptome Analysis of Thiram-Treated Zebrafish (Danio rerio) Embryos Reveals Disruption of Reproduction Signaling Pathways. Biology 2023, 12, 156. https://doi.org/10.3390/biology12020156
Vasamsetti BMK, Chon K, Choi J-Y, Kim J, Yoon C-Y. Transcriptome Analysis of Thiram-Treated Zebrafish (Danio rerio) Embryos Reveals Disruption of Reproduction Signaling Pathways. Biology. 2023; 12(2):156. https://doi.org/10.3390/biology12020156
Chicago/Turabian StyleVasamsetti, Bala Murali Krishna, Kyongmi Chon, Ji-Yeong Choi, Juyeong Kim, and Chang-Young Yoon. 2023. "Transcriptome Analysis of Thiram-Treated Zebrafish (Danio rerio) Embryos Reveals Disruption of Reproduction Signaling Pathways" Biology 12, no. 2: 156. https://doi.org/10.3390/biology12020156
APA StyleVasamsetti, B. M. K., Chon, K., Choi, J.-Y., Kim, J., & Yoon, C.-Y. (2023). Transcriptome Analysis of Thiram-Treated Zebrafish (Danio rerio) Embryos Reveals Disruption of Reproduction Signaling Pathways. Biology, 12(2), 156. https://doi.org/10.3390/biology12020156