
Simulation Modeling Unveils the Unalike Effects of Alternative Strategies for Waterbird Conservation in the Coastal Wetlands of Sardinia (Italy)


Abstract
:Simple Summary
Abstract
1. Introduction
2. Materials and Methods
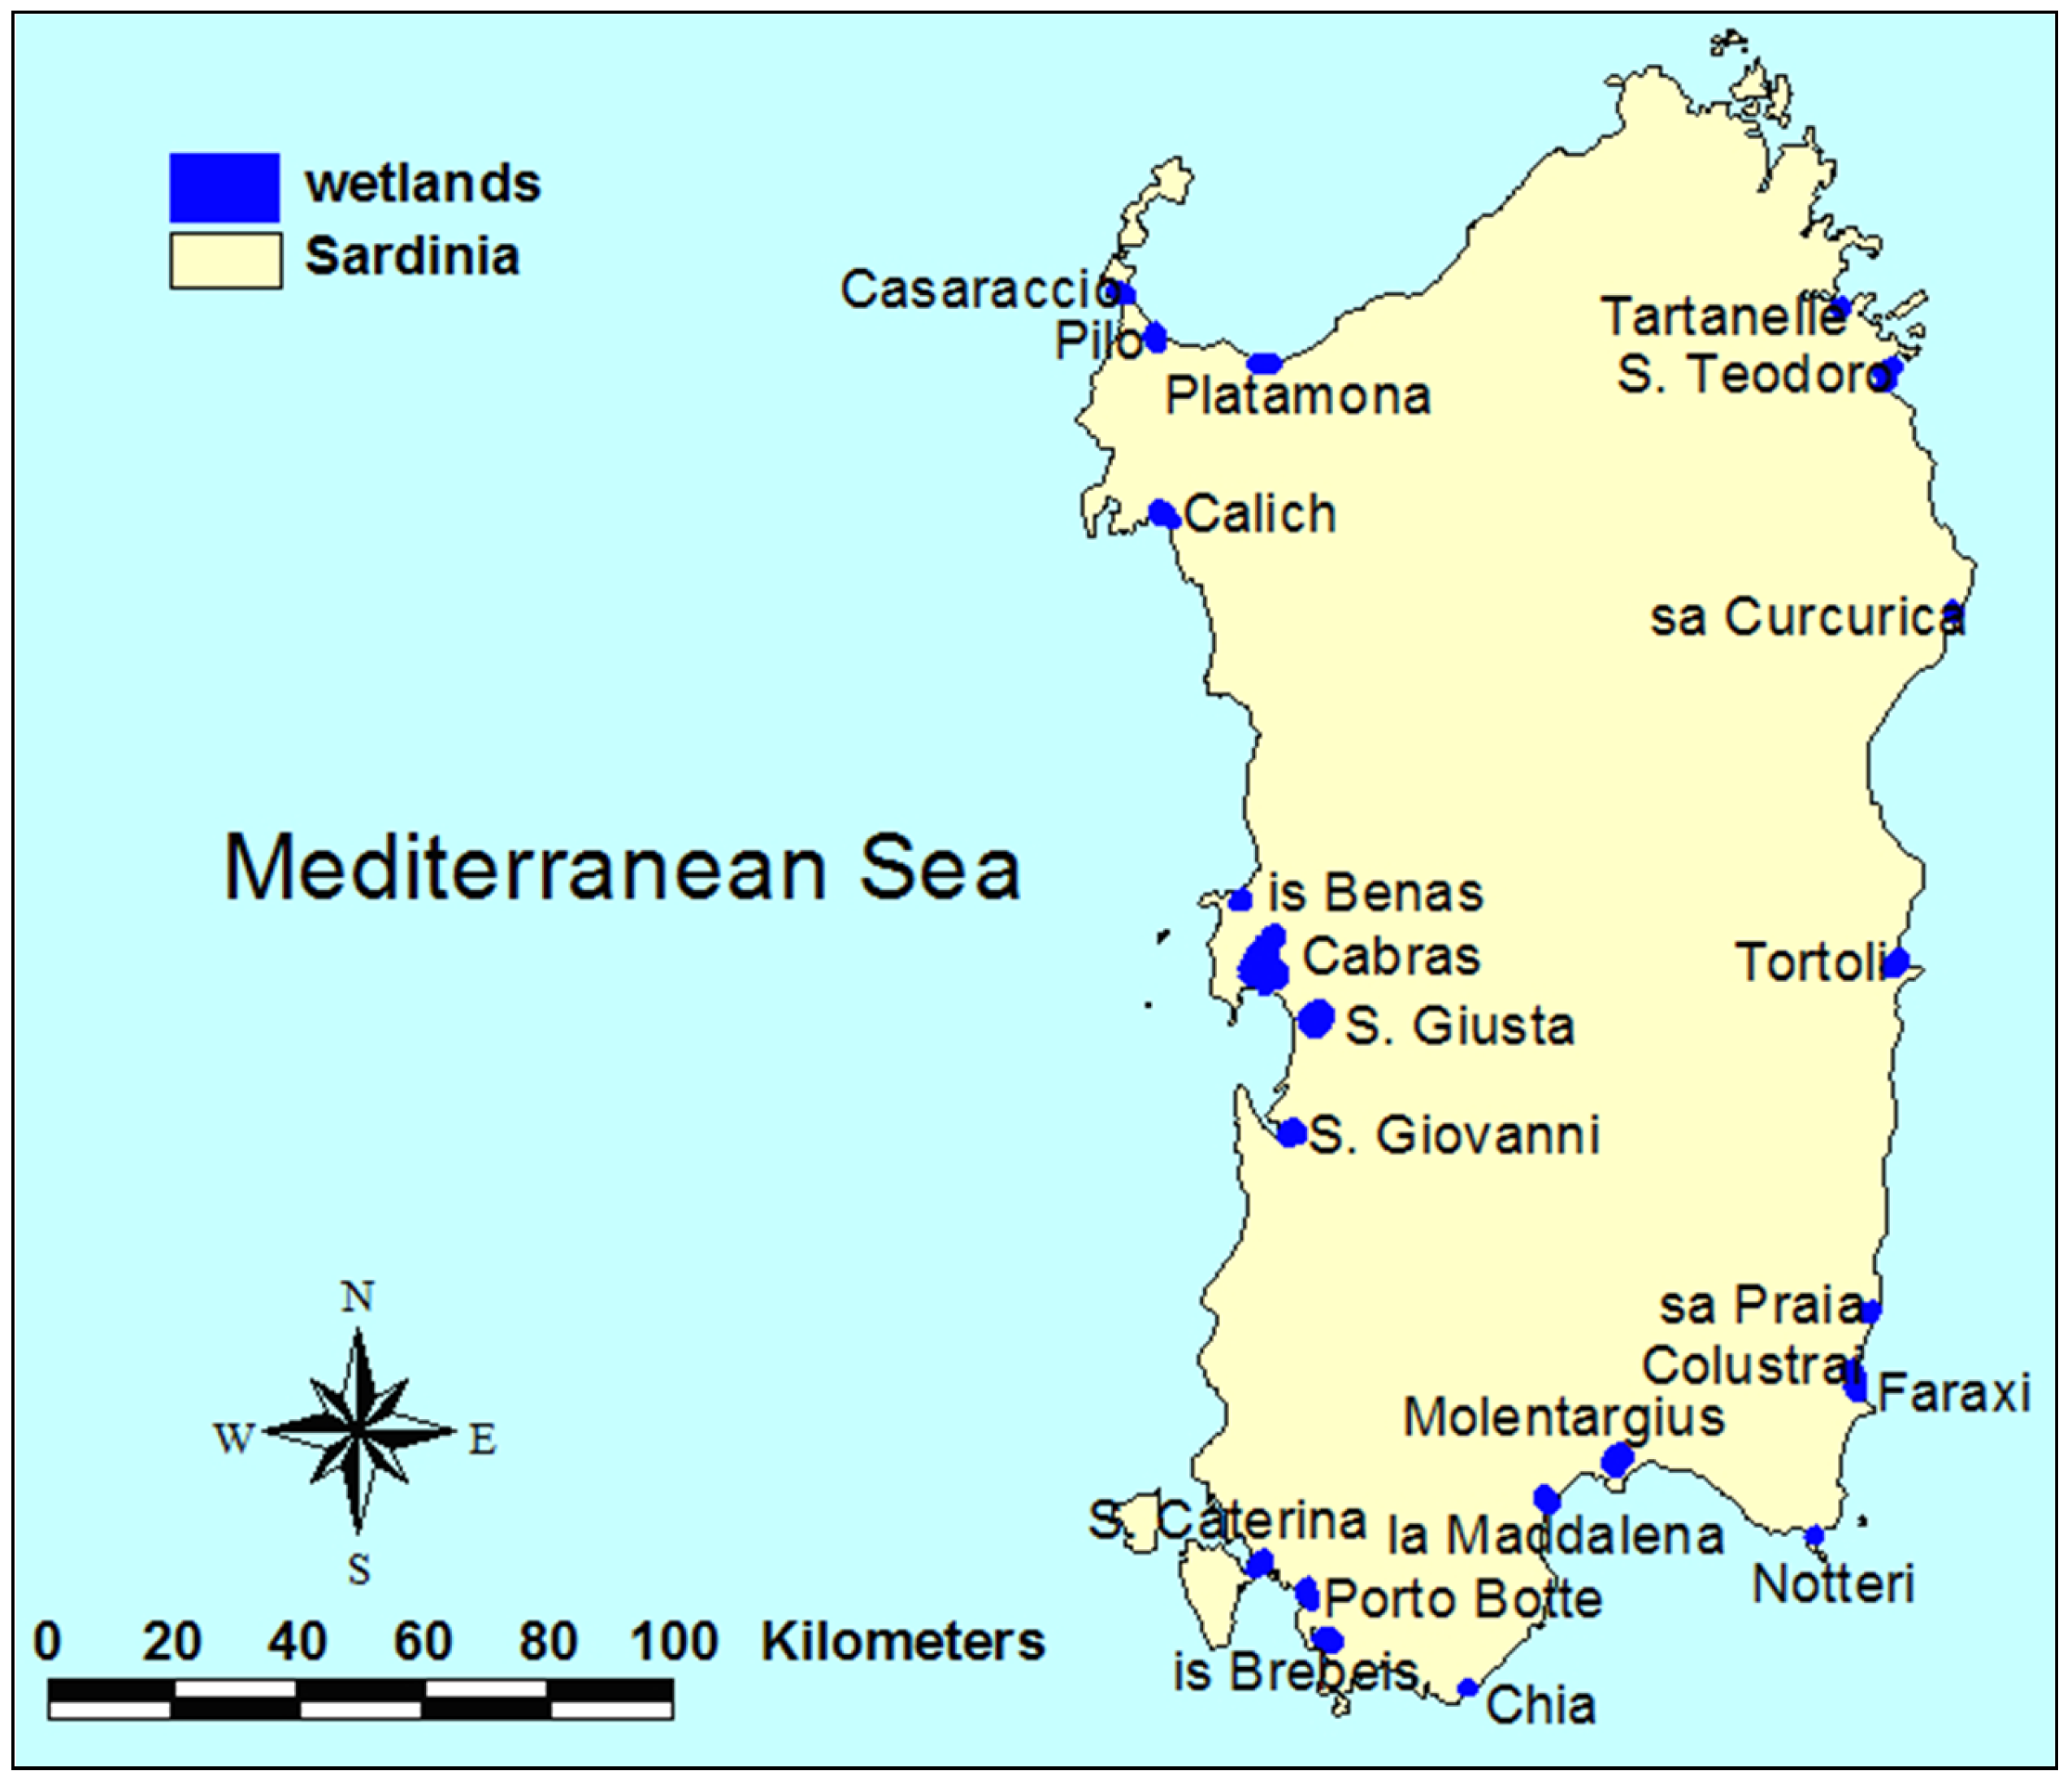
2.1. Field Surveys
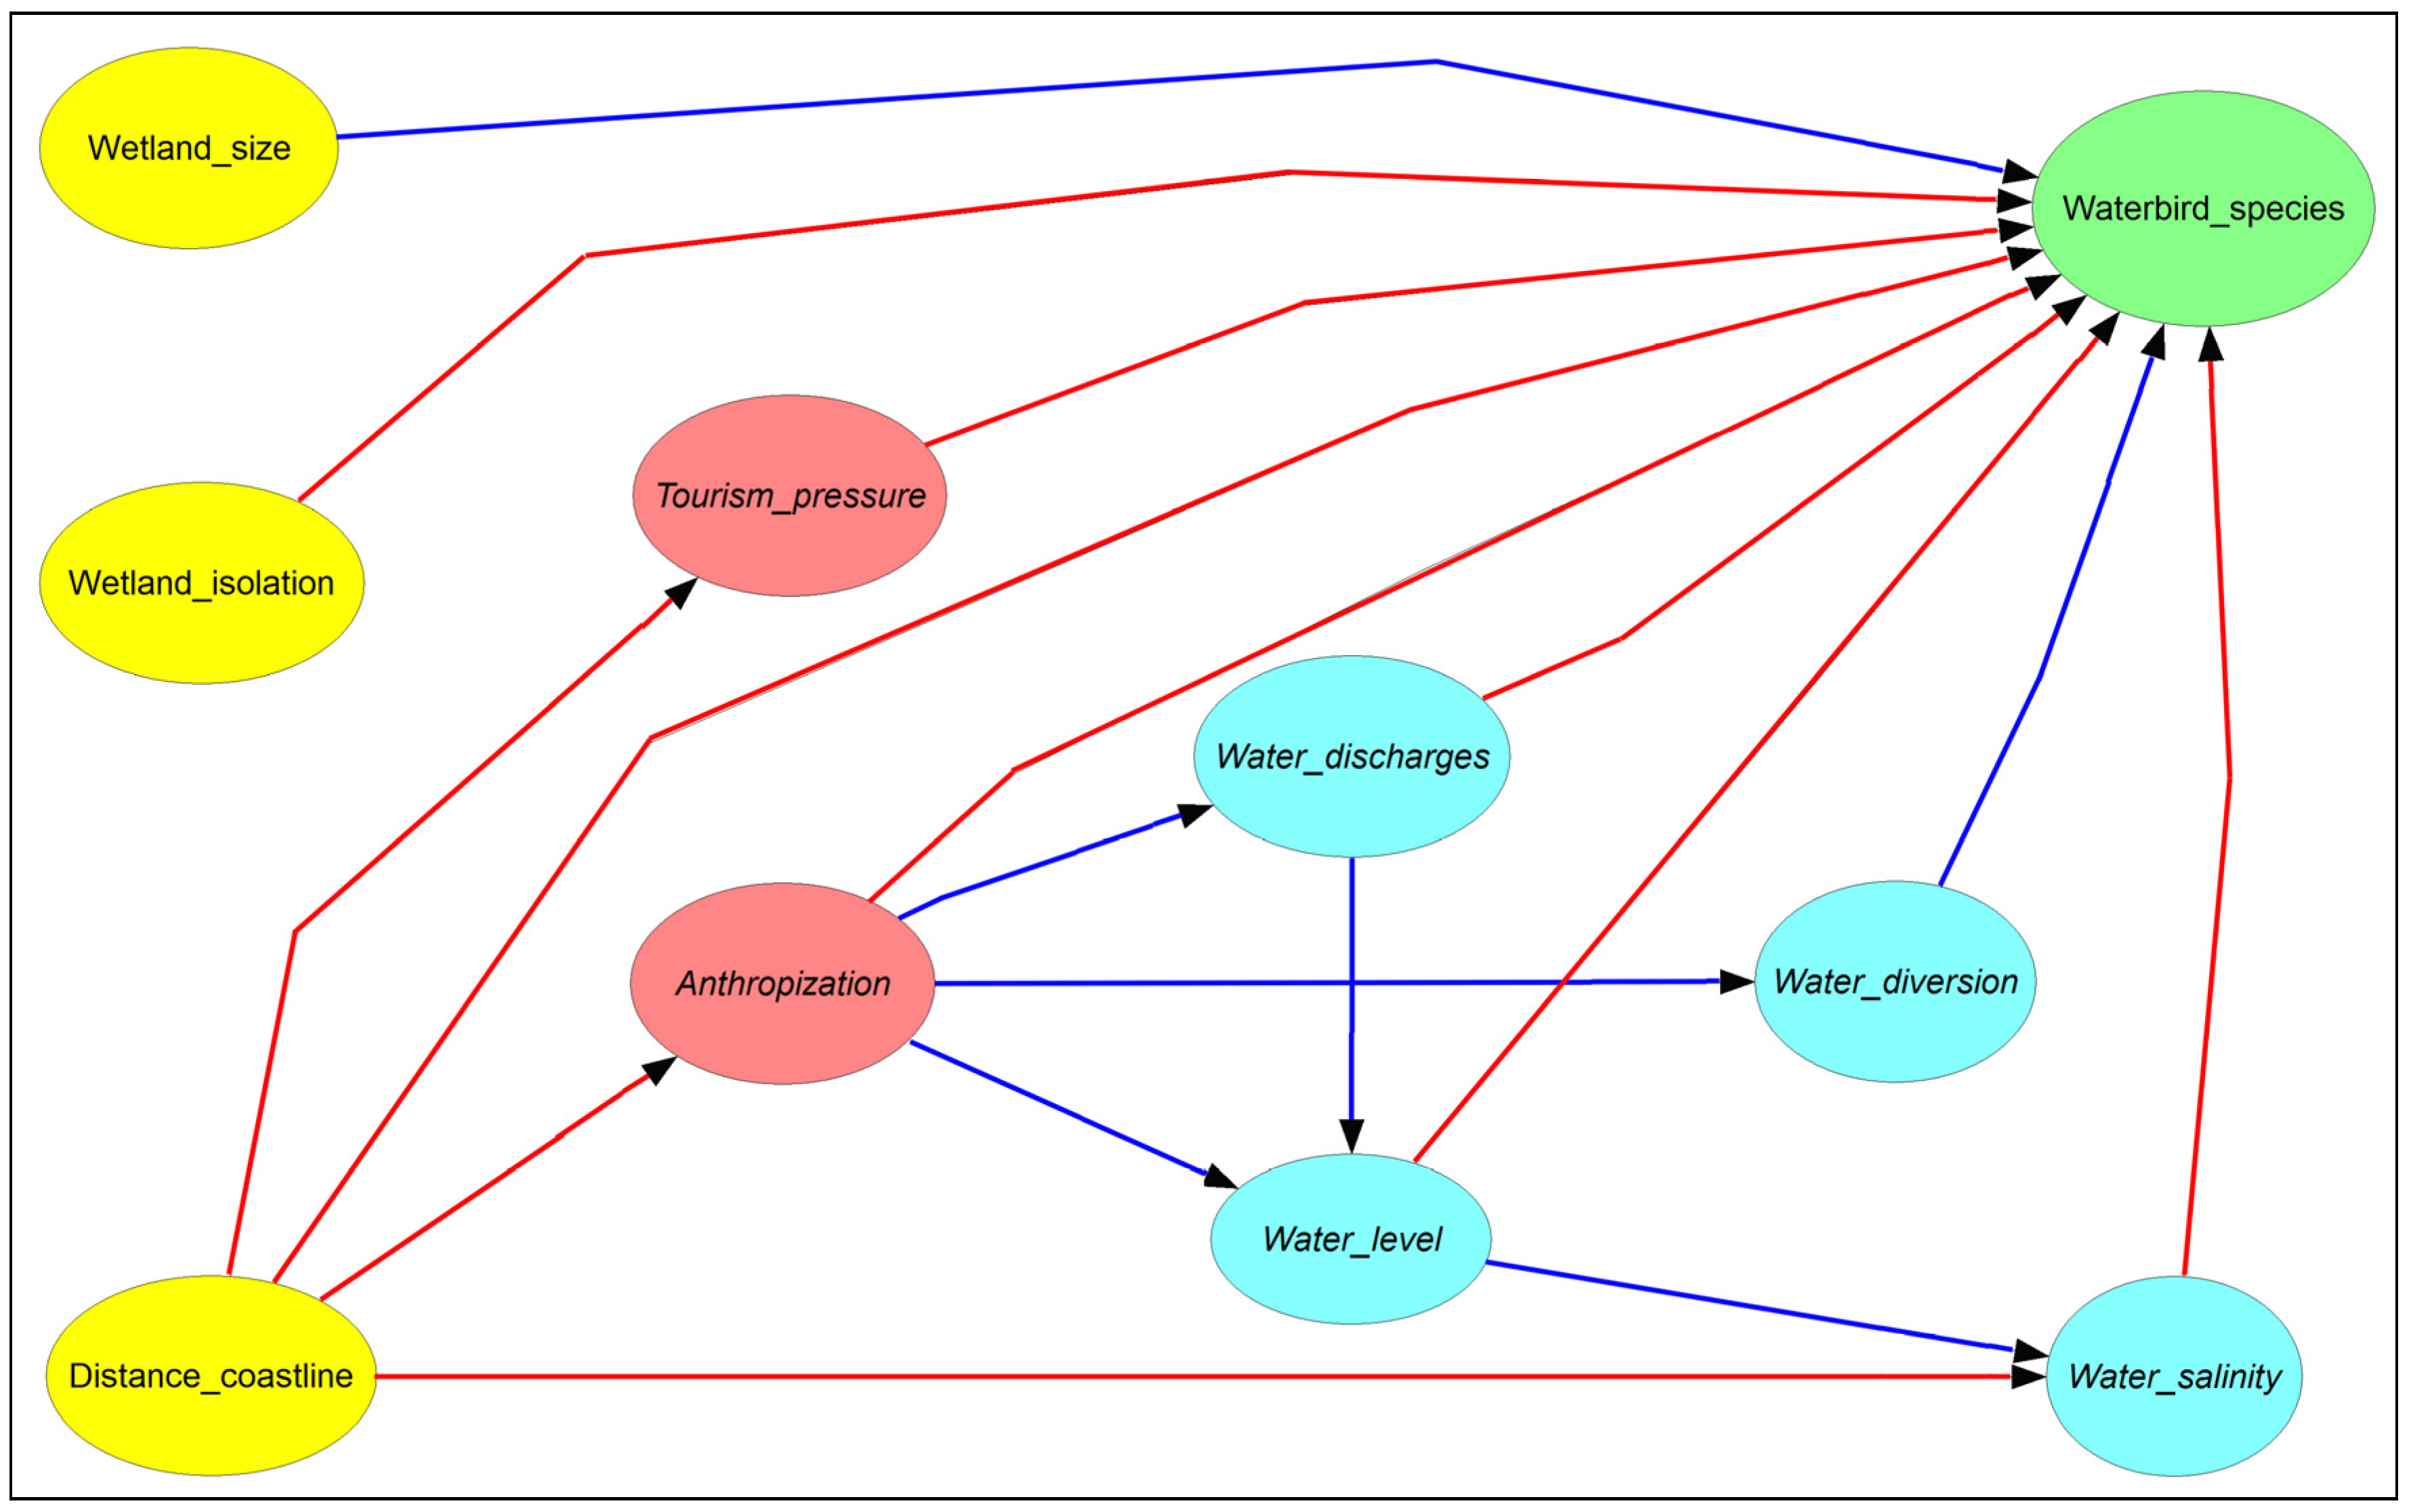
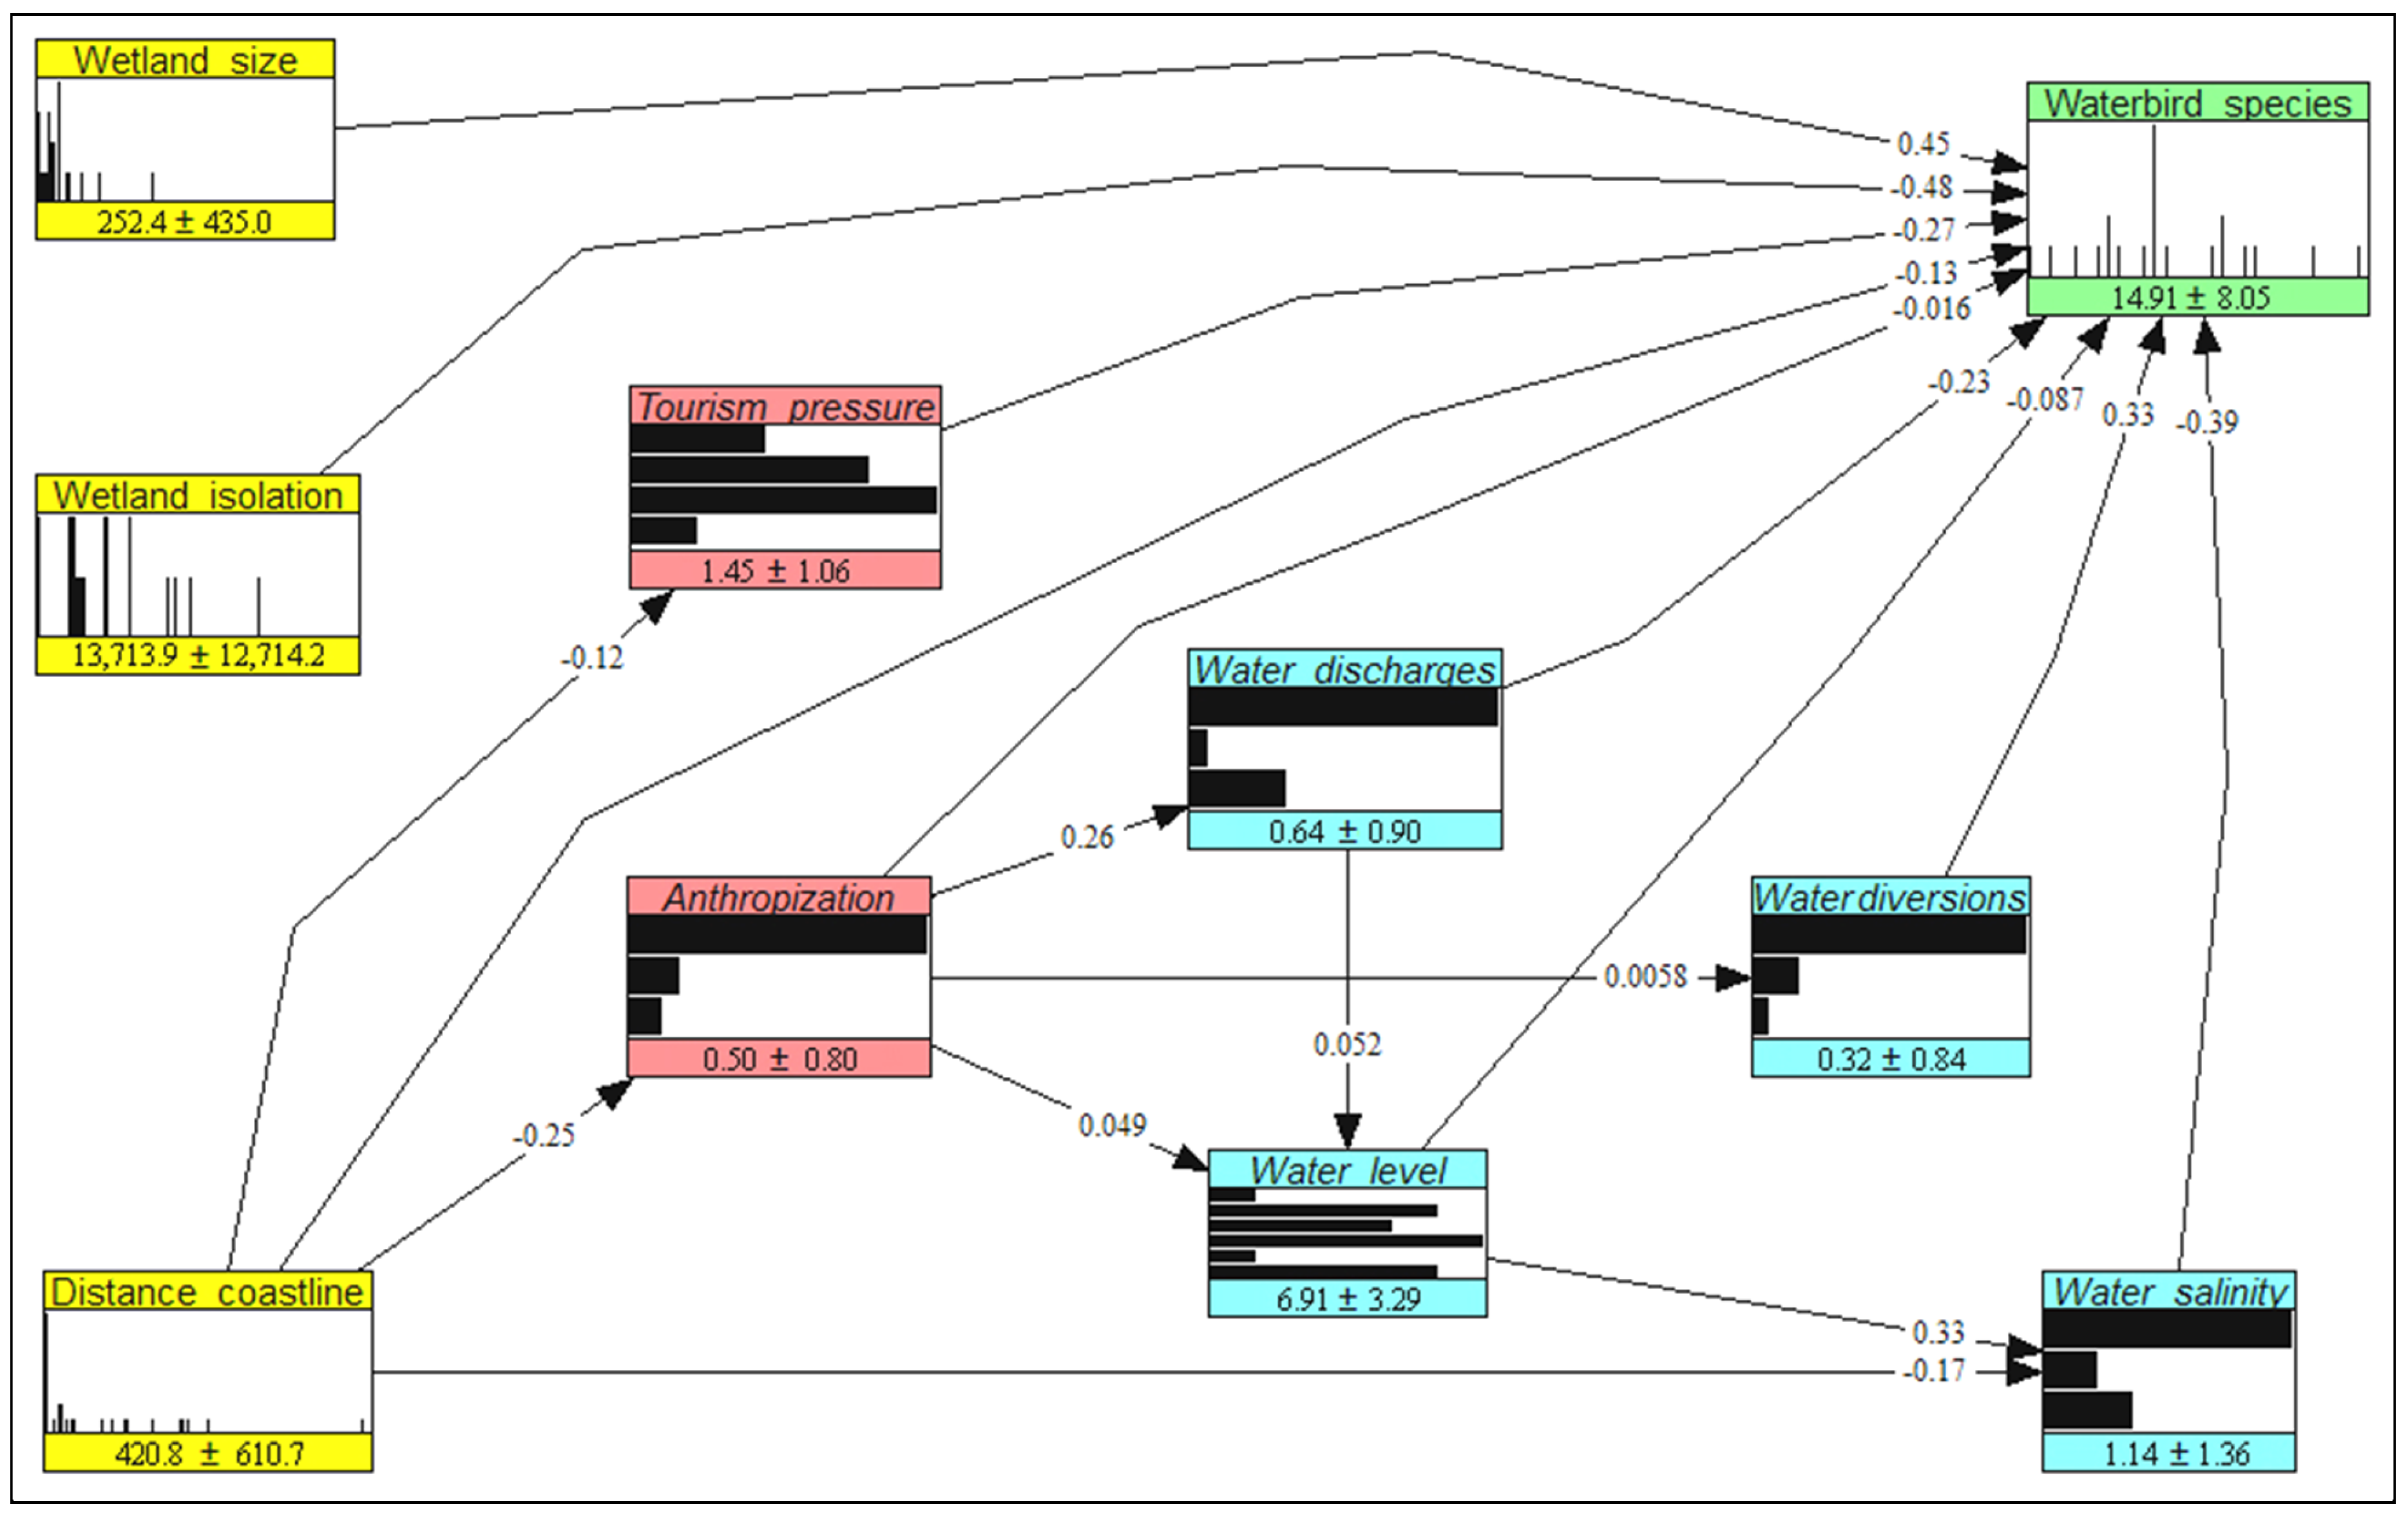
2.2. Model Setup and Validation
2.3. Baseline, Counterfactual, Management, and Mixed Scenarios
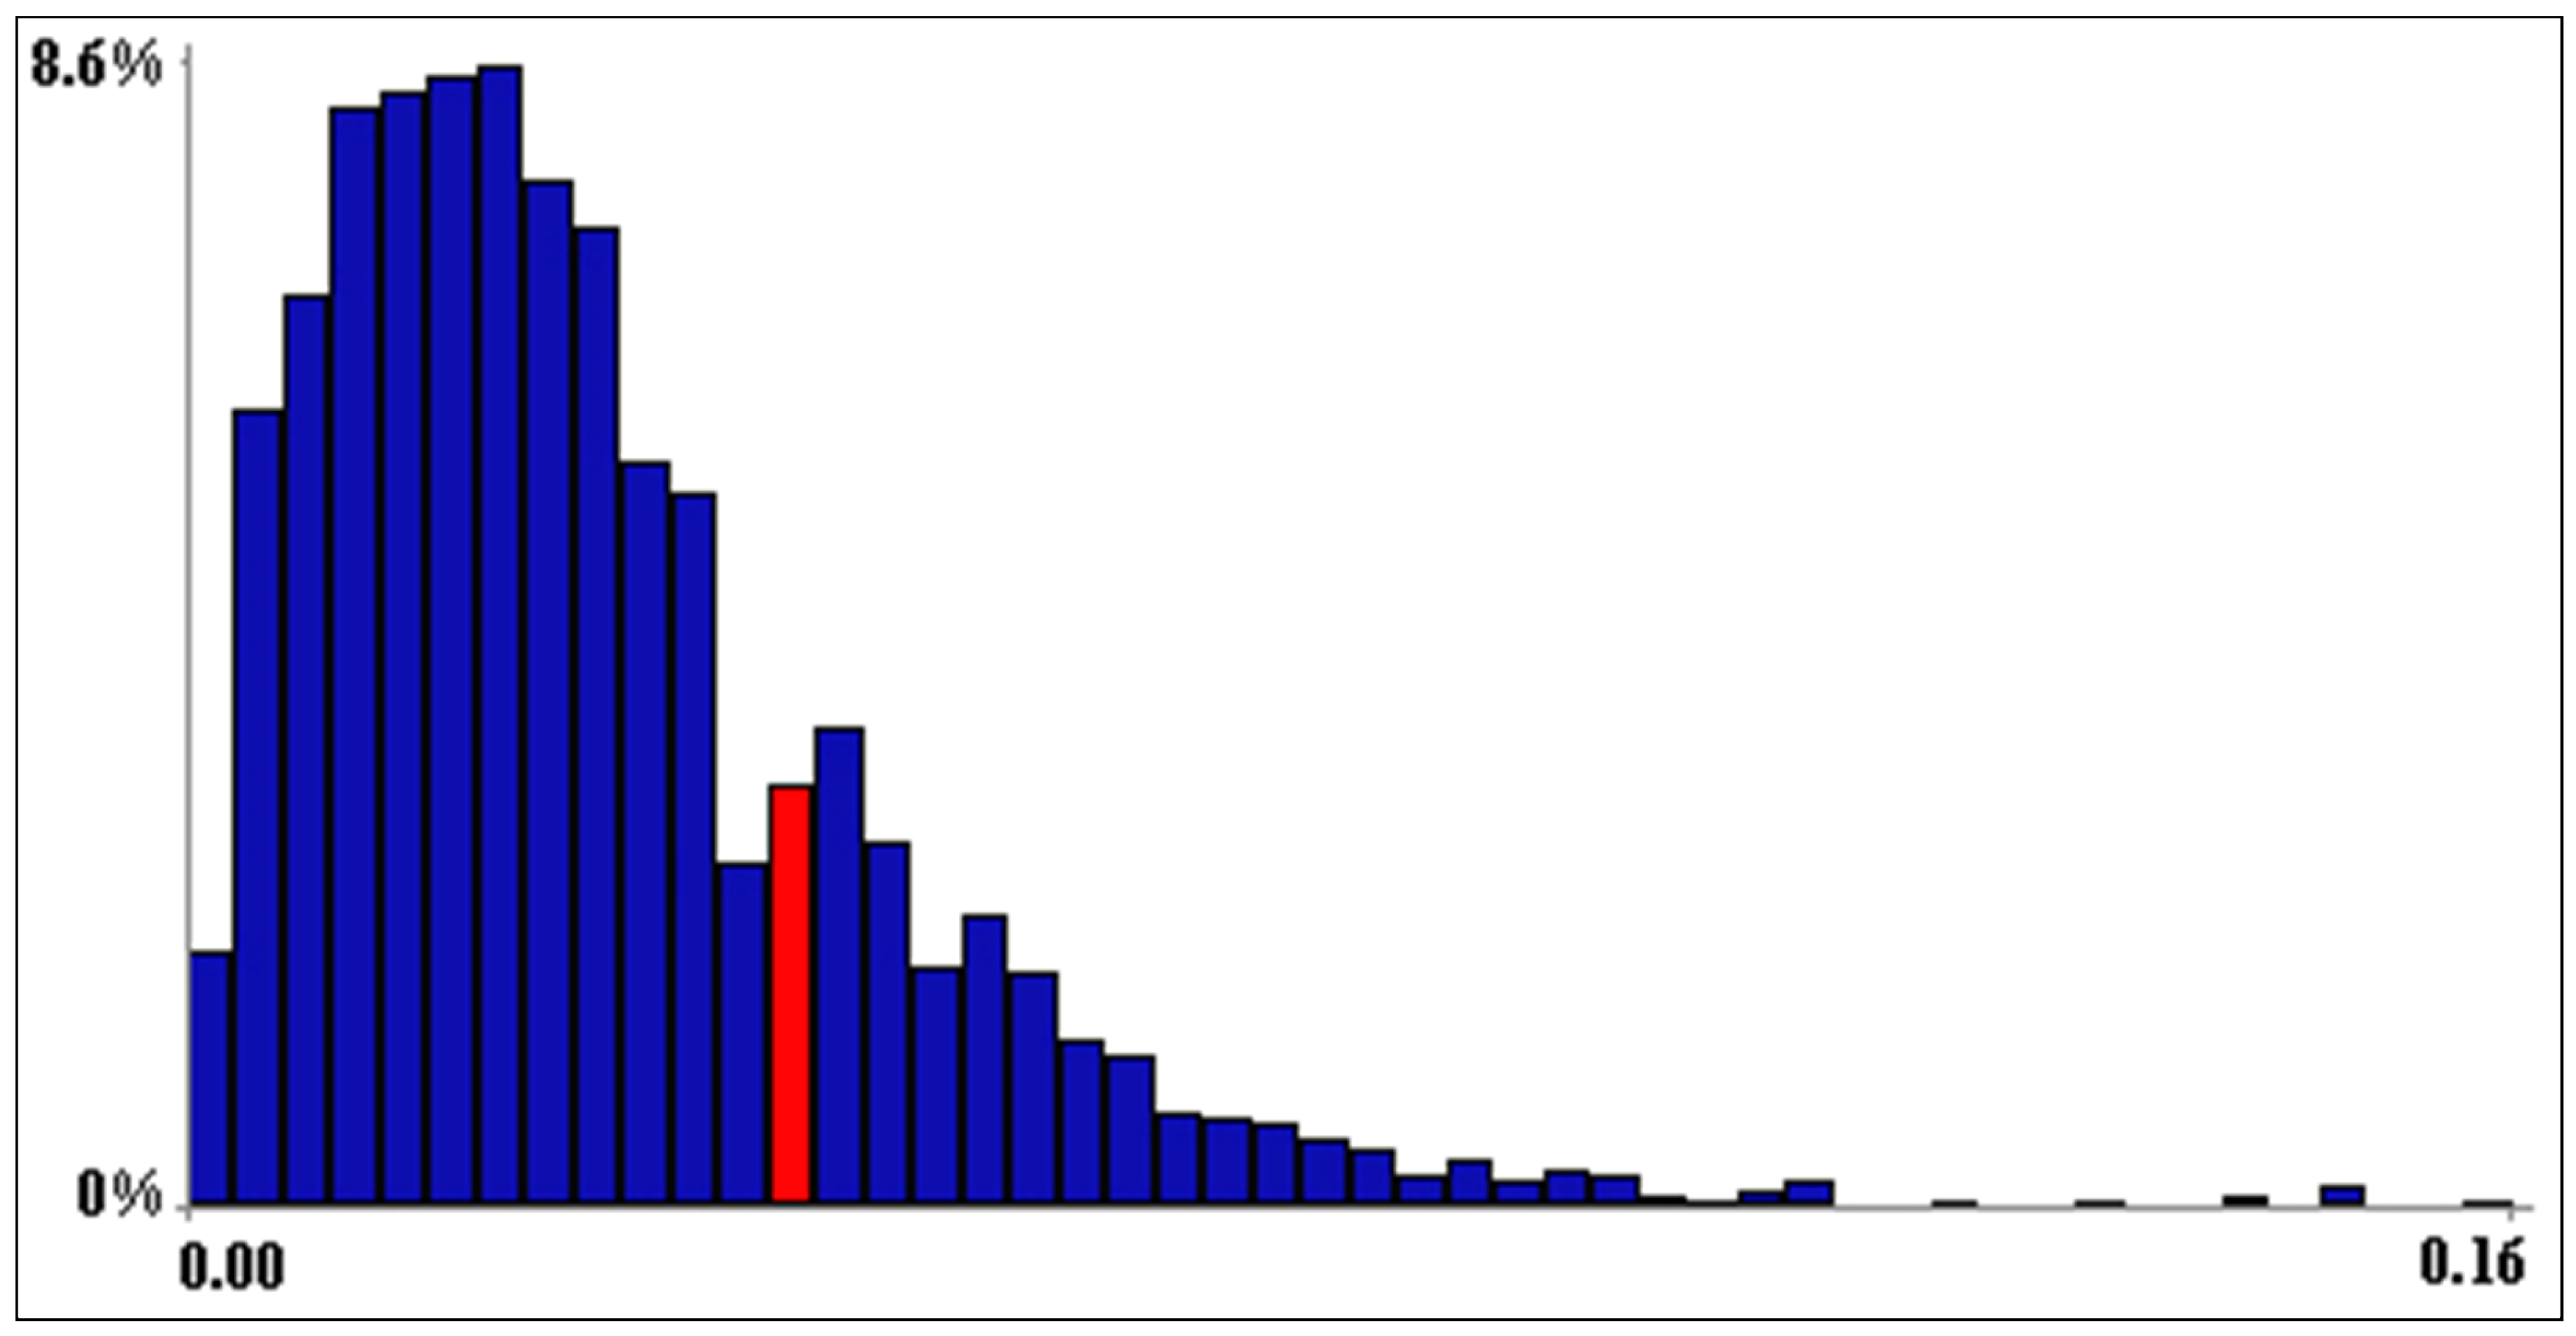
3. Results
4. Discussion
4.1. Model Properties and Assumptions
4.2. Implications for Waterbird Conservation
5. Conclusions
Author Contributions
Funding
Institutional Review Board Statement
Informed Consent Statement
Data Availability Statement
Acknowledgments
Conflicts of Interest
References
- Ostermann, O.P. The need for management of nature conservation sites designated under Natura 2000. J. Appl. Ecol. 1998, 35, 968–973. [Google Scholar] [CrossRef]
- Evans, D. Building the European Union’s Natura 2000 network. Nat. Conserv. 2012, 1, 11–26. [Google Scholar] [CrossRef]
- European Commission. Communication from the Commission to the European Parliament, the European Council, the Council, the European Economic and Social Committee and the Committee of the Regions. EU Biodiversity Strategy for 2030 Bringing Nature Back into Our Lives. COM 380; European Commission: Brussels, Belgium, 2020. [Google Scholar]
- European Commission. Communication from the Commission to the European Parliament, the European Council, the Council, the European Economic and Social Committee and the Committee of the Regions. The European Green Deal. COM640; European Commission: Brussels, Belgium, 2019. [Google Scholar]
- European Commission. Criteria and Guidance for Protected Areas Designations; European Commission: Brussels, Belgium, 2022. [Google Scholar]
- Wilhere, G.F. Adaptive Management in Habitat Conservation Plans. Conserv. Biol. 2002, 16, 20–29. [Google Scholar] [CrossRef]
- ISPRA. Introduction to the Italian Bird Migration Atlas; ISPRA Editore: Rome, Italy, 2008. [Google Scholar]
- Ferrarini, A.; Celada, C.; Gustin, M. Preserving the Mediterranean bird flyways: Assessment and prioritization of 38 main wetlands under human and climate threats in Sardinia and Sicily (Italy). Sci. Total Environ. 2020, 751, 141556. [Google Scholar] [CrossRef] [PubMed]
- Ferrarini, A.; Gustin, M.; Celada, C. Wetland attributes significantly affect patterns of bird species distribution in the Sardinian wetlands (Italy): An uncertain future for waterbird conservation. J. Appl. Ecol. 2023, 60, 650–660. [Google Scholar] [CrossRef]
- Ferrarini, A.; Gustin, M.; Celada, C. Twenty-three years of land-use changes induced considerable threats to the main wetlands of Sardinia and Sicily (Italy) along the Mediterranean bird flyways. Diversity 2021, 13, 240. [Google Scholar] [CrossRef]
- Griffith, D.A. Spatial Autocorrelation: A Primer; Association of American Geographers: Washington, DC, USA, 1987. [Google Scholar]
- Hutto, R.L.; Pletschet, S.M.; Hendricks, P. A fixed- radius point count method for nonbreeding and breeding season use. Auk 1986, 103, 593–602. [Google Scholar] [CrossRef]
- Cooke, R.M.; Kurowicka, D.; Hanea, A.M.; Morales Nápoles, O.; Ababei, D.A.; Ale, B.; Roelen, A. Continuous/Discrete Non-parametric Bayesian Belief Nets with UNICORN and Uninet; Technical Report; Delft University: Delft, The Netherlands, 2017. [Google Scholar]
- Hanea, A.M.; Kurowicka, D.; Cooke, R.M.; Ababei, D.A. Mining and visualising ordinal data with non-parametric continuous BBNs. Comput. Stat. Data Anal. 2010, 54, 668–687. [Google Scholar] [CrossRef]
- Hanea, A.; Napoles, O.M.; Ababei, D. Non-parametric Bayesian networks: Improving theory and reviewing applications. Reliab. Eng. Syst. Saf. 2015, 144, 265–284. [Google Scholar] [CrossRef]
- Ababei, D.; Lewandowski, D.; Hanea, A.; Napoles, O.M.; Kurowicka, D.; Cooke, R. UNINET Help Documentation; Report; Delft University of Technology: Delft, The Netherlands, 2008. [Google Scholar]
- Nelsen, R.B. An Introduction to Copulas; Springer Science & Business Media: New York, NY, USA, 2007. [Google Scholar]
- Sklar, M. Fonctions de repartition an dimensions et leurs marges. Publ. Inst. Statist. Univ. Paris 1959, 8, 229–231. [Google Scholar]
- Hradsky, B.A.; Penman, T.D.; Ababei, D.A.; Hanea, A.; Ritchie, E.G.; York, A.; Di Stefano, J. Bayesian networks elucidate interactions between fire and other drivers of terrestrial fauna distributions. Ecosphere 2017, 8, e01926. [Google Scholar] [CrossRef]
- Ferrarini, A.; Dai, J.; Bai, Y.; Alatalo, J.M. Redefining the climate niche of plant species: A novel approach for realistic predictions of species distribution under climate change. Sci. Total Environ. 2019, 671, 1086–1093. [Google Scholar] [CrossRef]
- McColl-Gausden, S.C.; Bennett, L.T.; Clarke, H.G.; Ababei, D.A.; Penman, T.D. The fuel–climate–fire conundrum: How will fire regimes change in temperate eucalypt forests under climate change? Glob. Chang. Biol. 2022, 28, 5211–5226. [Google Scholar] [CrossRef] [PubMed]
- Penman, T.D.; McColl-Gausden, S.C.; Marcot, B.G.; Ababei, D.A. Population viability analysis using Bayesian networks. Environ. Model. Softw. 2022, 147, 105242. [Google Scholar] [CrossRef]
- Hincks, T.; Aspinall, W.; Cooke, R.; Gernon, T. Oklahoma’s induced seismicity strongly linked to wastewater injection depth. Science 2018, 359, 1251–1255. [Google Scholar] [CrossRef]
- Xu, Q.; Zhou, L.; Xia, S.; Zhou, J. Impact of Urbanisation Intensity on Bird Diversity in River Wetlands around Chaohu Lake, China. Animals 2022, 12, 473. [Google Scholar] [CrossRef]
- Wu, Z.; Ye, X.; Kuang, Z.; Ye, H.; Zhao, X. Positive Effects of Land Use Change on Wintering Bar-Headed Geese between 2010 and 2021. Animals 2022, 12, 3142. [Google Scholar] [CrossRef]
- Aloysius, N.; Madhushanka, S.; Chandrika, C. Avifaunal Diversity and Abundance in the Proposed Sarasalai Mangrove Reserve, Jaffna, Sri Lanka. Birds 2023, 4, 103–116. [Google Scholar] [CrossRef]
- Li, X.; Zeng, Q.; Lei, G.; Sun, G. Effects of Meteorological Factors on Waterbird Functional Diversity and Community Composition in Liaohe Estuary, China. Int. J. Environ. Res. Public Health 2022, 19, 5392. [Google Scholar]
- Teng, J.; Yu, X.; Xia, S.; Liu, Y. Suitable Habitat Dynamics of Wintering Geese in a Large Floodplain Wetland: Insights from Flood Duration. Remote Sens. 2022, 14, 952. [Google Scholar] [CrossRef]
- Wu, E.; Wang, H.; Lu, H.; Zhu, W.; Jia, Y.; Wen, L.; Choi, C.-Y.; Guo, H.; Li, B.; Sun, L.; et al. Unlocking the Potential of Deep Learning for Migratory Waterbirds Monitoring Using Surveillance Video. Remote Sens. 2022, 14, 514. [Google Scholar] [CrossRef]
- Li, D.; Zhu, S.; Gao, J.; Jiang, H.; Deng, G.; Sheng, L.; Cao, Y.; Li, L.; Lin, B. The Influence of Ecological Engineering on Waterbird Diversity in Different Habitats within the Xianghai Nature Reserve. Diversity 2022, 14, 1016. [Google Scholar] [CrossRef]
- Liu, M.; Leung, F.; Lee, S.-Y. Interpreting Mangrove Habitat and Coastal Land Cover Change in the Greater Bay Area, Southern China, from 1924 to 2020 Using Historical Aerial Photos and Multiple Sources of Satellite Data. Remote Sens. 2022, 14, 5163. [Google Scholar] [CrossRef]
- Liang, W.; Lei, J.; Ren, B.; Cao, R.; Yang, Z.; Wu, N.; Jia, Y. The Impacts of a Large Water Transfer Project on a Waterbird Community in the Receiving Dam: A Case Study of Miyun Reservoir, China. Remote Sens. 2022, 14, 417. [Google Scholar] [CrossRef]
- Ross, P.M.; Adam, P. Climate Change and Intertidal Wetlands. Biology 2013, 2, 445–480. [Google Scholar] [CrossRef] [PubMed]
- Pandiyan, J.; Poiyamozhi, A.; Mahboob, S.; Al-Ghanim, K.A.; Al-Misned, F.; Ahmed, Z.; Manzoor, I.; Govindarajan, M. Assessment of the Toxic Effects of Heavy Metals on Waterbirds and Their Prey Species in Freshwater Habitats. Toxics 2022, 10, 641. [Google Scholar] [CrossRef]
- Rodríguez-Santalla, I.; Navarro, N. Main Threats in Mediterranean Coastal Wetlands. The Ebro Delta Case. J. Mar. Sci. Eng. 2021, 9, 1190. [Google Scholar] [CrossRef]
- Ricotta, C. A semantic taxonomy for diversity measures. Acta Biotheor. 2007, 55, 23–33. [Google Scholar] [CrossRef]
- Ricotta, C. Computing additive beta-diversity from presence and absence scores: A critique and alternative parameters. Theor. Popul. Biol. 2008, 73, 244–249. [Google Scholar] [CrossRef]
- Ricotta, C. On beta diversity decomposition: Trouble shared is not trouble halved. Ecology 2010, 91, 1981–1983. [Google Scholar] [CrossRef]
- Salafsky, N.; Margoluis, R. Threat reduction assessment: A practical and cost-effective approach to evaluating conservation and development projects. Conserv. Biol. 1999, 13, 830–841. [Google Scholar] [CrossRef]
- Salafsky, N.; Butchart, S.H.M.; Salzer, D.; Stattersfield, A.J.; Neugarten, R.; Hilton-Taylor, C.; Collen, B.; Master, L.L.; O’Connor, S.; Wilkie, D. Pragmatism and practice in classifying threats: Reply to Balmford. Conserv. Biol. 2009, 23, 488–493. [Google Scholar] [CrossRef]
- Miller, S.G.; Knight, R.L.; Miller, C.K. Wildlife response to pedestrians and dogs. Wildl. Soc. Bull. 2001, 29, 124–132. [Google Scholar]
- Giovacchini, P.; Battisti, C.; Marsili, L. Evaluating the Effectiveness of a Conservation Project on Two Threatened Birds: Applying Expert-Based Threat Analysis and Threat Reduction Assessment in a Mediterranean Wetland. Diversity 2022, 14, 94. [Google Scholar] [CrossRef]
- Fraser, L.H.; Keddy, P.A. The World’s Largest Wetlands: Ecology and Conservation; Cambridge University Press: Cambridge, UK, 2005. [Google Scholar]
- Gardner, R.C.; Barchiesi, S.; Beltrame, C.; Finlayson, C.M.; Galewski, T.; Harrison, I.J.; Paganini, M.; Perennou, C.; Pritchard, D.; Rosenqvist, A.; et al. State of the World’s Wetlands and Their Services to People: A Compilation of Recent Analyses; Social Science Electronic Publishing: Gland, Switzerland, 2015. [Google Scholar]
- Rubega, M.A.; Robinson, J.A. Water salinization and shore-birds: Emerging issues. Int. Wader Stud. 1997, 9, 45–54. [Google Scholar]
- Ferrarini, A.; Celada, C.; Gustin, M. Anthropogenic Pressure and Climate Change Could Severely Hamper the Avian Metacommunity of the Sicilian Wetlands. Diversity 2022, 14, 696. [Google Scholar] [CrossRef]
- Colwell, M.A.; Taft, O.W. Waterbird communities in managed wetlands of varying water depth. Waterbirds 2000, 23, 45–55. [Google Scholar]
- Gardner, R.C.; Finlayson, C.M. Global Wetland Outlook: State of the World’s Wetlands and Their Services to People; Ramsar Convention: Gland, Switzerland, 2018. [Google Scholar]

| Variable | Unit of Measure | Range | Description |
|---|---|---|---|
| Wetland size | hectares | 13.3–2048 | |
| Isolation | meters | 296–54,472 | |
| Distance to the coastline | meters | 0–2050 | |
| Mean water level | dimensionless | 1–11 | 1 = from 0 to 10 cm; 2 = from 10 to 20 cm; 3 = from 20 to 30 cm, etc. |
| Water salinity | dimensionless | 0–3 | 0 = absent; 1 = localized; 2 = scattered; 3 = widespread |
| Water diversions | dimensionless | 0–3 | 0 = absent; 1 = localized; 2 = scattered; 3 = widespread |
| Water discharges | dimensionless | 0–2 | 0 = absent; 1 = localized; 2 = scattered |
| Tourism pressure | dimensionless | 0–3 | 0 = absent; 1 = localized; 2 = scattered; 3 = widespread |
| Anthropization | dimensionless | 0–2 | 0 = absent; 1 = localized; 2 = scattered |
| Number of species | dimensionless | 2–32 |
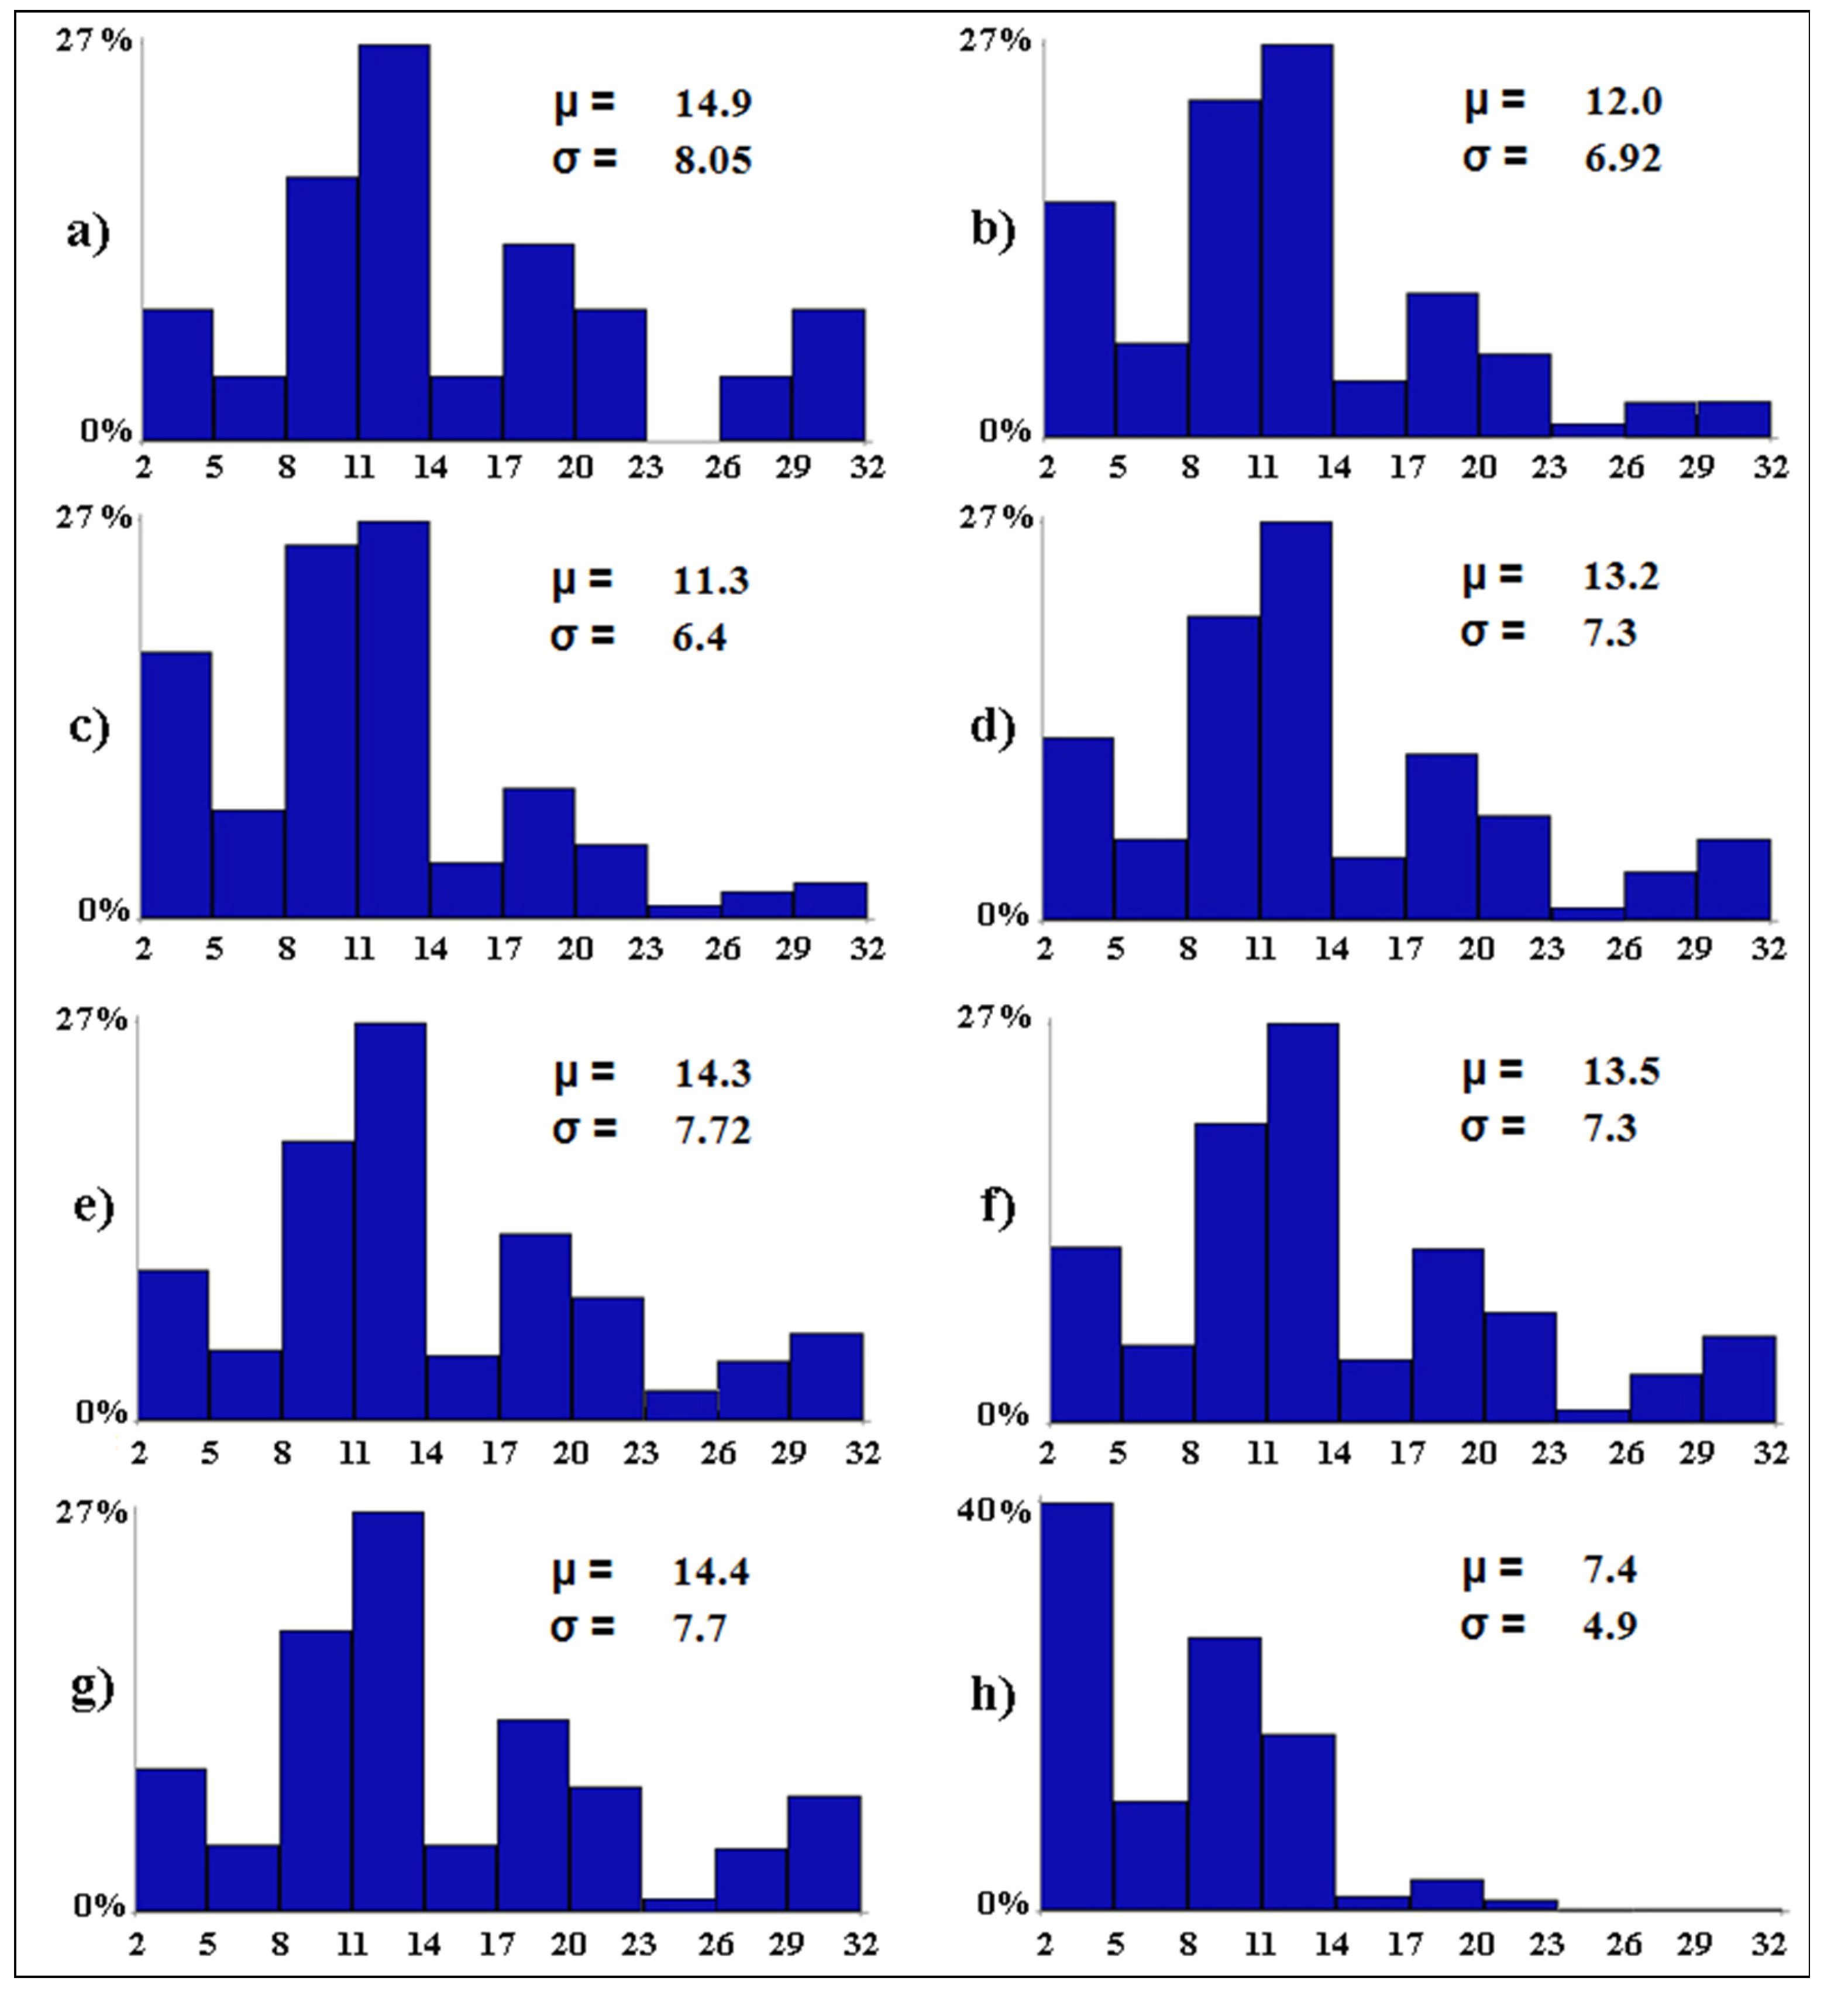
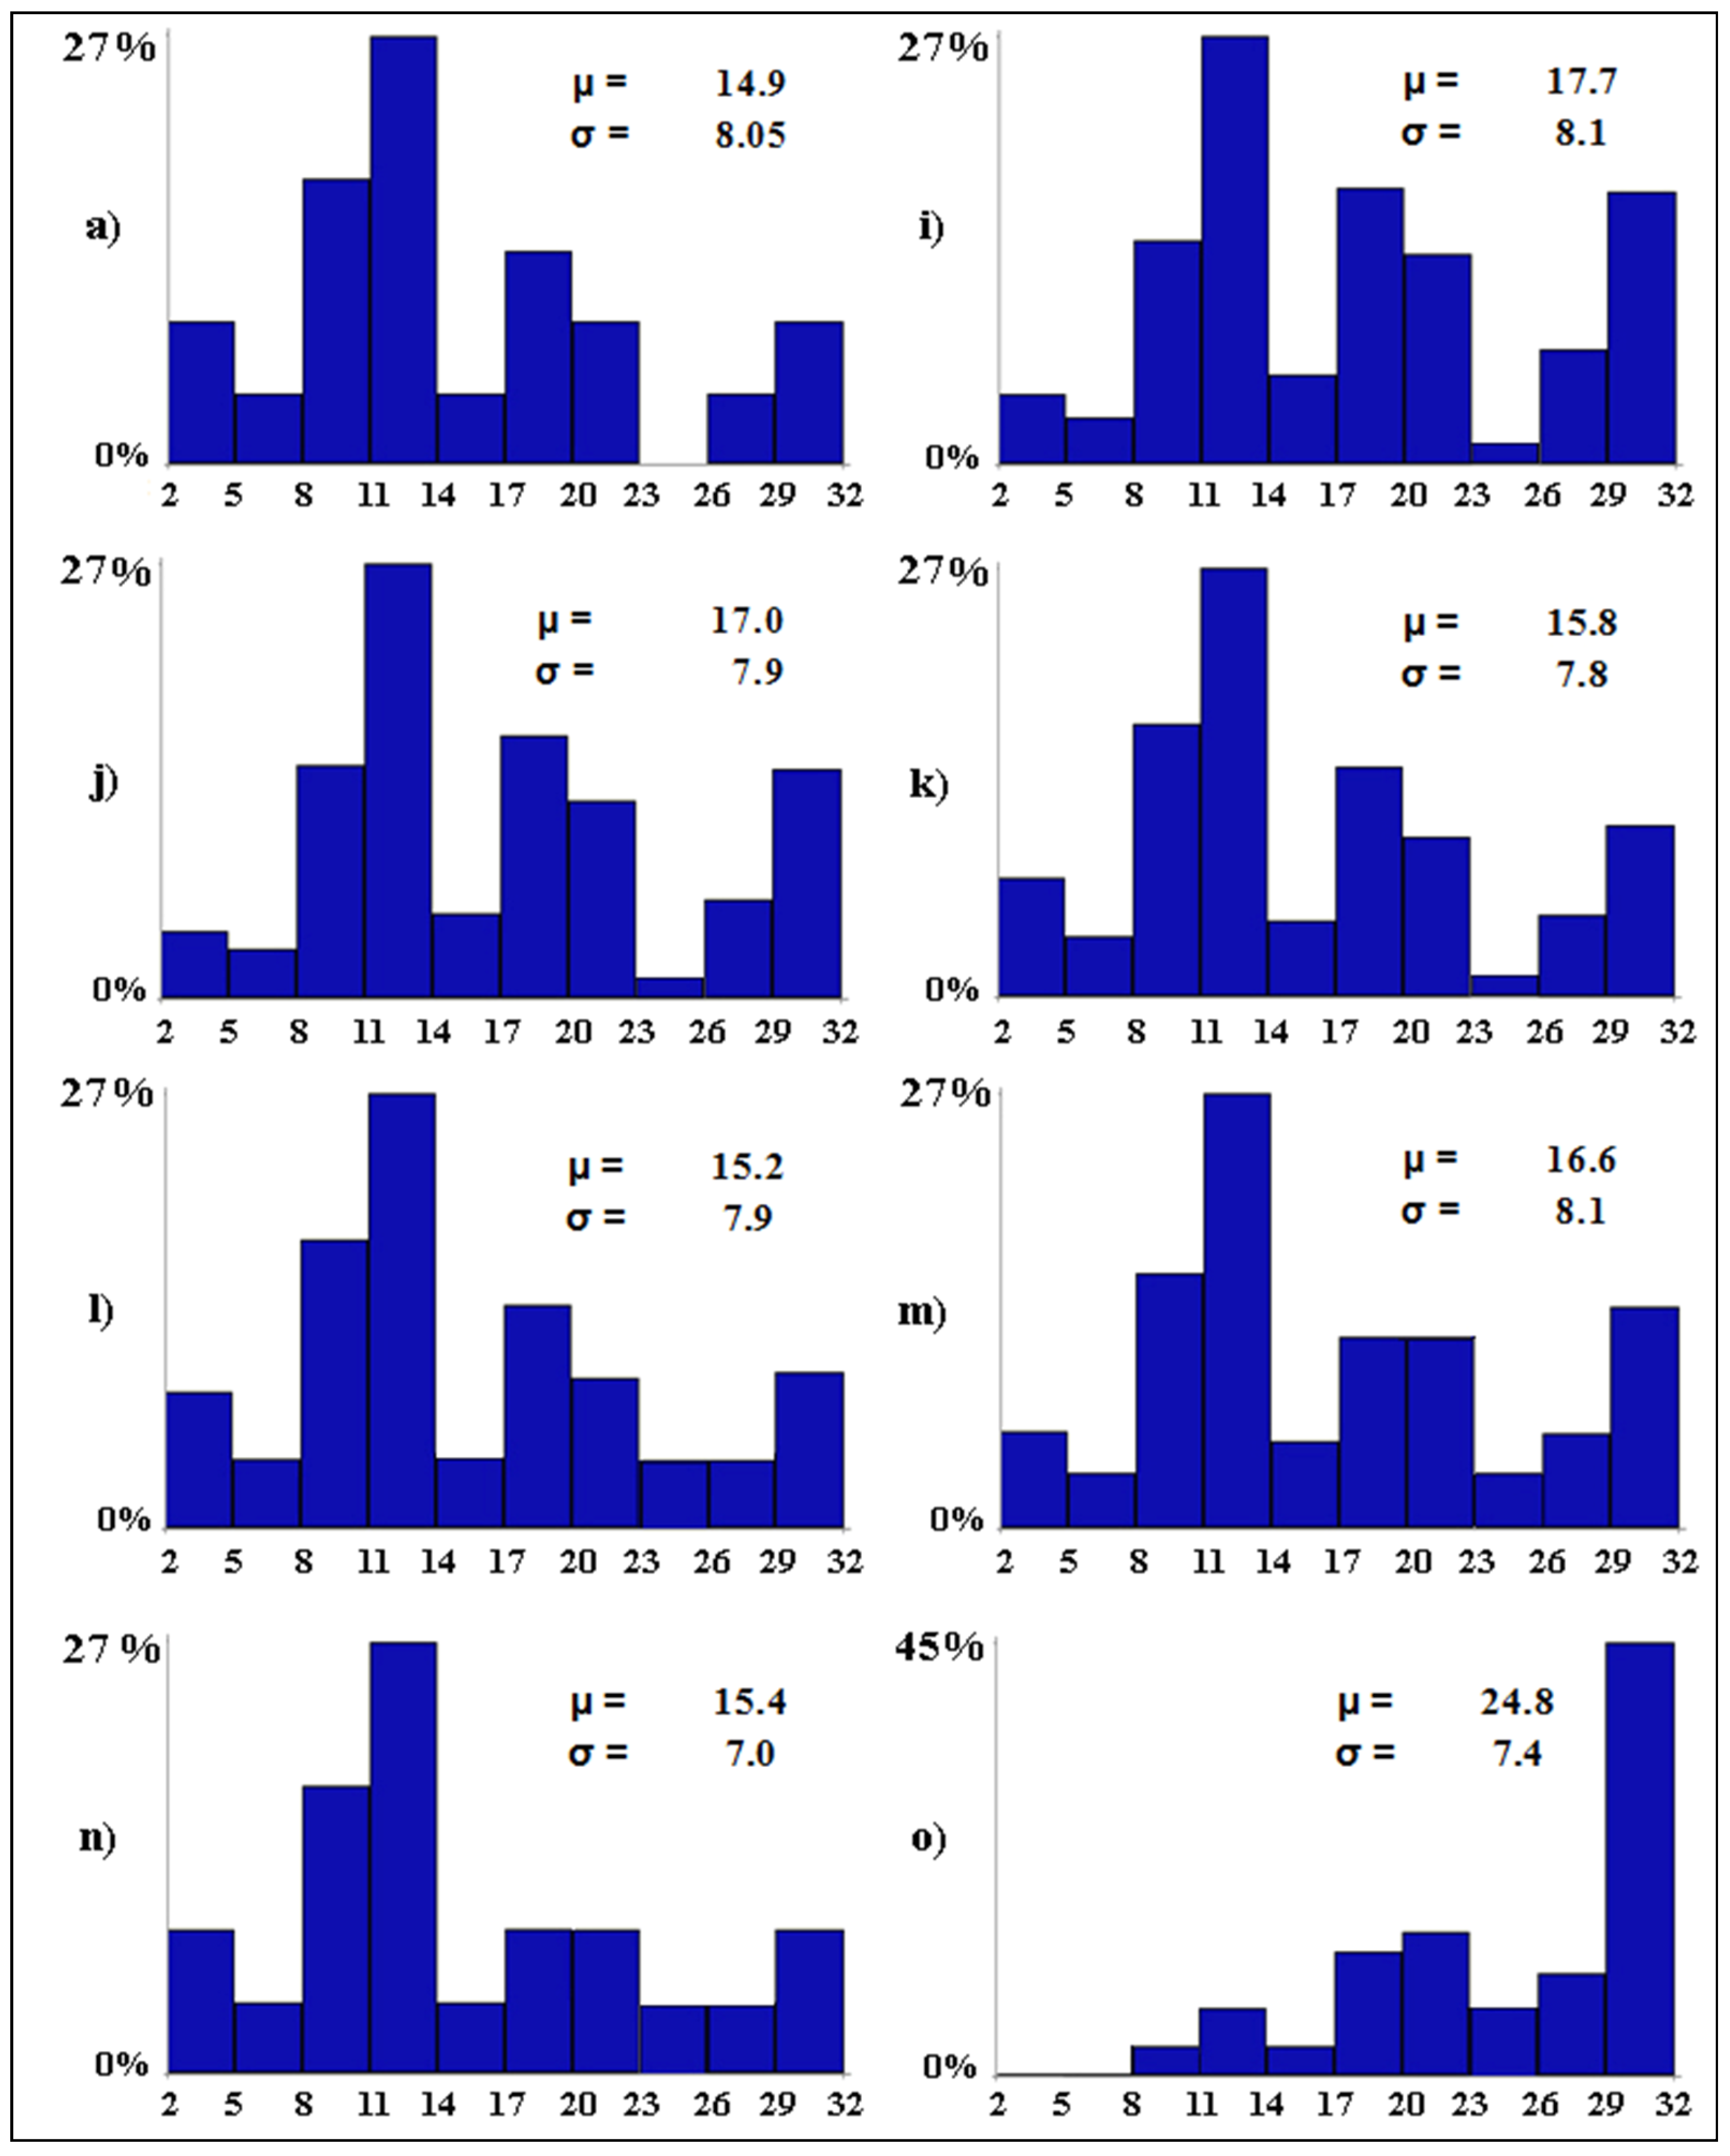
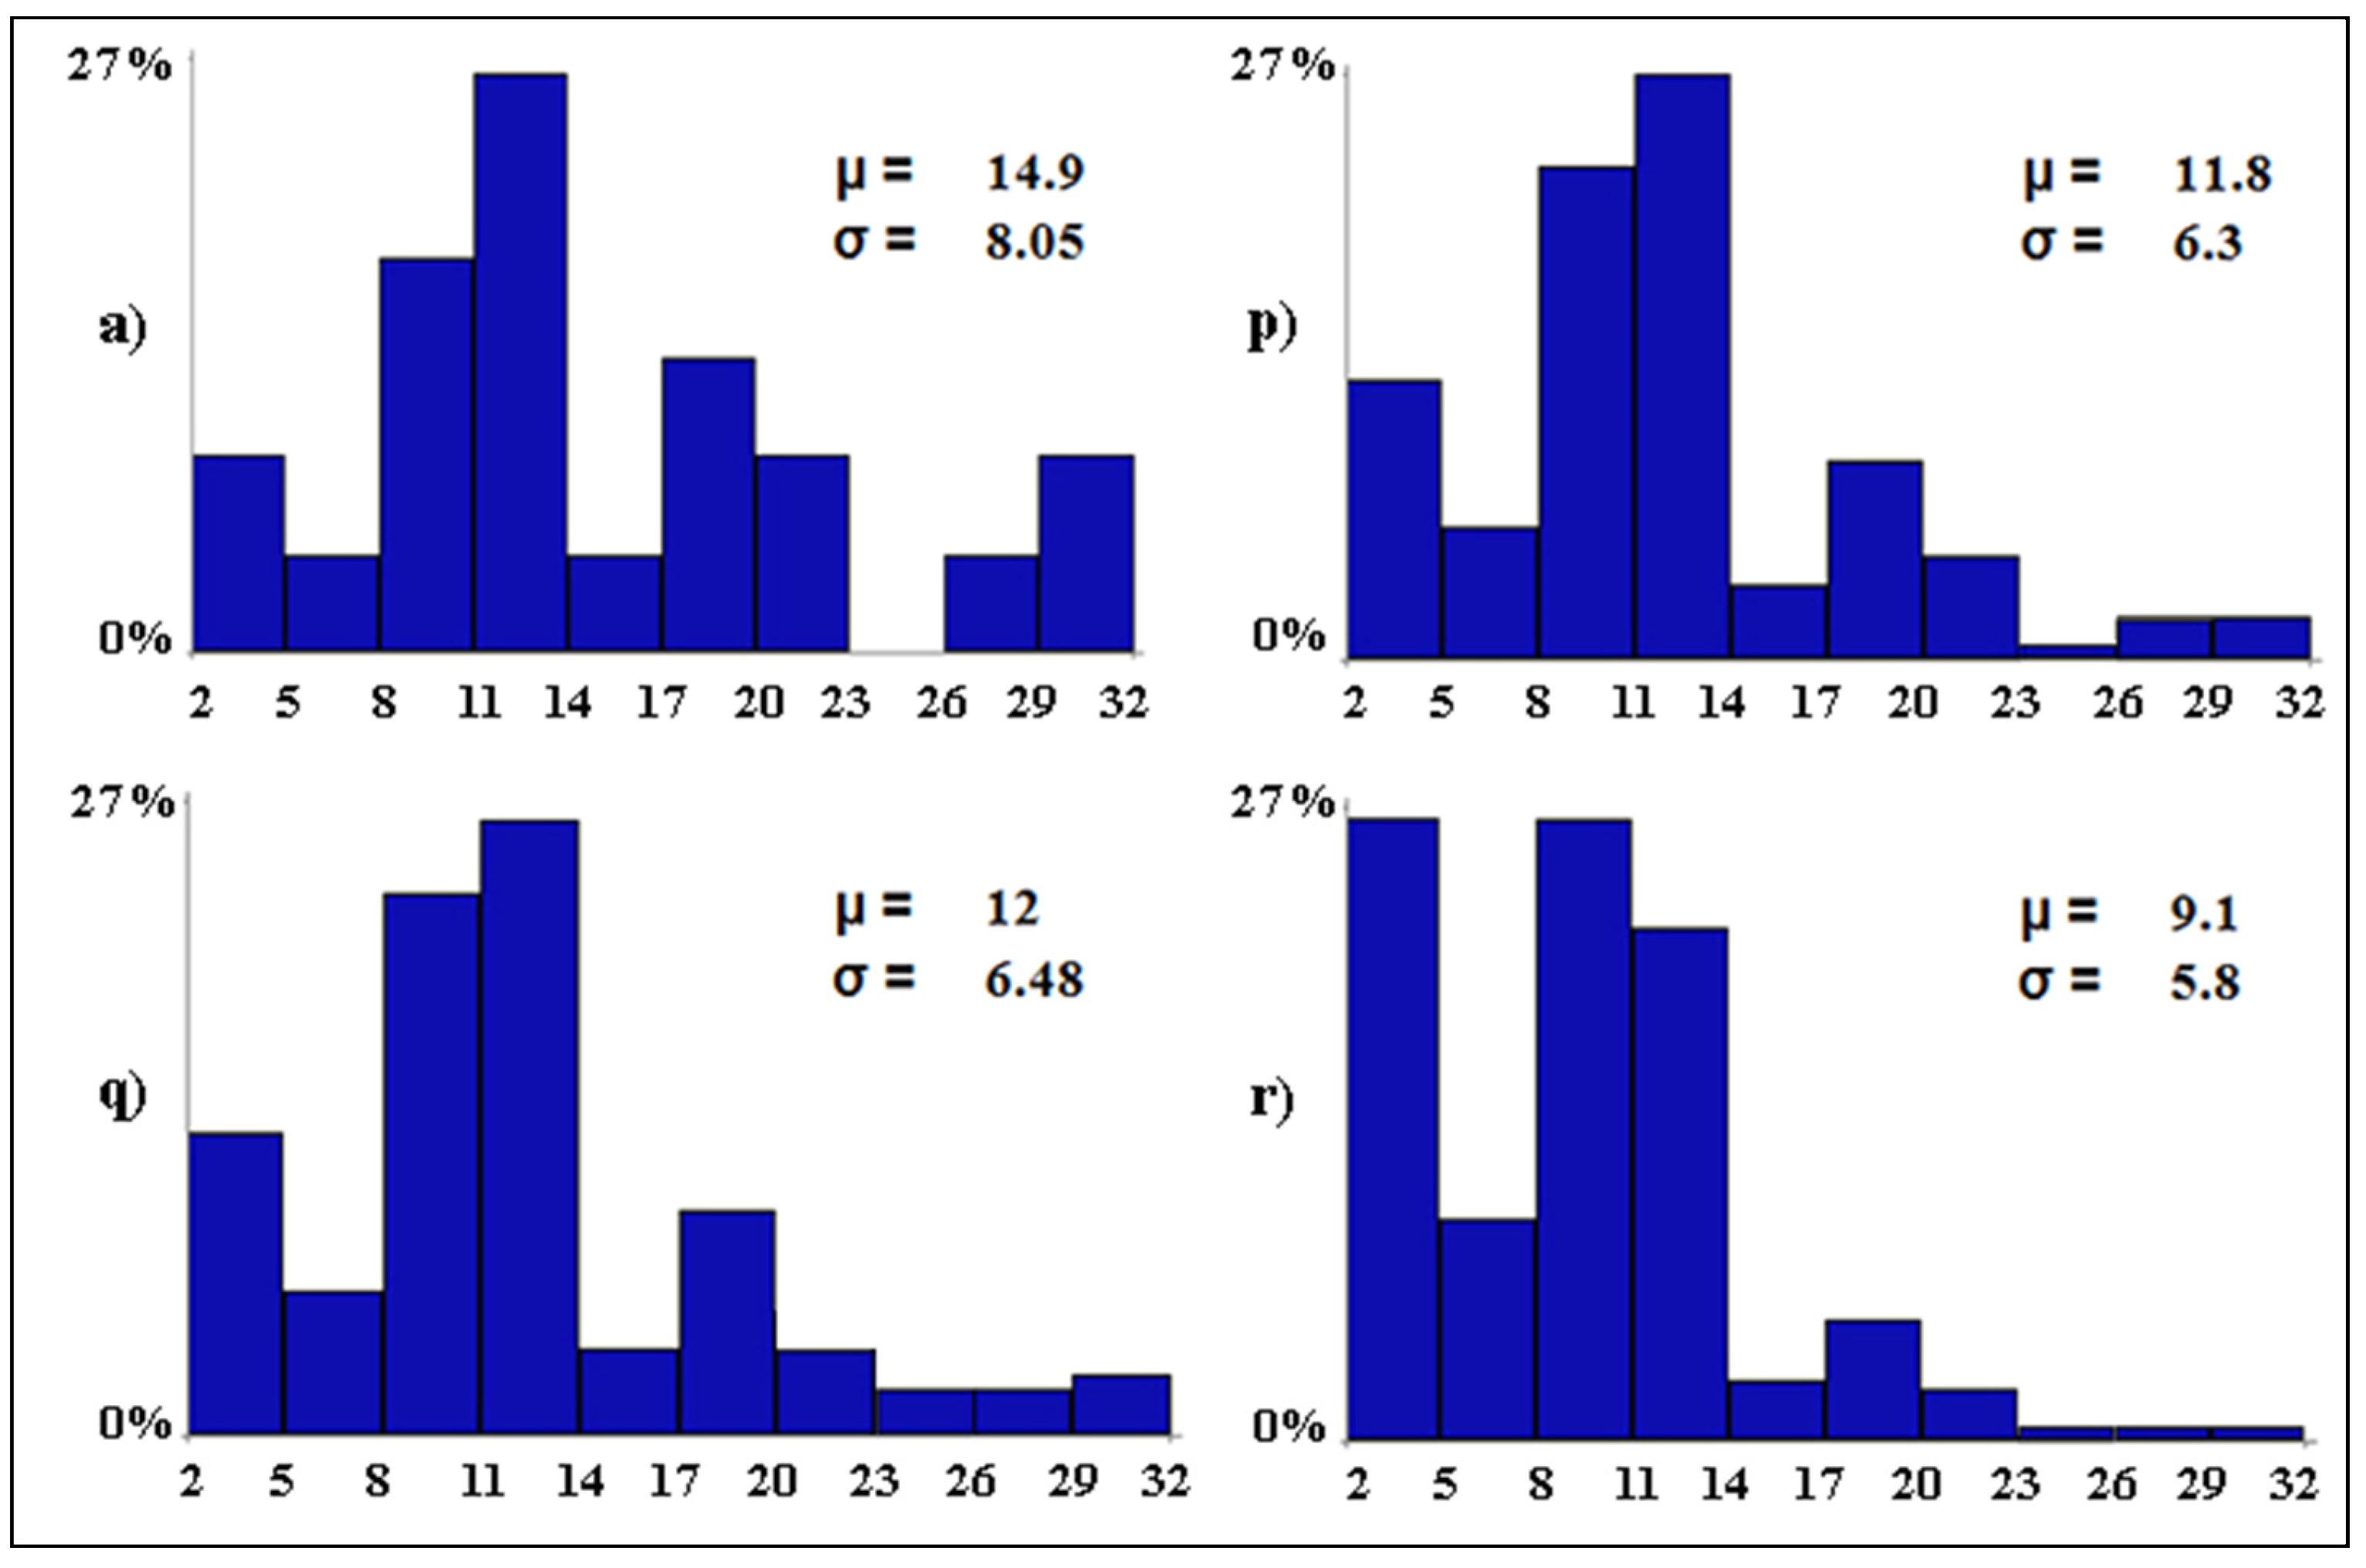
| Scenario Type | Code | Conditionalization | Outcome |
|---|---|---|---|
| Baseline scenario | (a) | none | the baseline level of avian diversity |
| Worst-case scenario | (b) | tourism pressure = 3 | the expected level of avian diversity if tourism pressure becomes widespread in all wetlands |
| Worst-case scenario | (c) | water salinity = 3 | the expected level of avian diversity if water salinity becomes widespread in all wetlands |
| Worst-case scenario | (d) | water discharges = 2 | the expected level of avian diversity if water discharges become scattered in all wetlands |
| Worst-case scenario | (e) | anthropization = 2 | the expected level of avian diversity if anthropization becomes scattered in all wetlands |
| Worst-case scenario | (f) | water level = 11 | the expected level of avian diversity if water level exceeds 100 cm in all wetlands |
| Worst-case scenario | (g) | water diversions = 0 | the expected level of avian diversity if water diversions become null in all wetlands |
| Worst-case scenario | (h) | scenarios b–g together | the expected level of avian diversity if scenarios from b to g occur all together |
| Best-case scenario | (i) | tourism pressure = 0 | the expected level of avian diversity if tourism pressure becomes null in all wetlands |
| Best-case scenario | (j) | water salinity = 0 | the expected level of avian diversity if water salinity becomes null in all wetlands |
| Best-case scenario | (k) | water discharges = 0 | the expected level of avian diversity if water discharges become null in all wetlands |
| Best-case scenario | (l) | anthropization = 0 | the expected level of avian diversity if anthropization becomes null in all wetlands |
| Best-case scenario | (m) | water level = 3 | the expected level of avian diversity if water level is between 20 and 30 cm in all wetlands |
| Best-case scenario | (n) | water diversions = 3 | the expected level of avian diversity if water diversions become widespread in all wetlands |
| Best-case scenario | (o) | scenarios i–n together | the expected level of avian diversity if scenarios from i to n occur all together |
| Mixed scenario | (p) | same as scenario h but tourism pressure = 0 | the expected level of avian diversity if all conditions deteriorate except for tourism pressure that becomes null |
| Mixed scenario | (q) | same as scenario h but water salinity = 0 | the expected level of avian diversity if all conditions deteriorate except for water salinity that becomes null |
| Mixed scenario | (r) | same as scenario h but water discharges = 0 | the expected level of avian diversity if all conditions deteriorate except for water discharges that become null |
Disclaimer/Publisher’s Note: The statements, opinions and data contained in all publications are solely those of the individual author(s) and contributor(s) and not of MDPI and/or the editor(s). MDPI and/or the editor(s) disclaim responsibility for any injury to people or property resulting from any ideas, methods, instructions or products referred to in the content. |
© 2023 by the authors. Licensee MDPI, Basel, Switzerland. This article is an open access article distributed under the terms and conditions of the Creative Commons Attribution (CC BY) license (https://creativecommons.org/licenses/by/4.0/).
Share and Cite
Ferrarini, A.; Gustin, M.; Celada, C. Simulation Modeling Unveils the Unalike Effects of Alternative Strategies for Waterbird Conservation in the Coastal Wetlands of Sardinia (Italy). Biology 2023, 12, 1440. https://doi.org/10.3390/biology12111440
Ferrarini A, Gustin M, Celada C. Simulation Modeling Unveils the Unalike Effects of Alternative Strategies for Waterbird Conservation in the Coastal Wetlands of Sardinia (Italy). Biology. 2023; 12(11):1440. https://doi.org/10.3390/biology12111440
Chicago/Turabian StyleFerrarini, Alessandro, Marco Gustin, and Claudio Celada. 2023. "Simulation Modeling Unveils the Unalike Effects of Alternative Strategies for Waterbird Conservation in the Coastal Wetlands of Sardinia (Italy)" Biology 12, no. 11: 1440. https://doi.org/10.3390/biology12111440
APA StyleFerrarini, A., Gustin, M., & Celada, C. (2023). Simulation Modeling Unveils the Unalike Effects of Alternative Strategies for Waterbird Conservation in the Coastal Wetlands of Sardinia (Italy). Biology, 12(11), 1440. https://doi.org/10.3390/biology12111440