Article

Bioinformatic Analysis Reveals the Role of Translation Elongation Efficiency Optimisation in the Evolution of Ralstonia Genus

by
Aleksandra Y. Korenskaia
1,2,3,
Yury G. Matushkin
1,3,
Zakhar S. Mustafin
1,
Sergey A. Lashin
1,2,3 and
Alexandra I. Klimenko
1,2,*
1
Systems Biology Department, Institute of Cytology and Genetics, Siberian Branch of the Russian Academy of Science, Lavrentiev Avenue 10, Novosibirsk 630090, Russia
2
Kurchatov Genomics Center, Institute of Cytology and Genetics, Siberian Branch of the Russian Academy of Science, Lavrentiev Avenue 10, Novosibirsk 630090, Russia
3
Department of Natural Sciences, Novosibirsk National Research State University, Pirogova St. 1, Novosibirsk 630090, Russia
*
Author to whom correspondence should be addressed.
Biology 2023, 12(10), 1338; https://doi.org/10.3390/biology12101338
Submission received: 14 September 2023 / Revised: 9 October 2023 / Accepted: 11 October 2023 / Published: 16 October 2023
(This article belongs to the Special Issue Computational Methods in Biology Research)

Abstract

:

Simple Summary

Bacteria belonging to the Ralstonia genus are of great interest for study since this genus includes both phytopathogenic species and soil opportunistic human pathogens, forming two phylogenetic branches. The difference in phenotype of related species is formed by differences in how proteins and other molecules bacteria synthesize, as well as the level of their synthesis. In this study, we investigate the evolution of the Ralstonia genus, focusing on characteristics of a particular stage of protein synthesis. This is a stage at which the protein sequence is synthesized, named translation elongation. The efficiency of this stage plays a role in the modulating of gene expression, while characteristics of this stage considered being more conservative allow us to use it for comparison at the genus level. We calculated the elongation efficiency based on genomic data and found that characteristics of translation elongation efficiency optimization diverge in accordance with the phylogeny of Ralstonia. Differences in these characteristics of genomes as a whole are also reflected in differences in the efficiency of translation elongation of individual genes, resulting in differences in sets of potentially highly expressed genes in soil and phytopathogenic bacteria. These results are valuable for understanding the evolution and adaptation of bacteria in different environments.

Abstract

Translation efficiency modulates gene expression in prokaryotes. The comparative analysis of translation elongation efficiency characteristics of Ralstonia genus bacteria genomes revealed that these characteristics diverge in accordance with the phylogeny of Ralstonia. The first branch of this genus is a group of bacteria commonly found in moist environments such as soil and water that includes the species R. mannitolilytica, R. insidiosa, and R. pickettii, which are also described as nosocomial infection pathogens. In contrast, the second branch is plant pathogenic bacteria consisting of R. solanacearum, R. pseudosolanacearum, and R. syzygii. We found that the soil Ralstonia have a significantly lower number and energy of potential secondary structures in mRNA and an increased role of codon usage bias in the optimization of highly expressed genes’ translation elongation efficiency, not only compared to phytopathogenic Ralstonia but also to Cupriavidus necator, which is closely related to the Ralstonia genus. The observed alterations in translation elongation efficiency of orthologous genes are also reflected in the difference of potentially highly expressed gene’ sets’ content among Ralstonia branches with different lifestyles. Analysis of translation elongation efficiency characteristics can be considered a promising approach for studying complex mechanisms that determine the evolution and adaptation of bacteria in various environments.

1. Introduction

Ralstonia is a bacterial genus with a complicated systematic history. Currently, it is regarded to be comprised of two branches with different lifestyles [1,2]. The first is a group of bacteria commonly found in moist environments that includes species R. mannitolilytica, R. insidiosa, and R. pickettii, which are also described as nosocomial infection pathogens [1,3,4]. The second group is plant pathogenic bacteria with a broad host range, including such agricultural plants as potato, tomato, eggplant, ginger, etc. [5]. This group consists of the species R. solanacearum, R. pseudosolanacearum, and R. syzygii. The Ralstonia genus demonstrates diverse lifestyles and has a significant impact on agriculture, making it essential to study the evolution of this genus. Gene expression regulation changes can lead to lifestyle adaptations, and translation efficiency plays a role in this process. The translation elongation is the most prolonged stage of translation, and it highly impacts overall translation efficiency [6,7,8]. As it has been shown in Escherichia coli, at least 12% of protein abundance is determined by effectors of translation elongation, while translational initiation determines about 1% of protein abundance, whereas mRNA abundance determines about 53% of protein abundance [9]. However, while mRNA levels strongly depend on the conditions under which genes are expressed, to date, gene-specific regulation of translation elongation efficiency has been identified for only a limited number of genes as a response to stress conditions [10,11], which makes it less volatile and more conservative characteristic with alterations in the course of the evolution of species. Thus, in this study, we focus on the evolution of translation elongation efficiency characteristics in species of the Ralstonia genus.
The efficiency of the translation elongation stage depends on mRNA content and structure. The first factor impacting the translation elongation rate is codon bias: there are differences in the frequency of synonymous codons [12,13,14] that correlate with tRNA abundance [15,16,17,18]. Rare codons with the lower-abundance corresponding tRNAs are decoded more slowly than more abundant codons due to the increased time required for the entrance of the conformable tRNA into the ribosome’s A site [7,15,16,17,18]. As a result, genes enriched by common codons are translated significantly faster than genes enriched by rare codons, and therefore, codon bias is associated with translation elongation efficiency [6,7,8] and gene expression levels [6,7,15,19,20,21,22,23]. However, there are known cases when translational pauses induced by rare codons play a functional role in protein folding [24]. Therefore, regulation of translation efficiency stretches beyond codon content optimization.
Another factor that impacts the translation elongation rate is secondary structures in the mRNA. It has been demonstrated that translation occurs through successive translocation-and-pause cycles. Secondary structures in mRNA increase pause duration, which leads to a decrease in the elongation translation rate [25,26,27]. Despite this fact, the abundance and energy of mRNA secondary structures tend to be higher over coding regions compared to untranslated regions [28] due to performing various functions [29], including positive regulation of mRNA half-life, which means that mRNA abundance is correlated with mRNA folding energy [30,31,32,33]. In summary, there is a balance between mRNA folding energy and the codon usage bias that serves to optimize both mRNA [34] and protein [35] expression levels.
The strategy of multi-objective evolutionary optimization of mRNA by codon content, abundance of secondary structures, and energy of secondary structures is often complicated. That is the reason why an organism could have a preferred maintenance strategy of mRNA optimization [36,37,38], which might be associated with various factors affecting the organism, such as the environment, lifestyle, and others [38,39]. However, the questions of how the strategy of translation elongation optimization corresponds to these factors and whether this trait is phylogenetically conserved remain open.

1.1. Ecological Diversity of Ralstonia

1.1.1. Soil Bacteria

A group of bacteria commonly found in moist environments such as soil and water [40], which includes species R. mannitolilytica, R. insidiosa, and R. pickettii, represents one of the two branches of the Ralstonia genus. As it has been shown for R. pickettii, it can survive in nutrient-poor environments and in areas with high metal (copper, nickel, iron, and/or zinc) contamination. It has also been demonstrated that R. pickettii strains are capable of degrading/detoxifying several toxic substances, including aromatic hydrocarbons and chlorinated phenolic compounds [41]. As it has been found on plastic-water piping, R. pickettii is capable of forming biofilms [42].
The R. mannitolilytica, R. insidiosa, and R. pickettii species also act as opportunistic human pathogens, in particular, as the pathogens responsible for nosocomial infections in immunocompromised patients. The spread of pathogens is provided by the use of contaminated medical solutions [43], including saline, sterile water, as well as disinfectants, and medical equipment [44]. R. pickettii is supposed to be the most clinically important pathogen of this group [45,46] forasmuch that most Ralstonia human infection reports describe cases related to this pathogen. The ability of R. pickettii to survive in disinfectants and pass through filters, which are used to filter-sterilize medical solutions [47], is probably the reason for the persistence of these bacteria in sterile solutions. There have been case reports of meningitis [45,48], infective endocarditis [49,50], nosocomial pneumonia [51], and central line-associated bloodstream infection [4,49] caused by R. pickettii. Moreover, there are a few described cases of nosocomial bloodstream infection caused by R. insidiosa [4], infective endocarditis [50], and bacteremia [52,53] caused by R. mannitolilytica [54]. The infections caused by this group of Ralstonia mainly affect people who are immunocompromised, diagnosed with cystic fibrosis, have central venous catheters, or have had recent surgical or medical hospitalizations [49].

1.1.2. Phytopathogens

The second group of Ralstonia is plant pathogenic bacteria with a broad host range, including such agricultural plants as potato, tomato, eggplant, and ginger, that cause the widespread disease known as bacterial wilt. Until recently, most Ralstonia phytopathogenic strains were included in R. solanacearum species that contained four phylotypes. The differentiation was based on the sequence analysis of the 16S–26S internal transcribed spacer (ITS) region, the endoglucanase gene, or the hrpB genes. Moreover, every phylotype had its own area of geographical origin [5]. A taxonomic revision has been proposed to divide the R. solanacearum species complex into three species: R. solanacearum, R. pseudosolanacearum, and R. syzygii [55] based on the DNA–DNA relatedness values. R. solanacearum and R. pseudosolanacearum are pathogens that infect a plant through its roots, affecting a large number of species belonging to more than 50 botanical families [1].
A broad geographical distribution, persistence, and lethality lead to the characterization of these pathogens as the world’s most important phytopathogenic bacteria [56]. There are many important crops among the infected species, including potato, tomato, banana, pepper, eggplant, and tobacco [55]. Unlike other phytopathogenic Ralstonia R. syzygii has a narrow host range; the pathogen is vectored by cercopoid insects into clove trees. Banana blood disease strains that have also been classified into R. syzygii species infect bananas and plantains via pollinating insects [57].
There are several factors of Ralstonia pathogenicity that have been investigated in R. solanacearum. The main pathogenicity determinant in R. solanacearum is the type III secretion system (T3SS)—a structure that injects type III effector proteins (T3E) into the plant cell cytosol to favor infection. The other factor is exopolysaccharide (EPS), which is important for plant colonization, leading to the occlusion of the xylem vessels that eventually cause the plant wilting symptoms. Other factors impacting pathogenicity are type II-secreted plant cell wall-degrading enzymes responsible for twitching motility (type 4 pili) and swimming motility (flagella) appendages, aerotaxis transducers, cellulases, and pectinases [5]. R. solanacearum can survive for years in moist soils or water microcosms until it finds a susceptible host, which means land infection for several years [56].

1.1.3. Cupriavidus Necator: An Outgroup

The species Cupriavidus necator is a soil bacteria previously attributed to the Ralstonia species and known as Ralstonia eutropha. It is known for its resistance against heavy metals and for being another soil bacteria [58] and the closest relative of R. solanacearum outside the Ralstonia species. These facts make it a perfect candidate to be selected as an outgroup for the Ralstonia genus. As it has been shown for the H16 strain of C. necator, it is a metabolically versatile bacteria capable of subsisting, in the absence of organic growth substrates, on H2 and CO2 as its sole sources of energy and carbon [59].

1.2. The Genome Structure of Bacteria Belonging to Ralstonia Genus

The genome sequence of the listed bacteria comprises two chromosomes [2]. The size of chromosome 1 of Ralstonia genus representatives is about 3.5–4 Mb, and the size of chromosome 2, which is also called megaplasmid, is about 1.4–2 Mb. The size of C. necator’s chromosome 1 is about 3.8–4.3 Mb, the size of chromosome 2 is about 2.7–3.4. Additionally, the genome of C. necator contains one or two plasmids, whose size is mainly about 0.5 Mb, but some representatives contain plasmids with sizes up to 1.5 Mb. As it has been shown for R. solanacearum, both chromosomes have very similar distribution and composition of simple sequence repeats and the presence of compositional biases that indicate joint evolutionary history among the chromosomes [60].
Most housekeeping genes are located on chromosome 1, while chromosome 2 contains chromosome islands and strain-specific genes. Chromosome 2 carries many genes associated with specific lifestyles and pathogenicity, including the Type III and Type VI protein secretion systems, the extracellular polysaccharide (EPS) biosynthesis cluster, flagellar motility determinants, and chemotaxis genes [56]. As it has been shown on R. solanacearum before taxonomic revision, the level of synteny of chromosome 1 (70% to 80% of the coding sequences) is higher than the level of chromosome 2 (55–65%). Chromosome 2 is less conservative; 63% of genes are not conserved. The size of chromosome 2 highly varies (26%) among strains compared to the variability of chromosome 1 size (6%) [56].
To sum up, understanding how translation elongation efficiency has evolved in the Ralstonia genus can help to broaden the understanding of how these bacteria have adapted to different lifestyles. Such factors as codon bias and mRNA secondary structures play a critical role in translation elongation, and optimizing these factors is necessary for efficient gene expression. However, the strategy for mRNA optimization may vary depending on environmental factors and bacterial lifestyles. This study aims to shed light on the interplay between translation elongation optimization, bacterial lifestyles, and evolutionary divergence in the Ralstonia genus. By analyzing different strains within this genus and C. necator as an outgroup, we hope to gain insights into the evolution of these bacteria in terms of translation elongation efficiency and its role in their impact on agriculture and human health.

2. Materials and Methods

2.1. Genome Assemblies Acquisition and Refinement of Their Taxonomical Identity

We selected only complete genomes of Ralstonia genus representatives and C. necator species that were available in the RefSeq database on 28.01.2021; the number of genomes is 116. The entire set of the genomes’ accessions can be found in Supplementary Materials, Table S1. Due to the recent revision of the R. solanacearum taxonomy, taxonomical identification was further refined for the strains described as R. solanacearum using the sequences of the 16S–23S rRNA intergenic spacer (ITS) region, which is utilized for Ralstonia phylotypes recognition [55].

2.2. Elongation Efficiency Calculation

To employ translation elongation efficiency as a conservative characteristic in the analysis of the evolution of the Ralstonia genus, we used Elongation Efficiency (EloE) software v.0.1. The algorithm has been described in the previous studies [36,37,61] and represented in a detail in a recent article [38], we used the same version of EloE software, which is available in the supplementary materials of that study. Briefly, EloE calculates translation elongation efficiency indices (EEI) considering a number of factors in various combinations, namely, the impact of codon content, number of secondary structures, and energy of these structures in mRNA for all protein-coding genes of the studied organism [62]. Various combinations form the five types of translation elongation efficiency indices (see Table 1).
EloE associates a genome under analysis with one of the five types of highly expressed genes’ elongation efficiency optimization, corresponding to these indices based on the position of ribosomal protein genes in the sorted list of EEI values. To determine the elongation efficiency type, the EloE algorithm takes the genome annotation of an organism in the GenBank format as an input and calculates the translation elongation efficiency indices of all protein-coding genes. These genes are sorted by EEI values in descending order, so every gene has its EEI rank. Then, for each EEI type, such characteristics as mean (M) and standard deviation (R) of the ranks of ribosomal protein genes are calculated. A type with the maximum M and, if there are several types with the maximum M, then the one with the minimum R value is defined as an organism-specific type [36,37], also called the base type and the corresponding EEI is called the base index accordingly. We will also call it the translation elongation optimization type further because while varying amongst different taxa, it reflects the impact of major factors affecting their global optimization of gene translation.
The selected type indicates which parameter(s) of the mRNA structure (codon bias, number of secondary structures, energy of secondary structures) highly impact the elongation translation efficiency of the organism under study. The base type EEI values estimate the basal translation elongation rate in the absence of any additional regulation, which can also be considered as a proxy of basal expression of corresponding genes. Thus, it allows us to distinguish a fraction of potentially highly expressed genes (PHEGs) under average environmental conditions.
It is known that complementary subsequences in mRNA tend to fold and form hairpins [36]. EloE calculates local complementary indices (LCI) [37] for each gene, which reflect the average amount and energy of mRNA secondary structures per gene. The LCI means the average stability of a hairpin, which can be formed by local perfect inverted repeats with a certain length mRNA. The LCI1 is calculated by counting nucleotides from complementary subsequences in a gene, and the LCI2 is calculated by counting energy for nucleotides from complementary subsequences in a gene. Thus, LCI1 and LCI2 characteristics correspond to the number and energy of complementary nucleotides per one nucleotide of the analyzed sequence, respectively.

2.3. Potentially Highly Expressed Genes Analysis

In this study, potentially highly expressed genes (PHEGs) are defined as a fraction of genes with a high base elongation efficiency index (EEI) value. Based on the distribution of the EEI values for each analyzed strain, a 10% threshold was accepted as distinguishing the fraction of potentially highly expressed genes. The set of PHEG was obtained for each organism under study subsequently.
To compare the average amount and energy of mRNA secondary structures of potentially highly expressed genes across the Ralstonia phytopathogenic group, the soil Ralstonia group, and the outgroup C. necator, joint potentially highly expressed genes were obtained for these groups. These are genes that are present in the PHEG list for at least 80% of the analyzed genomes belonging to each of the groups. Then, for each gene of the resulting list of genes for each genome, the LCI1 and LCI2 values were derived, so the sets of LCI1 and LCI2 values were obtained for each phylogenetic group. Then, the significance of the differences between the LCI values for each group’s potentially highly expressed genes was examined by pairwise comparisons of the LCI values between the groups using the Mann–Whitney U test from the SciPy package [63] using Python.

2.4. The Functional Analysis of Potentially Highly Expressed Genes: Clusters of Orthologous Groups (COGs)

Since the list of potentially highly expressed genes (PHEGs) varies according to the selection of base index, the functional analysis of PHEGs becomes an important step to verify that the base EEI reflects the expression level correctly and that the PHEG list does contain genes involved in vital processes of the corresponding groups of microorganisms. Another purpose is to analyze how differences in translation elongation optimization type between phylogenetic groups correspond with their lifestyles. For this, we decided to compare functional groups of PHEGs across phylogenetic groups. To classify the PHEGs by certain functional groups, we used COG (Clusters of Orthologous Groups) identifiers from the COG database [64,65,66]. Each genome was reannotated using the prokka [67] tool, which assigns COG identifiers for the annotated genes, and then the fraction of potentially highly expressed genes (10% of each genome) with corresponding COGs was obtained.
To determine overrepresented COGs in the PHEG set for each phylogenetic group, the number of COGs presented in the phytopathogenic Ralstonia, soil Ralstonia, and C. necator was calculated both for the entire genome and the PHEG list only. Thus, for each COG, three pairs of two-sided exact Fisher’s test were calculated, assessing the pairwise difference in the presence of COGs in the entire gene set and in the PHEG set for the analyzed groups of microorganisms. The confidence level was accepted as sufficient for p < 0.017 after the Bonferroni correction for multiple (3) hypotheses.

2.5. Analysis of Translation Elongation Characteristics of Orthologous Genes

The translation elongation efficiency characteristics of orthologous genes have been compared to determine how differences in elongation efficiency types reflect the changes in particular genes’ elongation efficiency. The orthologous genes have been defined by the Orthofinder tool [68] for the entire set of protein-coding genes from the analyzed genomes (116). It determined 13,487 orthogroups. While designing a sample of highly represented orthogroups, only those orthogroups that contained at least one gene from each genome were further analyzed, which amounted to 2058 orthogroups.
The translation elongation efficiency characteristics for genes classified to the orthogroups were extracted from the EloE output for each genome. These characteristics include the codon utilization index of efficacy Tai (represents codon usage bias; the higher the Tai value, the less it is enriched in common codons), LCI1 (number of secondary structures in mRNA), and LCI2 (the energy of secondary structures in mRNA). Formulae for each of the characteristics have been described in articles [36,37,38,61].
To assess the similarities and differences in the translation elongation efficiency characteristics between orthogroups of the three analyzed phylogenetic branches, the data about genomes were merged into the characteristics of the phylogenetic branches. For each of the characteristics (Tai, LCI1, and LCI2), the pairwise comparisons between the three phylogenetic groups in each orthogroup were performed using Welch’s t-test. The significance level was accepted as sufficient for p < 0.05 after applying the Benjamini–Hochberg Procedure for each of the analyzed characteristics. Based on the significance of differences between the phylogenetic branches, orthogroups were classified by each characteristic into 21 groups, reflecting which had the highest, the lowest, or intermediate values.

2.6. Translation Elongation Efficiency and Divergence Index

To assess how elongation efficiency corresponds to the evolution of genes, we calculated the divergence index [69] for the entire set of protein-coding genes (EGS) of several Ralstonia genus species using Orthoweb [70]. The divergence index (DI) is the ratio of the number of nonsynonymous substitutions per nonsynonymous site to the number of synonymous substitutions per synonymous site in protein-coding sequences, which is also known as the Ka/Ks ratio [71,72]. We calculated the DI between orthologous genes for the number of genomes belonging to the Ralstonia species following the methodology implemented in [73]. The obtained DI values for the EGS and the information about the genomes used in the analysis are available in Supplementary Materials (Table S4).

3. Results

3.1. The Distribution of Ralstonia Genomes by Translation Elongation Optimization Types

The investigation of how the genomes under study are distributed by base EEI types reflecting translation elongation optimization across the Ralstonia genus reveals differentiation of the genomes into EEI4 and EEI5 types according to their phylogenetic group (see Figure 1). The strains of phytopathogenic species (R. solanacearum, R. pseudosolanacearum, and R. syzygii) are mostly classified as representatives of the EEI5 type, which is characterized by mRNA optimization taking into account codon composition and local complementarity with the energies of potential secondary structures. The strains of soil bacteria of the Ralstonia genus (R. insidiosa, R. mannitolilytica, and R. pickettii) are mostly classified as representatives of the EEI4 type, which is characterized by mRNA optimized, taking into account codon composition and the number of potential secondary structures ignoring their energies. The genomes of an outgroup, C. necator, are classified as representatives of the EEI5 type, similar to the phytopathogenic group, although it is soil bacteria similar to R. insidiosa, R. mannitolilytica, and R. pickettii. Therefore, in this case, lifestyle does not determine the translation elongation optimization type.
Since the elongation efficiency type is determined by the relative elongation efficiency of ribosomal protein genes, which is represented by the M (mean rank of ribosomal protein genes EEI) and R (standard deviation of ribosomal protein genes EEI) features, we compared the average M and R values of each type (see Appendix A Table A1; full table with M and R values for each genome analyzed is available in the Supplementary Materials, Table S1). The M and R values of the base EEI type revealed that the genomes of phytopathogenic Ralstonia are characterized by a lower efficiency of translation of ribosomal protein genes than that of C. necator; in turn, the efficiency of translation elongation of ribosomal protein genes in the C. necator is lower than in the soil Ralstonia. The M, R values for EEI1 type for phytopathogenic Ralstonia and C. necator evidence that the impact of codon bias on translation efficiency is weak for these organisms; this thesis is also proved by the similarity between the EEI5, EEI2, and EEI3 values. In contrast, codon bias seems to be a significant feature in the translation efficiency optimization of soil Ralstonia species’ highly expressed genes. Finally, while soil Ralstonia genomes are mostly classified into the EEI4 efficiency type, the translation elongation efficiency characteristics of their ribosomal protein genes are similar for the EEI4 and EEI5 types. Regarding phytopathogenic Ralstonia and C. necator genomes, those characteristics indicate the prevalence of the role of the energy of secondary structures over their number in the optimization of translation elongation.
Summing up, Ralstonia species divides into two groups by translation elongation efficiency type. The first one is represented by phytopathogenic species. Their translation efficiency is optimized against forming stable secondary structures in highly expressed genes with slight optimization by codon content. The second one is represented by soil species that can also act as opportunistic pathogens. Their translation efficiency is optimized against hairpins in general in combination with pronounced codon usage optimization. The outgroup, represented by soil bacteria C. necator, demonstrates characteristics similar to phytopathogenic Ralstonia.

3.2. Comparative Analysis of Translation Elongation Efficiency of Genes in the Genomes of the Two Ralstonia branches and C. necator

The observed differences in elongation efficiency types of Ralstonia species are the result of the differences in the elongation efficiency characteristics of genes. Further analysis has been performed in order to estimate the scale of diversity on the level of genes, with a focus on individual translation elongation efficiency characteristics instead of integrated EEI value.
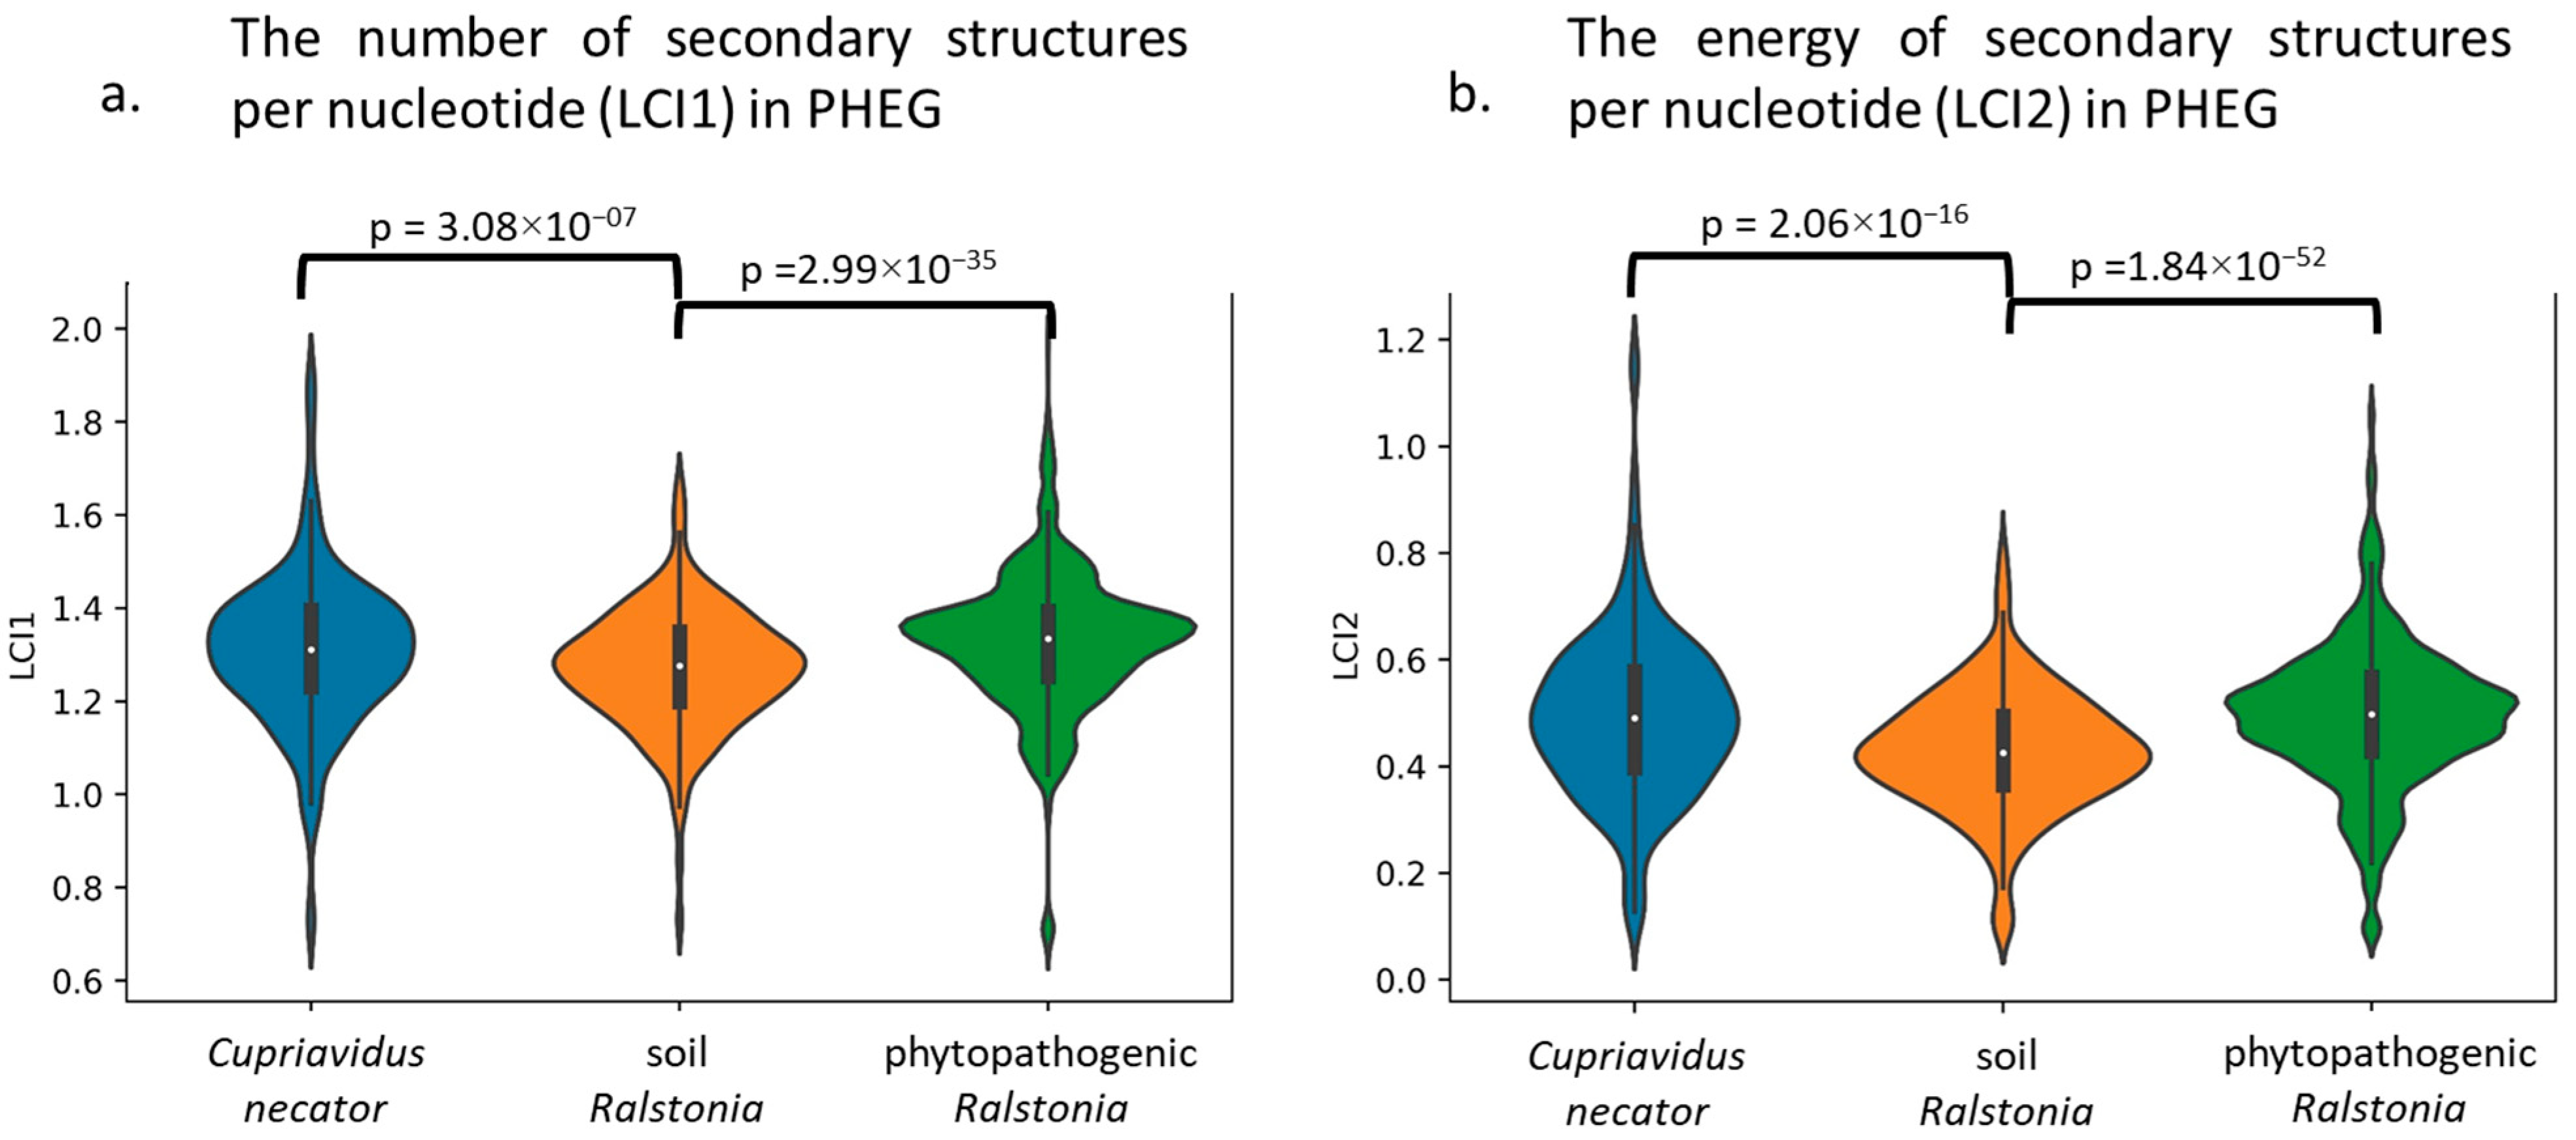
As postulated above, the observed distribution by EEI types points to the strong selection against any secondary structures (not only stable) on highly expressed genes’ mRNA of soil Ralstonia genomes. To validate the above statement, the average number and energy (LCI1 and LCI2, respectively, see [38] for the equations) of mRNA secondary structures per nucleotide for potentially highly expressed genes (PHEGs) were assessed for each phylogenetic branch. Both features have demonstrated significantly lower values for PHEGs of soil Ralstonia in comparison to phytopathogenic Ralstonia and their outgroup (see Figure 2).
Therefore, we conclude that R. insidiosa, R. mannitolilytica, and R. pickettii have decreased both the amount and energy of mRNA secondary structures for the highly expressed genes. It is possible that such a difference is mediated by the shift in translation elongation optimization type.
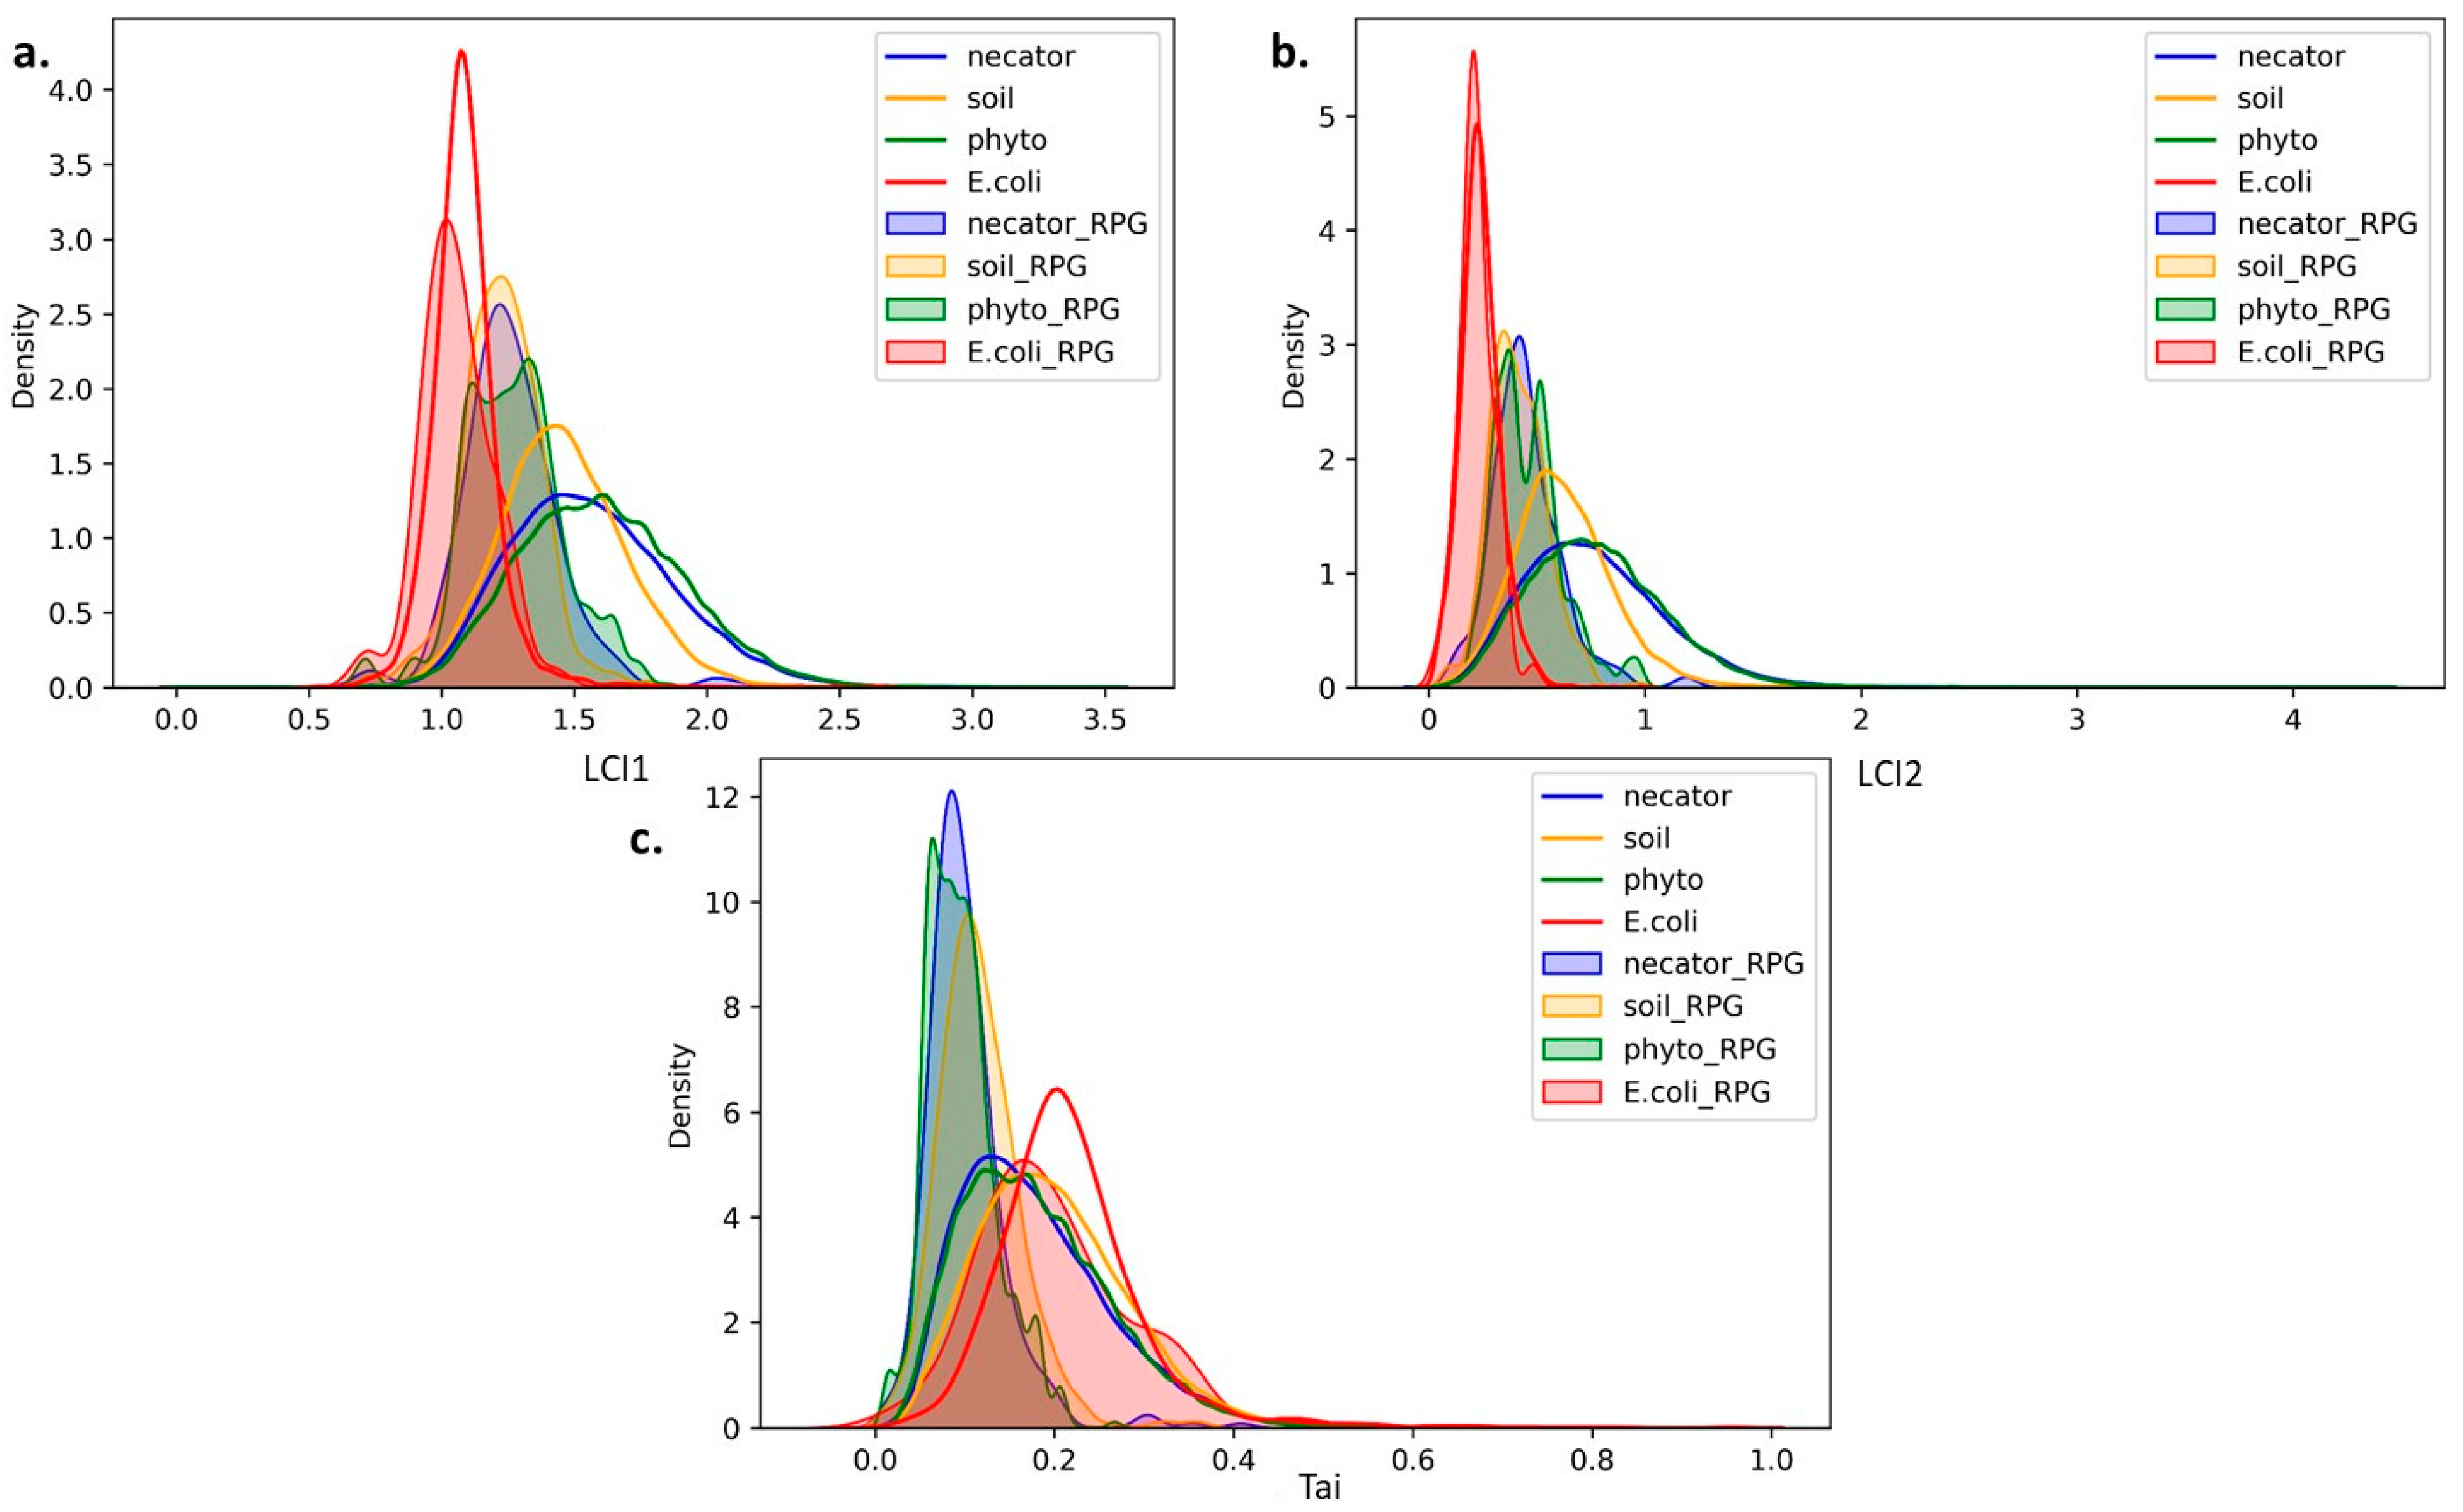
To determine whether the differences in translation elongation efficiency between the phylogenetic groups are specific for PHEGs or widely present across the genome, we analyzed the distributions of LCI1, LCI2, and Tai (codon utilization index of efficacy, which reflects codon usage bias) for both the entire set of protein-coding genes (EGS) and ribosomal protein genes (RPG) of each analyzed phylogenetic group, as shown in Figure 3. We also included such data for the Escherichia coli genome as a representative of EEI1 type, which is strongly optimized by codon usage bias.
The analysis of the LCI1 and LCI2 distributions (Figure 3a,b) demonstrates that the distributions for the EGS are similar for the phytopathogenic Ralstonia and C. necator. Meanwhile, the distribution for soil Ralstonia is shifted leftwards with lower variance, indicating a lower number and energy of secondary structures in the mRNA of their genes. As for ribosomal protein genes, their LCI1 and LCI2 distributions are similar for each of the listed groups. Thus, the LCI1 and LCI2 values discriminate potentially highly expressed ribosomal protein genes from other genes for phytopathogenic Ralstonia and C. necator better than for soil Ralstonia. Remarkably, the distributions of these values in E. coli for both groups of genes are strongly shifted leftwards and are substantially overlapping, demonstrating a reduced number and energy of secondary structures in this genome and a slight role of secondary structures in the optimization of highly expressed genes’ translation efficiency. Similarly, soil Ralstonia demonstrates the left-shifted pattern of LCI1 and LCI2 EGS distributions, indicating the differences between this group and phytopathogenic Ralstonia and C. necator.
On the other hand, the analysis of Tai distribution, which reflects codon usage bias, demonstrates that the EGS distributions for the soil Ralstonia are skewed to the right compared to the phytopathogenic Ralstonia and C. necator. Thus, the mean Tai value for soil Ralstonia is higher. Considering the fact that such a distribution is shifted to the right for E. coli too, which together with higher variance allows us to discriminate highly optimized groups of genes from poorly optimized ones, we conclude that it points out an important role of codon usage bias in soil Ralstonia genomes. To sum up, the soil Ralstonia demonstrates a reduction in the number and energy of secondary structures with the growth of the role of codon usage bias in translation efficiency optimization of highly expressed genes.
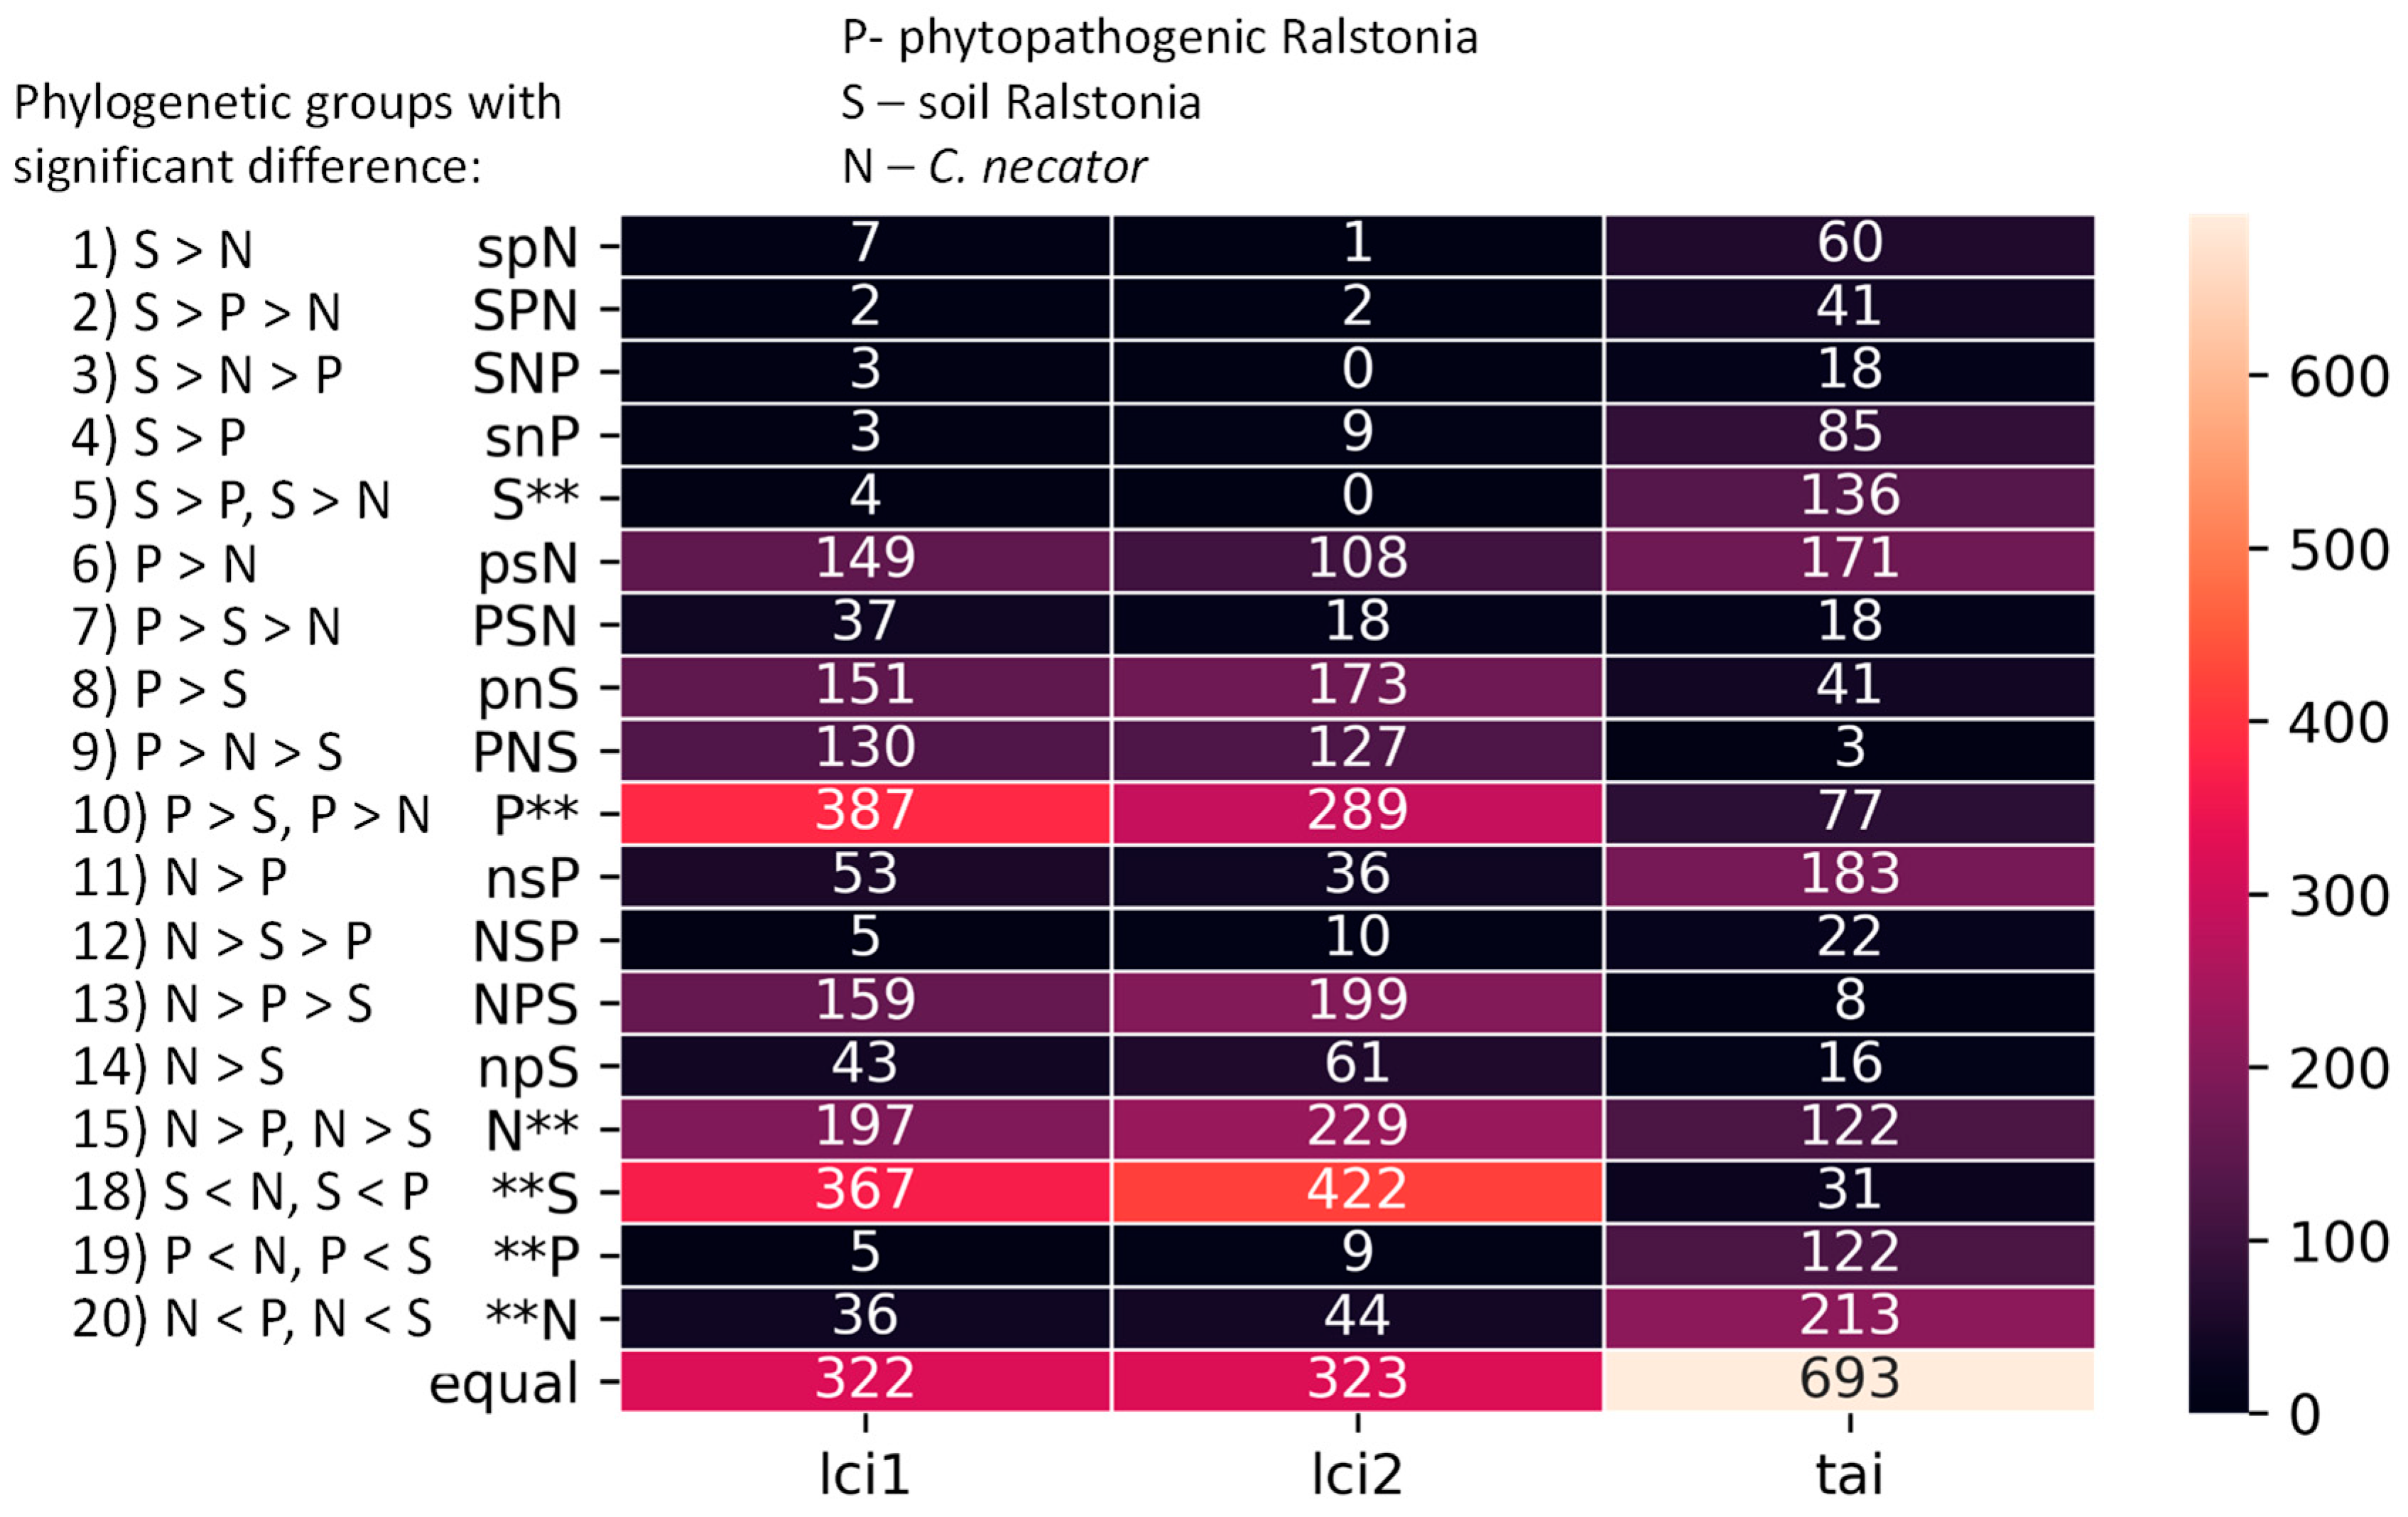
To analyze if variations in these distributions were due to alterations in characteristics of a few genes or a majority of the genes, we examined the translation elongation efficiency characteristics (LCI1, LCI2, Tai) distribution for each orthogroup of each phylogenetic group. We classified 2058 obtained common orthogroups into 21 distinct types based on the observed differences (refer to Figure 4), revealing the diversity of these characteristics among the phylogenetic groups.
We found that translation elongation efficiency characteristics vary among the orthologous genes of the three analyzed phylogenetic groups (see Figure 4). Only 15.6%, 15.7%, and 33.7% of genes demonstrate similar values for the LCI1, LCI2, and Tai, respectively. Notably, the genes of soil Ralstonia rarely demonstrate the highest number (LCI1) or energy (LCI2) of secondary structures (see lines 1–5 in Figure 4) in comparison to the phytopathogenic Ralstonia and the outgroup. Inversely, the situation when LCI1 and LCI2 are low for soil Ralstonia is frequent in the orthogroups (see lines 8–10 and 13–18 in Figure 4). Thus, about 30% of analyzed soil Ralstonia genes have significantly lower LCI values than both the other groups, and about 70% of genes have a significantly lower value in comparison to at least one of the groups, while only 3% of the orthologous genes have LCI values significantly higher than in any other group. It supports the idea of stronger selection against secondary structures in soil Ralstonia, not only in a narrow PHEG set but for a substantial part of genes.
While phytopathogenic Ralstonia and C. necator demonstrate very similar distributions for each of the characteristics analyzed, they also have many orthologous genes that differ by translation elongation efficiency characteristics. Thus, about 36% and 29% of phytopathogenic Ralstonia genes demonstrate higher numbers of LCI1 and LCI2 than C. necator, respectively, and oppositely, 20% and 23% of their genes are less enriched in secondary structures according to their LCI1 and LCI2 values, respectively. The observed differences are a result of mutations in the coding sequences of the respective genes.
The observed differences in the translation elongation efficiency characteristics of genes are supposed to impact the content of the PHEG set; therefore, it is necessary to assess how the subsequent change in the PHEG list corresponds to an organism’s lifestyle and phylogeny.

3.3. The Functional Analysis of Potentially Highly Expressed Genes

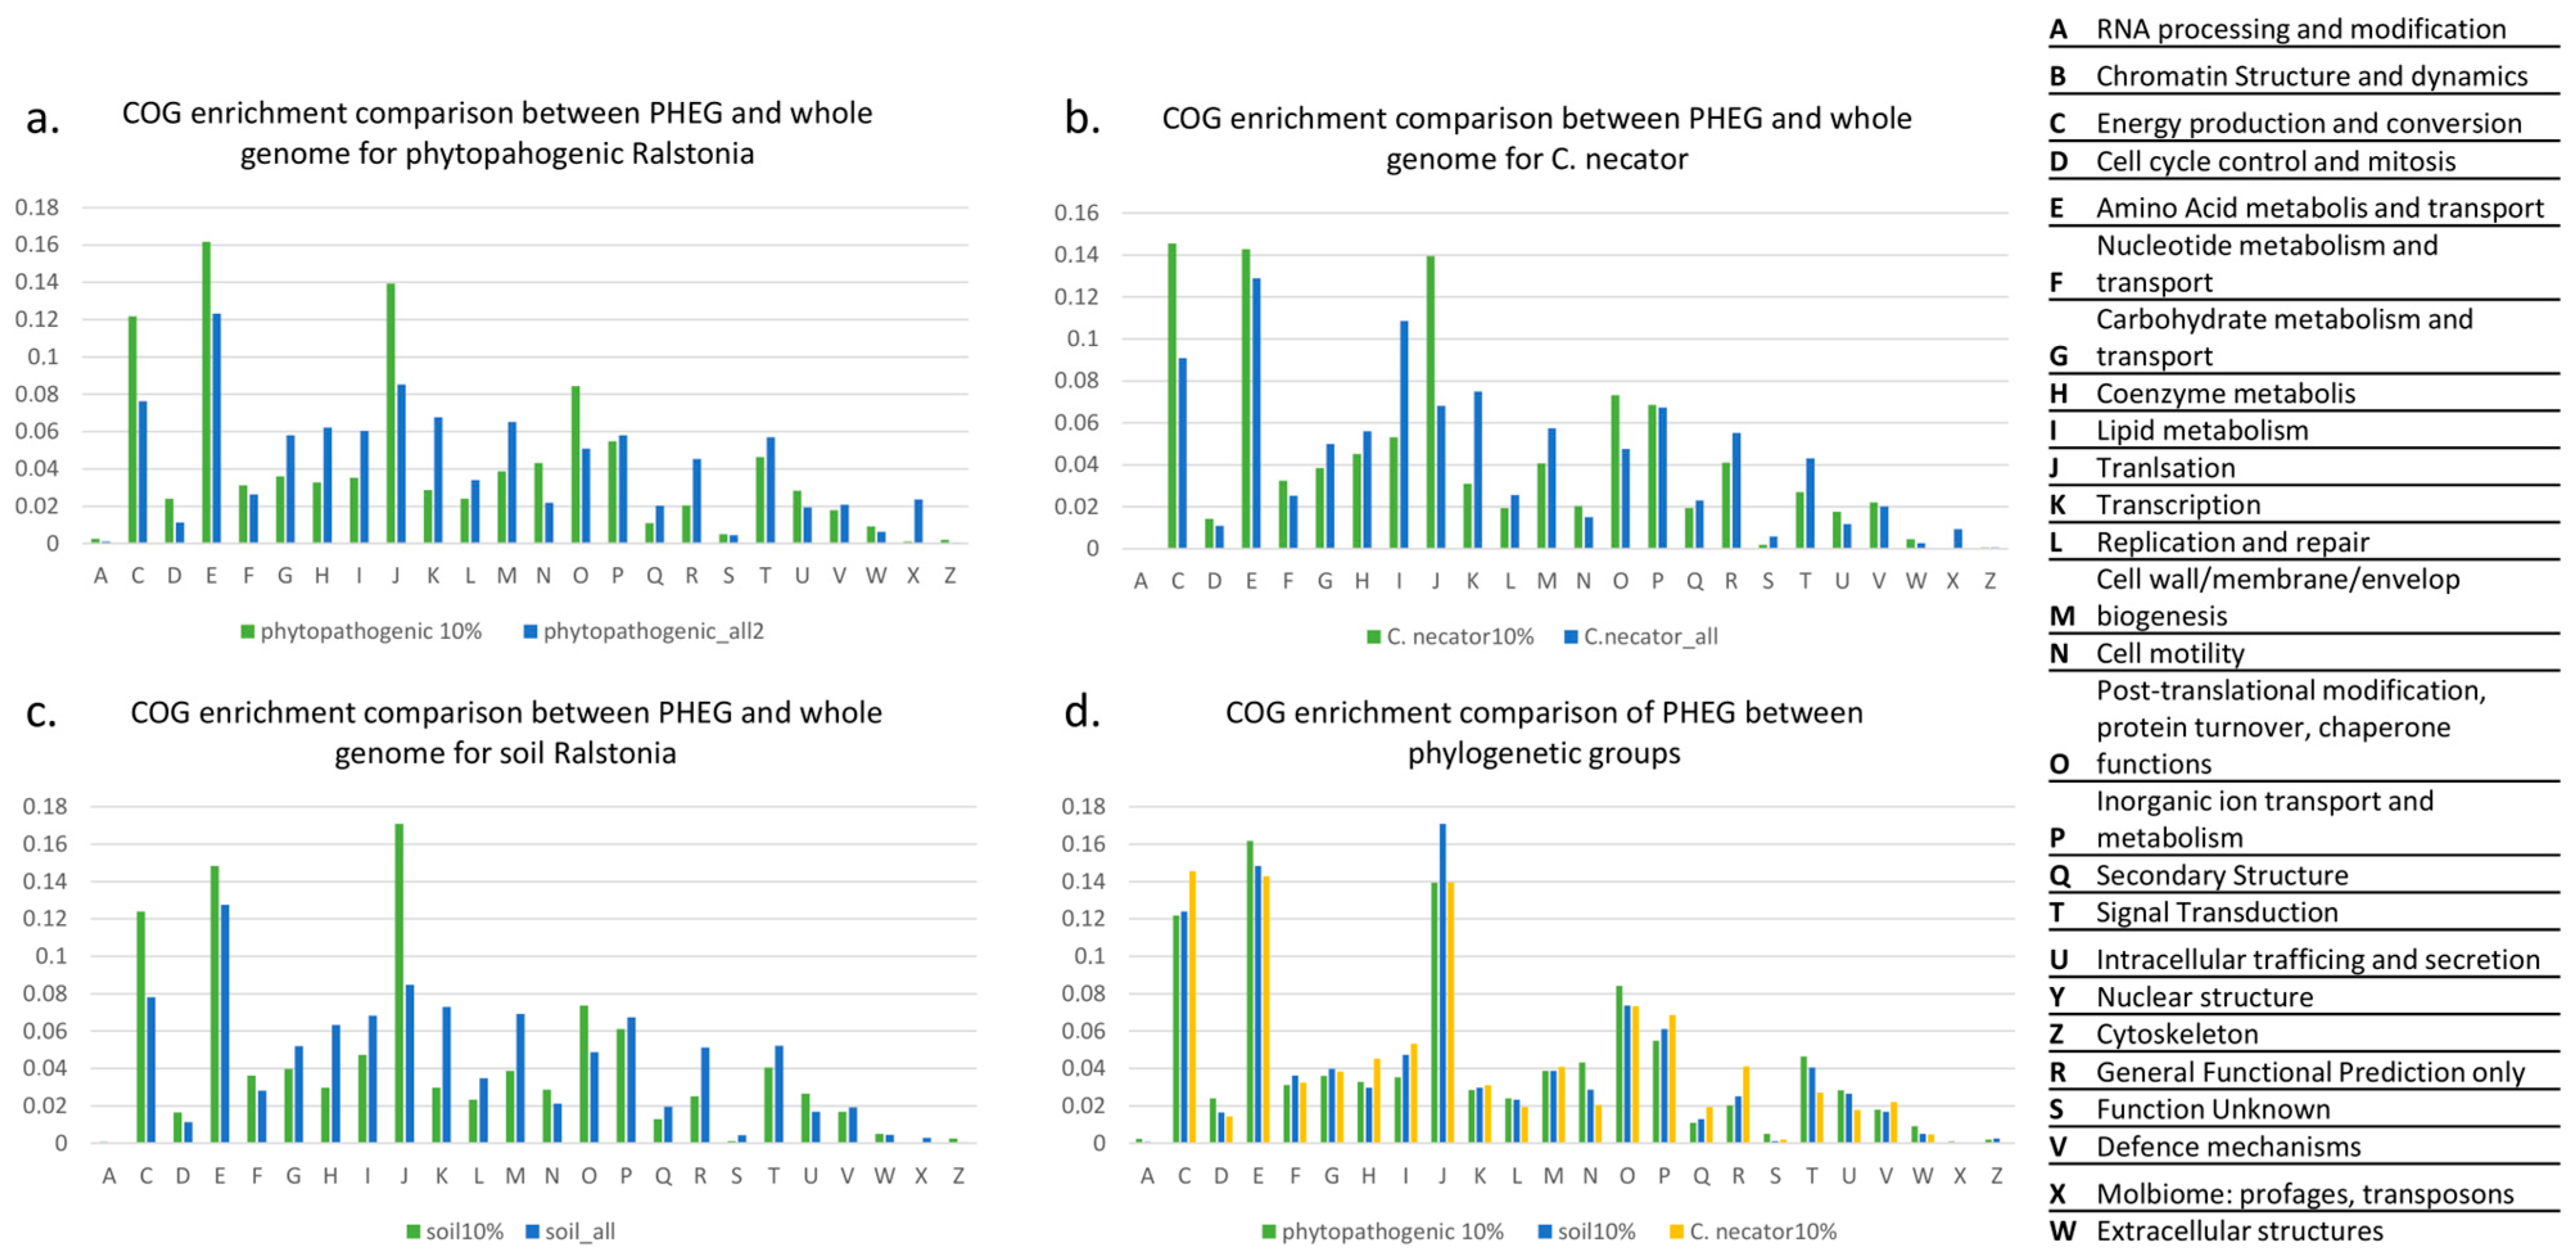
The main idea of optimization of translation elongation efficiency is the facilitation of highly expressed gene translation; thus, highly expressed genes should be optimized. Following the idea, adjusting the translation efficiency of particular genes during evolution may indicate changes in gene expression, possibly as a result of the adaptation of an organism to the environment [74]. The changes in characteristics of translation elongation efficiency in those genes that used to be highly optimized might result in phenotype changes. Thus, the sets of potentially highly expressed genes (PHEGs) serve as the most suggestive subsamples for a related functional analysis. Here, we perform such an analysis for the genomes of three phylogenetic branches (soil Ralstonia, phytopathogenic Ralstonia, C. necator) with diverse characteristics of translation elongation efficiency. We provide the COG enrichment analysis for both the PHEG and the entire gene (EGS) sets for each of the analyzed phylogenetic groups. The obtained p-values are located in Table A2 in Appendix A, and the fractions of each COG obtained by analyzing the PHEGs and by genome-wide analysis for each phylogenetic group are located in Table A3 in Appendix A.
As expected, the most represented COGs refer to the base cell processes: translation, energy production and conversion, and amino acid metabolism (see Figure 5). The fraction of these processes in the PHEG set is much larger compared to the EGS for any group of analyzed organisms, which corresponds to the fact that the genes maintaining these functions are supposed to be highly expressed. Thus, it confirms the assumption that the set of PHEGs obtained by the evaluation of elongation efficiency covers the essential cell processes. Moreover, the COG content at the genome scale is similar for the soil and the phytopathogenic Ralstonia groups. That means that while belonging to different EEI types and demonstrating differences in translation elongation efficiency for many genes, the analyzed genomes keep optimizing similar metabolic processes.
Next, we assessed how often particular COGs fall into the PHEG category for each phylogenetic group (see Table S2 in Supplementary Materials). The analysis of the difference in the presence of particular COGs in the PHEG set of the three phylogenetic groups has revealed 81 COGs with significant differences. Most of these COGs (64) tend to be overrepresented in the genomes of soil Ralstonia and C. necator. The products of these genes are responsible for translation (21 COGs), carbohydrate metabolism and transport, five COGs related to cell wall construction, and five related to carbohydrate metabolism and transport. There are also five genes involved in ion transport (ferredoxin subunit of nitrite reductase or a ring-hydroxylating dioxygenase, ABC-transport system genes COG1653), and three transcription regulation genes (cold shock protein COG1278, COG2183, sigma subunit COG0568). As for cold shock protein, it is worth noting that this protein has been discovered to elicit an immune response in plants [75]; therefore, its overexpression in phytopathogenic Ralstonia should be avoided.
A few (7) COGs responsible for different functions are specific for PHEGs of C. necator; 6 COGs specific for PHEG set of phytopathogenic Ralstonia, where 3 of those genes play a role in response to the environmental changes: HTH-type transcriptional regulatory protein GabR COG1167, Anaerobic regulatory protein COG0664, Regulatory protein AtoC COG2204 involved into the regulation of motility and chemotaxis [76]. Considering functions of corresponding genes, changes in translation efficiency may serve for adaptation to a phytopathogenic lifestyle.
Interestingly, the potentially highly expressed genes tend to be non-divergent in terms of the Ka/Ks ratio (correlation coefficient with the EEI for the entire set of protein-coding genes of Ralstonia solanacearum GMI1000 r = −0.3865 p-value = 1.6 × 10−169). There are a few exceptions, though most of them have unknown functions, and some genes are involved in pathogenicity and are characterized by modest translation elongation efficiency (see Table S3 in the Supplementary Materials).

4. Discussion

The investigation of translation elongation efficiency in the Ralstonia genus has revealed interesting insights into the evolution of these bacteria. We have found that the Ralstonia genus, which had been recently described as consisting of two branches [77], had diverged during its evolution by the optimization type of translation elongation efficiency. While there is an agreement between the phylogenetic group and translation elongation efficiency type for the Ralstonia genus, the fact that an outgroup represented by soil bacteria C. necator belongs to the same translation elongation efficiency type as phytopathogenic Ralstonia instead of soil Ralstonia group shows that in this case elongation efficiency, optimization type is not accounted for fitness to a particular lifestyle.
We found that the genes of soil Ralstonia have significantly lower number and energy of secondary structures in mRNA compared to both phytopathogenic Ralstonia and C. necator and not only in the potentially highly expressed genes’ (PHEG) set but also in the entire set of protein-coding genes. It impairs the discrimination of highly expressed genes from other genes by secondary structure characteristics (LCI1, LCI2); however, accounting for secondary structures remains necessary for correctly assessing translation elongation efficiency. While the role of secondary structures decreases, the role of codon frequency content optimization increases for the highly expressed genes in soil Ralstonia. Since GC-rich sequences tend to form more stable structures, GC content may also play a role in the observed differences between species, which is supported by the fact that it is lower in soil Ralstonia (64%) than in phytopathogenic Ralstonia (67%) and C. necator (66%). The optimization of translation elongation efficiency of highly expressed genes by codon usage bias is common for fast-growing organisms [78], serving as an adaptation for maximizing the rate of protein production and subsequent division [79]. However, the analyzed microbes demonstrate quite similar minimal doubling time rates: 2.3 h for R. solanacearum GMI1000 [80], which represents phytopathogenic Ralstonia, and a minimum 1 h (in well-optimized conditions) for C. necator [81] and about 2 h for R. insidiosa [82], which represents soil Ralstonia. Thus, there is no evidence that detected diversity in translation elongation efficiency in the Ralstonia genus, serving as an adaptation for raising bacterial growth rate.
The differences in the type of translation elongation efficiency have not been formed by changes in gene repertoire or mutations of particular genes (in particular, ribosomal protein genes). Conversely, the differences in number, energy of secondary structure, and codon usage bias have been detected for most orthologous genes. Notably, phytopathogenic Ralstonia and C. necator demonstrate many orthologous genes differing by translation elongation efficiency characteristics due to mutations in coding sequences that occurred during evolution, which may impact the translation elongation efficiency of particular genes. Since C. necator is an outgroup, we could expect more differences in coding sequences between it and Ralstonia. However, more orthologous genes differ between soil Ralstonia and phytopathogenic Ralstonia than between phytopathogenic Ralstonia and C. necator by translation elongation efficiency characteristics. It points to driving selection for reducing the number and energy of secondary structures in protein-coding genes of soil Ralstonia species.
Such variability in the characteristics of translation elongation efficiency affects the content of the potentially highly expressed genes (PHEG) set, which reflects in the presence or absence of some particular genes in that set. However, most of the genes in the PHEG set are common among analyzed species and are related to the primary metabolism, which speaks in favor of adequate representation of potentially highly expressed genes by respective EEI indices. While the elongation efficiency types distribution of the analyzed species do not correspond to their lifestyles, several genes involved in specific responses to the environment were shown to be overrepresented in the PHEG set of phytopathogenic Ralstonia, which points to the possible role of elongation efficiency alterations in particular genes as adaptations to the lifestyle. Overall, these findings shed light on the complex interplay between secondary structures in mRNA and codon usage bias in the optimization of translation elongation efficiency that shapes the evolution of the Ralstonia genus.

5. Conclusions

In this study, we have found that translation elongation efficiency characteristics diverge in accordance with the phylogeny of the Ralstonia genus. Soil Ralstonia have a lower number and energy of potential secondary structures in their mRNA and an increased role of codon usage bias in optimizing highly expressed genes’ translation elongation efficiency in comparison to both phytopathogenic Ralstonia and an outgroup, represented by soil bacteria. The differences in the characteristics of translation elongation efficiency have been detected for most orthologous genes, affecting the sets of potentially highly expressed genes constructed based on translation efficiency characteristics. We have demonstrated that certain genes involved in specific responses to the environment are overrepresented in the potentially highly expressed genes set of plant pathogenic Ralstonia, suggesting that alterations in the elongation efficiency of these genes may have played a role in the adaptation to their lifestyle. Overall, we believe that the presented analysis of the characteristics of translation elongation efficiency has shown to be a promising approach for studying the complex mechanisms that determine the evolution and adaptation of bacteria in various environments.

Supplementary Materials

The following supporting information can be downloaded at: https://www.mdpi.com/article/10.3390/biology12101338/s1, Table S1: genomes’ accessions; Table S2: total_number_of_COGs and specific_COGs; Table S3: binding-protein-dependent transport system inner membrane component family protein; Table S4: DI1_no_ort_all. DI_indexes_all_genes.

Author Contributions

Conceptualization, A.I.K. and A.Y.K.; investigation, A.Y.K.; methodology, A.I.K. and Y.G.M.; supervision, Y.G.M. and S.A.L.; Formal analysis, A.Y.K. and Z.S.M.; visualization, A.Y.K.; writing—original draft, A.Y.K. and A.I.K.; writing—review and editing, A.Y.K., A.I.K., S.A.L., and Y.G.M. All authors have read and agreed to the published version of the manuscript.

Funding

This research was funded by the Kurchatov Genomic Centre of the Institute of Cytology and Genetics, SB RAS (075-15-2019-1662).

Institutional Review Board Statement

Not applicable.

Informed Consent Statement

Not applicable.

Data Availability Statement

All data generated during this study are included in this published article.

Conflicts of Interest

The authors declare no conflict of interest.

Appendix A

Table A1. The average M and R values for each elongation efficiency type, where the numbers behind the M and R letters point to the elongation efficiency type analyzed; for instance, M1, R1 represent translation elongation efficiency for the EEI1 type. Bold represents the most optimal values, indicating the base elongation efficiency type of the species.
OrganismM1R1M2R2M3R3M4R4M5R5
Ralstonia pseudosolanacearum−37366431643152356825
Ralstonia solanacearum−27416831683262317026
Ralstonia syzygii−23406730682759356827
Ralstonia insidiosa74315736553687198620
Ralstonia mannitolilytica39427025692781228020
Ralstonia pickettii60346033583684218223
Cupriavidus necator7436234643268327726
Table A2. p-values calculated in the COG enrichment analysis using the exact Fisher’s test. Columns ps_pval, pn_pval, and sn_pval reflect the comparison of enrichment by each COG for potentially highly expressed genes (PHEGs) between the phytopathogenic Ralstonia group and the soil Ralstonia group, between the phytopathogenic Ralstonia group and the C. necator group, and between the soil Ralstonia group and the C. necator group, respectively. Columns ps_pval_all, pn_pval_all, and sn_pval_all reflect the comparison of enrichment by each COG for all genes between the same groups. Columns p_pval, n_pval, and s_pval reflect the comparison of COG enrichment between the PHEGs and all genes for the phytopathogenic Ralstonia group, the soil Ralstonia group, and the C. necator group, respectively.
COGComparison of COG Enrichment of PHEG Set between GroupsComparison of COG Enrichment of
Entire Gene Set between Groups
Comparison of COG Enrichment
between PHEG and Entire Gene Set for Each Group
ps_pval.pn_pval.sn_pval.ps_pval_allpn_pval_allsn_pval_allp_pvaln_pvals_pval
A1.52 × 10−18.40 × 10−33.81 × 10−16.38 × 10−21.05 × 10−27.23 × 10−11.04 × 10−96.78 × 10−16.36 × 10−1
C8.55 × 10−13.19 × 10−36.42 × 10−25.82 × 10−12.59 × 10−101.02 × 10−41.43 × 10−1536.82 × 10−145.47 × 10⁻¹⁸
D3.71 × 10−23.68 × 10−36.75 × 10−19.33 × 10−17.62 × 10−17.62 × 10−14.27 × 10−663.88 × 10−21.30 × 10−1
E1.82 × 10−13.49 × 10−27.33 × 10−11.82 × 10−16.24 × 10−27.62 × 10−11.76 × 10−785.21 × 10−34.82 × 10−2
F2.63 × 10−18.44 × 10−16.09 × 10−12.58 × 10−15.82 × 10−11.81 × 10−11.70 × 10−63.18 × 10−23.88 × 10−2
G4.64 × 10−16.50 × 10−18.73 × 10−13.61 × 10−34.95 × 10−55.82 × 10−11.71 × 10−659.51 × 10−39.51 × 10−3
H6.09 × 10−14.21 × 10−31.02 × 10−27.23 × 10−13.70 × 10−31.33 × 10−24.70 × 10−1142.43 × 10−132.13 × 10⁻²
I8.13 × 10−36.29 × 10−55.12 × 10−12.20 × 10−43.74 × 10−1111.11 × 10−361.25 × 10−824.44 × 10−51.33 × 10−22
J2.51 × 10−49.93 × 10−18.13 × 10−38.61 × 10−14.27 × 10−147.72 × 10−86.13 × 10−1958.06 × 10−392.17 × 10⁻³⁴
K8.55 × 10−16.09 × 10−18.94 × 10−12.64 × 10−21.25 × 10−36.36 × 10−12.81 × 10−1961.35 × 10−195.65 × 10⁻²¹
L9.51 × 10−12.25 × 10−14.89 × 10−17.23 × 10−11.67 × 10−87.48 × 10−64.38 × 10−222.66 × 10−34.90 × 10−2
M9.88 × 10−17.04 × 10−18.55 × 10−18.57 × 10−22.51 × 10−44.95 × 10−59.39 × 10−864.74 × 10−103.40 × 10⁻⁴
N1.84 × 10−34.25 × 10−91.31 × 10−17.23 × 10−15.75 × 10−91.12 × 10−41.13 × 10−1002.08 × 10−24.78 × 10⁻²
O1.48 × 10−11.14 × 10−19.88 × 10−13.43 × 10−11.03 × 10−17.34 × 10−12.77 × 10−1184.92 × 10−75.17 × 10⁻⁸
P3.03 × 10−11.02 × 10−24.32 × 10−19.35 × 10−66.90 × 10−61.002.09 × 10−22.44 × 10−18.24 × 10−1
Q5.12 × 10−11.84 × 10−31.48 × 10−17.34 × 10−12.35 × 10−25.50 × 10−28.33 × 10−342.08 × 10−22.54 × 10−1
R2.09 × 10−11.80 × 10−94.84 × 10−31.55 × 10−34.80 × 10−81.77 × 10−15.63 × 10−1163.64 × 10−102.15 × 10⁻³
S5.15 × 10−35.77 × 10−26.75 × 10−11.002.81 × 10−21.25 × 10−11.30 × 10−18.15 × 10−38.65 × 10−3
T3.03 × 10−18.94 × 10−62.19 × 10−22.11 × 10−21.03 × 10−134.08 × 10−42.24 × 10−151.44 × 10−24.65 × 10−5
U7.76 × 10−13.19 × 10−37.31 × 10−24.03 × 10−21.68 × 10−124.57 × 10−41.11 × 10−231.32 × 10−31.47 × 10−2
V8.63 × 10−12.25 × 10−13.10 × 10−12.36 × 10−17.34 × 10−16.42 × 10−11.15 × 10−34.91 × 10−15.68 × 10−1
W7.32 × 10−23.54 × 10−29.16 × 10−12.11 × 10−24.03 × 10−91.33 × 10−21.66 × 10−87.85 × 10−11.19 × 10−1
X2.25 × 10−12.25 × 10−11.002.47 × 10−992.70 × 10−391.37 × 10−133.78 × 10−2612.15 × 10−32.81 × 10⁻¹¹
Z6.75 × 10−12.31 × 10−12.09 × 10−17.62 × 10−14.12 × 10−17.49 × 10−11.45 × 10−158.25 × 10−31.00
Table A3. COG composition for the phytopathogenic Ralstonia group, the soil Ralstonia group, and the C. necator group, in case of analyzing the COG content in the PHEG set (phyto10%, soil10%, necator10%), and in case of analyzing the COG content for genes of the whole genome (phyto_all, soil_all, and necator_all).
COGFraction of COG in the PHEG SetFraction of COG in the Whole Genome
Phyto_10%Soil_10%Necator_10%Phyto_AllSoil_AllNecator_All
A0.0024770.00071800.0010380.0004990.000357
C0.1218030.1239220.1455340.0763580.0780660.090947
D0.0240210.0165230.0143860.0113230.011420.010959
E0.1616980.1483480.1428570.1233210.1275510.128946
F0.0312420.0362790.0324520.0264140.0282060.025372
G0.0360160.0398710.0384740.0579950.0519190.04997
H0.0327630.0298130.0451660.0621620.0632760.056045
I0.035330.0474140.0531950.0603260.0682680.108517
J0.1394380.1709770.1395120.0853390.0848050.068195
K0.0286160.0298130.0311140.0677290.0728860.074926
L0.024080.0233480.0194040.0339840.0347580.02567
M0.0387010.0387930.0408160.0651830.0692040.057475
N0.0432670.0287360.0204080.0219050.0212170.015068
O0.0842960.0736350.0732690.0509510.0487990.047647
P0.0547850.0610630.0685850.0581280.0674570.067421
Q0.0110110.0129310.0194040.0202330.0196570.023169
R0.020380.0251440.0411510.0453480.0513570.055331
S0.0051020.0010780.0020070.0044680.0044310.005837
T0.046370.0405890.0270990.0570550.0521680.04318
U0.0283770.026580.0177320.0194310.0168490.011852
V0.0179930.0168820.0220810.0208360.0191580.02025
W0.0091610.0050290.0046840.0062520.0046180.00274
X0.001044000.0237040.0028710.00941
Z0.0020290.0025140.0006690.0005160.0005620.000715

References

  1. Zhang, Y.; Qiu, S. Phylogenomic Analysis of the Genus Ralstonia Based on 686 Single-Copy Genes. Antonie Leeuwenhoek 2016, 109, 71–82. [Google Scholar] [CrossRef] [PubMed]
  2. Moriuchi, R.; Dohra, H.; Kanesaki, Y.; Ogawa, N. Complete Genome Sequence of 3-Chlorobenzoate-Degrading Bacterium Cupriavidus Necator NH9 and Reclassification of the Strains of the Genera Cupriavidus and Ralstonia Based on Phylogenetic and Whole-Genome Sequence Analyses. Front. Microbiol. 2019, 10, 133. [Google Scholar] [CrossRef]
  3. Waugh, J.B.; Granger, W.M.; Gaggar, A. Incidence, Relevance and Response for Ralsfonia Respiratory Infections. Clin. Lab. Sci. 2010, 23, 99–106. [Google Scholar] [CrossRef] [PubMed]
  4. Fang, Q.; Feng, Y.; Feng, P.; Wang, X.; Zong, Z. Nosocomial Bloodstream Infection and the Emerging Carbapenem-Resistant Pathogen Ralstonia Insidiosa. BMC Infect. Dis. 2019, 19, 334. [Google Scholar] [CrossRef] [PubMed]
  5. Peeters, N.; Guidot, A.; Vailleau, F.; Valls, M. Ralstonia Solanacearum, a Widespread Bacterial Plant Pathogen in the Post-Genomic Era. Mol. Plant Pathol. 2013, 14, 651–662. [Google Scholar] [CrossRef]
  6. Boël, G.; Letso, R.; Neely, H.; Price, W.N.; Su, M.; Luff, J.; Valecha, M.; Everett, J.K.; Acton, T.B.; Xiao, R.; et al. Codon Influence on Protein Expression in E.Coli. Nature 2016, 529, 358–363. [Google Scholar] [CrossRef]
  7. Mohammad, F.; Green, R.; Buskirk, A.R. A Systematically-Revised Ribosome Profiling Method for Bacteria Reveals Pauses at Single-Codon Resolution. Elife 2019, 8, e42591. [Google Scholar] [CrossRef]
  8. Quax, T.E.F.; Claassens, N.J.; Söll, D.; van der Oost, J. Codon Bias as a Means to Fine-Tune Gene Expression. Mol. Cell 2015, 59, 149–161. [Google Scholar] [CrossRef]
  9. Guimaraes, J.C.; Rocha, M.; Arkin, A.P. Transcript Level and Sequence Determinants of Protein Abundance and Noise in Escherichia Coli. Nucleic Acids Res. 2014, 42, 4791–4799. [Google Scholar] [CrossRef]
  10. Zhang, D.; Li, S.H.J.; King, C.G.; Wingreen, N.S.; Gitai, Z.; Li, Z. Global and Gene-Specific Translational Regulation in Escherichia Coli across Different Conditions. PLoS Comput. Biol. 2022, 18, e1010641. [Google Scholar] [CrossRef]
  11. Zhang, Y.; Xiao, Z.; Zou, Q.; Fang, J.; Wang, Q.; Yang, X.; Gao, N. Ribosome Profiling Reveals Genome-Wide Cellular Translational Regulation upon Heat Stress in Escherichia Coli. Genom. Proteom. Bioinformatics. 2017, 15, 324–330. [Google Scholar] [CrossRef] [PubMed]
  12. Ikemura, T. Codon Usage and TRNA Content in Unicellular and Multicellular Organisms. Mol. Biol. Evol. 1985, 2, 13–34. [Google Scholar] [CrossRef]
  13. Wright, F. The “effective Number of Codons” Used in a Gene. Gene 1990, 87, 23–29. [Google Scholar] [CrossRef]
  14. Sørensen, M.A.; Kurland, C.G.; Pedersen, S. Codon Usage Determines Translation Rate in Escherichia Coli. J. Mol. Biol. 1989, 207, 365–377. [Google Scholar] [CrossRef] [PubMed]
  15. Komar, A.A. The Yin and Yang of Codon Usage. Hum. Mol. Genet. 2016, 25, R77–R85. [Google Scholar] [CrossRef] [PubMed]
  16. Wei, Y.; Silke, J.R.; Xia, X. An Improved Estimation of TRNA Expression to Better Elucidate the Coevolution between TRNA Abundance and Codon Usage in Bacteria. Sci. Rep. 2019, 9, 3184. [Google Scholar] [CrossRef]
  17. Rodnina, M.V. Translation in Prokaryotes. Cold Spring Harb. Perspect. Biol. 2018, 10, a032664. [Google Scholar] [CrossRef]
  18. Higgs, P.G.; Ran, W. Coevolution of Codon Usage and TRNA Genes Leads to Alternative Stable States of Biased Codon Usage. Mol. Biol. Evol. 2008, 25, 2279–2291. [Google Scholar] [CrossRef]
  19. Wang, S.E.; Brooks, A.E.S.; Poole, A.M.; Simoes-Barbosa, A. Determinants of Translation Efficiency in the Evolutionarily-Divergent Protist Trichomonas Vaginalis. BMC Mol. Cell Biol. 2020, 21, 54. [Google Scholar] [CrossRef]
  20. Cambray, G.; Guimaraes, J.C.; Arkin, A.P. Evaluation of 244,000 Synthetic Sequences Reveals Design Principles to Optimize Translation in Escherichia Coli. Nat. Biotechnol. 2018, 36, 1005. [Google Scholar] [CrossRef]
  21. Hia, F.; Takeuchi, O. The Effects of Codon Bias and Optimality on MRNA and Protein Regulation. Cell. Mol. Life Sci. 2021, 78, 1909–1928. [Google Scholar] [CrossRef] [PubMed]
  22. Frumkin, I.; Lajoie, M.J.; Gregg, C.J.; Hornung, G.; Church, G.M.; Pilpel, Y. Codon Usage of Highly Expressed Genes Affects Proteome-Wide Translation Efficiency. Proc. Natl. Acad. Sci. USA 2018, 115, E4940–E4949. [Google Scholar] [CrossRef] [PubMed]
  23. Jeacock, L.; Faria, J.; Horn, D. Codon Usage Bias Controls MRNA and Protein Abundance in Trypanosomatids. Elife 2018, 7, e32496. [Google Scholar] [CrossRef] [PubMed]
  24. Thanaraj, T.A.; Argos, P. Ribosome-Mediated Translational Pause and Protein Domain Organization. Protein Sci. 1996, 5, 1594–1612. [Google Scholar] [CrossRef]
  25. Wen, J.-D.; Lancaster, L.; Hodges, C.; Zeri, A.-C.; Yoshimura, S.H.; Noller, H.F.; Bustamante, C.; Tinoco, I. Following Translation by Single Ribosomes One Codon at a Time. Nature 2008, 452, 598–603. [Google Scholar] [CrossRef] [PubMed]
  26. Pop, C.; Rouskin, S.; Ingolia, N.T.; Han, L.; Phizicky, E.M.; Weissman, J.S.; Koller, D. Causal Signals between Codon Bias, MRNA Structure, and the Efficiency of Translation and Elongation. Mol. Syst. Biol. 2014, 10, 770. [Google Scholar] [CrossRef]
  27. Shah, P.; Ding, Y.; Niemczyk, M.; Kudla, G.; Plotkin, J.B. XRate-Limiting Steps in Yeast Protein Translation. Cell 2013, 153, 1589. [Google Scholar] [CrossRef]
  28. Kertesz, M.; Wan, Y.; Mazor, E.; Rinn, J.L.; Nutter, R.C.; Chang, Y.H.; Segal, E. Genome-Wide Measurement of RNA Secondary Structure in Yeast. Nature 2010, 467, 103–107. [Google Scholar] [CrossRef]
  29. Chiaruttini, C.; Guillier, M. On the Role of MRNA Secondary Structure in Bacterial Translation. Wiley Interdiscip. Rev. RNA 2020, 11, e1579. [Google Scholar] [CrossRef]
  30. Mauger, D.M.; Joseph Cabral, B.; Presnyak, V.; Su, S.V.; Reid, D.W.; Goodman, B.; Link, K.; Khatwani, N.; Reynders, J.; Moore, M.J.; et al. MRNA Structure Regulates Protein Expression through Changes in Functional Half-Life. Proc. Natl. Acad. Sci. USA 2019, 116, 24075–24083. [Google Scholar] [CrossRef]
  31. Zhang, Q.; Ma, D.; Wu, F.; Standage-Beier, K.; Chen, X.; Wu, K.; Green, A.A.; Wang, X. Predictable Control of RNA Lifetime Using Engineered Degradation-Tuning RNAs. Nat. Chem. Biol. 2021, 17, 828–836. [Google Scholar] [CrossRef] [PubMed]
  32. Mohanty, B.K.; Kushner, S.R. Regulation of MRNA Decay in Bacteria. Annu. Rev. Microbiol. 2016, 70, 25–44. [Google Scholar] [CrossRef]
  33. Hanson, G.; Coller, J. Translation and Protein Quality Control: Codon Optimality, Bias and Usage in Translation and MRNA Decay. Nat. Rev. Mol. Cell Biol. 2018, 19, 20–30. [Google Scholar] [CrossRef]
  34. Victor, M.P.; Acharya, D.; Begum, T.; Ghosh, T.C. The Optimization of MRNA Expression Level by Its Intrinsic Properties—Insights from Codon Usage Pattern and Structural Stability of MRNA. Genomics 2019, 111, 1292–1297. [Google Scholar] [CrossRef] [PubMed]
  35. Gorochowski, T.E.; Ignatova, Z.; Bovenberg, R.A.L.; Roubos, J.A. Trade-Offs between TRNA Abundance and MRNA Secondary Structure Support Smoothing of Translation Elongation Rate. Nucleic Acids Res. 2015, 43, 3022–3032. [Google Scholar] [CrossRef] [PubMed]
  36. Likhoshvai, V.A.; Matushkin, Y.G. Differentiation of Single-Cell Organisms According to Elongation Stages Crucial for Gene Expression Efficacy. FEBS Lett. 2002, 516, 87–92. [Google Scholar] [CrossRef]
  37. Vladimirov, N.V.; Likhoshvai, V.A.; Matushkin, Y.G. Correlation of Codon Biases and Potential Secondary Structures with MRNA Translation Efficiency in Unicellular Organisms. Mol. Biol. 2007, 41, 843–850. [Google Scholar] [CrossRef]
  38. Korenskaia, A.E.; Matushkin, Y.G.; Lashin, S.A.; Klimenko, A.I. Bioinformatic Assessment of Factors Affecting the Correlation between Protein Abundance and Elongation Efficiency in Prokaryotes. Int. J. Mol. Sci. 2022, 23, 11996. [Google Scholar] [CrossRef]
  39. Сoкoлoв, B.C.; Лихoшвай, B.A.; Матушкин, Ю.Г. Экспрессия Генoв и Втoричные Структуры в Мрнк в Разных Видах Mycoplasma. Вавилoвский Журнал Генетики Селекции 2013, 17, 639–650. [Google Scholar]
  40. Ryan, M.P.; Pembroke, J.T.; Adley, C.C. Genotypic and Phenotypic Diversity of Ralstonia Pickettii and Ralstonia Insidiosa Isolates from Clinical and Environmental Sources Including High-Purity Water. Diversity in Ralstonia Pickettii. BMC Microbiol. 2011, 11, 194. [Google Scholar] [CrossRef]
  41. Ryan, M.P.; Pembroke, J.T.; Adley, C.C. Ralstonia Pickettii in Environmental Biotechnology: Potential and Applications. J. Appl. Microbiol. 2007, 103, 754–764. [Google Scholar] [CrossRef] [PubMed]
  42. Anderson, R.L.; Holland, B.W.; Carr, J.K.; Bond, W.W.; Favero, M.S. Effect of Disinfectants on Pseudomonads Colonized on the Interior Surface of PVC Pipes. Am. J. Public Health 1990, 80, 17–21. [Google Scholar] [CrossRef] [PubMed]
  43. Lim, C.T.S.; Lee, S.E. A Rare Case of Ralstonia Mannitolilytica Infection in an End Stage Renal Patient on Maintenance Dialysis during Municipal Water Contamination. Pak. J. Med. Sci. 2017, 33, 1047–1049. [Google Scholar] [CrossRef] [PubMed]
  44. Dowsett, E. Hospital Infections Caused by Contaminated Fluids. Lancet 1972, 1, 1338. [Google Scholar] [CrossRef]
  45. Ryan, M.P.; Pembroke, J.T.; Adley, C.C. Ralstonia Pickettii: A Persistent Gram-Negative Nosocomial Infectious Organism. J. Hosp. Infect. 2006, 62, 278–284. [Google Scholar] [CrossRef] [PubMed]
  46. Asaad, A.M.; Al-Ayed, M.S.Z.; Qureshi, M.A. Emergence of Unusual Nonfermenting Gram-Negative Nosocomial Pathogens in a Saudi Hospital. Jpn. J. Infect. Dis. 2013, 66, 507–511. [Google Scholar] [CrossRef] [PubMed]
  47. Anderson, R.L.; Bland, L.A.; Favero, M.S.; McNeil, M.M.; Davis, B.J.; Mackel, D.C.; Gravelle, C.R. Factors Associated with Pseudomonas Pickettii Intrinsic Contamination of Commercial Respiratory Therapy Solutions Marketed as Sterile. Appl. Environ. Microbiol. 1985, 50, 1343–1348. [Google Scholar] [CrossRef]
  48. De Baere, T.; Steyaert, S.; Wauters, G.; Des Vos, P.; Goris, J.; Coenye, T.; Suyama, T.; Verschraegen, G.; Vaneechoutte, M. Classification of Ralstonia Pickettii Biovar 3/’thomasii’ Strains (Pickett 1994) and of New Isolates Related to Nosocomial Recurrent Meningitis as Ralstonia Mannitolytica Sp. Nov. Int. J. Syst. Evol. Microbiol. 2001, 51, 547–558. [Google Scholar] [CrossRef]
  49. Orme, J.; Rivera-Bonilla, T.; Loli, A.; Blattman, N.N. Native Valve Endocarditis Due to Ralstonia Pickettii: A Case Report and Literature Review. Case Rep. Infect. Dis. 2015, 2015, 324675. [Google Scholar] [CrossRef]
  50. Shankar, M.; Rampure, S.; Siddini, V.; Ballal, H.S. Outbreak of Ralstonia Mannitolilytica in Hemodialysis Unit: A Case Series. Indian J. Nephrol. 2018, 28, 323–326. [Google Scholar] [CrossRef]
  51. O’Connor, T.J.; Adepoju, Y.; Boyd, D.; Isberg, R.R. Minimization of the Legionella Pneumophila Genome Reveals Chromosomal Regions Involved in Host Range Expansion. Proc. Natl. Acad. Sci. USA 2011, 108, 17856, Erratum in Proc. Natl. Acad. Sci. USA 2011, 108, 14733–14740. [Google Scholar] [CrossRef] [PubMed]
  52. Said, M.; van Hougenhouck-Tulleken, W.; Naidoo, R.; Mbelle, N.; Ismail, F. Outbreak of Ralstonia Mannitolilytica Bacteraemia in Patients Undergoing Haemodialysis at a Tertiary Hospital in Pretoria, South Africa. Antimicrob. Resist. Infect. Control. 2020, 9, 117. [Google Scholar] [CrossRef] [PubMed]
  53. Thomas, K.N.; Sahu, C.; Aggarwal, A. Ralstonia Mannitolilytica Bacteraemia and Gastroenteritis in a Patient with Rheumatoid Arthritis: An Emerging Nosocomial Infection. Rheumatology 2020, 60, e195–e196. [Google Scholar] [CrossRef]
  54. Suzuki, M.; Nishio, H.; Asagoe, K.; Kida, K.; Suzuki, S.; Matsui, M.; Shibayama, K. Genome Sequence of a Carbapenem-Resistant Strain of Ralstonia Mannitolilytica. Genome Announc. 2015, 3, 00405-15. [Google Scholar] [CrossRef]
  55. Safni, I.; Cleenwerck, I.; De Vos, P.; Fegan, M.; Sly, L.; Kappler, U. Polyphasic Taxonomic Revision of the Ralstonia Solanacearum Species Complex: Proposal to Emend the Descriptions of Ralstonia Solanacearum and Ralstonia Syzygii and Reclassify Current R. Syzygii Strains as Ralstonia Syzygii Subsp. Syzygii Subsp. Nov., R.S. Int. J. Syst. Evol. Microbiol. 2014, 64, 3087–3103. [Google Scholar] [CrossRef]
  56. Genin, S.; Denny, T.P. Pathogenomics of the Ralstonia Solanacearum Species Complex. Annu. Rev. Phytopathol. 2012, 50, 67–89. [Google Scholar] [CrossRef]
  57. Remenant, B.; de Cambiaire, J.C.; Cellier, G.; Jacobs, J.M.; Mangenot, S.; Barbe, V.; Lajus, A.; Vallenet, D.; Medigue, C.; Fegan, M.; et al. Ralstonia Syzygii, the Blood Disease Bacterium and Some Asian R. Solanacearum Strains Form a Single Genomic Species despite Divergent Lifestyles. PLoS ONE 2011, 6, e24356. [Google Scholar] [CrossRef]
  58. Poehlein, A.; Kusian, B.; Friedrich, B.; Daniel, R.; Bowien, B. Complete Genome Sequence of the Type Strain Cupriavidus Necator N-1. J. Bacteriol. 2011, 193, 5017. [Google Scholar] [CrossRef]
  59. Pohlmann, A.; Fricke, W.F.; Reinecke, F.; Kusian, B.; Liesegang, H.; Cramm, R.; Eitinger, T.; Ewering, C.; Pötter, M.; Schwartz, E.; et al. Genome Sequence of the Bioplastic-Producing “Knallgas” Bacterium Ralstonia Eutropha H16. Nat. Biotechnol. 2006, 24, 1257–1262. [Google Scholar] [CrossRef] [PubMed]
  60. Coenye, T.; Vandamme, P. Ralstonia Solanacearum GMI1000 Genome. BMC Genom. 2003, 9, 10. [Google Scholar]
  61. Likhoshvai, A.; Matushkin, Y.G. Nucleotide Composition-Based Prediction of Gene Expression Efficacy. Mol. Biol. 2000, 34, 397–405. [Google Scholar] [CrossRef]
  62. Sokolov, V.; Zuraev, B.; Lashin, S.; Matushkin, Y. Web Application for Automatic Prediction of Gene Translation Elongation Efficiency. J. Integr. Bioinform. 2015, 12, 256. [Google Scholar] [CrossRef]
  63. Virtanen, P.; Gommers, R.; Oliphant, T.E.; Haberland, M.; Reddy, T.; Cournapeau, D.; Burovski, E.; Peterson, P.; Weckesser, W.; Bright, J.; et al. SciPy 1.0: Fundamental Algorithms for Scientific Computing in Python. Nat. Methods 2020, 17, 261–272. [Google Scholar] [CrossRef] [PubMed]
  64. Tatusov, R.L.; Koonin, E.V.; Lipman, D.J. A Genomic Perspective on Protein Families. Science 1997, 278, 631–637. [Google Scholar] [CrossRef]
  65. Galperin, M.Y.; Kristensen, D.M.; Makarova, K.S.; Wolf, Y.I.; Koonin, E.V. Microbial Genome Analysis: The COG Approach. Brief. Bioinform. 2019, 20, 1063–1070. [Google Scholar] [CrossRef]
  66. Galperin, M.Y.; Wolf, Y.I.; Makarova, K.S.; Vera Alvarez, R.; Landsman, D.; Koonin, E.V. COG Database Update: Focus on Microbial Diversity, Model Organisms, and Widespread Pathogens. Nucleic Acids Res. 2021, 49, D274–D281. [Google Scholar] [CrossRef]
  67. Seemann, T. Prokka: Rapid Prokaryotic Genome Annotation. Bioinformatics 2014, 30, 2068–2069. [Google Scholar] [CrossRef]
  68. Emms, D.M.; Kelly, S. OrthoFinder: Phylogenetic Orthology Inference for Comparative Genomics. Genome Biol. 2019, 20, 238. [Google Scholar] [CrossRef]
  69. Yang, Z.; Bielawski, J.R. Statistical Methods for Detecting Molecular Adaptation. Trends Ecol. Evol. 2000, 15, 496–503. [Google Scholar] [CrossRef]
  70. Mustafin, Z.; Mukhin, A.; Afonnikov, D.; Matushkin, Y.; Lashin, S. OrthoWeb-Web Application for Macroand Microevolutionary Analysis of Genes. In Bioinformatics of Genome Regulation and Structure/Systems Biology (BGRS/SB-2020); Institute of Cytology and Genetics: Novosibirsk, Russia, 2020; pp. 228–229. [Google Scholar]
  71. Kryazhimskiy, S.; Plotkin, J.B. The Population Genetics of DN/DS. PLOS Genet. 2008, 4, e1000304. [Google Scholar] [CrossRef]
  72. Hurst, L.D. The Ka/Ks Ratio: Diagnosing the Form of Sequence Evolution. Trends Genet. 2002, 18, 486–487. [Google Scholar] [CrossRef] [PubMed]
  73. Mustafin, Z.S.; Lashin, S.A.; Matushkin, Y.G.; Gunbin, K.V.; Afonnikov, D.A. Orthoscape: A Cytoscape Application for Grouping and Visualization KEGG Based Gene Networks by Taxonomy and Homology Principles. BMC Bioinform. 2017, 18, 1–9. [Google Scholar] [CrossRef] [PubMed]
  74. Man, O.; Pilpel, Y. Differential Translation Efficiency of Orthologous Genes Is Involved in Phenotypic Divergence of Yeast Species. Nat. Genet. 2007, 39, 415–421. [Google Scholar] [CrossRef] [PubMed]
  75. Zeiss, D.R.; Steenkamp, P.A.; Piater, L.A.; Dubery, I.A. Metabolomic Evaluation of Ralstonia Solanacearum Cold Shock Protein Peptide (Csp22)-Induced Responses in Solanum Lycopersicum. Front. Plant Sci. 2022, 12, 803104. [Google Scholar] [CrossRef] [PubMed]
  76. Theodorou, M.C.; Theodorou, E.C.; Kyriakidis, D.A. Involvement of AtoSC Two-Component System in Escherichia Coli Flagellar Regulon. Amino Acids 2012, 43, 833–844. [Google Scholar] [CrossRef] [PubMed]
  77. Coutinho, T.A.; Wu, H.; Chen, Z.; Li, S.; Li, H.; Zhang, C.; Zhou, Y.; Lu, C.; Lu, C. Proposal to Classify Ralstonia Solanacearum Phylotype I Strains as Ralstonia Nicotianae Sp. Nov., and a Genomic Comparison between Members of the Genus Ralstonia. Front. Microbiol. 2023, 13, 1135872. [Google Scholar] [CrossRef]
  78. Vieira-Silva, S.; Rocha, E.P.C. The Systemic Imprint of Growth and Its Uses in Ecological (Meta)Genomics. PLoS Genet. 2010, 6, e1000808. [Google Scholar] [CrossRef]
  79. Weissman, J.L.; Hou, S.; Fuhrman, J.A. Estimating Maximal Microbial Growth Rates from Cultures, Metagenomes, and Single Cells via Codon Usage Patterns. Proc. Natl. Acad. Sci. USA 2021, 118, e2016810118. [Google Scholar] [CrossRef]
  80. Baroukh, C.; Zemouri, M.; Genin, S. Trophic Preferences of the Pathogen Ralstonia Solanacearum and Consequences on Its Growth in Xylem Sap. Microbiologyopen 2022, 11, e1240. [Google Scholar] [CrossRef]
  81. Boy, C.; Lesage, J.; Alfenore, S.; Guillouet, S.E.; Gorret, N. Investigation of the Robustness of Cupriavidus Necator Engineered Strains during Fed-Batch Cultures. AMB Express 2021, 11, 151. [Google Scholar] [CrossRef]
  82. Guo, A.; Xu, Y.; Mowery, J.; Nagy, A.; Bauchan, G.; Nou, X. Ralstonia Insidiosa Induces Cell Aggregation of Listeria Monocytogenes. Food Control 2016, 67, 303–309. [Google Scholar] [CrossRef]
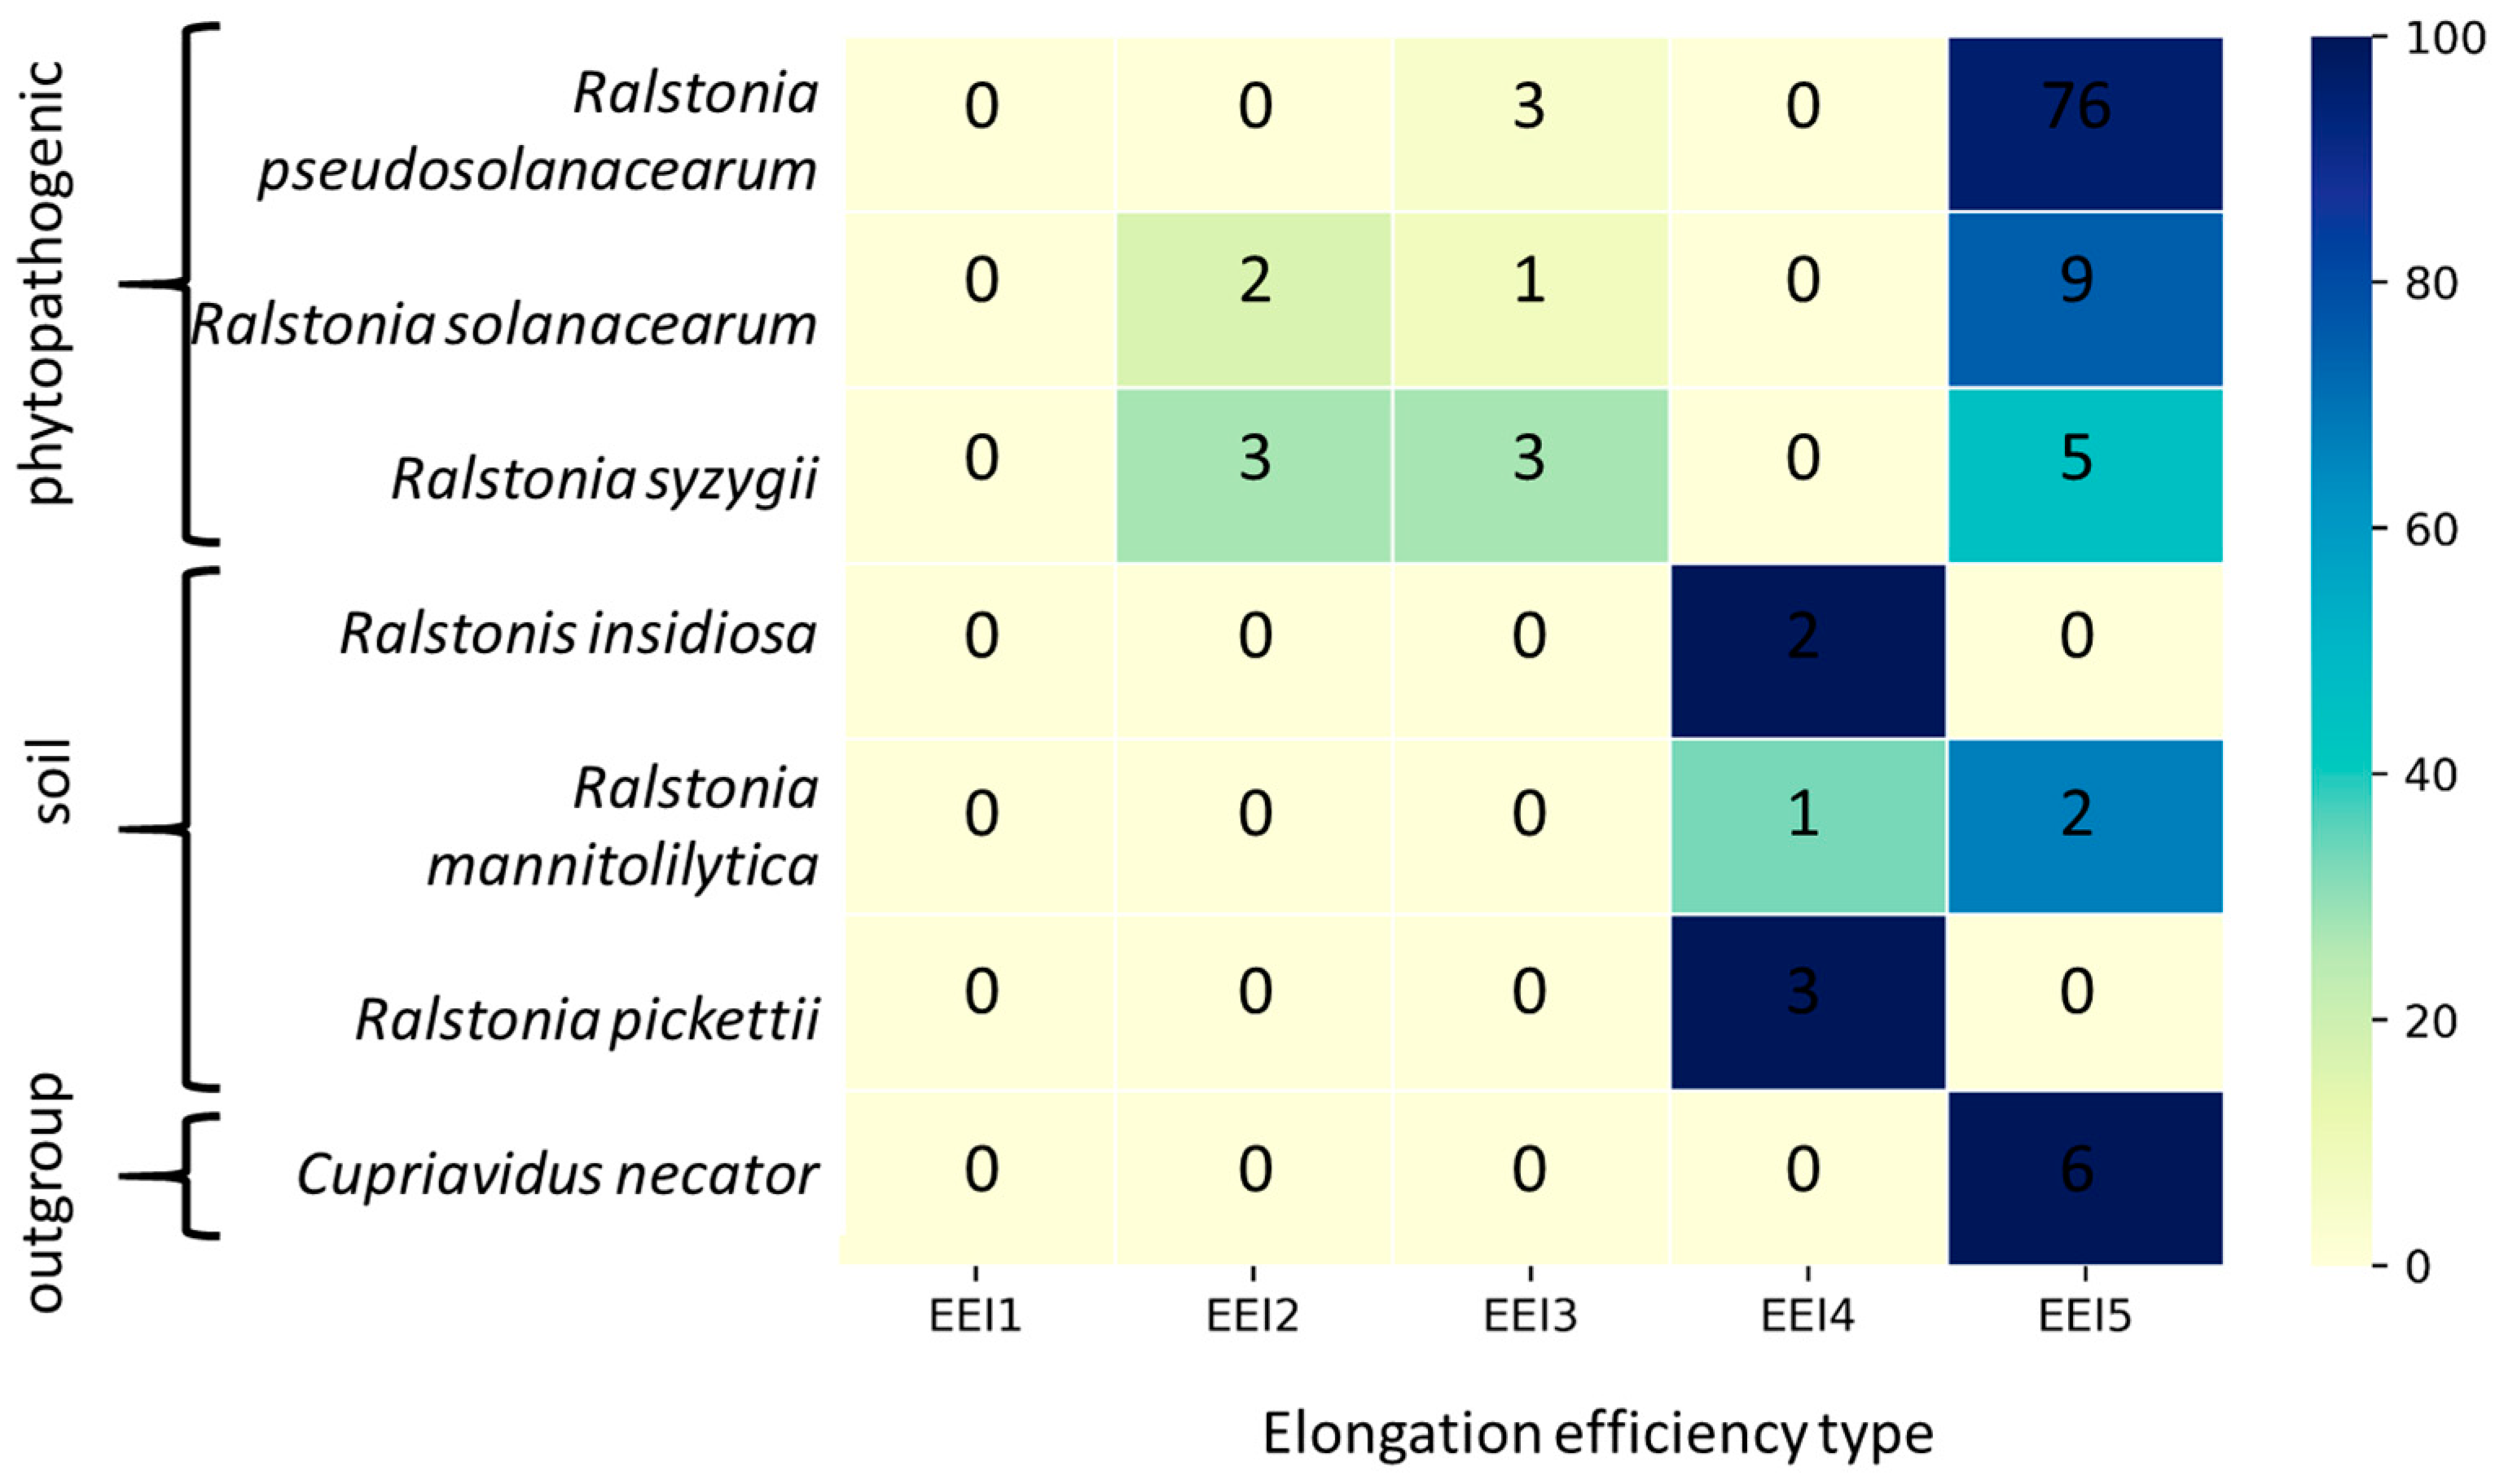
Figure 1. The distribution of the Ralstonia species among EEI optimization types. The number of genomes that belong to certain species and are characterized by a certain elongation efficiency optimization type is specified inside corresponding tiles. Color depicts the percentage of genomes belonging to a certain optimization type among all the studied genomes of a corresponding species.
Biology 12 01338 g001
Figure 2. The mean numbers of mRNA secondary structures (LCI1) per nucleotide or energy of secondary structures per nucleotide (LCI2) among potentially highly expressed genes (PHEGs) for C. necator, soil Ralstonia, and phytopathogenic Ralstonia.
Biology 12 01338 g002
Figure 3. The distributions of both the entire set of protein-coding genes (EGS) and ribosomal protein genes (RPG) for the genomes from the three bacterial phylogenetic groups: soil Ralstonia, phytopathogenic Ralstonia, and Cupriavidus necator and for Escherichia coli genome by translation elongation efficiency characteristics: (a) mean number of secondary structures per nucleotide (LCI1); (b) mean energy of secondary structures per nucleotide (LCI2); (c) codon utilization index of efficacy (Tai).
Biology 12 01338 g003
Figure 4. The types of translation elongation efficiency distribution in the orthogroups of phylogenetic groups. The order of letters P (phytopathogenic Ralstonia), S (soil Ralstonia), or N (C. necator) refers to the value of the characteristic analyzed—the leftmost letter has the highest mean value, the rightmost letter has the lowest mean value. Substitution of letters by “**” is used in case of similar values with no significant difference. The size of letters refers to the significance of differences between phylogenetic groups: capital letter demonstrates a significant difference between this phylogenetic group and the next letter. For instance, PSN represents orthogroups with significant differences between each group, where P has the highest value; psN represents orthogroups with similar values for phytopathogenic and soil Ralstonia and significantly lower values for C. necator. Each group is additionally described in the picture.
Biology 12 01338 g004
Figure 5. The comparison between the COG (Clusters of Orthologous Groups) enrichment for the PHEGs (10%) and the entire gene sets (all) for genomes belonging to (a) phytopathogenic Ralstonia, (b) C. necator, and (c) soil Ralstonia. (d) The comparison of the PHEGs’ COG enrichment for genomes of these phylogenetic groups. The right part of the picture describes the functions of the COGs.
Biology 12 01338 g005
Table 1. Factors of translation elongation efficiency considered in each type of the translation elongation efficiency indices.
EEI TypeCodon CompositionThe Number of mRNA HairpinsEnergy of Potential Secondary Structures in mRNA
EEI1+
EEI2 +
EEI3 +
EEI4++
EEI5+ +
Disclaimer/Publisher’s Note: The statements, opinions and data contained in all publications are solely those of the individual author(s) and contributor(s) and not of MDPI and/or the editor(s). MDPI and/or the editor(s) disclaim responsibility for any injury to people or property resulting from any ideas, methods, instructions or products referred to in the content.