
Epigenetic Clock Explains White Matter Hyperintensity Burden Irrespective of Chronological Age
 , , , , , , , and
Abstract
Simple Summary
Abstract
1. Introduction
2. Methods
2.1. Participants and Setting
2.2. DNA Methylation Array
2.3. Biological Age Estimation
2.4. Neuroimaging
2.4.1. Acquisition
2.4.2. WMH Volume Quantification
2.5. Clinical Variables
2.6. Statistics
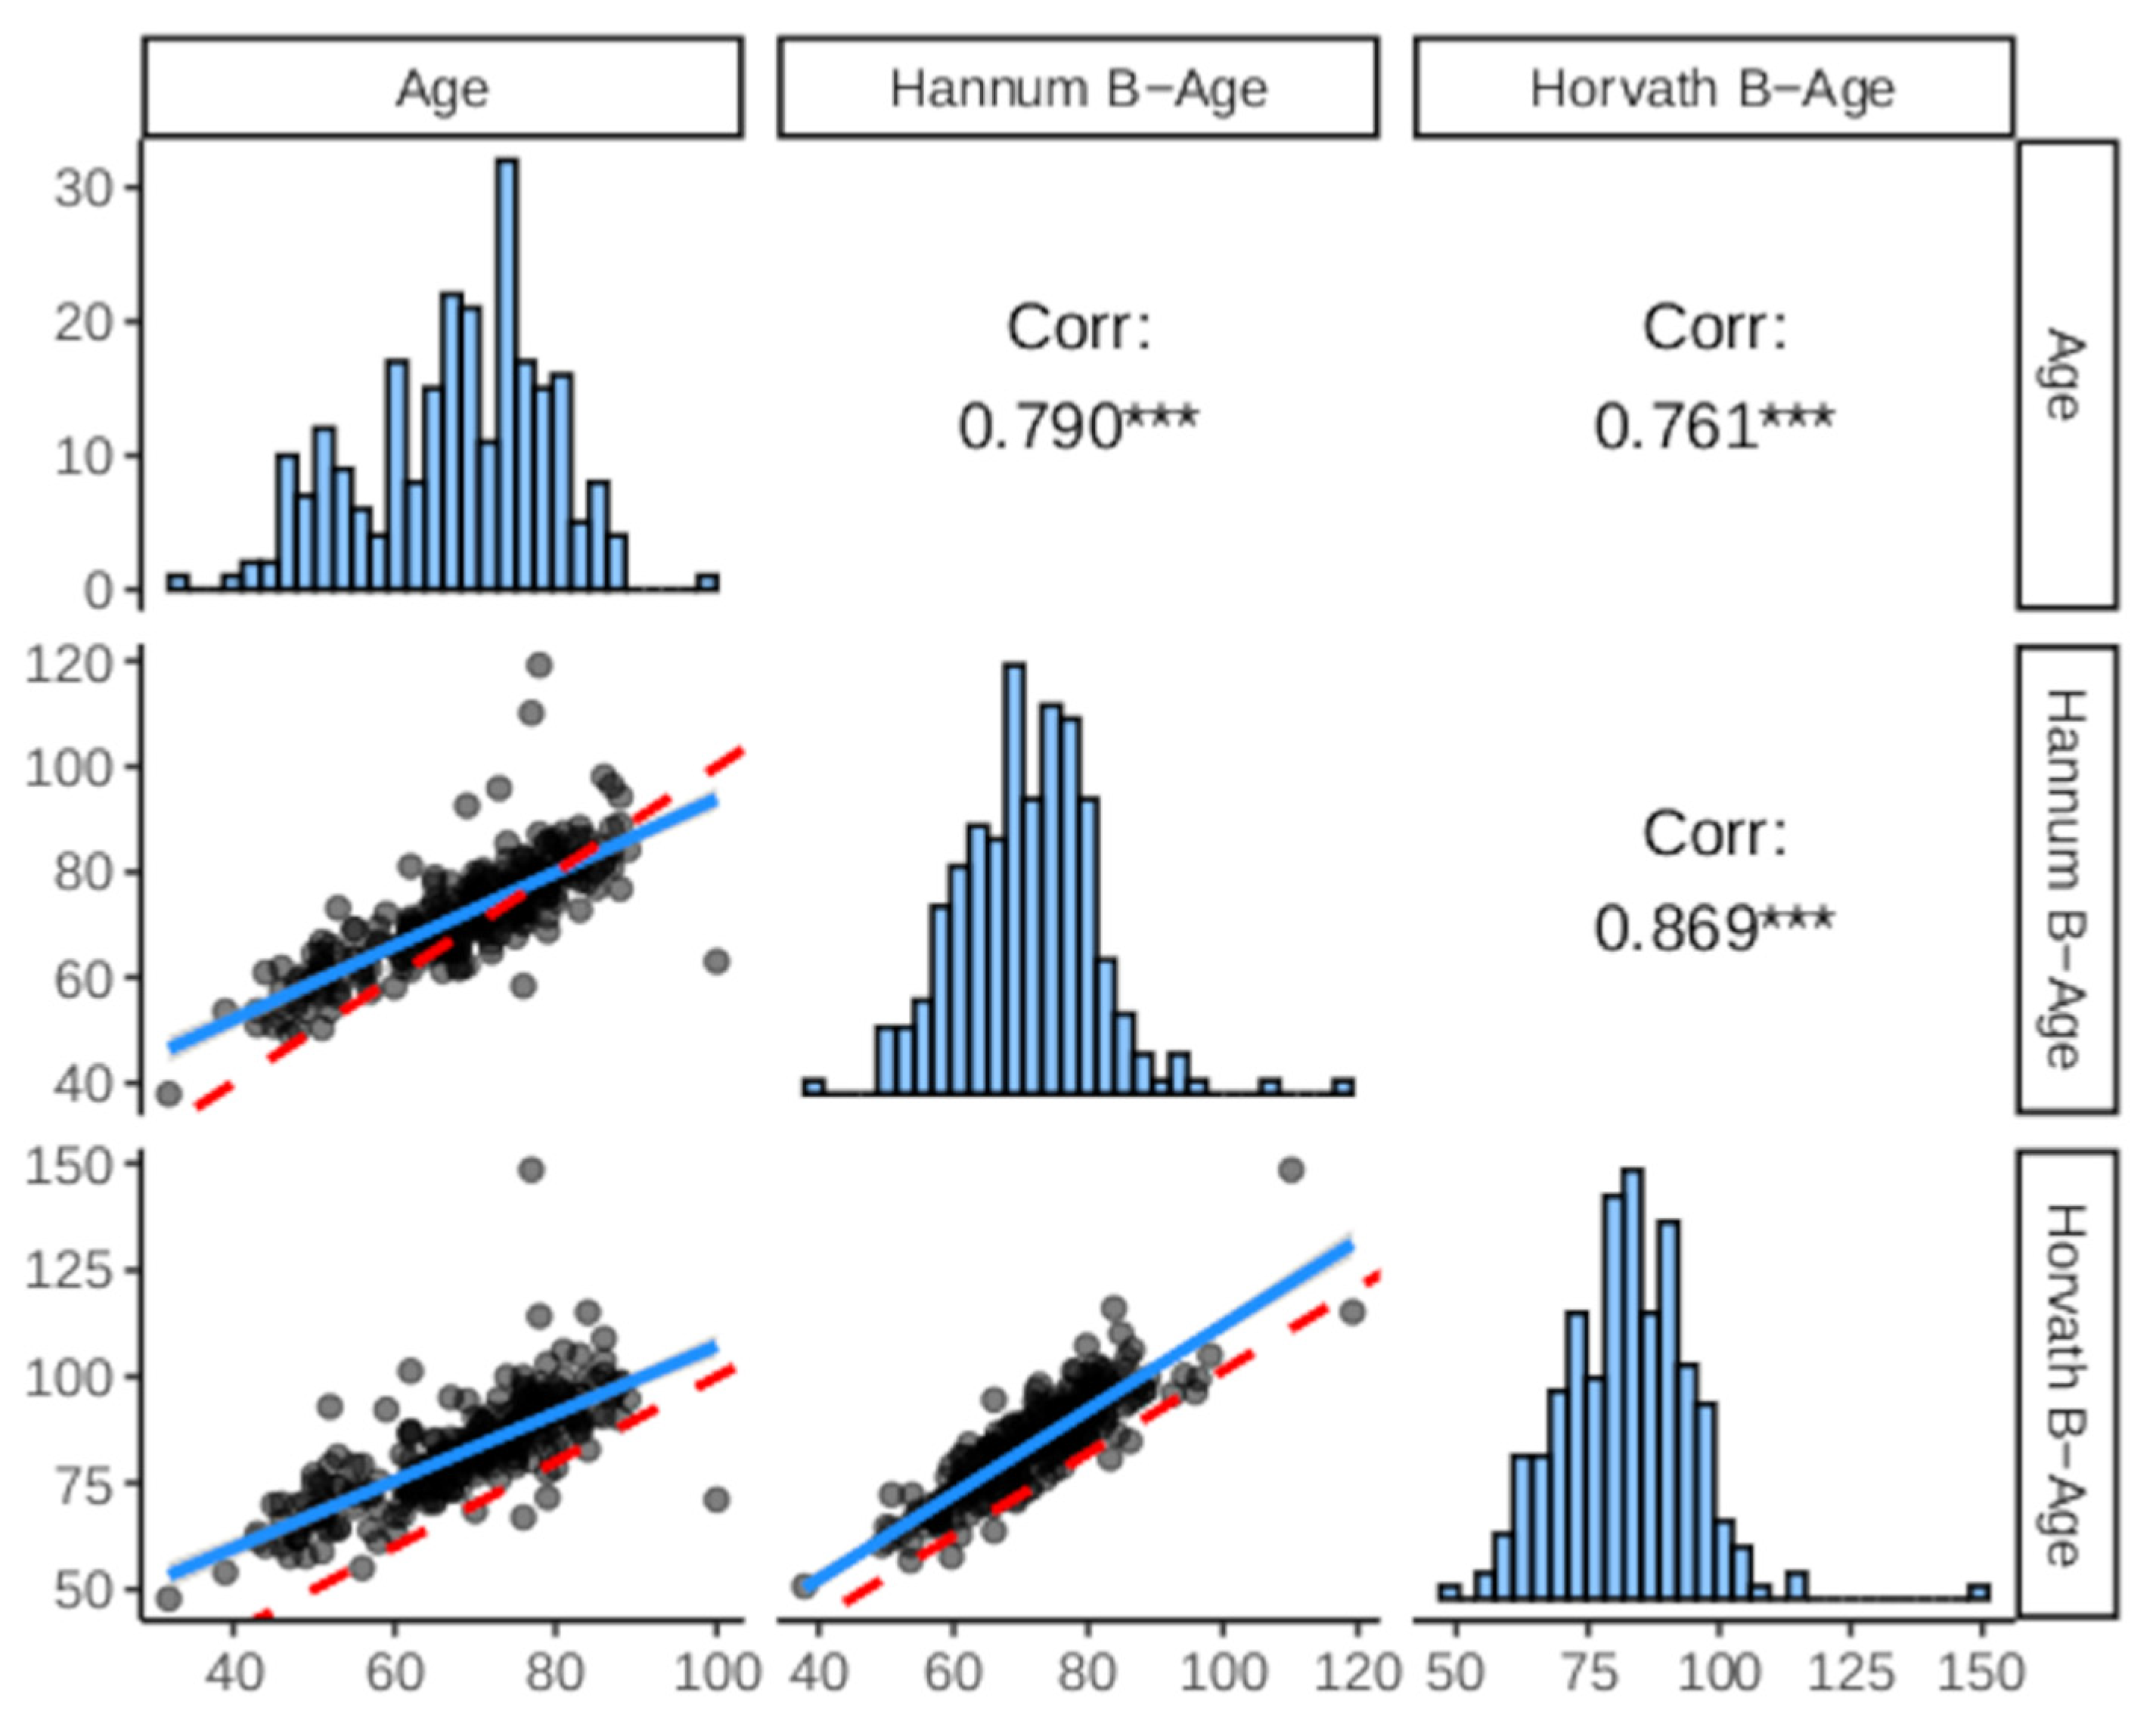
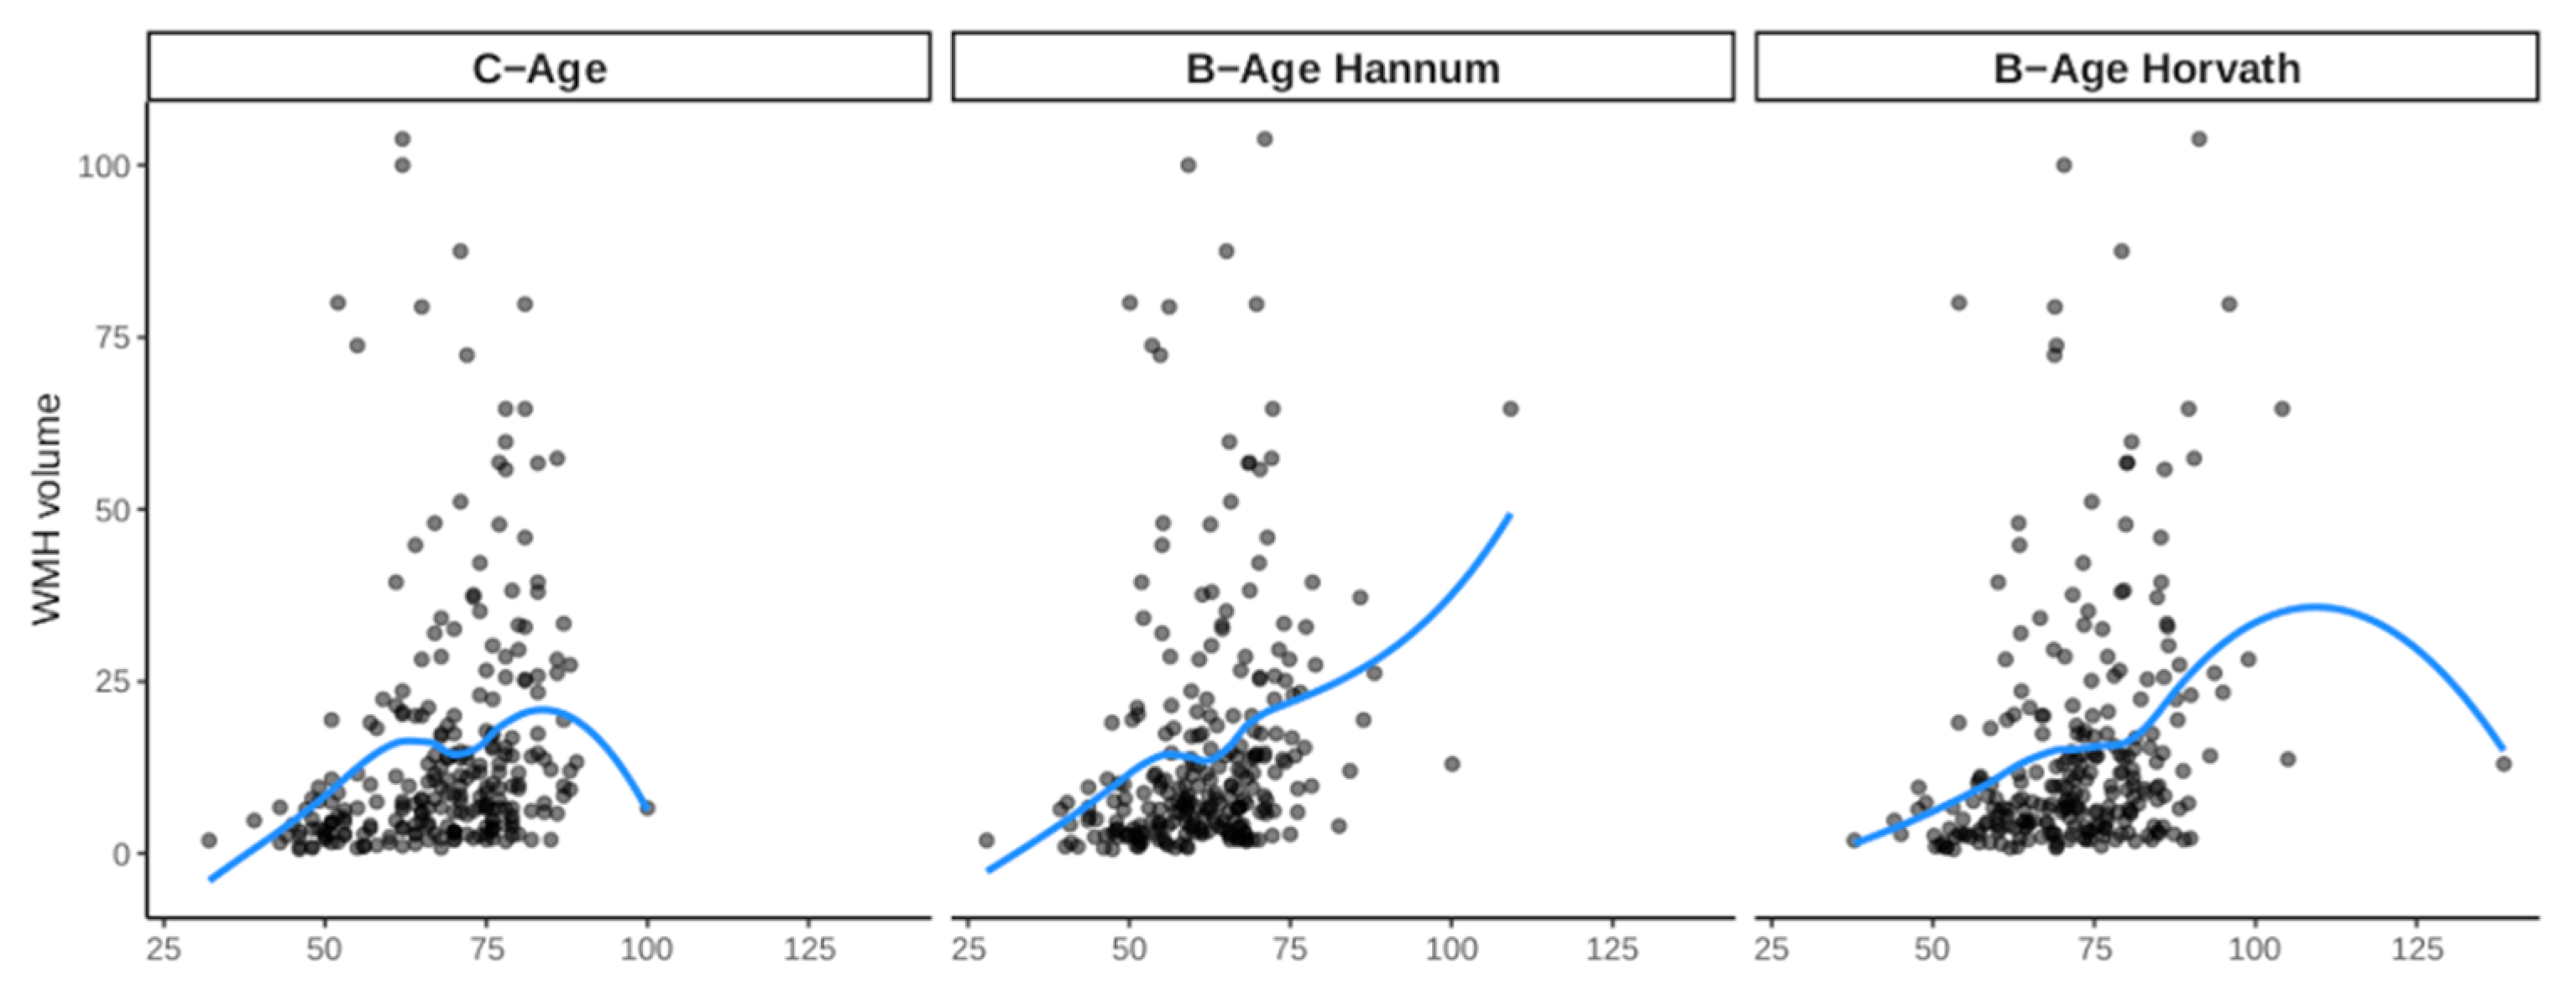
3. Results
3.1. Principal Characteristics of the Cohort
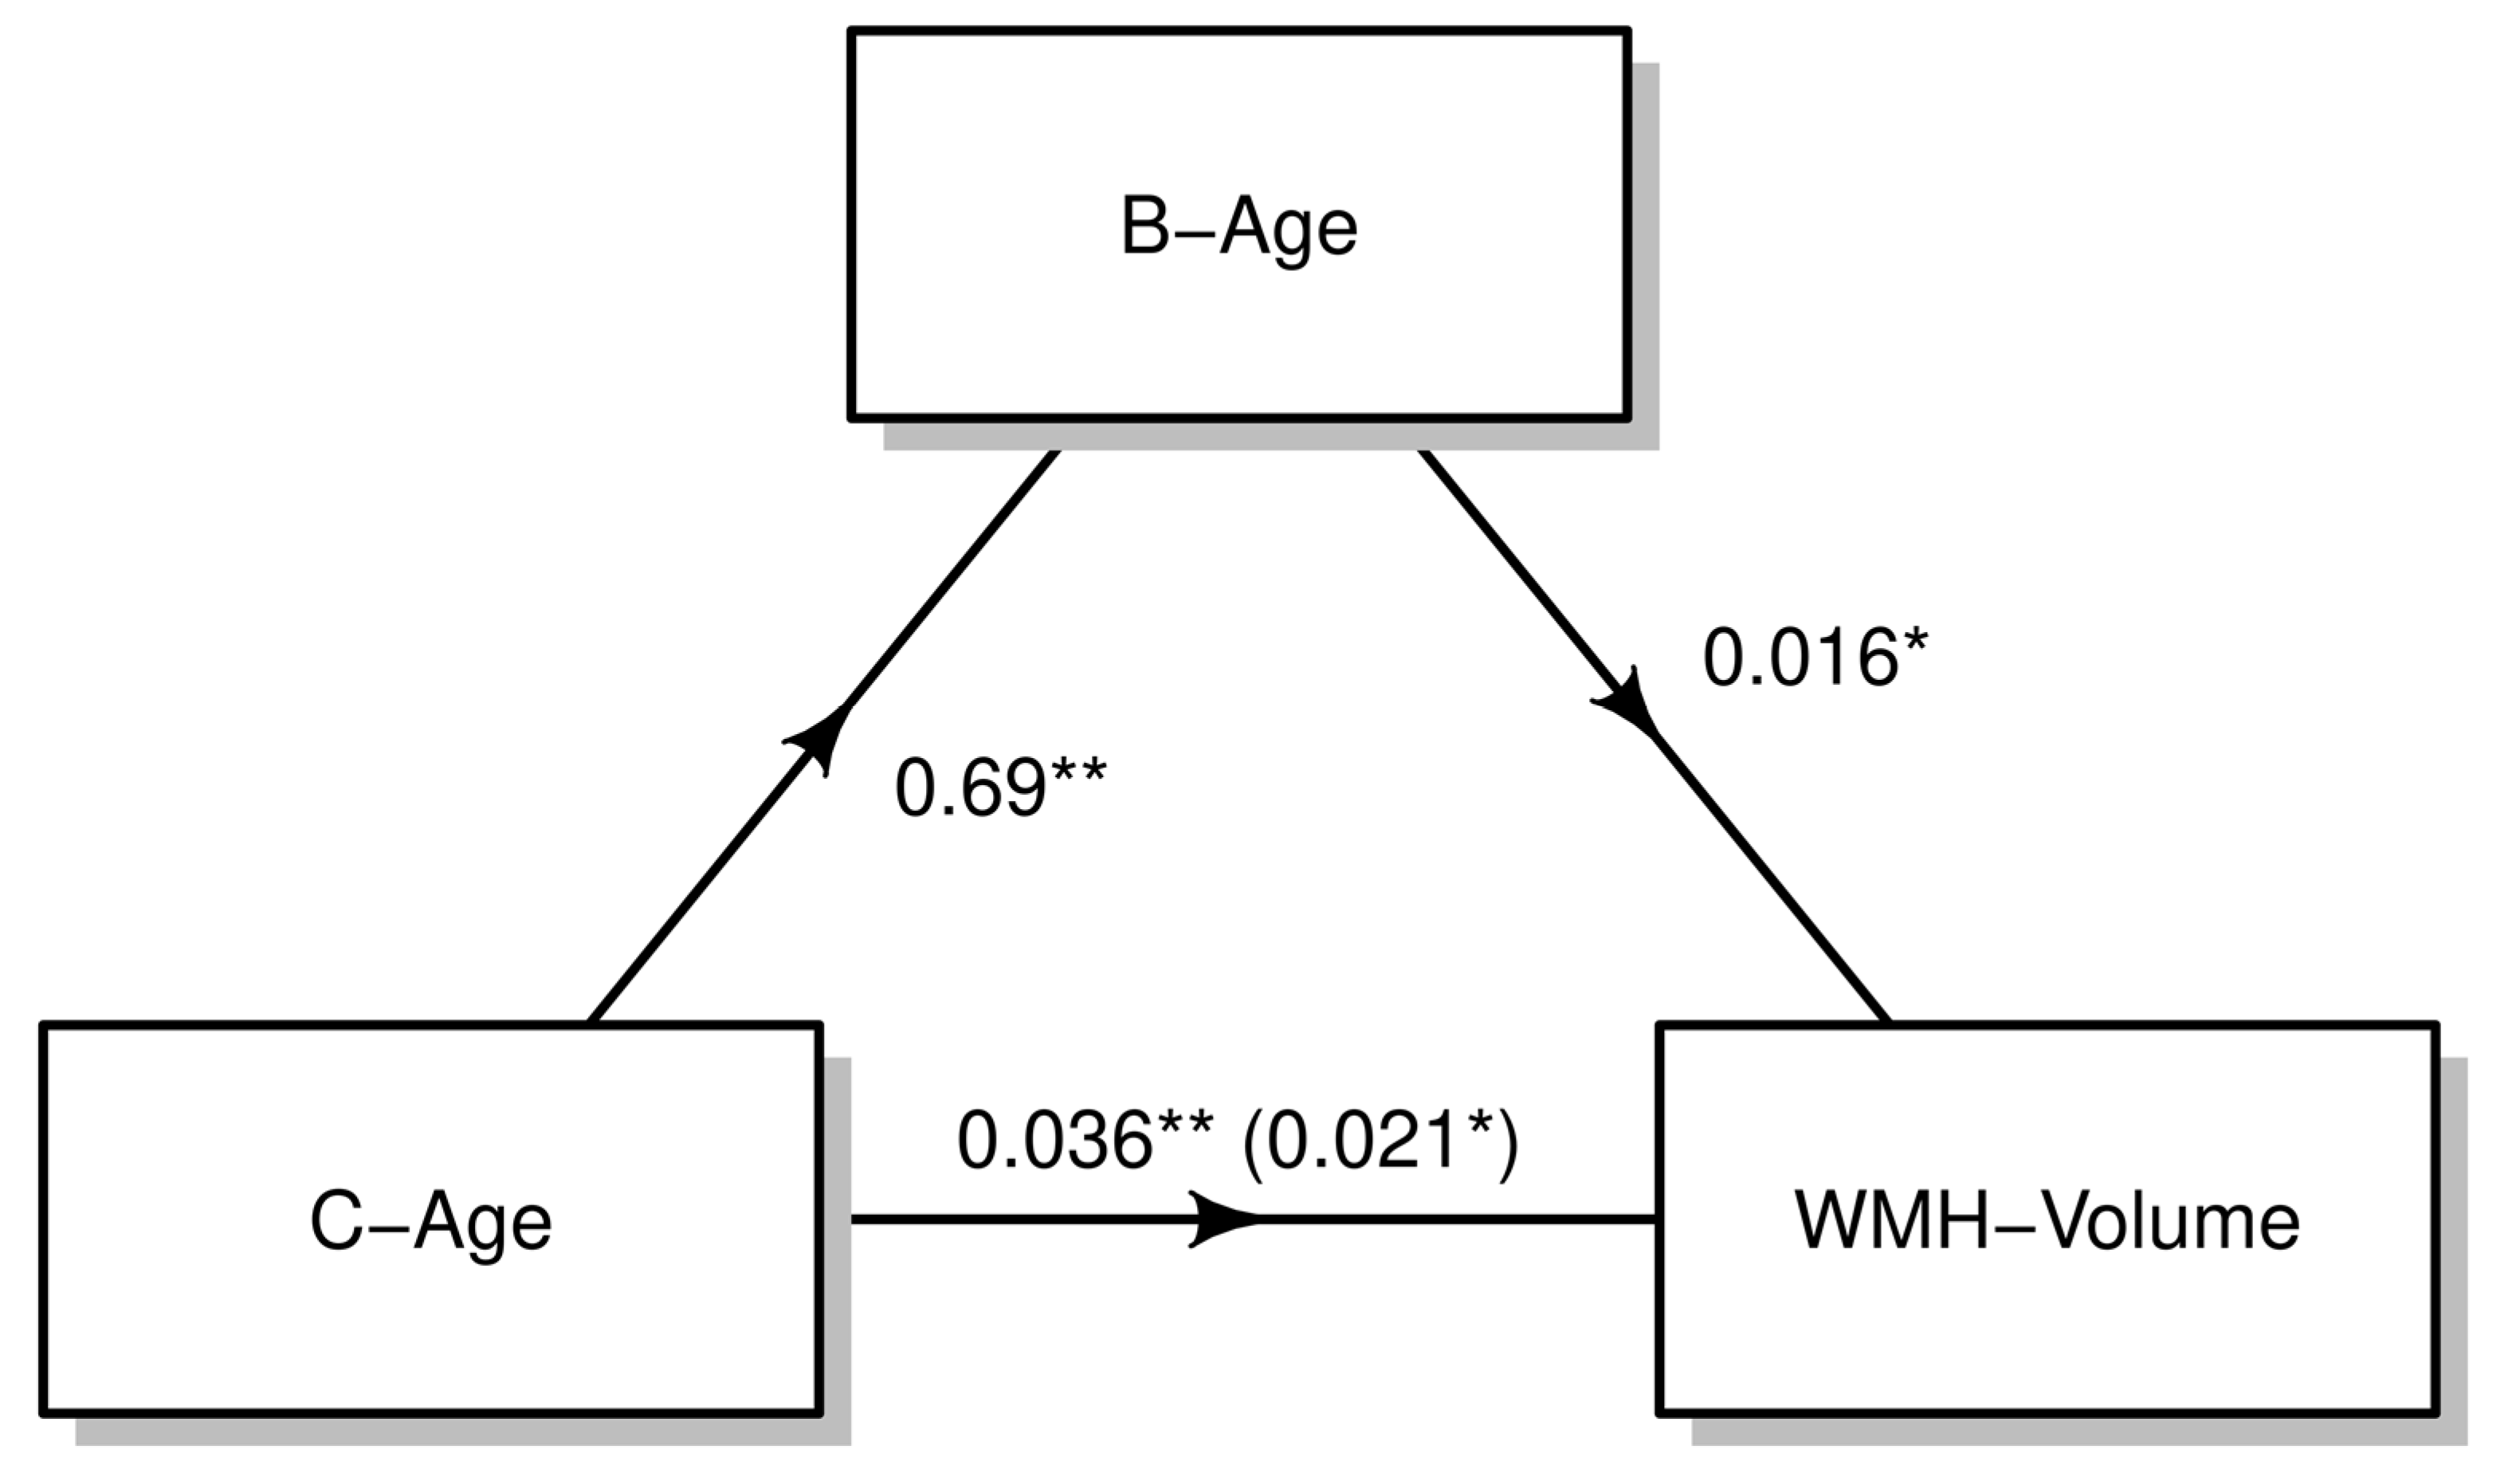
3.2. Effect of B-Age on WMH
4. Discussion
5. Conclusions
Supplementary Materials
Author Contributions
Funding
Institutional Review Board Statement
Informed Consent Statement
Data Availability Statement
Conflicts of Interest
References
- Pantoni, L. Cerebral small vessel disease: From pathogenesis and clinical characteristics to therapeutic challenges. Lancet Neurol. 2010, 9, 689–701. [Google Scholar] [CrossRef] [PubMed]
- Prins, N.D.; Scheltens, P. White matter hyperintensities, cognitive impairment and dementia: An update. Nat. Rev. Neurol. 2015, 11, 157–165. [Google Scholar] [CrossRef] [PubMed]
- Uiterwijk, R.; Staals, J.; Huijts, M.; de Leeuw, P.W.; Kroon, A.A.; van Oostenbrugge, R.J. MRI progression of cerebral small vessel disease and cognitive decline in patients with hypertension. J. Hypertens. 2017, 35, 1263–1270. [Google Scholar] [CrossRef] [PubMed]
- Jiménez-Balado, J.; Riba-Llena, I.; Abril, O.; Garde, E.; Penalba, A.; Ostos, E.; Maisterra, O.; Montaner, J.; Noviembre, M.; Mundet, X.; et al. Cognitive Impact of Cerebral Small Vessel Disease Changes in Patients with Hypertension. Hypertension 2019, 73, 342–349. [Google Scholar] [CrossRef] [PubMed]
- Jiménez-Balado, J.; Riba-Llena, I.; Maisterra, O.; Pizarro, J.; Palasí, A.; Pujadas, F.; Mundet, X.; Vinyoles, E.; Delgado, P. Ambulatory Blood Pressure Levels in the Prediction of Progression of Cerebral Small Vessel Disease. J. Am. Geriatr. Soc. 2020, 68, 2232–2239. [Google Scholar] [CrossRef]
- Vilar-Bergua, A.; Riba-Llena, I.; Nafría, C.; Bustamante, A.; Llombart, V.; Delgado, P.; Montaner, J. Blood and CSF biomarkers in brain subcortical ischemic vascular disease: Involved pathways and clinical applicability. J. Cereb. Blood Flow Metab. 2015, 36, 55–71. [Google Scholar] [CrossRef]
- Jiménez-Balado, J.; Pizarro, J.; Riba-Llena, I.; Penalba, A.; Faura, J.; Palà, E.; Montaner, J.; Hernández-Guillamon, M.; Delgado, P. New candidate blood biomarkers potentially associated with white matter hyperintensities progression. Sci. Rep. 2021, 11, 14324. [Google Scholar] [CrossRef]
- Portela, A.; Esteller, M. Epigenetic modifications and human disease. Nat. Biotechnol. 2010, 28, 1057–1068. [Google Scholar] [CrossRef]
- Hannum, G.; Guinney, J.; Zhao, L.; Zhang, L.I.; Hughes, G.; Sadda, S.; Klotzle, B.; Bibikova, M.; Fan, J.B.; Gao, Y. Genome-wide Methylation Profiles Reveal Quantitative Views of Human Aging Rates. Mol. Cell 2013, 49, 359–367. [Google Scholar] [CrossRef]
- Horvath, S. Erratum to: DNA methylation age of human tissues and cell types. Genome Biol. 2015, 16, 96. [Google Scholar] [CrossRef]
- Soriano-Tárraga, C.; Giralt-Steinhauer, E.; Mola-Caminal, M.; Vivanco-Hidalgo, R.M.; Ois, A.; Rodríguez-Campello, A.; Cuadrado-Godia, E.; Sayols-Baixeras, S.; Elosua, R.; Roquer, J.; et al. Ischemic stroke patients are biologically older than their chronological age. Aging (Albany NY) 2016, 8, 2655–2666. [Google Scholar] [CrossRef]
- Soriano-Tárraga, C.; Giralt-Steinhauer, E.; Mola-Caminal, M.; Ois, A.; Rodríguez-Campello, A.; Cuadrado-Godia, E.; Fernández-Cadenas, I.; Cullell, N.; Roquer, J.; Jiménez-Conde, J. Biological Age is a predictor of mortality in Ischemic Stroke. Sci. Rep. 2018, 8, 1–8. [Google Scholar] [CrossRef] [PubMed]
- Soriano-Tárraga, C.; Mola-Caminal, M.; Giralt-Steinhauer, E.; Ois, A.; Rodríguez-Campello, A.; Cuadrado-Godia, E.; Gómez-González, A.; Vivanco-Hidalgo, R.M.; Fernández-Cadenas, I.; Cullell, N.; et al. Biological age is better than chronological as predictor of 3-month outcome in ischemic stroke. Neurology 2017, 89, 830–836. [Google Scholar] [CrossRef] [PubMed]
- Soriano-Tárraga, C.; Lazcano, U.; Jiménez-Conde, J.; Ois, A.; Cuadrado-Godia, E.; Giralt-Steinhauer, E.; Rodríguez-Campello, A.; Gomez-Gonzalez, A.; Avellaneda-Gómez, C.; Vivanco-Hidalgo, R.M.; et al. Biological age is a novel biomarker to predict stroke recurrence. J. Neurol. 2021, 268, 285–292. [Google Scholar] [CrossRef] [PubMed]
- Roquer, J.; Rodríguez-Campello, A.; Gomis, M.; Jiménez-Conde, J.; Cuadrado-Godia, E.; Vivanco, R.; Giralt, E.; Sepúlveda, M.; Pont-Sunyer, C.; Cucurella, G.; et al. Acute stroke unit care and early neurological deterioration in ischemic stroke. J. Neurol. 2008, 255, 1012–1017. [Google Scholar] [CrossRef] [PubMed]
- Soriano-Tárraga, C.; Jiménez-Conde, J.; Giralt-Steinhauer, E.; Mola-Caminal, M.; Vivanco-Hidalgo, R.M.; Ois, A.; Rodríguez-Campello, A.; Cuadrado-Godia, E.; Sayols-Baixeras, S.; Elosua, R.; et al. Epigenome-wide association study identifies TXNIP gene associated with type 2 diabetes mellitus and sustained hyperglycemia. Hum. Mol. Genet. 2016, 25, 609–619. [Google Scholar] [CrossRef]
- Dedeurwaerder, S.; Defrance, M.; Bizet, M.; Calonne, E.; Bontempi, G.; Fuks, F. A comprehensive overview of Infinium HumanMethylation450 data processing. Brief. Bioinform. 2013, 15, 929–941. [Google Scholar] [CrossRef]
- Du, P.; Zhang, X.; Huang, C.-C.; Jafari, N.; Kibbe, W.A.; Hou, L.; Lin, S.M. Comparison of Beta-value and M-value methods for quantifying methylation levels by microarray analysis. BMC Bioinform. 2010, 11, 587. [Google Scholar] [CrossRef]
- Teschendorff, A.E.; Marabita, F.; Lechner, M.; Bartlett, T.; Tegner, J.; Gomez-Cabrero, D.; Beck, S. A beta-mixture quantile normalization method for correcting probe design bias in Illumina Infinium 450 k DNA methylation data. Bioinformatics 2013, 29, 189–196. [Google Scholar] [CrossRef]
- Leek, J.T.; Johnson, W.E.; Parker, H.S.; Jaffe, A.E.; Storey, J.D. The sva package for removing batch effects and other unwanted variation in high-throughput experiments. Bioinformatics 2012, 28, 882–883. [Google Scholar] [CrossRef]
- Houseman, E.A.; Accomando, W.P.; Koestler, D.C.; Christensen, B.C.; Marsit, C.J.; Nelson, H.H.; Wiencke, J.K.; Kelsey, K.T. DNA methylation arrays as surrogate measures of cell mixture distribution. BMC Bioinform. 2012, 13, 86. [Google Scholar] [CrossRef] [PubMed]
- McEwen, L.M.; Jones, M.J.; Lin, D.T.S.; Edgar, R.D.; Husquin, L.T.; MacIsaac, J.L.; Ramadori, K.E.; Morin, A.M.; Rider, C.F.; Carlsten, C.; et al. Systematic evaluation of DNA methylation age estimation with common preprocessing methods and the Infinium MethylationEPIC BeadChip array. Clin. Epigenetics 2018, 10, 1–9. [Google Scholar] [CrossRef] [PubMed]
- Rost, N.S.; Fitzpatrick, K.; Biffi, A.; Kanakis, A.; Devan, W.; Anderson, C.D.; Cortellini, L.; Furie, K.L.; Rosand, J. White Matter Hyperintensity Burden and Susceptibility to Cerebral Ischemia. Stroke 2010, 41, 2807–2811. [Google Scholar] [CrossRef] [PubMed]
- Jiménez-Conde, J.; Ois, A.; Rodríguez-Campello, A.; Gomis, M.; Roquer, J. Does sleep protect against ischemic stroke? less frequent ischemic strokes but more severe ones. J. Neurol. 2007, 254, 782–788. [Google Scholar] [CrossRef]
- Friedman, J.I.; Tang, C.Y.; de Haas, H.J.; Changchien, L.; Goliasch, G.; Dabas, P.; Wang, V.; Fayad, Z.A.; Fuster, V.; Narula, J. Brain imaging changes associated with risk factors for cardiovascular and cerebrovascular disease in asymptomatic patients. JACC Cardiovasc. Imaging 2014, 7, 1039–1053. [Google Scholar] [CrossRef]
- Horn, J.L. A rationale and test for the number of factors in factor analysis. Psychometrika 1965, 30, 179–185. [Google Scholar] [CrossRef]
- Hayes, A.F. Introduction to Mediation, Moderation, and Conditional Process Analysis, Second Edition: A Regression-Based Approach (Methodology in the Social Sciences), 2nd ed.; The Guilford Press: New York, NY, USA, 2017. [Google Scholar]
- Raina, A.; Zhao, X.; Grove, M.L.; Bressler, J.; Gottesman, R.F.; Guan, W.; Pankow, J.S.; Boerwinkle, E.; Mosley, T.H.; Fornage, M. Cerebral white matter hyperintensities on MRI and acceleration of epigenetic aging: The atherosclerosis risk in communities study. Clin. Epigenetics 2017, 9, 21. [Google Scholar] [CrossRef] [PubMed]
- Xiao, L.; Zan, G.; Liu, C.; Xu, X.; Li, L.; Chen, X.; Zhang, Z.; Yang, X. Associations Between Blood Pressure and Accelerated DNA Methylation Aging. J. Am. Hear. Assoc. 2022, 11, e022257. [Google Scholar] [CrossRef] [PubMed]
- Riba-Llena, I.; Jiménez-Balado, J.; Castañé, X.; Girona, A.; López-Rueda, A.; Mundet, X.; Jarca, C.I.; Álvarez-Sabin, J.; Montaner, J.; Delgado, P. Arterial Stiffness Is Associated With Basal Ganglia Enlarged Perivascular Spaces and Cerebral Small Vessel Disease Load. Stroke 2018, 49, 1279–1281. [Google Scholar] [CrossRef]
- Beydoun, M.A.; Shaked, D.; Tajuddin, S.M.; Weiss, J.; Evans, M.K.; Zonderman, A.B. Accelerated epigenetic age and cognitive decline among urban-dwelling adults. Neurology 2019, 94, e613–e625. [Google Scholar] [CrossRef]
- Debette, S.; Schilling, S.; Duperron, M.-G.; Larsson, S.C.; Markus, H. Clinical Significance of Magnetic Resonance Imaging Markers of Vascular Brain Injury: A Systematic Review and Meta-analysis. JAMA Neurol. 2019, 76, 81–94. [Google Scholar] [CrossRef] [PubMed]
- Lind, L.; Ingelsson, E.; Sundström, J.; Siegbahn, A.; Lampa, E. Methylation-based estimated biological age and cardiovascular disease. Eur. J. Clin. Investig. 2018, 48, e12872. [Google Scholar] [CrossRef]
- Ammous, F.; Zhao, W.; Ratliff, S.M.; Kho, M.; Shang, L.; Jones, A.C.; Chaudhary, N.S.; Tiwarid, H.K.; Irvin, M.R.; Arnett, D.K.; et al. Epigenome-wide association study identifies DNA methylation sites associated with target organ damage in older African Americans. Epigenetics 2021, 16, 862–875. [Google Scholar] [CrossRef] [PubMed]
- Black, S.; Gao, F.; Bilbao, J. Understanding White Matter Disease: Imaging-Pathological Correlations in Vascular Cognitive Impairment. Stroke 2008, 40, S48–S52. [Google Scholar] [CrossRef] [PubMed]
- Marnane, M.; Al-Jawadi, O.O.; Mortazavi, S.; Pogorzelec, K.J.; Wang, B.W.; Feldman, H.H.; Hsiung, G.-Y.R.; Initiative, F.T.A.D.N. Periventricular hyperintensities are associated with elevated cerebral amyloid. Neurology 2016, 86, 535–543. [Google Scholar] [CrossRef]
- Medrano-Martorell, S.; Capellades, J.; Jiménez-Conde, J.; González-Ortiz, S.; Vilas-González, M.; Rodríguez-Campello, A.; Ois, Á.; Cuadrado-Godia, E.; Avellaneda, C.; Fernández, I.; et al. Risk factors analysis according to regional distribution of white matter hyperintensities in a stroke cohort. Eur. Radiol. 2022, 32, 272–280. [Google Scholar] [CrossRef]
- Jiménez-Balado, J.; Corlier, F.; Habeck, C.; Stern, Y.; Eich, T. Effects of white matter hyperintensities distribution and clustering on late-life cognitive impairment. Sci. Rep. 2022, 12, 1955. [Google Scholar] [CrossRef]
- Lowe, R.; Slodkowicz, G.; Goldman, N.; Rakyan, V.K. The human blood DNA methylome displays a highly distinctive profile compared with other somatic tissues. Epigenetics 2015, 10, 274–281. [Google Scholar] [CrossRef]
- Shenker, N.S.; Polidoro, S.; van Veldhoven, K.; Sacerdote, C.; Ricceri, F.; Birrell, M.A.; Belvisi, M.G.; Brown, R.; Vineis, P.; Flanagan, J.M.; et al. Epigenome-wide association study in the European Prospective Investigation into Cancer and Nutrition (EPIC-Turin) identifies novel genetic loci associated with smoking. Hum. Mol. Genet. 2013, 22, 843–851. [Google Scholar] [CrossRef]


| Principal Characteristics of the Sample (N = 247) | |
|---|---|
| Variable | Mean (SD)/N(%) |
| Age, years | 68.4 (11.8) |
| Sex, male | 155 (62.8%) |
| Smoking habit, yes | 85 (34.4%) |
| Alcohol consumption | 67 (27.1%) |
| Hypertension | 192 (77.7%) |
| Diabetes | 103 (41.7%) |
| Dyslipidemia | 149 (60.3%) |
| Body mass index | |
| Normal, <25 | 79 (34.1%) |
| Overweight, 25 to 30 | 98 (42.2%) |
| Obesity, ≥30 | 55 (23.7%) |
| Atrial fibrillation | 65 (26.3%) |
| Previous myocardial infarction | 22 (8.94%) |
| TOAST, stroke subtype | |
| Atherothrombotic | 62 (25.1%) |
| Lacunar | 83 (33.6%) |
| Cardioembolic | 59 (23.9%) |
| Undetermined | 43 (17.4%) |
| Effect of Biological Age in WMH | ||||||||
|---|---|---|---|---|---|---|---|---|
| Hannum Models | Horvath Models | |||||||
| Biological Age | Chronological Age | Biological Age | Chronological Age | |||||
| β (95% CI) | p-Value | β (95% CI) | p-Value | β (95% CI) | p-Value | β (95% CI) | p-Value | |
| Model 1 | 0.019 (−0.001; 0.038) | 0.058 | 0.020 (0.003; 0.038) | 0.021 | 0.014 (−0.002; 0.030) | 0.078 | 0.023 (0.006; 0.039) | 0.007 |
| Model 2 | 0.022 (0.002; 0.043) | 0.031 | 0.021 (0.002; 0.040) | 0.033 | 0.018 (0,000; 0.035) | 0.054 | 0.024 (0.005; 0.042) | 0.012 |
| Model 3 | 0.022 (0.001; 0.042) | 0.039 | 0.021 (0.002; 0.040) | 0.033 | 0.017 (−0.001; 0.035) | 0.060 | 0.023 (0.005; 0.042) | 0.013 |
| Effect of B-Age and Other Risk Factors on WMH | ||
|---|---|---|
| β (95% CI) | p-Value | |
| B-age (Hannum), year | 0.023 (0.002; 0.043) | 0.029 |
| C-age, year | 0.021 (0.001; 0.040) | 0.036 |
| Sex, male | 0.286 (−0.003; 0.575) | 0.053 |
| TOAST, stroke subtype | ||
| Atherothrombotic | Ref. | Ref. |
| Cardioembolic | −0.135 (−0.513; 0.243) | 0.481 |
| Lacunar | 0.339 (0.001; 0.677) | 0.050 |
| Undetermined | 0.118 (−0.270; 0.506) | 0.550 |
| Hypertension | 0.375 (0.059; 0.692) | 0.020 |
| Diabetes | 0.295 (0.034; 0.557) | 0.027 |
| Smoking Habit | 0.341 (−0.026; 0.709) | 0.069 |
| Alcohol Consumption | −0.444 (−0.799; −0.089) | 0.014 |
| Body Mass Index | −0.026 (−0.057; 0.004) | 0.095 |
Disclaimer/Publisher’s Note: The statements, opinions and data contained in all publications are solely those of the individual author(s) and contributor(s) and not of MDPI and/or the editor(s). MDPI and/or the editor(s) disclaim responsibility for any injury to people or property resulting from any ideas, methods, instructions or products referred to in the content. |
© 2022 by the authors. Licensee MDPI, Basel, Switzerland. This article is an open access article distributed under the terms and conditions of the Creative Commons Attribution (CC BY) license (https://creativecommons.org/licenses/by/4.0/).
Share and Cite
Jiménez-Balado, J.; Giralt-Steinhauer, E.; Fernández-Pérez, I.; Rey, L.; Cuadrado-Godia, E.; Ois, Á.; Rodríguez-Campello, A.; Soriano-Tárraga, C.; Lazcano, U.; Macias-Gómez, A.; et al. Epigenetic Clock Explains White Matter Hyperintensity Burden Irrespective of Chronological Age. Biology 2023, 12, 33. https://doi.org/10.3390/biology12010033
Jiménez-Balado J, Giralt-Steinhauer E, Fernández-Pérez I, Rey L, Cuadrado-Godia E, Ois Á, Rodríguez-Campello A, Soriano-Tárraga C, Lazcano U, Macias-Gómez A, et al. Epigenetic Clock Explains White Matter Hyperintensity Burden Irrespective of Chronological Age. Biology. 2023; 12(1):33. https://doi.org/10.3390/biology12010033
Chicago/Turabian StyleJiménez-Balado, Joan, Eva Giralt-Steinhauer, Isabel Fernández-Pérez, Lucía Rey, Elisa Cuadrado-Godia, Ángel Ois, Ana Rodríguez-Campello, Carolina Soriano-Tárraga, Uxue Lazcano, Adrià Macias-Gómez, and et al. 2023. "Epigenetic Clock Explains White Matter Hyperintensity Burden Irrespective of Chronological Age" Biology 12, no. 1: 33. https://doi.org/10.3390/biology12010033
APA StyleJiménez-Balado, J., Giralt-Steinhauer, E., Fernández-Pérez, I., Rey, L., Cuadrado-Godia, E., Ois, Á., Rodríguez-Campello, A., Soriano-Tárraga, C., Lazcano, U., Macias-Gómez, A., Suárez-Pérez, A., Revert, A., Estragués, I., Beltrán-Mármol, B., Medrano-Martorell, S., Capellades, J., Roquer, J., & Jiménez-Conde, J. (2023). Epigenetic Clock Explains White Matter Hyperintensity Burden Irrespective of Chronological Age. Biology, 12(1), 33. https://doi.org/10.3390/biology12010033