Article

Copepods as Indicators of Different Water Masses during the Northeast Monsoon Prevailing Period in the Northeast Taiwan

1
Institute of Marine Biology, National Taiwan Ocean University, Keelung 202301, Taiwan
2
Third Institute of Oceanography, Ministry of Natural Resources, Xiamen 361005, China
3
Center of Excellence for Ocean Engineering, National Taiwan Ocean University, Keelung 202301, Taiwan
4
Center of Excellence for the Oceans, National Taiwan Ocean University, Keelung 202301, Taiwan
*
Authors to whom correspondence should be addressed.
These authors contributed equally to this work.
Biology 2022, 11(9), 1357; https://doi.org/10.3390/biology11091357
Submission received: 5 August 2022 / Revised: 5 September 2022 / Accepted: 13 September 2022 / Published: 16 September 2022

Abstract

:

Simple Summary

How the origin and pathways of water masses can be traced by particular bioindicators remains an intriguing issue in biological oceanography. In the present zooplankton study focusing on copepods, calanoid copepodites were most abundant, with an average abundance of 774.24 ± 289.42 (inds. m−3) in the northeastern waters of Taiwan during the prevailing northeast monsoon, followed by the dominant copepod species Paracalanus aculeatus and Clausocalanus furcatus. According to hydrological parameters, the water masses were mainly derived from northeast monsoon surface waters, Kuroshio intrusion water, and mixed water masses. Indicator species were Temora turbinata, Calanopia elliptica, and Canthocalanus pauper in the northeast monsoon-derived water mass. Farranula concinna and Copilia mirabilis represented suitable indicators for the Kuroshio intrusion water mass in the research area. In the mixed water mass, the indicator species were Paracandacia truncata, Oncaea clevei, and P. aculeatus in the research area during the sampling campaign in late autumn.

Abstract

During this research, the average surface temperature, salinity, dissolved oxygen, and pH were 24.65 ± 1.53 (°C), 34.21 ± 0.07 (PSU), 6.85 ± 0.18 (mg/L), and 8.36 ± 0.03, respectively. Based on these environmental parameters, stations were arranged into three groups. Group A represents stations located around Keelung Island with the relative highest average dissolved oxygen, lowest average temperature, and pH values. Instead, the lowest average dissolved oxygen and highest average temperature, salinity, and pH values were recorded at the offshore stations. Keelung Island area was charged by cold water masses, which were driven by the Northeast monsoon, and stations in group C were affected by the Kuroshio Current. Kueishan Island area was mainly affected by mixed water masses resulting from the Kuroshio intrusion and monsoon-derived cold water. In this study, a total of 108 copepod species were identified, with an average abundance of 774.24 ± 289.42 (inds. m−3). Most species belong to the orders Calanoida and Poecilostomatoida, with an average relative abundance (RA) of 62.96% and 30.56%, respectively. Calanoid copepodites were the most dominant group, with a RA of 28.06%. This was followed by Paracalanus aculeatus, with a RA of 18.44%. The RA of Clausocalanus furcatus and Canthocalanus pauper was 4.80% and 3.59%, respectively. The dominant species P. aculeatus, C. pauper, Paracalanus parvus, and Temora turbinata were positively correlated with dissolved oxygen and negatively correlated with temperature in the surface waters. pH showed a negative correlation with P. parvus and T. turbinata, while the temperature was negatively correlated with these two dominant species. Indicator species were selected by an indicator value higher than 50%. Temora turbinata, Calanopia elliptica, C. pauper, Euchaeta concinna, Temora discaudata, Acartia pacifica, Macrosetella gracilis, Corycaeus speciosus, and P. parvus were considered as monsoonal cold water indicator species in Group A. Indicator copepod species for the Kuroshio Current were Farranula concinna, Copilia mirabilis, Candacia aethiopica, Corycaeus agilis, Farranula gibbula and Acrocalanus monachus in the study area. Paracandacia truncata, Oncaea clevei, P. aculeatus, and Centropages furcatus were considered suitable indicators for mixed water masses.

1. Introduction

In the marine environment, zooplankter is exposed to and sensitive to physical, chemical, and biological factors [1,2,3,4]. Their population dynamics were shown to respond closely to seasonal temperature variations [5,6,7]. Copepods provide the most abundant zooplankton assemblages in marine ecosystems [8,9,10]. In many places, they account for the majority of mesozooplankton abundance and could comprise about 70% or more of the zooplankton community in abundance and about 30% of its biomass [11]. Copepods play a key role in aquatic food webs and biogeochemical cycles by transferring nutrients and energy from primary producers to higher trophic levels [12,13,14,15,16]. As they are highly dependent on environmental conditions (e.g., chemical and organic contaminants, temperature, and salinity), being able to give a fast response at the ecologically relevant population and community levels, copepod species have long been used as bioindicators of environmental quality and water mass origin [17,18,19,20]. Marine copepods are an excellent tool for evaluating the impact of marine pollution along coastal regions because they quickly respond to different types of stressors in different ways (e.g., decreased fecundity, gender bias, molecular responses, mortality) [21,22,23,24,25,26]. Marine copepods can also track changes in environmental conditions that occur at interannual to multidecadal scales [27,28,29,30,31].
Eddies and coastal currents could directly promote the migration of zooplankton by physical transport or modify water temperature, salinity, Chl a concentrations, dissolved oxygen (DO), and other seawater environmental variables which indirectly control the distribution of zooplankton [32,33,34,35,36,37]. Previous studies reported that both the Kuroshio onshore intrusion and the southwestward current along the slope frequently prevail in the northeast of Taiwan [38,39]. Due to local monsoons, heat flux, and mesoscale eddies east of Taiwan, the Kuroshio Current showed significant seaward migration in summer and on-shelf encroachment and intrusion in winter [40,41,42,43]. There was a year-round upwelling via the subsurface Kuroshio water onshore intrusion in the northeast of Taiwan [44,45,46]. Upwelling was shown as an important pathway for shelf-ocean exchanges of dissolved and particulate material between the East China Sea (ECS) and the Kuroshio Current, which commonly causes a higher phytoplankton production [47]. The well-mixed intrusion of Kuroshio water and the continental shelf current, plus the upwelling, critically affects the composition and abundance of oceanic biota around the island of Taiwan [35,48,49,50,51,52]. Previous studies indicate a correlation between the abundance of biota and the water masses in northeast Taiwan [53]. Copepods also show a significant diel vertical migration in the upwelling area of northeastern Taiwan [54]. Previous studies indicated that seasonal successions of dominant copepod species range from 25.0% to 61.9% in northeast Taiwan, with, among others, the following dominant species Cosmocalanus darwinii, Canthocalanus pauper, Clausocalanus furcatus, Paracalanus aculeatus and Temora trubinata [8,12,52,53,55]. The dominant species, T. turbinata, shows a significant negative correlation with surface water temperature and seasonal variation in the research area [51,56].
Previous studies indicate that the planktonic copepods in the waters of northeastern Taiwan are affected by the interactions between East China Sea waters and Kuroshio waters [8,12,51,52,53,55,56]. The hydrological characteristics of the waters in this region change quite rapidly. To date, the relationship between the biogeographic distribution of planktonic copepods and the water masses in this region during the prevailing northeast monsoon period is unclear. Therefore, this study aims at testing two hypotheses: (1) when the northeast monsoon prevails, the waters of northeastern Taiwan are affected by the interaction between East China Sea waters and Kuroshio waters, resulting in differences in the geographic distribution of planktonic copepods; (2) changes in temperature and salinity affect the occurrence and abundance changes of dominant copepod species. The aim of the present study was to understand the potential effects of environmental factors on copepod communities and characteristics during the prevailing northeast monsoon period in autumn in northeast Taiwan. For this purpose, changes in the plankton copepod species composition, dominant species, and community characteristics were analyzed here. Indicator values were calculated based on species distribution and abundance to demarcate different water masses in the research area.

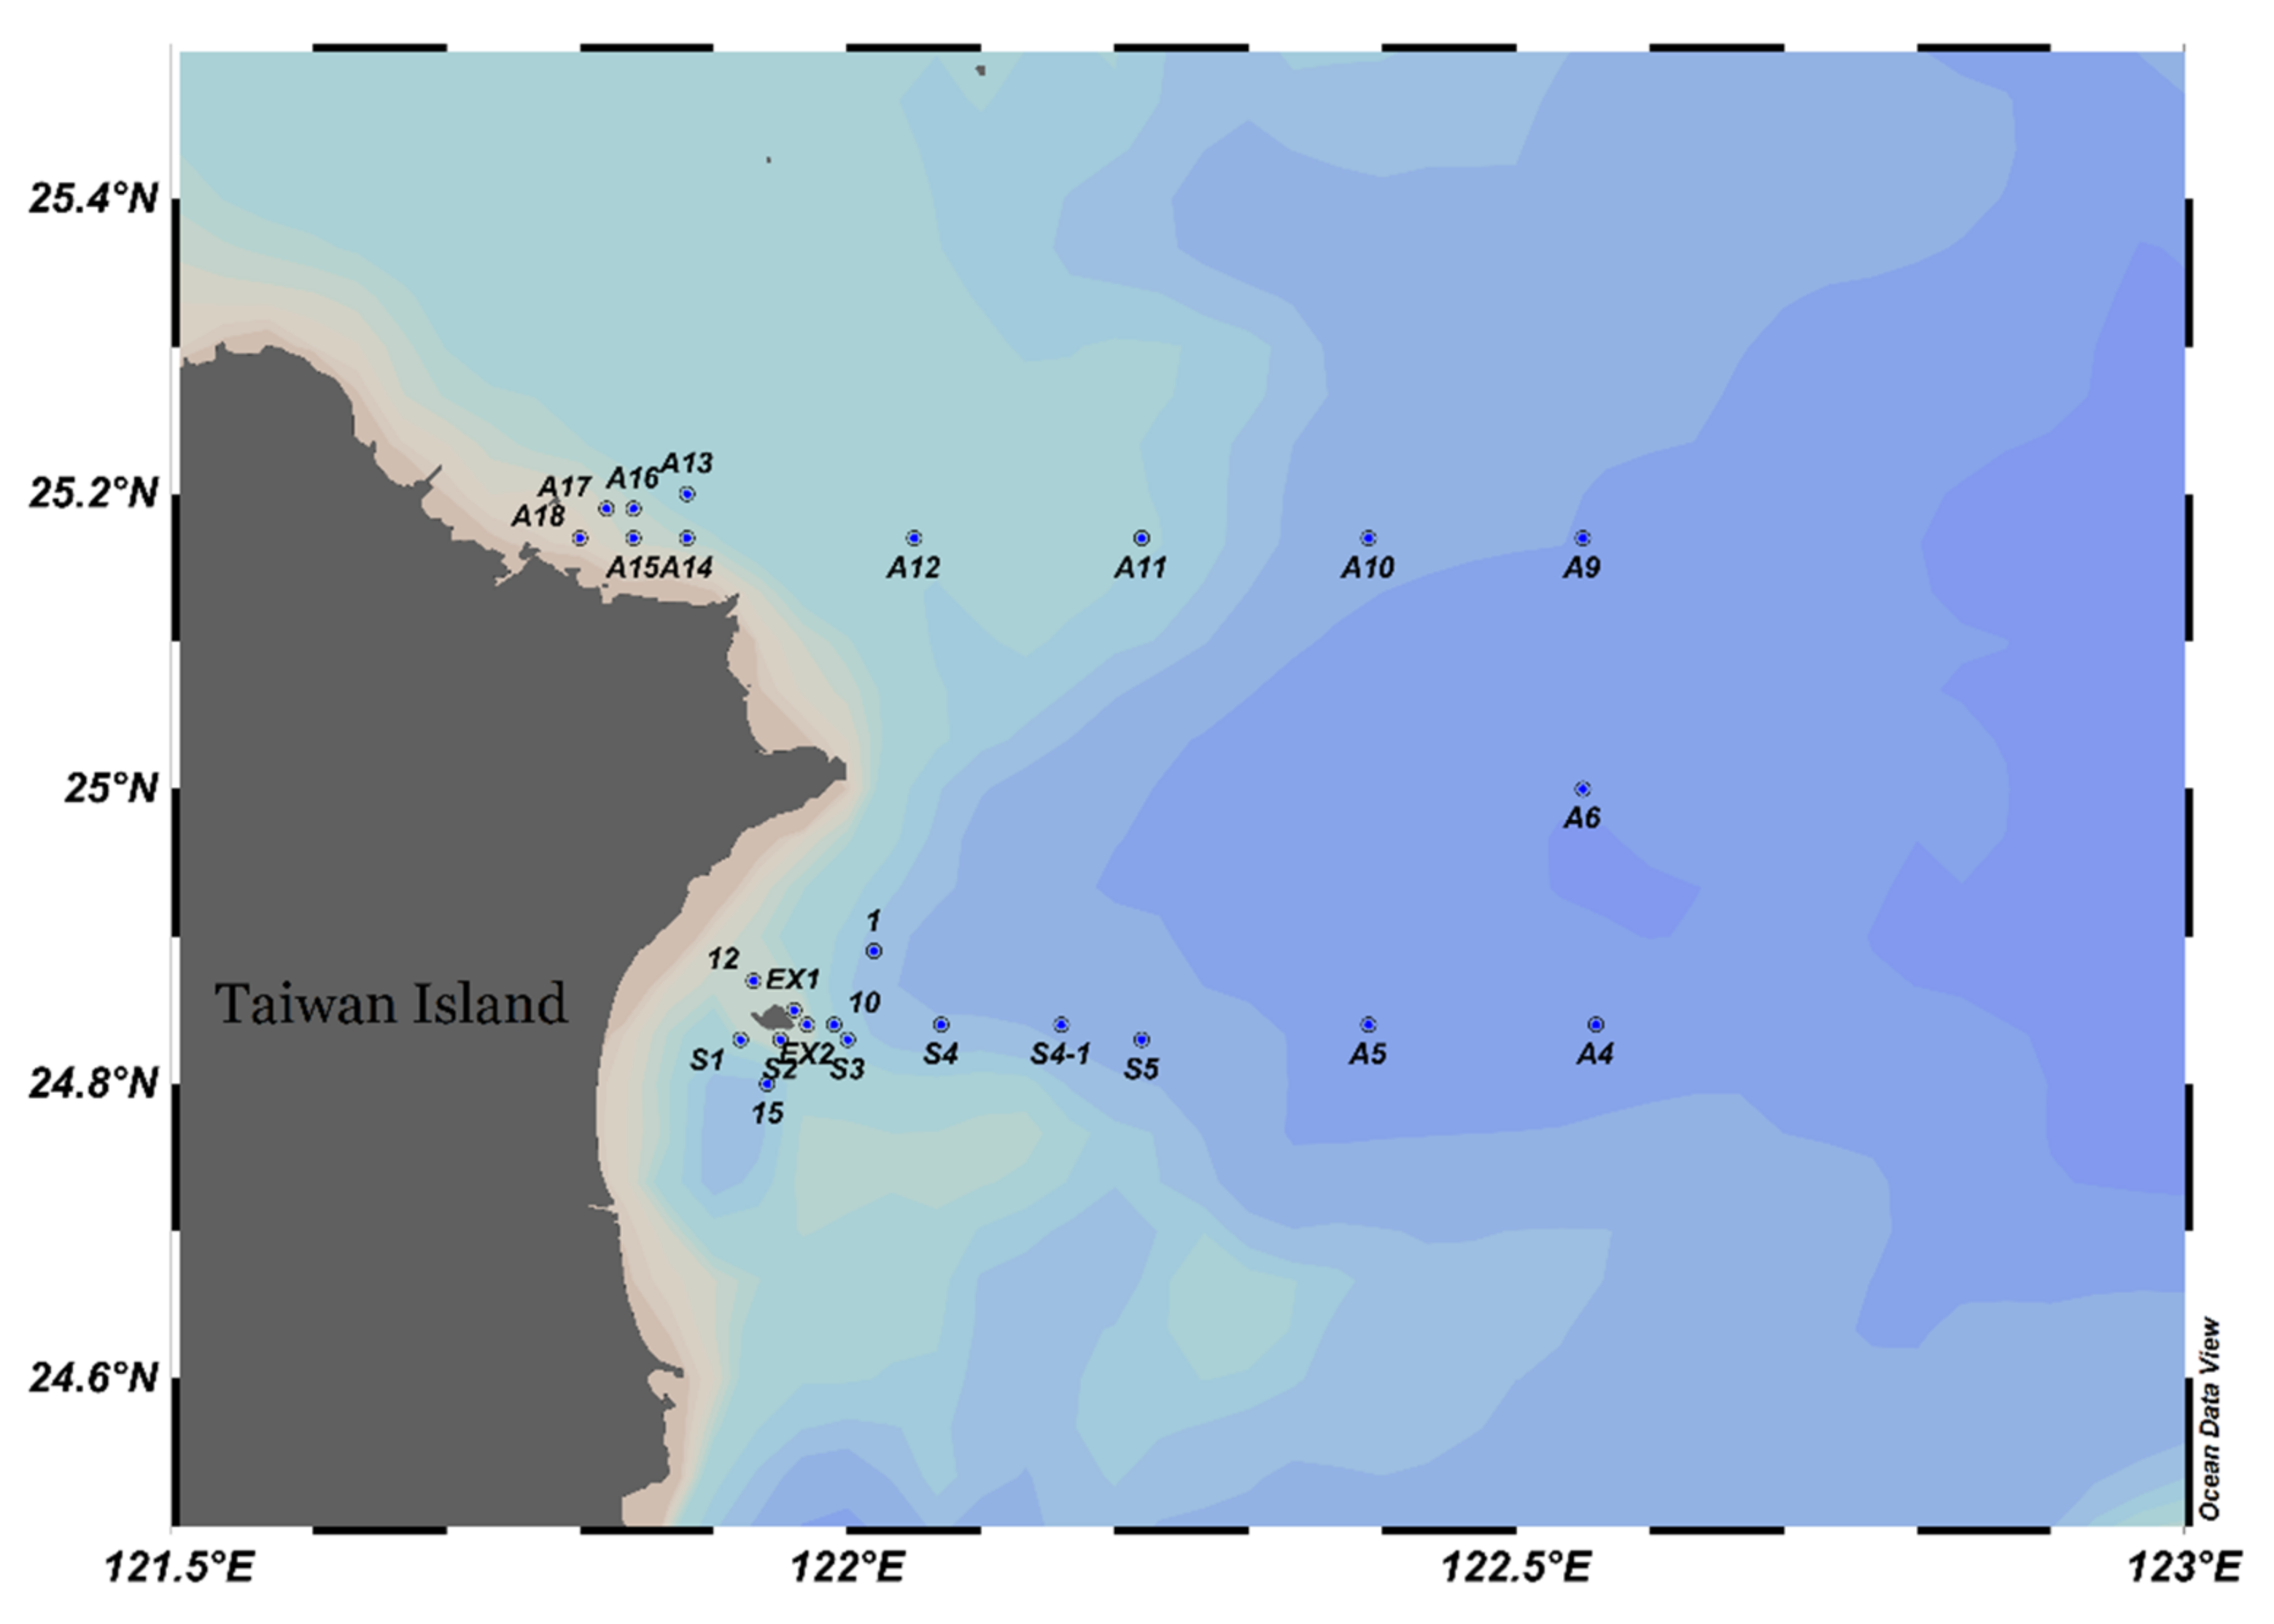
2. Materials and Methods

Samples were collected in the northeast of Taiwan (Figure 1) during the prevailing northeast monsoon period from 1st to 3rd November 2019 by research vessel II. At each sampling station, zooplankton was collected using a west pacific standard zooplankton net with a mouth diameter of 45 cm and a mesh size of 200 μm. The net was horizontally towed from the surface to the 5 m depth layer with a speed of about 1.0 m/s. A flow meter was mounted in the center of the net mouth to calculate the volume of filtered water. The net was fitted with a hard cod end to ensure that the collected organisms were in good condition. Samples were immediately preserved in 4% seawater buffered formaldehyde solution. Water temperature, salinity, dissolved oxygen, and pH were measured by sensors that were mounted on a SeaBird rosette sampler.
The images of the High-Resolution Sea Surface Temperature (SST) were obtained from the Fisheries Research Institute, Council of Agriculture, Taiwan. The images of the sea surface temperature were used to indicate the range of different water masses in the research area.
In the laboratory, zooplankton samples were split with a Folsom plankton sample splitter until subsamples contained not less than 200 individuals, and subsamples were enumerated. Copepods were identified to species level where possible and counted under a stereomicroscope (Leica MZ95). Several taxonomy studies were referred to when identifying copepod species [57,58,59,60]. Abundance was provided as the number of individuals per cubic meter (ind/m3).
Regional differences in mean abundance among groups were tested by one-way analysis of variance (ANOVA), and Tukey’s honestly post hoc test was applied to distinguish which groups were statistically different in their community structure among the sampling zones using the statistical software package SPSS v24. Dominant species compositions were identified by the decorana function in Vegan package, with the axis length approximating 1.39, which was less than 3. This way, a redundancy analysis (RDA) was performed to correlate environmental parameters with dominant species compositions and distribution using vegan package version 2.5–7, and the RDA diagram was drawn by plot2 package version 3.3.5 in R language [61]. Indicator species are species that are sensitive to change or whose abundance in a given area indicates certain changes in environmental conditions [62,63]. They are used to monitor these changes for fundamental research and to provide information for effective environmental management. In order to find potential indicator species in the groups which resulted from the cluster analysis, the program Indicator Value (IndVal) was applied [64]. Species were defined as indicator species with IndVal higher than 50%. IndVal was calculated as:
IndVal i j = A i j B i j 100
where A i j = N i n d i v i d u a l s i j / N i n d i v i d u a l s i , and B i j = N s i t e i j / N s i t e j .   A i j was a measure of site specificity, where N i n d i v i d u a l s i j was the mean number of i species across sites of group j, and N i n d i v i d u a l s i was the sum of the mean numbers of individuals of species i over all groups. B i j was a measure of group fidelity, where N s i t e i j was the number of sites in group j where species i was present, while N s i t e j was the total number of sites in that group [64].

3. Results

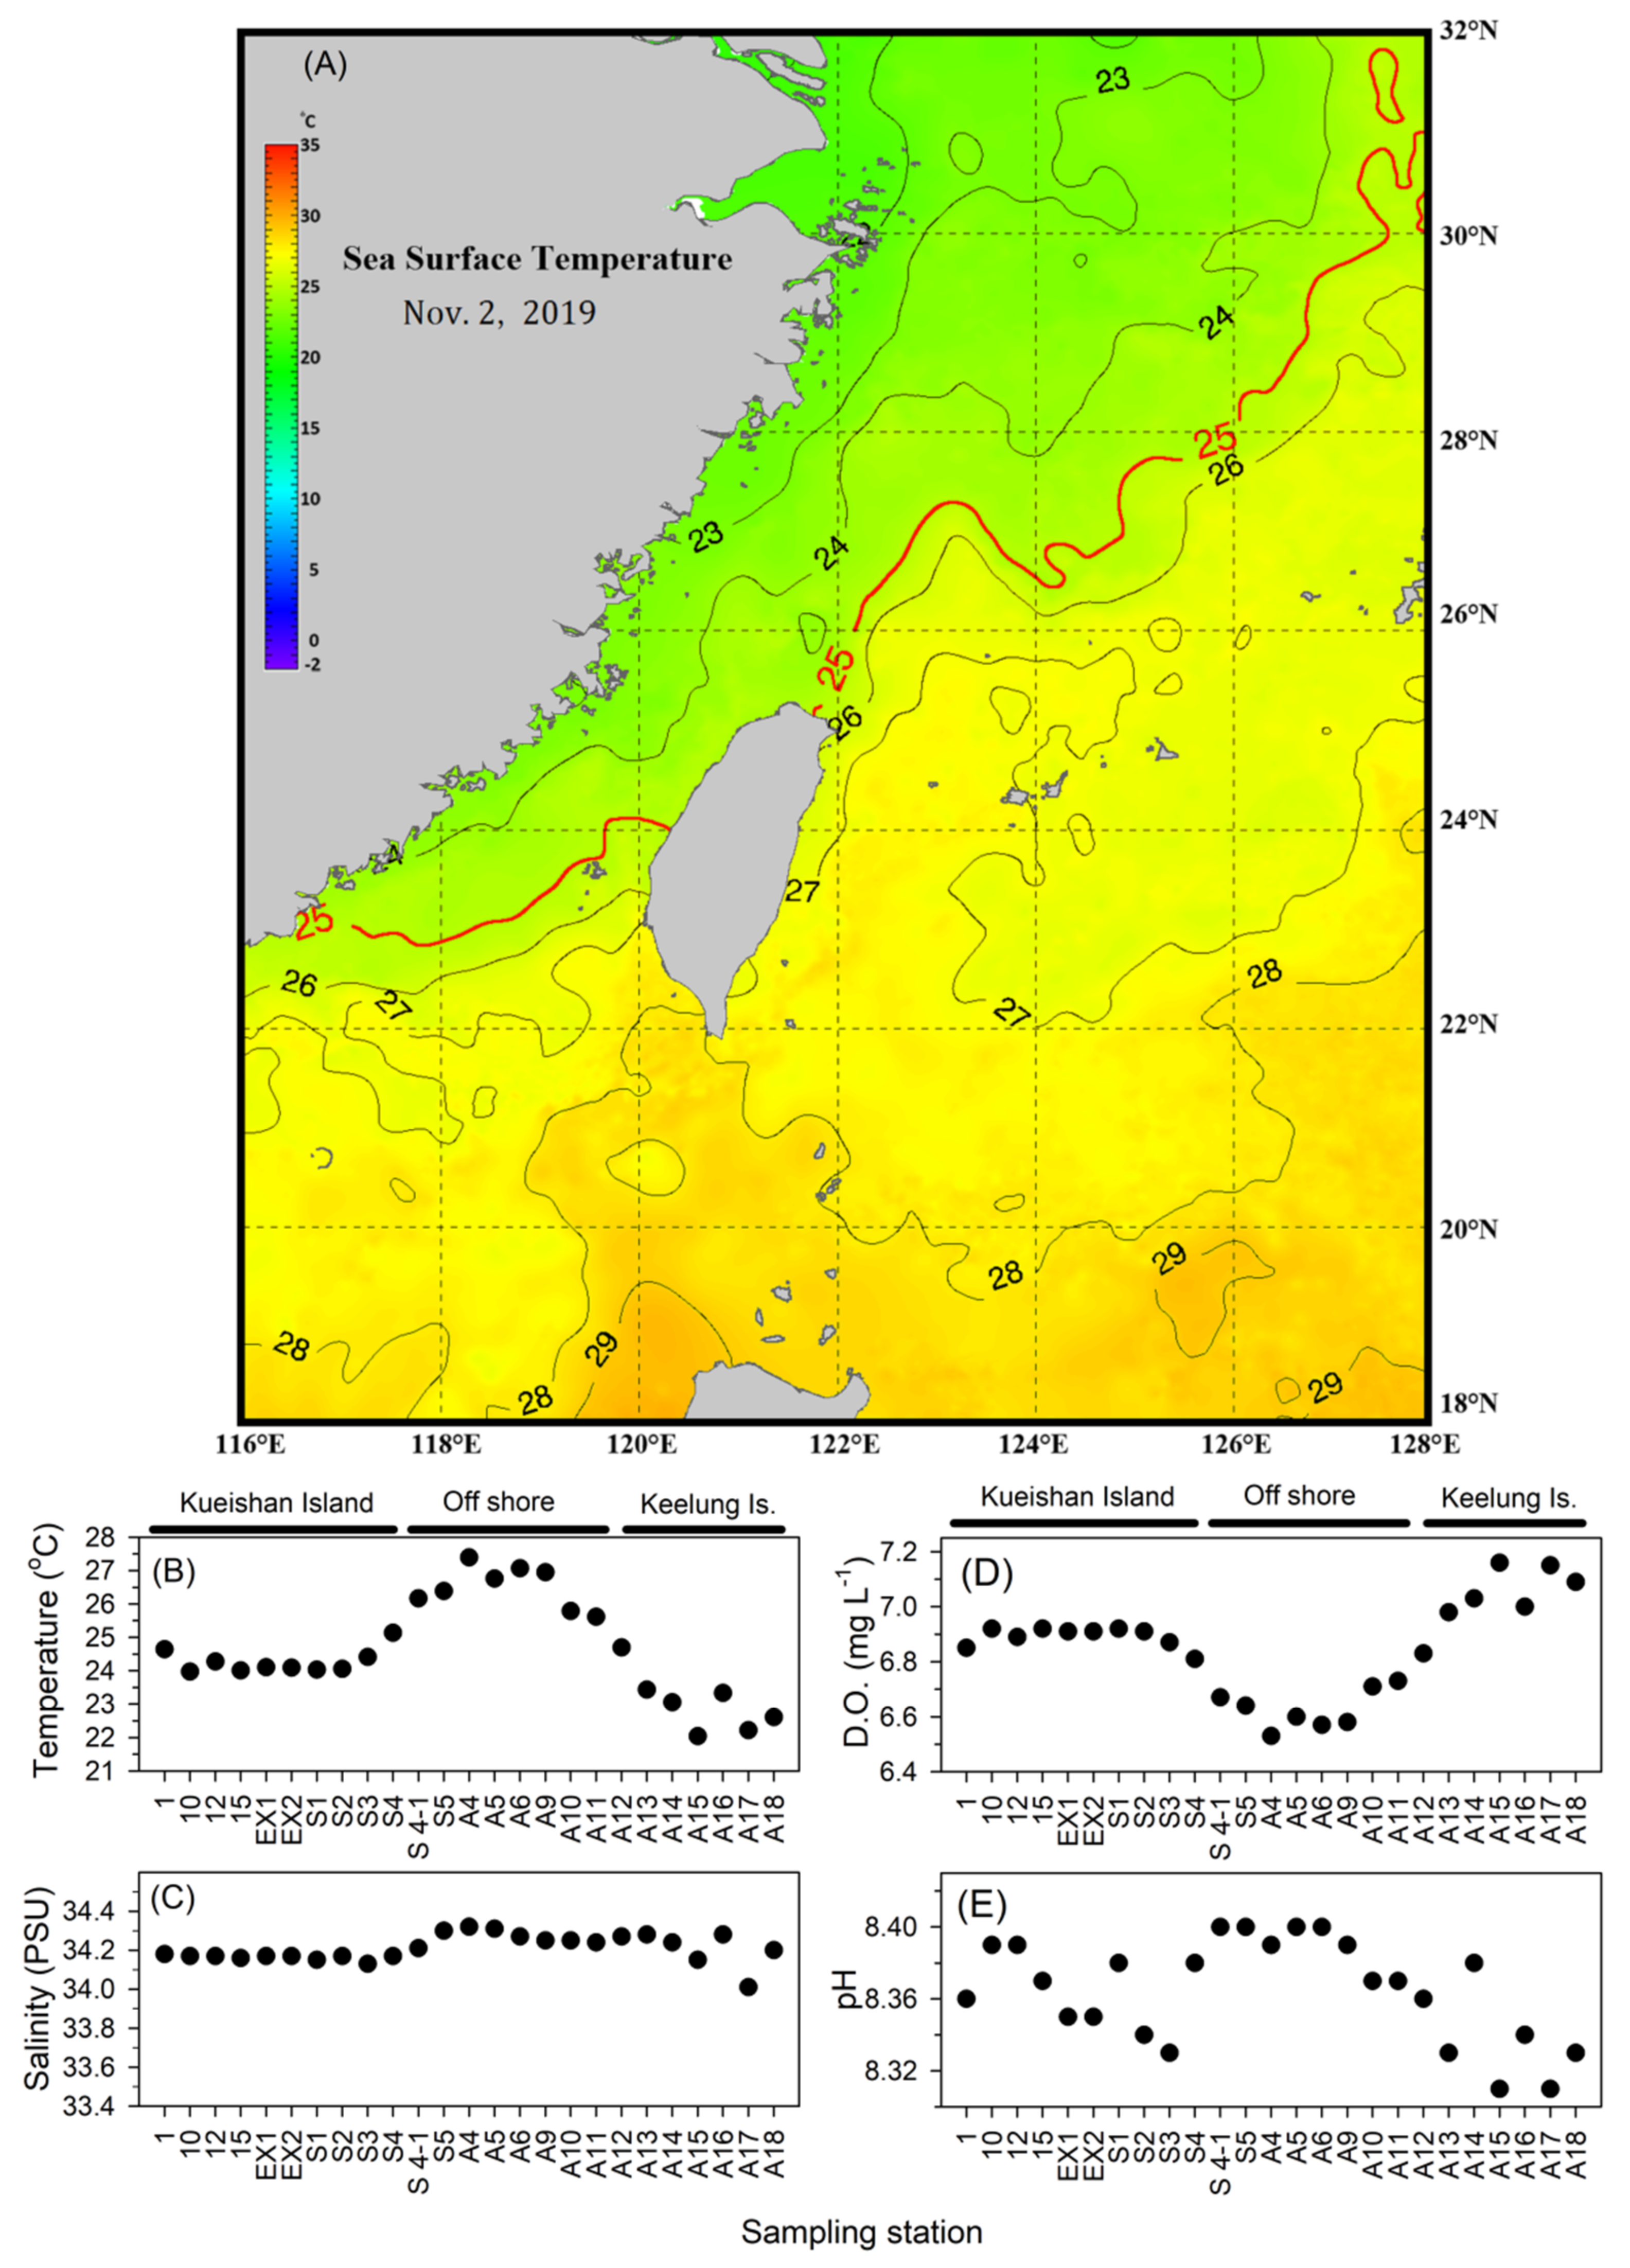
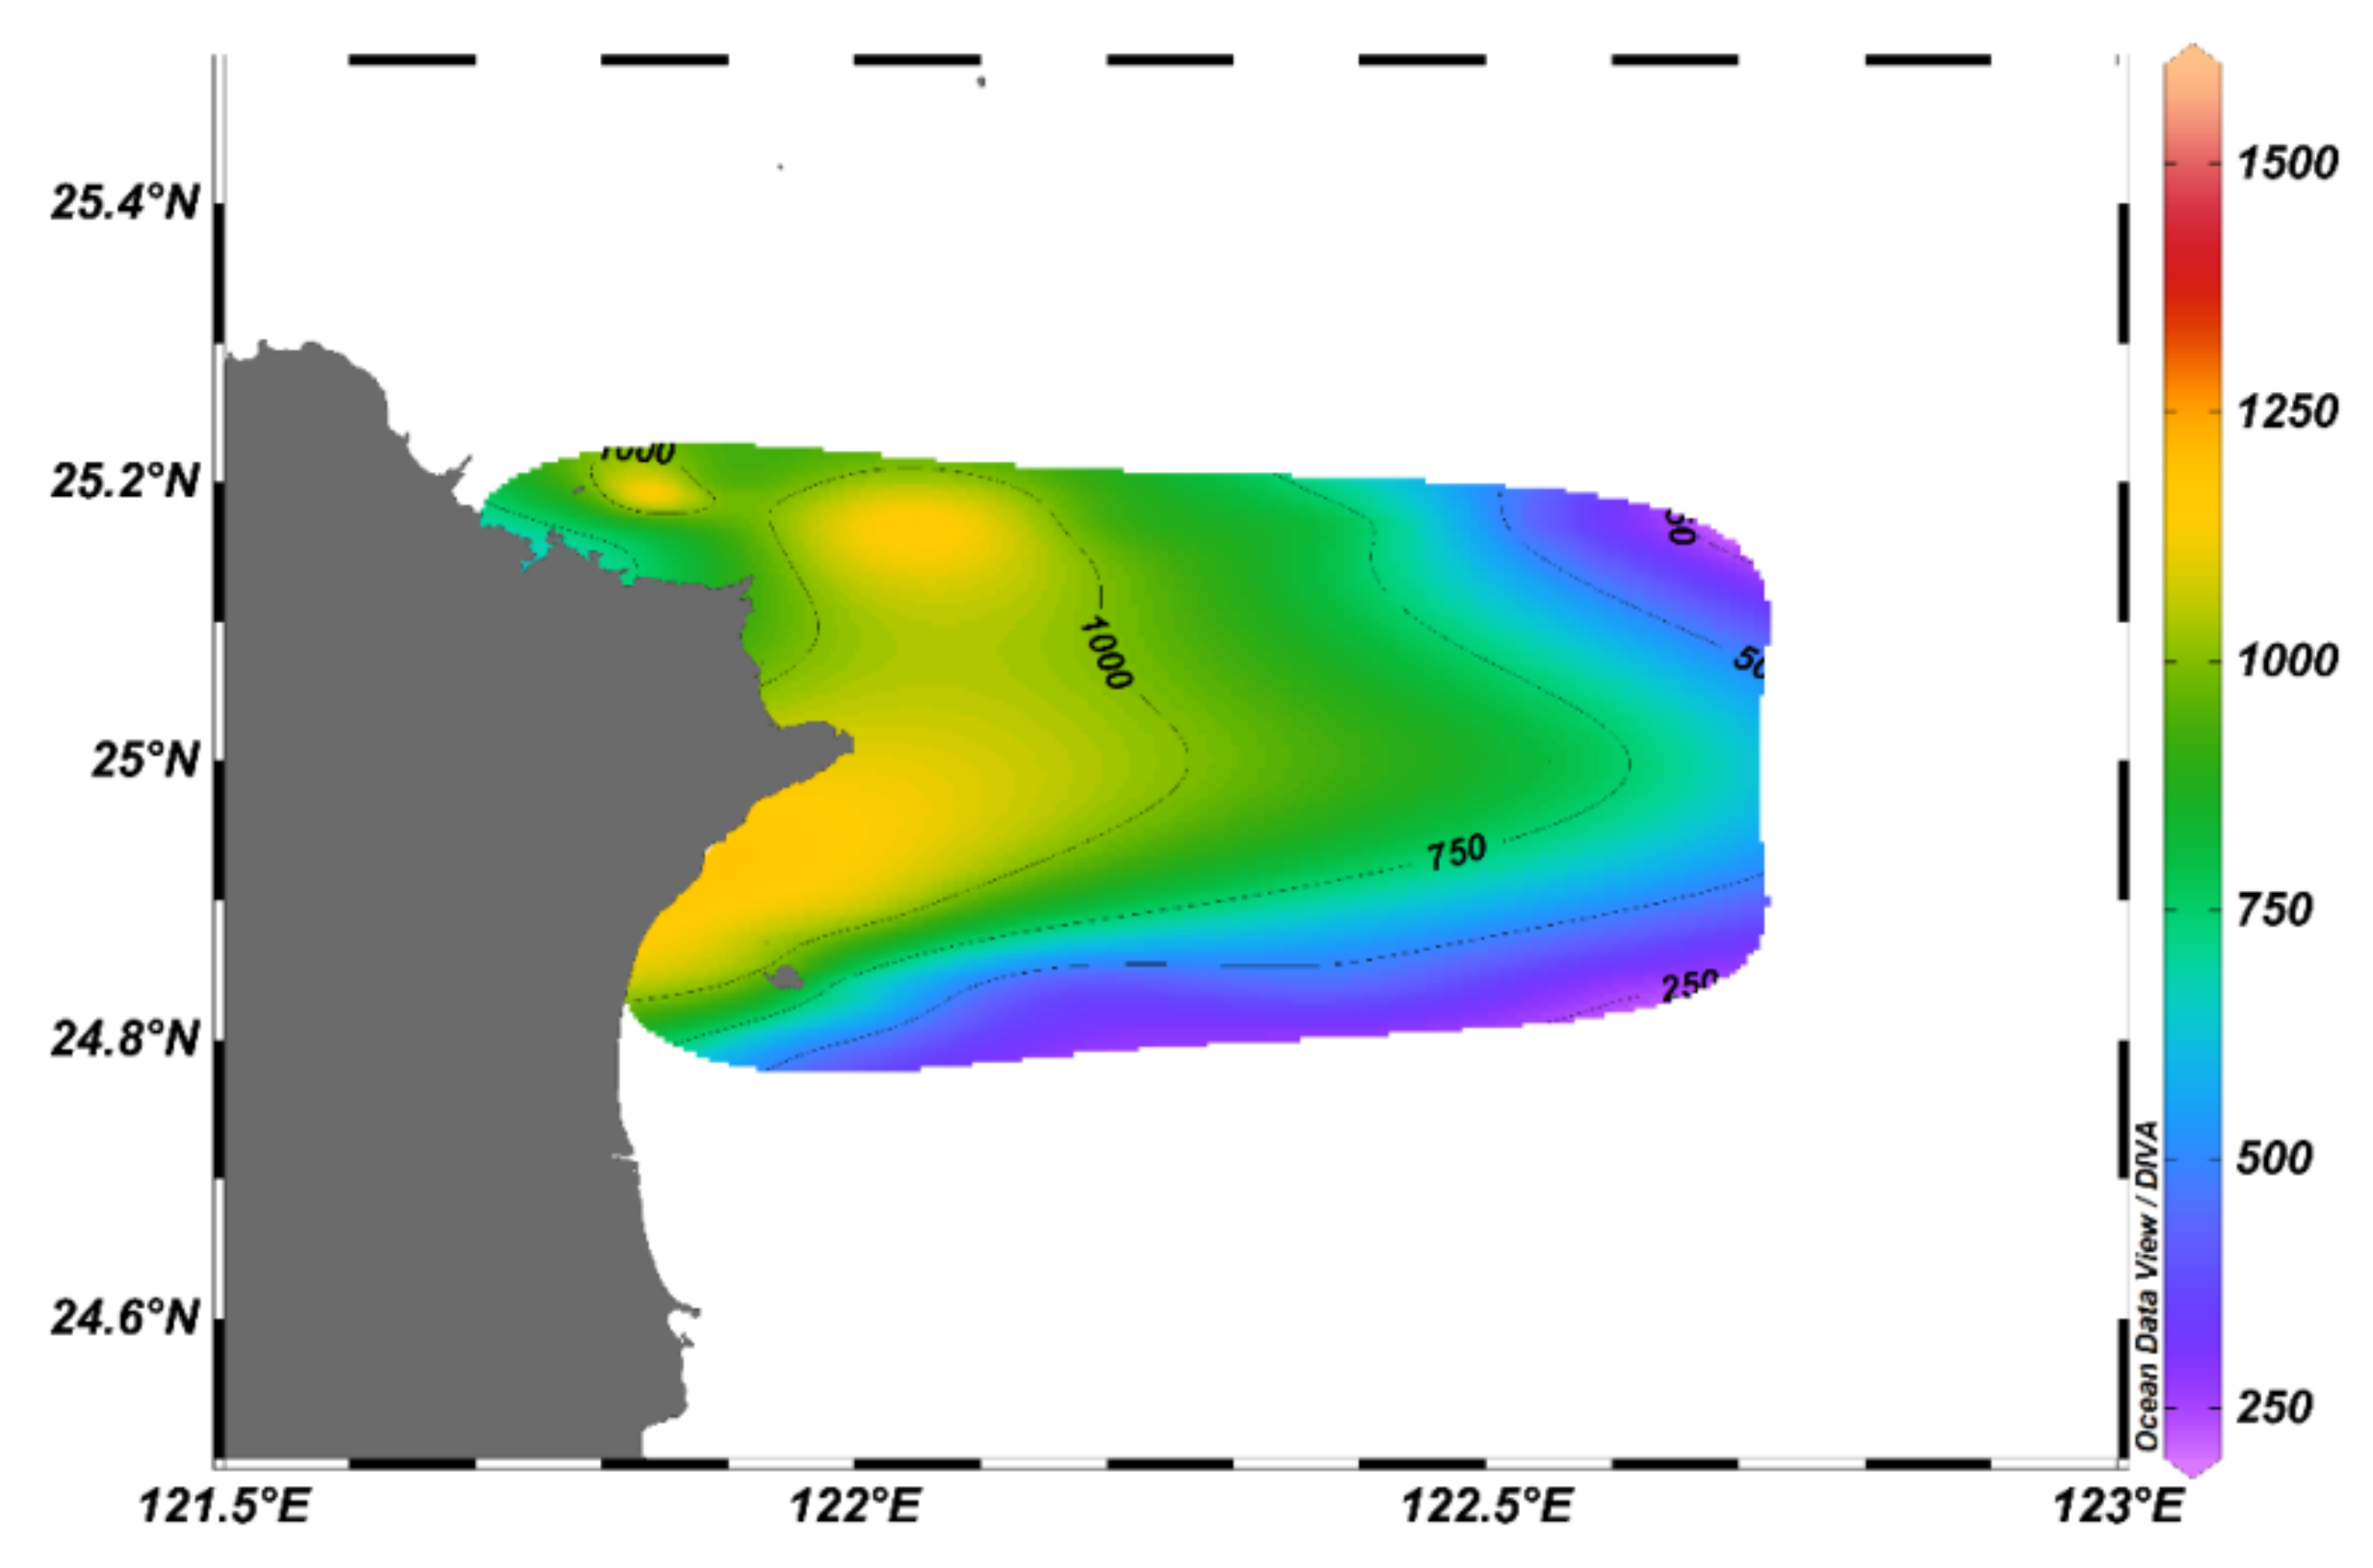
3.1. Spatial Changes in Hydrographic Conditions

During this research, the northeast monsoon prevailed, and the southwest monsoon gradually weakened in the Northwest Pacific Ocean. The northeast monsoon drives the cold surface water southwestward to the East China Sea (Figure 2A). The cold water mass encountered the warm water mass, which originated from the Kuroshio onshore intrusion in the northeast of Taiwan. Research results showed that the salinity variations among sampling stations were not significantly different (Figure 2C). However, the surface temperature showed a more drastic variation than salinity (Figure 2B). Most stations in the east offshore area had the highest temperatures indicating that this area was mainly charged by Kuroshio intrusion water. Stations around Keelung Island showed a relatively low temperature caused by the monsoon-derived cold water intrusion. The water properties around Kueishan Island were relatively moderate, indicating a good mix of Kuroshio intrusion and monsoon-derived water masses in this area.
As Figure 2B indicated, the surface water temperature was highest offshore. The lowest temperature was recorded around Keelung Island station. However, stations around Kueishan Island had surface water temperatures ranging from 22.04 to 27.39 (°C) with an average of 24.65 ± 1.53 (°C). Surface water salinity showed uniform characteristics and was without drastic changes between stations (Figure 2C). The average surface salinity was 34.21 ± 0.07 (PSU), with the highest at 34.32 (PSU) in the offshore S4 station and the lowest at 34.01 (PSU) at the A17 station in the Keelung Island area. Surface water dissolved oxygen showed a negative correlation with surface temperature (Figure 2D). High levels of dissolved oxygen were distributed in the western coastal area with relatively low temperatures. In the eastern offshore area, the surface temperature was higher, and the dissolved oxygen was relatively lower. The average dissolved oxygen was 6.85 ± 0.18 (mg/L), with the highest at 7.16 (mg/L) at the A15 station and the lowest at 6.53 (mg/L) at the A4 station during this study. The surface pH value variations showed a positive correlation with surface temperature (Figure 2E). The highest pH value was recorded in the offshore area, and the lowest pH value appeared around Keelung Island. The pH value showed a drastic variation around Kueishan Island. The surface water average pH value was 8.36 ± 0.03, with the lowest value at 8.31, being recorded at A17 station in the western coastal area, and the highest value at 8.40 at A5 and A6 stations in the eastern area and S4-1 and S5 stations near Kueishan Island.
The hydrographic parameters were calculated according to their Bray-Curtis similarities at different research stations, and the complete linkage was used for k means cluster analysis. The research stations were separated into three groups based on cluster analysis (Figure 3). Stations that were located around Keelung Island in the west of the research area were arranged into group A with a similarity of 98.81% with a Pi value of 32.66 at a 0.1% significance level. The lowest average surface temperature was 22.78 ± 0.58 (°C), and the highest average dissolved oxygen with 7.07 ± 0.08 (mg/L) was found in group A. Average salinity and pH were 34.19 ± 0.10 (PSU) and 8.33 ± 0.03, respectively, in group A. Stations around Kueishan Island and A12 fall into group B, with a similarity of 99.14% and a Pi value 32.78 at 0.1% significance level, with a median average surface water temperature of 24.31 ± 0.37 (°C). The average salinity, dissolved oxygen, and pH were 34.17 ± 0.03 (PSU), 6.89 ± 0.04 (mg/L), and 8.36 ± 0.02, respectively, in group B. The remaining stations, being located in relatively deeper waters in the east of the research area, were clustering to group C. Similarity was 98.63%, with a Pi value of 32.87 at a 0.1% significance level. Stations in this group represented oceanic waters with relatively higher average surface temperature and salinity. The average surface temperature was highest in this group at 26.52 ± 0.63 (°C). The lowest dissolved oxygen was also recorded in this group, with 6.63 ± 0.07 (mg/L). Average salinity and pH were 34.27 ± 0.04 (PSU) and 8.39 ± 0.01 in group C.

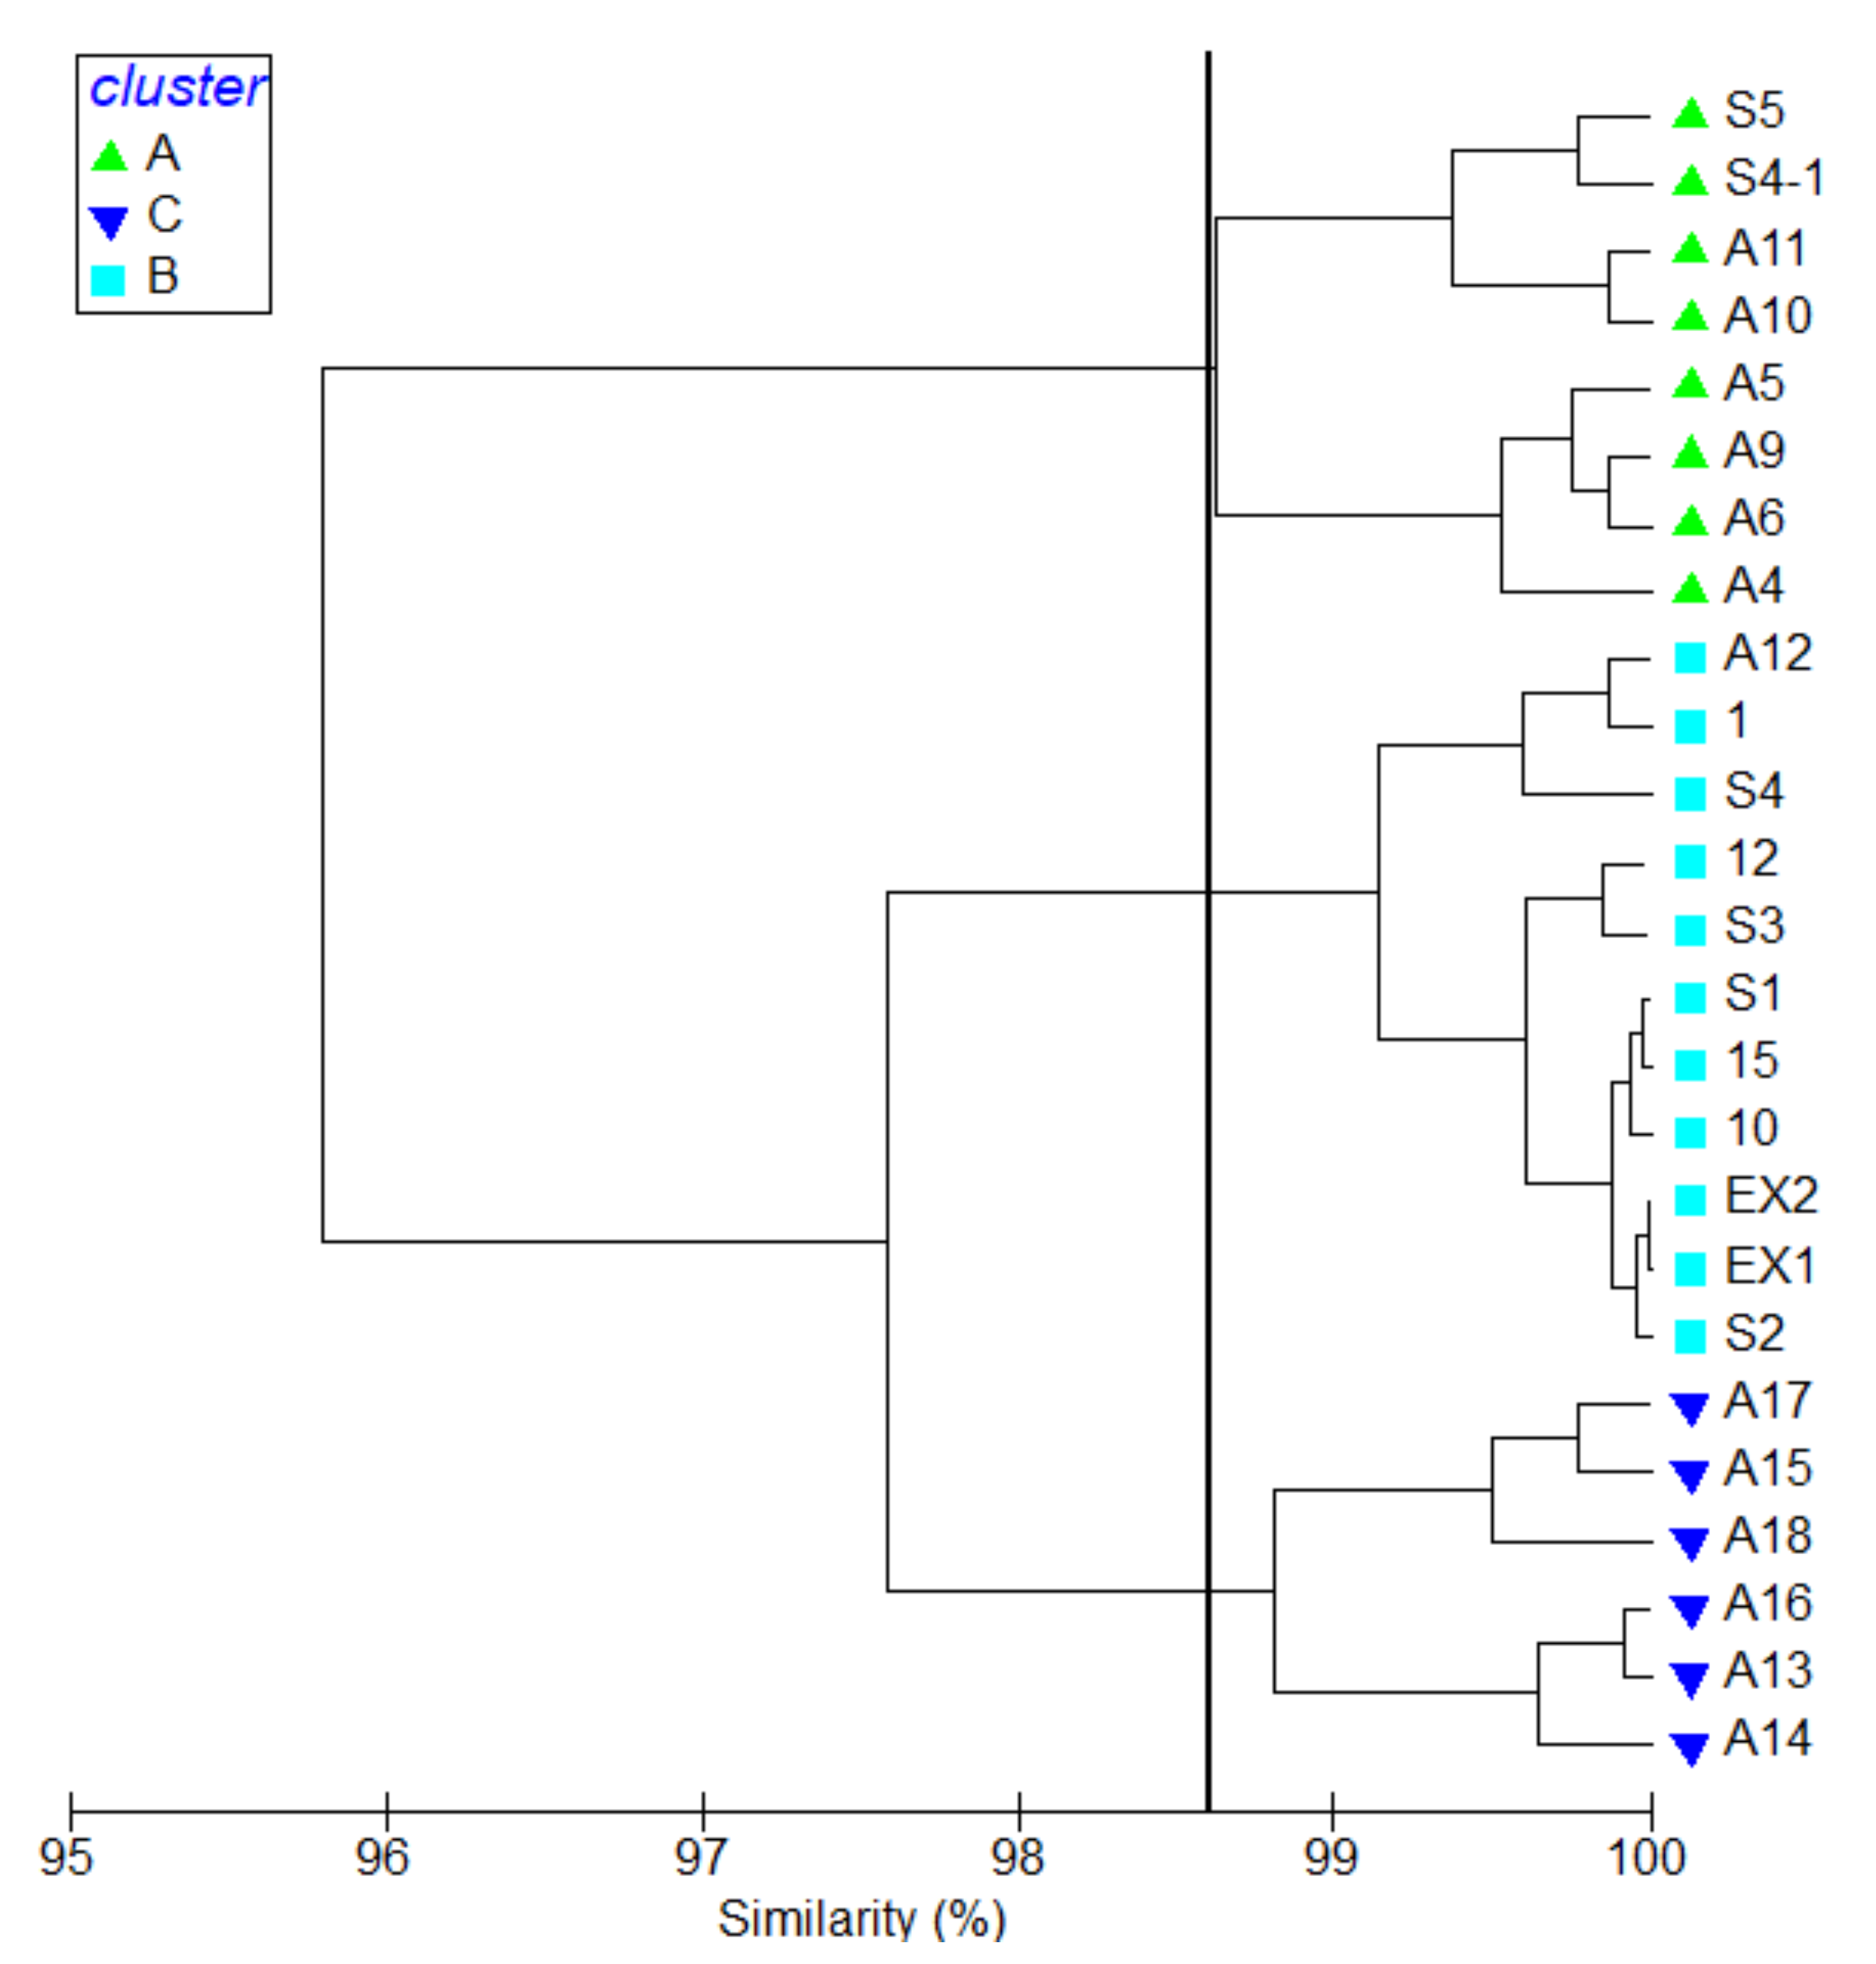
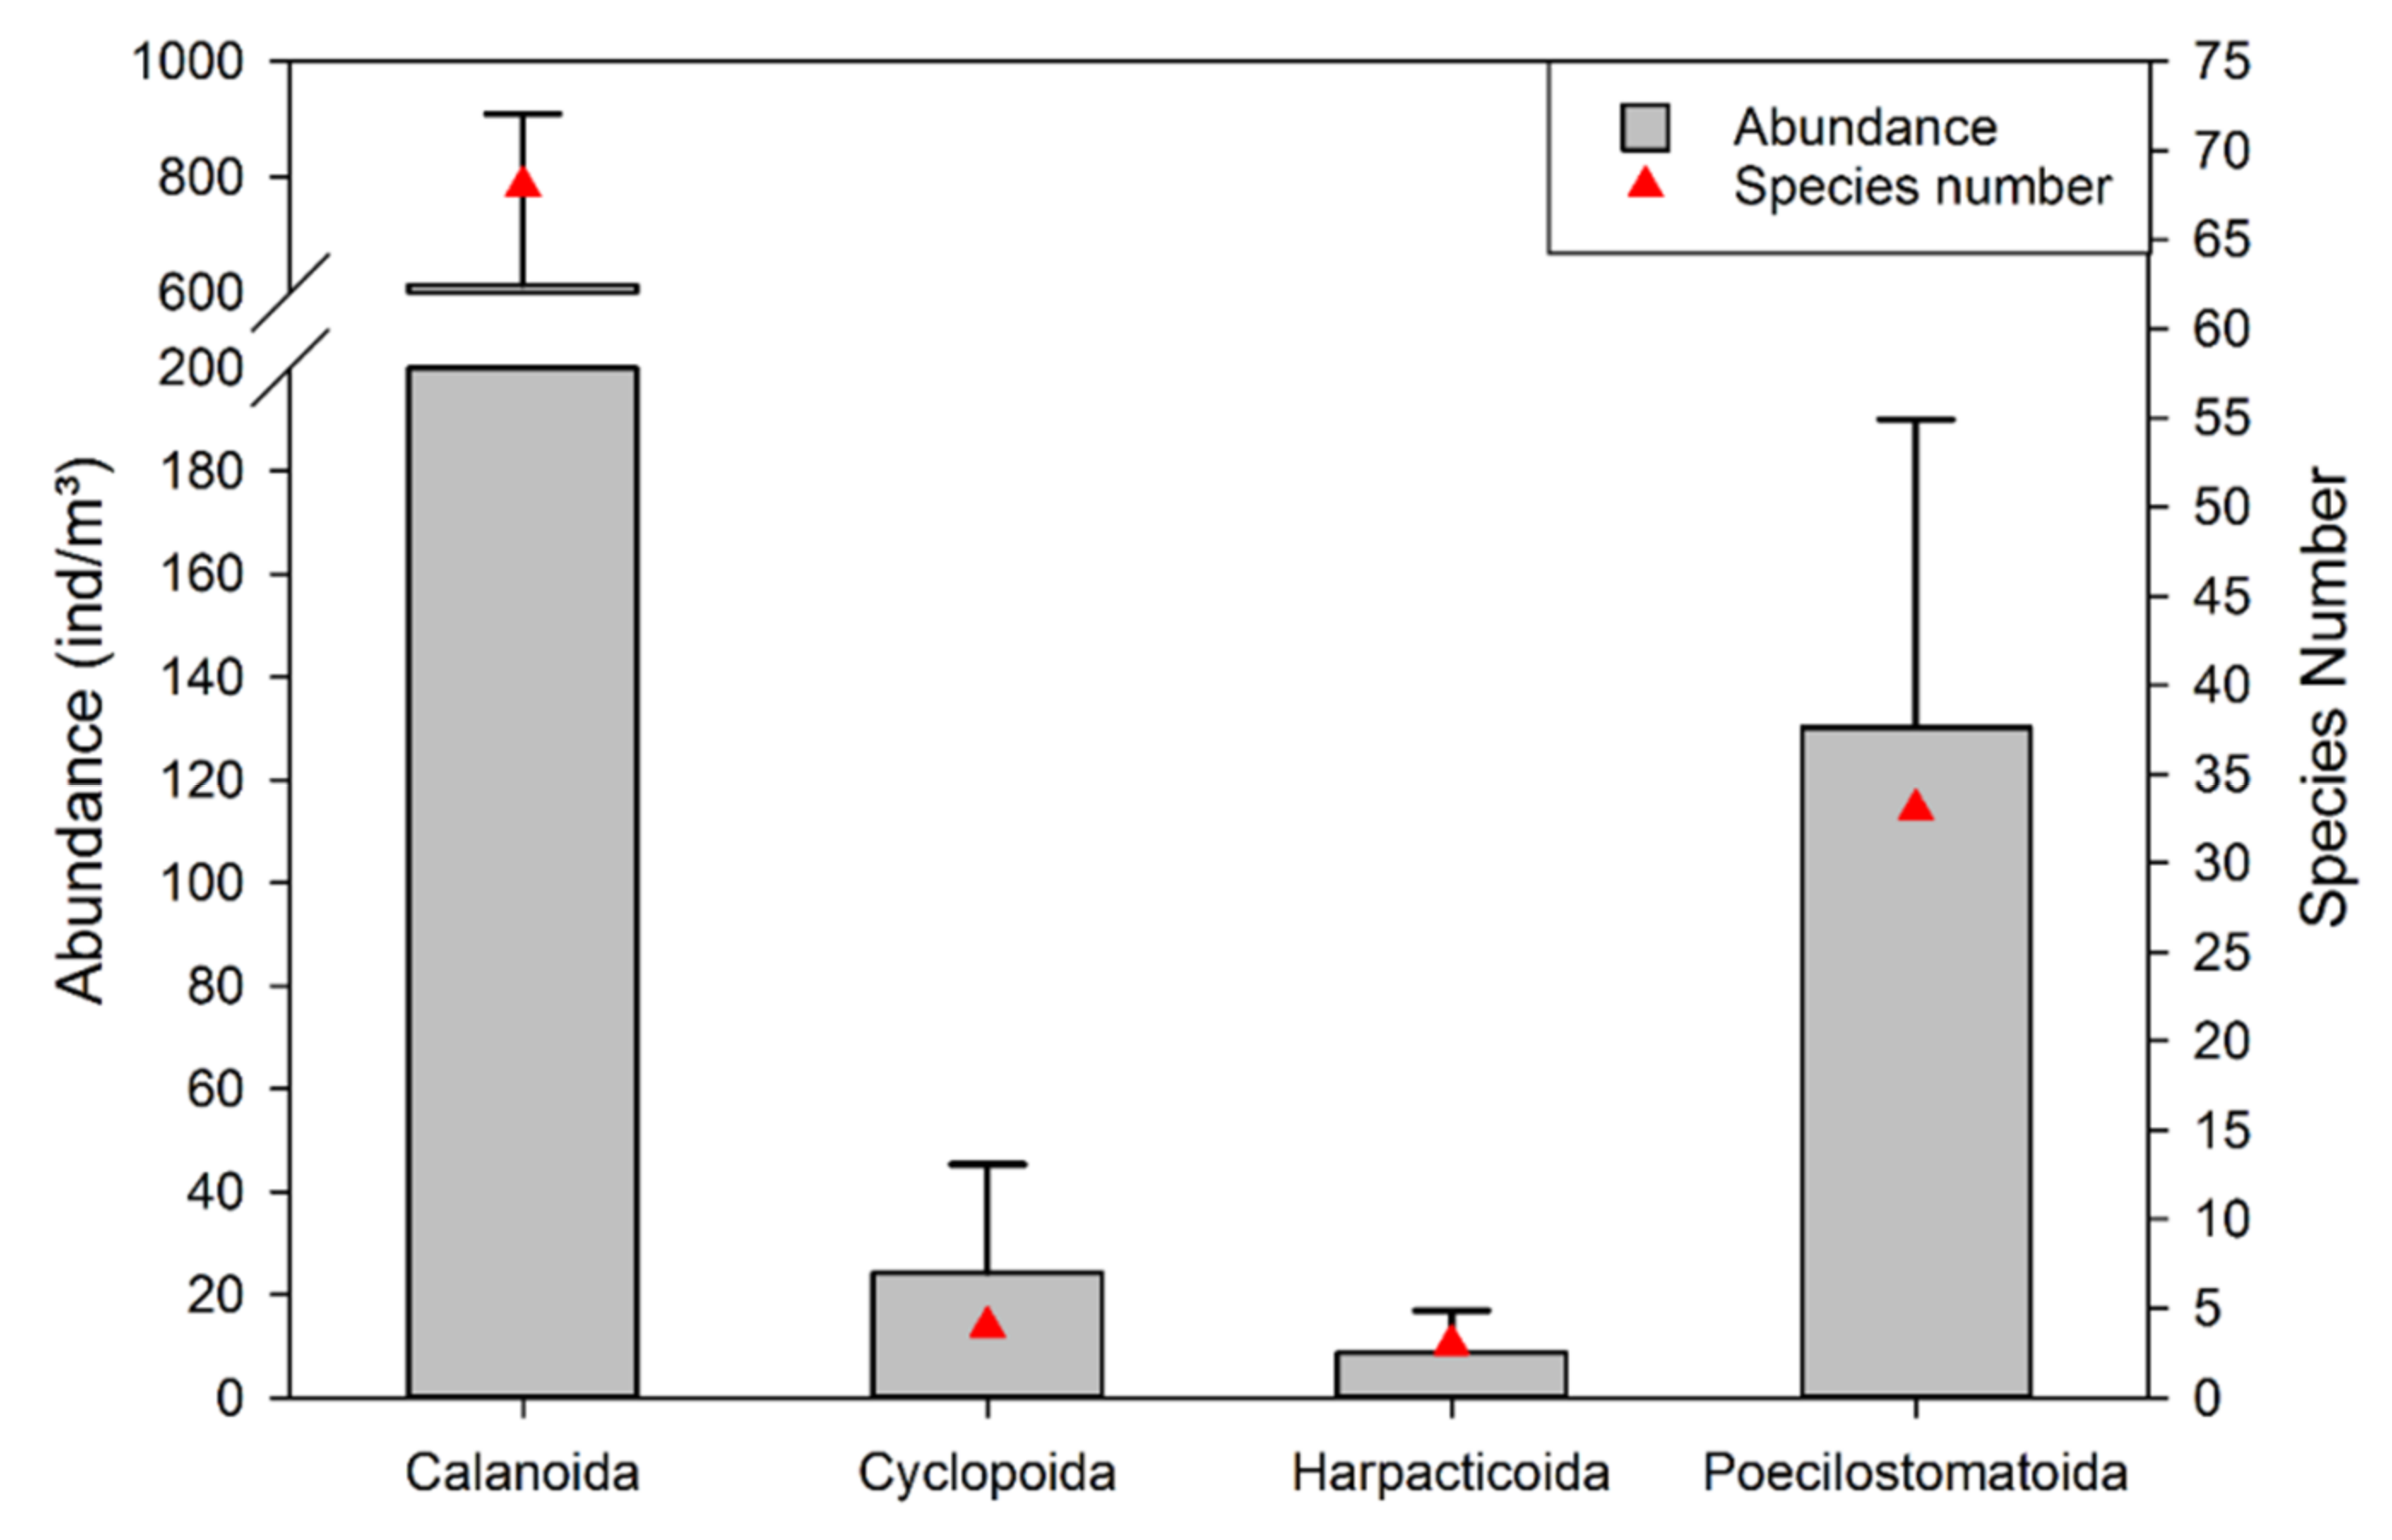
3.2. Species Composition and Spatial Characteristics of Copepod Communities

In total, 108 species were identified to species level, and 13 taxa were identified as copepodites. All species belonged to Calanoida, Cyclopoida, Harpacticoida, and Poecilostomatoida. As Figure 4 indicated, either in terms of species number or average abundance, calanoid species were most dominant; the average abundance of calanoids was 612.95 ± 296.27 (inds. m−3), with a total average abundance of 79.17% and 68 species accounting for 62.96% of the total species number. Poecilostomatoid species represented 30.56% of the total species number with an average abundance of 130.22 ± 59.81 (inds. m−3), which accounted for 16.82% of the total average abundance. Both the species number and average abundance of Cyclopoida and Harpacticoida accounted for a relatively low percentage. The species number of Cyclopoida and Harpacticoida provided 6.48% of the total species number. The average abundance of Cyclopoida and Harpacticoida were 24.31 ± 20.98 and 8.70 ± 8.15 (inds. m−3), respectively, with a total of 4.01% of the total average abundance altogether.
Figure 5 shows the horizontal distribution characteristics of the pelagic copepod assemblage in the research area. The abundance was higher in the western inshore area than in the eastern offshore area. The highest abundance was recorded at the A16 station with 1510.19 (inds. m−3). This was followed by 1228.38 (inds. m−3) at A12 station, which was located nearby Keelung Island. Both at A16 and A12 stations, P. aculeatus was the most dominant species, with a relative abundance of 36.85% and 34.17%, respectively. The RA of calanoid copepodites was 20.03% and 10.51% at stations A16 and A12, respectively. The lowest abundance was found at the offshore A4 station with 279.08 (inds. m−3). Clausocalanus furcatus was the dominant species at this station, with a RA of 24.59%. This was followed by calanoid copepodites and Oithona plumifera, with RA 14.75% and 8.20%, respectively.

3.3. Dominant Species Composition and Community Indicator Species

During the period of our present study, total copepod abundance ranged from 279.08 to 1510.19 (ind.m−3) in the area investigated here. Mean abundance (MA), average relative abundance (RA), and occurrence rate (OR) of dominant species in the research area are shown in Table 1. Calanoid copepodites were the most dominant, with MA and average RA being 217.24 (ind.m−3) and 28.06%, respectively. The OR and RA of P. aculeatus were 88.00% and 18.44%, respectively. It was followed by C. furcatus with an OR of 96.00% and an average RA of only 4.80%.
Based on a cluster analysis of environmental factors (Figure 3), pelagic copepods were compared in different environments. The highest average abundance was recorded in group A with 952.51 ± 278.29 (inds. m−3) and 71 species. This was followed by 838.59 ± 238.18 (inds. m−3) in group B, where 93 species were identified. The average abundance was only 552.07 ± 246.31 (inds. m−3) in group C with 75 overall species. The results of one-way ANOVA showed that the average abundance was significantly different between groups C and B (p = 0.02). The difference between groups A and C was also significant (p = 0.007). There was no obvious difference between groups A and B. Using IndVal, we found eight species that were significantly associated with Group C. In group B, the indicator species were Paracandacia truncata, Oncaea clevei, P. aculeatus, Centropages furcatus and copepodities of Euchaeta sp. Particular indicator species were T. turbinata, Calanopia elliptica, C. pauper, Temora discaudata, Euchaeta concinna, Acartia pacifica, Macrosetella gracilis, Corycaeus speciosus and Paracalanus parvus in group A. The mean abundance and IndVal of indicator species are shown in Table 2. The horizontal distribution of the indicator species showed an extreme correlation with water masses in the research area (Supplementary Figures S5–S26).

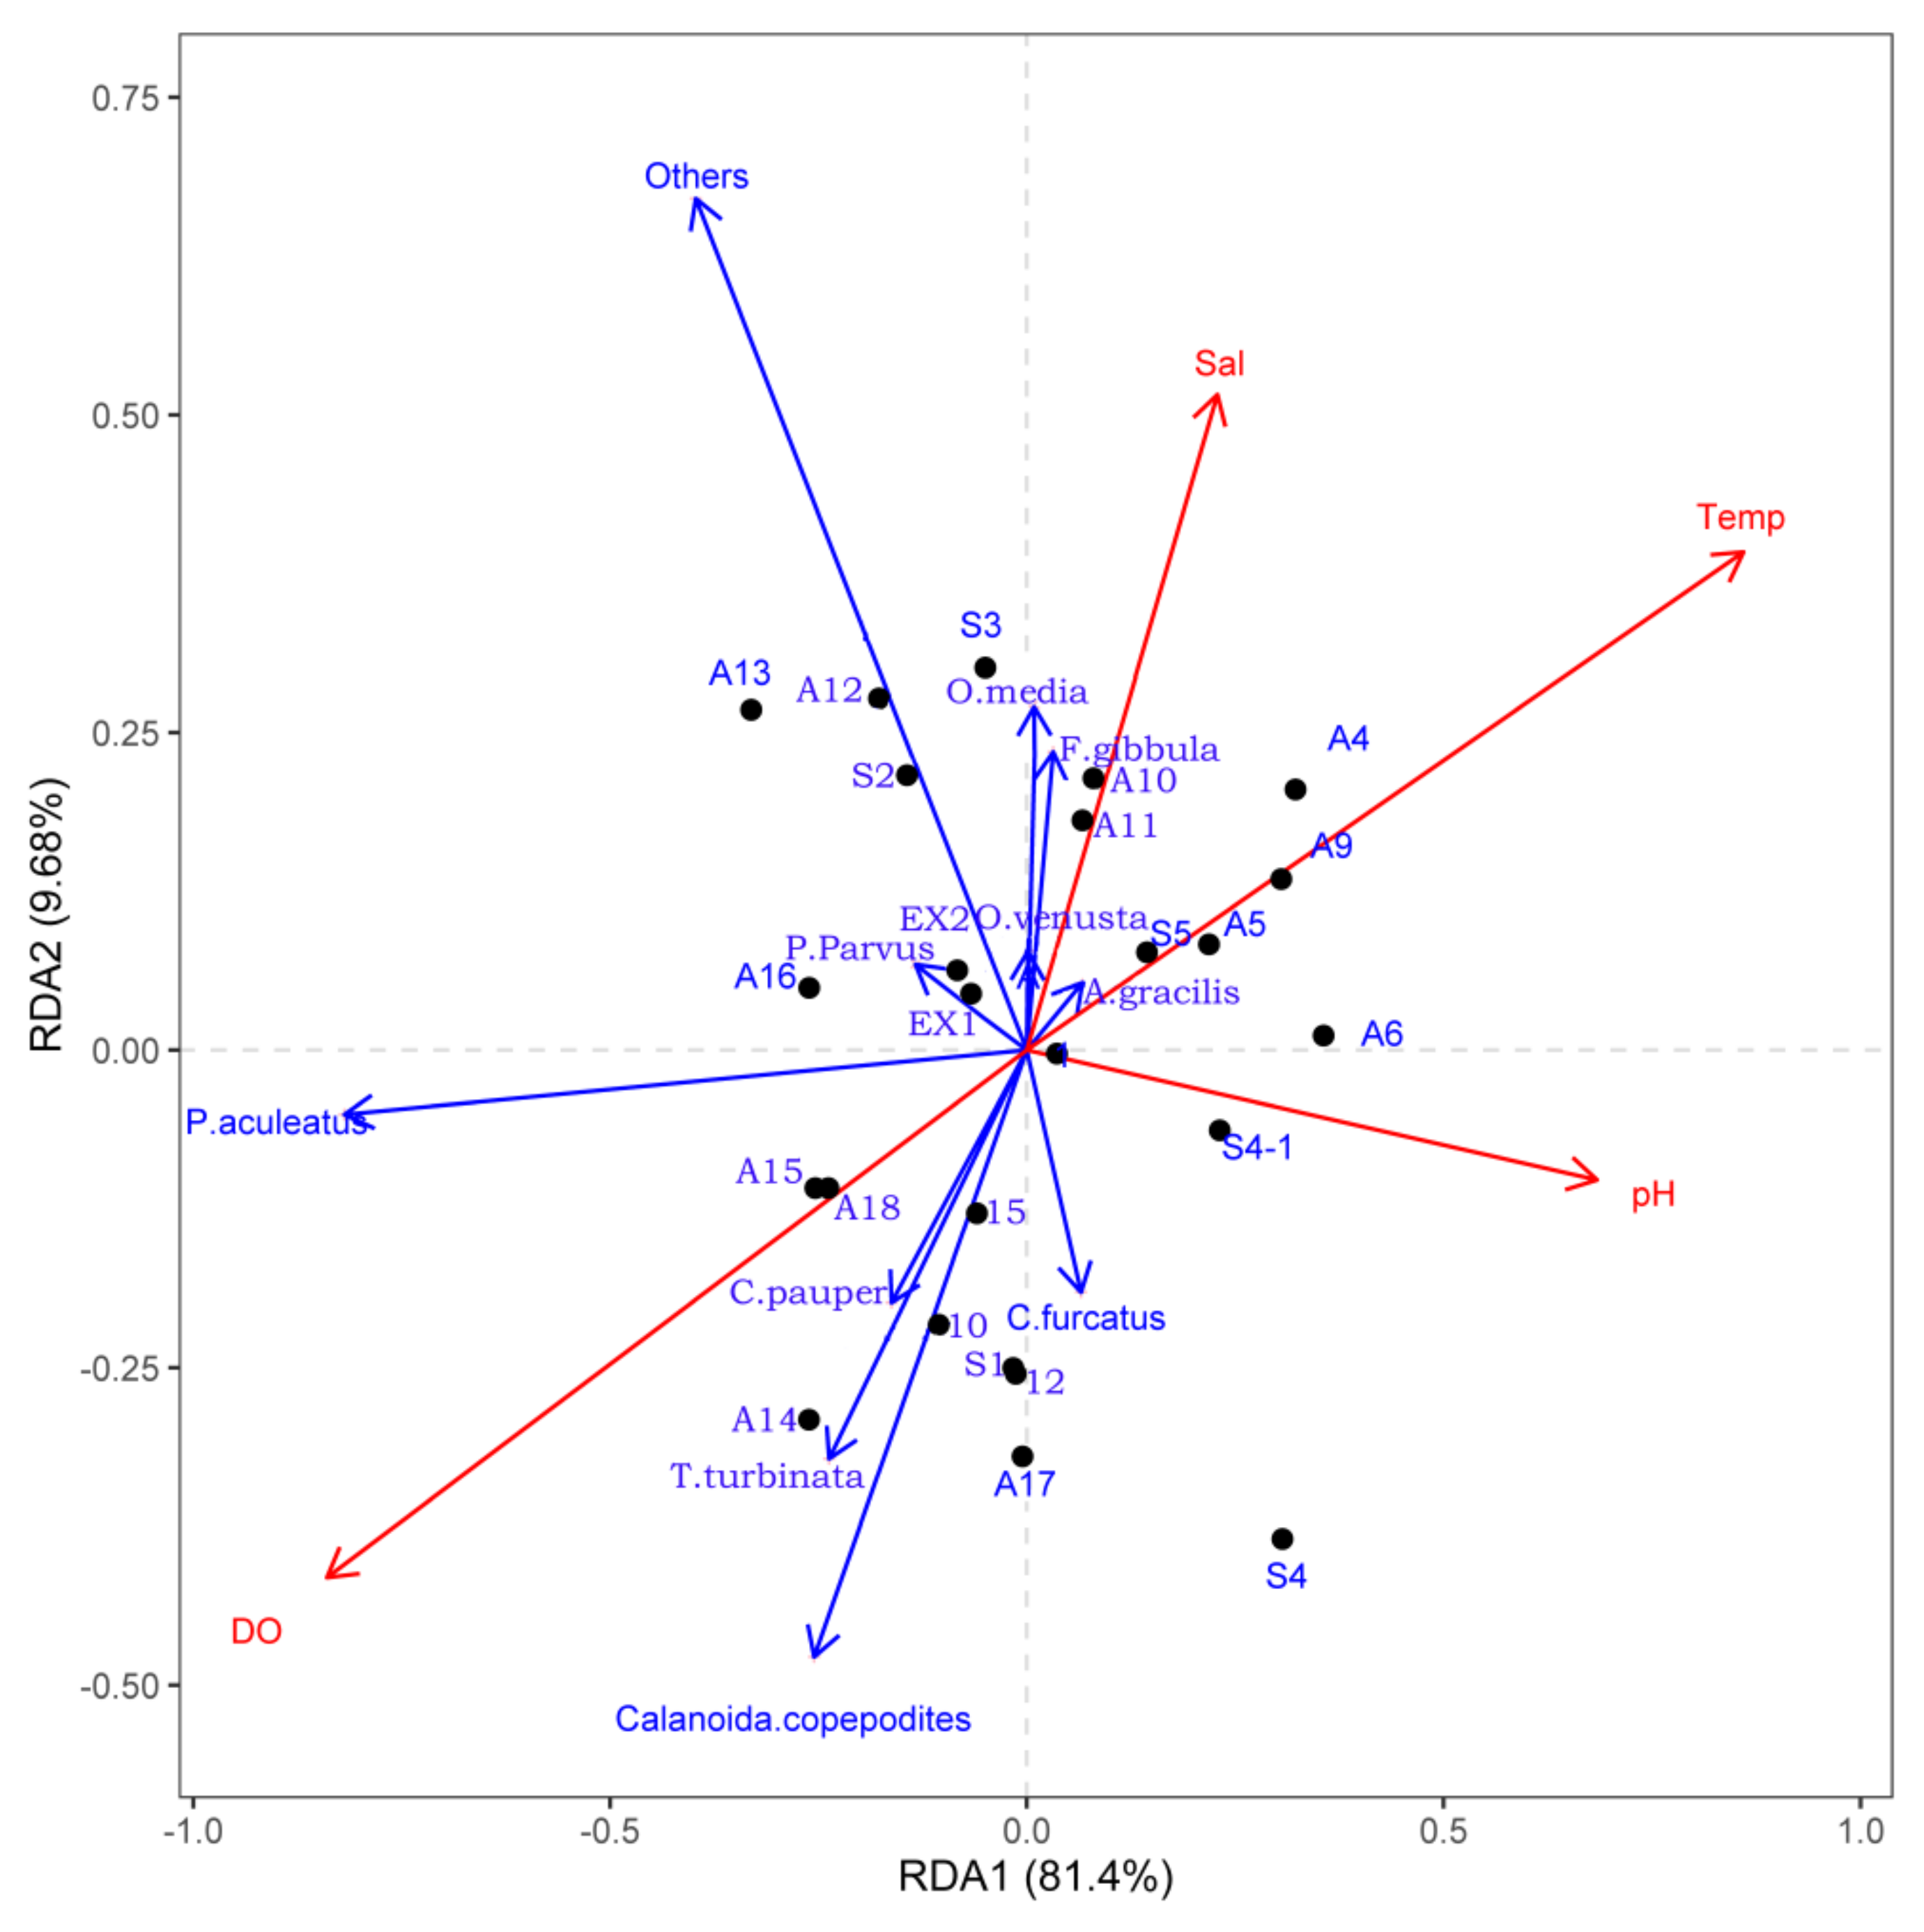
3.4. RDA Analysis of Dominant Species with Environmental Variables

Figure 6 shows the RDA ordinations of environmental factors with sampling sites and dominant species composition and distribution during this study. Stations of the offshore area were characterized by higher surface water temperature, salinity, and pH but with relatively lower dissolved oxygen. Paracalanus aculeatus, T. turbinata, and calanoid copepodites showed a positive correlation with dissolved oxygen and a negative correlation with surface water temperature, salinity, and pH during our research. Oncaea media and F. gibbula showed a slightly positive correlation with salinity.

4. Discussion

There is a year-round Taiwan Warm Current in the study area, which originates from the Taiwan Strait Current and Kuroshio intrusion across the slope of northeastern Taiwan [65,66]. Several studies also revealed that the current in the northeast of Taiwan was highly influenced by local wind forcing and the Ekman current induced by local wind forcing, which decayed substantially with increasing depth. The Ekman current was confined mainly to the upper 20 m, as confirmed by other studies [67,68,69]. During the northeast monsoon (September to April), northeasterly winds prevail, and the southward China Coastal Current brings cold surface waters from the Yellow Sea and the East China Sea into the northeast of Taiwan [70,71,72,73,74]. At the same time, the Kuroshio on-shelf intrusion was enhanced by the joint effect of baroclinicity and relief associated with winter cooling during the northeast monsoon period [33,40,75]. In the near-surface layer (0–2 m), the water temperature in I-Lan Bay was about 2 °C lower than the water temperature in the Kuroshio Current region [76]. Hsu et al. [76] proved that there was a significant thermal front outside I-Lan Bay, between the coastal or shelf waters from the northeast and Kuroshio Current based on data from drifters and shipboard acoustic Doppler current profiler information. Monthly moderate-resolution imaging spectroradiometer chlorophyll-a concentrations and attenuation coefficient at 490 nm data also proved the movement of water masses and ocean fronts and water masses in the research area [76]. During this research, the northeasterly wind prevailed; the southwestward cold water mass in the surface layer was strengthened with a surface water average temperature of 24.65 ± 1.53 (°C) in the research area. However, the average surface temperature of stations in the Kuroshio Current (KC) area was obviously higher than at Keelung Island and Kueishan Island. The chlorophyll-a concentration was 0.53 mg/m3 (winter) and 0.62 mg/m3 (autumn) in I-Lan Bay, but only 0.22 mg/m3 (winter) and 0.16 mg/m3 (autumn) in the KC area [76]. Higher chlorophyll-a concentration would expect more oxygen to be released by photosynthesis, which would lead to relatively higher dissolved oxygen levels in surface waters. In this study, the dissolved oxygen was obviously lower in the KC area than at Keelung Island and Kueishan Island. The average salinity and temperature were highest in the KC area compared to other areas in this study. Zhou et al. [77] reported that the KC is a salty, warm, and oligotrophic western boundary current of the North Pacific subtropical gyre.
In the marine environment, copepod abundance usually accounted for about 70% of the zooplankton communities [11]. Due to the short life span characteristics, the abundance of copepodites commonly accounts for 21–47% of the total zooplankton abundance and 59.77% to 90.82% of the total copepod abundance in field campaigns [78,79,80]. In the present study area, Wang et al. reported that the copepodites of the dominant species T. turbinata accounted for 27.29% to 60.30% of the total Temora abundance throughout the year [56]. In the present study, calanoid copepodites represented the most dominant group, which accounted for 28.06% of the total average copepod abundance with an OR of 100%. With the exception of calanoid copepodites, the dominant species composition coincided with previous research results in the research area [8,12,52,55].
Zooplankton distributions can be patchy due to multiple physical, chemical, and biological processes. Anandavelu [81] pointed out that the heterogeneous distribution of copepods along tropical coastal waters was attributed to the riverine influx and other environmental conditions. In the present research, surface water temperature, dissolved oxygen, and pH values were the main environmental factors that affected the spatial distribution of copepods. The heterogeneous distribution was obviously associated with different water masses in the research area. Paracalanus aculeatus, which was considered a warm water epipelagic species, was reported as an indicator species of the KC in the research area [48]. In the present study, P. aculeatus was mainly obtained in the mixed water area around Kueishan Island. Stations around Keelung Island were controlled by northeast monsoon-derived water masses characterized by the following indicator species: T. turbinata, C. elliptica, and C. pauper. The meso-epipelagic T. turbinata, which was the dominant species in the research area, is considered an indicator species of warm water masses and is widely distributed in tropical, subtropical, and temperate areas [35,50,56,82]. Tseng et al. [82] demonstrated that C. elliptica significantly and negatively correlated with seawater temperature. Previous research also reported that C. pauper is a warm-water species common around the island of Taiwan [82,83]. Copilia mirabilis is known for its tropical affinity, being considered a significant indicator species of El Niño in the Gulf of California [84,85]. In the present research, C. mirabilis was mainly found in the oceanic area with an IndVal of 92.01%. This high value was supported by previous studies [85,86,87].
In the future ocean, copepod populations will be more strongly affected by warming rather than by acidification. However, ocean acidification effects can modify some temperature impacts, such as ocean acidification and water warming antagonistically will impact the copepod body size and the nutritional composition [88]. Low pH could reduce the reproductive traits of copepods, such as egg size, egg production rate, hatching success, and naupliar production [89,90]. The egg production rate of copepods significantly increases with increased temperature at relatively higher pH values but significantly decreases with increased temperatures at relatively lower pH values [91]. DNA damage could be elevated after long-term exposure to lower pH and then elevates copepod mortality [92]. A negative response was also observed in this research, such as in the dominant species P. parvus, T. turbinata, and other copepods. Other dominant species did not show a correlation with pH values in this study. During this research, surface waters were mainly dominated by northeast monsoon-derived water masses, Kuroshio intrusion water masses, and mixed water masses in the northeast of Taiwan. These three water masses could be easily distinguished based on temperature, dissolved oxygen, and pH. Bio-indicator species were T. turbinata, C. elliptica, and C. pauper for the northeast monsoon-derived water masses. Farranula concinna and C. mirabilis were suitable indicators for Kuroshio intrusion water masses in the research area. In the mixed water masses, the indicator species were P. truncata, O. clevei, and P. aculeatus. Calanoid copepodites represented the most abundant group in this study. The horizontal distribution of all indicator species showed a significantly heterogeneous pattern, which was in accordance with water mass distribution in the research area during this research. Apart from calanoid copepodites, the dominant species were P. aculeatus, C. furcatus, C. pauper, Oncaea venusta, Acrocalanus gracilis, P. parvus, T. turbinata, Farranula gibbula, and Oncaea media. Among these species, P. parvus and T. turbinata were more sensitive than other dominant species to pH value variation in the research area. Surface water temperature and salinity were the main factors that influenced the abundance and distribution of P. aculeatus, C. pauper, P. parvus, and T. turbinata.

5. Conclusions

Our results support the two hypotheses of this study: (1) the interaction between the eastern seawater and the Kuroshio water in the northeastern waters of Taiwan during the period when the northeast monsoon prevailed, resulting in the observed geographic distribution of planktonic copepods; (2) the environmental factors, temperature, and salinity, affected the composition and abundance of the dominant species. The results of the present study demonstrated that the distribution of indicator species could provide a suitable indicator of changes in water masses. The surface water temperature and dissolved oxygen were the main environmental factors affecting the dominant copepod species composition and distribution in the waters of northern Taiwan.

Supplementary Materials

The following supporting information can be downloaded at: https://www.mdpi.com/article/10.3390/biology11091357/s1, Figure S1: Horizontal distribution of surface water temperature in the research area during our research; Figure S2: Horizontal distribution of surface water salinity in the research area during our research; Figure S3: Horizontal distribution of surface water pH in the research area during our research; Figure S4: Horizontal distribution of surface water dissolved oxygen in the research area during our research; Figure S5: Distribution of Acartia pacifica in the research area during our research; Figure S6: Distribution of Acrocalanus monachus in the research area during our research; Figure S7: Distribution of Calanopia elliptica in the research area during our research; Figure S8: Distribution of Candacia aethiopica in the research area during our research; Figure S9: Distribution of Candacia copepodites in research area during our research; Figure S10: Distribution of Canthocalanus pauper in the research area during our research; Figure S11: Distribution of Centropages calaninus in the research area during our research; Figure S12: Distribution of Centropages furcatus in the research area during our research; Figure S13: Distribution of Copilia mirabilis in the research area during our research; Figure S14: Distribution of Corycaeus agilis in the research area during our research; Figure S15. Distribution of Corycaeus speciosus in the research area during our research; Figure S16: Distribution of the Euchaeta concinna in the research area during our research; Figure S17: Distribution of the Euchaeta copepodites in the research area during our research; Figure S18: Distribution of Farranula concinna in the research area during our research; Figure S19: Distribution of Farranula gibbula in the research area during our research; Figure S20: Distribution of Macrosetella gracilis in the research area during our research; Figure S21: Distribution of Oncaea clevei in the research area during our research; Figure S22: Distribution of Paracalanus aculeatus in the research area during our research; Figure S23: Distribution of Paracalanus parvus in the research area during our research; Figure S24: Distribution of Paracandacia truncata in the research area during our research; Figure S25: Distribution of Temora discaudata in the research area during our research; Figure S26: Distribution of Temora turbinata in the research area during our research.

Author Contributions

Conceptualization and methodology, Y.-G.W. and J.-S.H.; software, Y.-G.W., C.-G.W., P.X. and L.-C.T.; validation, R.-X.S. and X.-Y.C.; formal analysis, Y.-G.W. and L.-C.T.; investigation, Y.-G.W.; resources, Y.-G.W. and J.-S.H.; data curation, Y.-G.W.; writing—original draft preparation, Y.-G.W.; writing—review and editing, L.-C.T.; visualization, L.-C.T. and B.-P.X.; supervision, B.-P.X.; project administration, J.-S.H.; funding acquisition, J.-S.H. All authors have read and agreed to the published version of the manuscript.

Funding

Financial support from the National Science and Technology Council (NSTC) of Taiwan through grant no. MOST 106-2621-M-019-001, MOST 107-2621-M-019-001, MOST 108-2621-M-019-003, MOST 109-2621-M-019-002, MOST 110-2621-M-019-001 and MOST 111-2621-M-019-001; and Center of Excellence for Ocean Engineering (Grant No. 109J 13801-51, 110J13801-51, 111J13801-51) to J.-S.H. This work was financial supported by the Scientific Research Foundation of the Third Institute of Oceanography, MNR, No.2017010 and No. 2017009, and the Bilateral Cooperation of Maritime Affairs and the Marine Biological Sample Museum (GASI-02-YPK-SW) to Y.-G.W. And grant no. MOST 109-2811-M-019-504, MOST 110-2811-M-019-504, and MOST 111-2811-M-019-003 to L.-C.T. The funders had no role on study design, data collection and analysis, decision to publish, or preparation of the manuscript.

Institutional Review Board Statement

Not applicable.

Informed Consent Statement

Not applicable.

Data Availability Statement

Not applicable.

Acknowledgments

The authors are grateful to members of J.-S. Hwang’s laboratory for their assistance during the field works during cruises to the waters off northeastern Taiwan.

Conflicts of Interest

The authors declare no conflict of interest.

References

  1. Uriarte, I.; Villate, F. Effects of pollution on zooplankton abundance and distribution in two estuaries of the Basque coast (Bay of Biscay). Mar. Pollut. Bull. 2004, 49, 220–228. [Google Scholar] [CrossRef] [PubMed]
  2. Hafferssas, A.; Seridji, R. Relationships between the hydrodynamics and changes in copepod structure on the Algerian coast. Zool. Stud. 2010, 49, 353–366. [Google Scholar]
  3. Drira, Z.; Kmiha-Megdiche, S.; Sahnoun, H.; Pagano, M.; Tedetti, M.; Ayadi, H. Water quality affects the structure of copepod assemblages in the Sfax Southern coast (Tunisia, Southern Mediterranean Sea). Mar. Freshw. Res. 2017, 69, 220–231. [Google Scholar] [CrossRef]
  4. Drira, Z.; Kmiha-Megdiche, S.; Sahnoun, H.; Tedetti, M.; Pagano, M.; Ayadi, H. Copepod assemblages as a bioindicator of environmental quality in three coastal areas under contrasted anthropogenic inputs (Gulf of Gabes, Tunisia). J. Mar. Biol. Assoc. UK 2017, 98, 1–17. [Google Scholar] [CrossRef]
  5. Yoshida, T.; Liong, C.; Majid, A.M.; Toda, T.; Ross, B.H. Temperature effects on the egg development time and hatching success of three Acartia species (Copepoda: Calanoida) from the Strait of Malacca Teruaki. Zool. Stud. 2012, 51, 644–654. [Google Scholar]
  6. Sommer, U.; Paul, C.; Moustaka, G. Warming and ocean acidification effects on phytoplankton from species shifts to size shifts within species in a mesocosm experiment. PLoS ONE 2015, 10, 17. [Google Scholar]
  7. Bhattacharya, B.D.; Bhattacharya, A.; Rakshit, D.; Sarkar, S.K. Impact of the tropical cyclonic storm ‘Aila’ on the water quality characteristics and mesozooplankton community structure of Sundarban mangrove wetland. Indian J. Geo-Mar. Sci. 2014, 43, 216–223. [Google Scholar]
  8. Zheng, Z. Marine Planktology; China Ocean Press: Beijing, China, 1989. [Google Scholar]
  9. Uye, S.; Nagano, N.; Tamaki, T. Geographical and seasonal variations in abundance, biomass and estimated production rates of microzooplankton in the Inland Sea of Japan. J. Oceanogr. 1996, 52, 689–703. [Google Scholar] [CrossRef]
  10. Tseng, L.C.; Hung, J.J.; Chen, Q.C.; Hwang, J.S. Seasonality of the copepod assemblages associated with interplay waters off northeastern Taiwan. Helgol. Mar. Res. 2013, 67, 507–520. [Google Scholar] [CrossRef]
  11. Longhurst, A.R. Relationship between diversity and the vertical structure of the upper ocean. Deep. Sea Res. Part A Oceanogr. Res. Pap. 1985, 32, 1535–1570. [Google Scholar] [CrossRef]
  12. Kâ, S.; Hwang, J.S. Mesozooplankton distribution and composition on the northeastern coast of Taiwan during autumn: Effects of the Kuroshio Current and hydrothermal vents. Zool. Stud. 2011, 50, 155–163. [Google Scholar]
  13. Yasuhara, M.; Hunt, G.; Dowsett, H.J.; Robinson, M.M.; Stoll, D.K. Latitudinal species diversity gradient of marine zooplankton for the last three million years. Ecol. Lett. 2012, 15, 1174–1179. [Google Scholar] [CrossRef]
  14. Pepin, P.; Johnson, C.L.; Harvey, M.; Casault, B.; Joel, C.; Colbourne, E.B.; Galbraith, P.S.; Hebert, D.; Lazin, G.; Maillet, G. A multivariate evaluation of environmental effects on zooplankton community structure in the western North Atlantic. Prog. Oceanogr. 2015, 134, 197–220. [Google Scholar] [CrossRef]
  15. Erondu, C.J.; Solomon, R.J. Identification of planktons (zooplankton and phytoplankton) behind Girls’ Hostel University of Abuja, Nigeria. Direct Res. J. Public Health Environ. Technol. 2017, 2, 21–29. [Google Scholar]
  16. Nakajima, R.; Yamazaki, H.; Lewis, L.S.; Khen, A.; Smith, J.E.; Nakatomi, N.; Kurihara, H. Planktonic trophic structure in a coral reef ecosystem—Grazing versus microbial food webs and the production of mesozooplankton. Prog. Oceanogr. 2017, 156, 104–120. [Google Scholar] [CrossRef]
  17. Richardson, A.J. In hot water: Zooplankton and climate change. ICES J. Mar. Sci. 2008, 3, 279–295. [Google Scholar] [CrossRef] [Green Version]
  18. Hwang, J.S.; Souissi, S.; Dahms, H.U.; Tseng, L.C.; Schmitt, F.G.; Chen, Q.C. Rank-abundance allocations as a tool to analyze planktonic copepod assemblages off the Danshuei estuary (Taiwan). Zool. Stud. 2009, 48, 49–62. [Google Scholar]
  19. Dam, H.G. Evolutionary adaptation of marine zooplankton to global change. Annu. Rev. Mar. Sci. 2013, 5, 349–370. [Google Scholar] [CrossRef]
  20. Wang, Y.G.; Tseng, L.C.; Lin, M.; Hwang, J.S. Vertical and geographic distribution of copepod communities at late summer in the Amerasian Basin, Arctic Ocean. PLoS ONE 2019, 14, e0219319. [Google Scholar] [CrossRef]
  21. Kusk, K.O.; Wollenberger, L. Towards an internationally harmonized test method for reproductive and developmental effects of endocrine disrupters in marine copepods. Ecotoxicology 2007, 16, 183–195. [Google Scholar] [CrossRef]
  22. Raisuddin, S.; Kwok, K.W.H.; Leung, K.M.Y.; Schlenk, D.; Lee, J.S. The copepod Tigriopus: A promising marine model organism for ecotoxicology and environmental genomics. Aquat. Toxicol. 2007, 83, 161–173. [Google Scholar] [CrossRef]
  23. Daufresne, M.; Lengfellner, K.; Sommer, U. Global warming benefits the small in aquatic ecosystems. Proc. Natl. Acad. Sci. USA 2009, 106, 12788–12793. [Google Scholar] [CrossRef]
  24. Murphy, E.J.; Hofmann, E.E.; Watkins, J.L.; Johnston, N.M.; Piñones, A.; Ballerini, T.; Hill, S.L.; Trathan, P.N.; Tarling, G.A.; Cavanagh, R.A. Comparison of the structure and function of Southern Ocean regional ecosystems: The Antarctic Peninsula and South Georgia. J. Mar. Syst. 2013, 109–110, 22–42. [Google Scholar] [CrossRef]
  25. Darnis, G.; Fortier, L. Temperature, food and the seasonal vertical migration of key arctic copepods in the thermally stratified Amundsen Gulf (Beaufort Sea, Arctic Ocean). J. Plankton Res. 2014, 36, 1092–1108. [Google Scholar] [CrossRef]
  26. Bedford, J.; Ostle, C.; Johns, D.G.; Atkinson, A.; Best, M.; Bresnan, E.; Machairopoulou, M.; Graves, C.A.; Devlin, M.; Milligan, A.; et al. Lifeform indicators reveal large-scale shifts in plankton across the North-West European shelf. Glob. Change Biol. 2020, 26, 3482–3497. [Google Scholar] [CrossRef]
  27. Morse, R.E.; Friedland, K.D.; Tommasi, D.; Stock, C.; Nye, J. Distinct zooplankton regime shift patterns across ecoregions of the US Northeast Continental shelf Large Marine Ecosystem. J. Mar. Syst. 2017, 165, 77–91. [Google Scholar] [CrossRef]
  28. Ivory, J.A.; Steinberg, D.K.; Latour, R.J. Diel, seasonal, and interannual patterns in mesozooplankton abundance in the Sargasso Sea. ICES J. Mar. Sci. 2019, 76, 217–231. [Google Scholar] [CrossRef] [Green Version]
  29. Bode, A.; Álvarez, M.; García, L.M.; Louro, M.A.; Nieto-Cid, M.; Ruíz-Villarreal, M.; Varela, M.M. Climate and local hydrography underlie recent regime shifts in plankton communities off Galicia (NW Spain). Oceans 2020, 1, 181–197. [Google Scholar] [CrossRef]
  30. Villarino, E.; Irigoien, X.; Villate, F.; Iriarte, A.; Uriarte, I.; Zervoudaki, S.; Carstensen, J.; O’Brien, T.D.; Chust, G. Response of copepod communities to ocean warming in three time-series across the North Atlantic and Mediterranean Sea. Mar. Ecol. Prog. Ser. 2020, 636, 47–61. [Google Scholar] [CrossRef]
  31. Iriarte, A.; Villate, F.; Uriarte, I.; Bidegain, G.; Barroeta, Z. Shifts in neritic copepod communities off the Basque coast (Southeastern Bay of Biscay) between 1998 and 2005. ICES J. Mar. Sci. 2022, 79, 830–843. [Google Scholar] [CrossRef]
  32. Liu, H.; Bi, H.; Peterson, W.T. Large-scale forcing of environmental conditions on subarctic copepods in the northern California Current system. Prog. Oceanogr. 2015, 134, 404–412. [Google Scholar] [CrossRef]
  33. Liu, X.H.; Wang, D.P.; Su, J.; Chen, D.K.; Lian, T.; Dong, C.M.; Liu, T.Y. On the vorticity balance over steep sloops: Kuroshio intrusions Northeast of Taiwan. J. Phys. Oceanogr. 2020, 50, 2089–2104. [Google Scholar] [CrossRef]
  34. Hwang, J.S.; Wong, C.K. The China Coastal Current as a driving force for transporting Calanus sinicus (Copepoda: Calanoida) from its population centers to waters off Taiwan and Hong Kong during the winter northeast monsoon period. J. Plankton Res. 2005, 27, 205–210. [Google Scholar] [CrossRef]
  35. Tseng, L.C.; Kumar, R.; Dahms, H.U.; Chen, Q.C.; Hwang, J.S. Monsoon-driven succession of copepod assemblages in the coastal waters of the Northeastern Taiwan Strait. Zool. Stud. 2008, 47, 46–60. [Google Scholar]
  36. Bi, H.S.; Peterson, W.T.; Strub, P.T. Transport and coastal zooplankton communities in the northern California Current system. Geophys. Res. Lett. 2011, 38, L12607. [Google Scholar] [CrossRef]
  37. Liu, H.; Peterson, W.T. Seasonal and inter-annual variations in the abundance and biomass of Neocalanus plumchrus in continental slope waters off Oregon. Fish. Oceanogr. 2010, 19, 354–369. [Google Scholar] [CrossRef]
  38. Tang, T.Y.; Tai, J.H.; Yang, Y.J. The flow pattern north of Taiwan and the migration of the Kuroshio. Cont. Shelf Res. 2000, 20, 349–371. [Google Scholar] [CrossRef]
  39. Isobe, A. Recent advances in ocean-circulation research on the Yellow Sea and East China Sea shelves. J. Oceanogr. 2008, 64, 569–584. [Google Scholar] [CrossRef]
  40. Oey, L.Y.; Hsin, Y.C.; Wu, C.R. Why does the Kuroshio northeast of Taiwan shift shelfward in winter? Ocean Dynam. 2010, 60, 413–426. [Google Scholar] [CrossRef]
  41. Hsin, Y.C.; Qiu, B.; Chiang, T.L.; Wu, C.R. Seasonal to interannual variations in the intensity and central position of the surface Kuroshio east of Taiwan. J. Geophys. Res. Oceans 2013, 118, 4305–4316. [Google Scholar] [CrossRef]
  42. Yin, Y.; Lin, X.; Li, Y.; Zeng, X. Seasonal variability of Kuroshio intrusion northeast of Taiwan Island as revealed by self-organizing map. Chin. J. Oceanol. Limnol. 2014, 32, 1435–1442. [Google Scholar] [CrossRef]
  43. Wu, C.R.; Wang, Y.L.; Lin, Y.F.; Chao, S.Y. Intrusion of the Kuroshio into the South and East China Seas. Sci. Rep. 2017, 7, 7895. [Google Scholar] [CrossRef]
  44. Yin, W.B.; Huang, D.J. Short-term variations in the surface upwelling off northeastern Taiwan observed via satellite data. J. Geophys. Res. Oceans 2019, 124, 939–954. [Google Scholar] [CrossRef]
  45. Yin, Y.Q.; Liu, Z.; Hu, P.; Hou, Y.J.; Lu, J.Y.; He, Y.S. Impact of mesoscale eddies on the southwestward countercurrent northeast of Taiwan revealed by ADCP mooring observations. Cont. Shelf. Res. 2020, 195, 104063. [Google Scholar] [CrossRef]
  46. Zhang, Y.S.; Yu, F.; Si, G.C.; Wang, J.F. Characteristics and maintenance mechanisms of the cold eddy to the Northeast of Diaoyu Island. Reg. Stud. Mar. Sci. 2020, 36, 101259. [Google Scholar] [CrossRef]
  47. Chen, Y.L.; Chen, H.Y.; Jan, S.; Tuo, S.H. Phytoplankton productivity enhancement and assemblage change in the upstream Kuroshio after typhoon. Mar. Ecol. Prog. Ser. 2009, 385, 111–126. [Google Scholar] [CrossRef]
  48. Hwang, J.S.; Souissi, S.; Tseng, L.J.; Seuront, L.; Schmitt, F.G.; Fang, L.S.; Peng, S.H.; Wu, C.H.; Hsiao, S.H.; Twan, W.H.; et al. A 5-year study for the influence of the northeast and southwest monsoons on copepod assemblages in the boundary coastal waters between the East China Sea and the Taiwan Strait. J. Plankton Res. 2006, 28, 943–958. [Google Scholar] [CrossRef]
  49. Hwang, J.S.; Kumar, R.; Hsieh, C.W.; Kuo, A.Y.; Souissi, S.; Hsu, M.H.; Wu, J.T.; Liu, W.; Wang, C.F.; Chen, Q.C. Patterns of zooplankton distribution along the marine, estuarine and riverine portions of the Danshuei ecosystem in northern Taiwan. Zool. Stud. 2010, 49, 335–352. [Google Scholar]
  50. Dur, G.; Hwang, J.S.; Souissi, S.; Tseng, L.C.; Wu, C.H.; Hsiao, S.H.; Chen, Q.C. An overview of the influence of hydrodynamics on the spatial and temporal patterns of calanoid copepod communities around Taiwan. J. Plankton Res. 2007, 29 (Suppl. S1), 97–116. [Google Scholar] [CrossRef] [Green Version]
  51. Tseng, L.C.; Kumar, R.; Chen, Q.C.; Hwang, J.S. Faunal shift between two copepod congeners (Temora discaudata and T. turbinata) in the vicinity of two nuclear power plants in southern East China Sea: Spatiotemporal patterns of population trajectories over a decade. Hydrobiologia 2011, 666, 301–315. [Google Scholar] [CrossRef]
  52. Hsieh, H.; Lo, W.Z. Mesoscale distribution and assemblage structure of fish larvae in the Kuroshio waters off eastern Taiwan. Mar. Biodiv. 2019, 49, 1971–1986. [Google Scholar] [CrossRef]
  53. Shih, C.T.; Chiu, T.S. Copepod diversity in the water masses of the southern East China Sea north of Taiwan. J. Mar. Syst. 1998, 15, 533–542. [Google Scholar] [CrossRef]
  54. Shih, C.T.; Hwang, J.S.; Huang, W.B. Planktonic copepods from an upwelling station north of Taiwan, western North Pacific. J. Taiwan Mus. 2000, 10, 19–35. [Google Scholar]
  55. Lee, C.Y.; Liu, D.C.; Su, W.C. Seasonal and spatial variations in the planktonic copepod community of I-Lan Bay and adjacent Kuroshio waters off Northeast Taiwan. Zool. Stud. 2009, 48, 151–161. [Google Scholar]
  56. Wang, Y.G.; Tseng, L.C.; Xing, B.P.; Sun, R.X.; Chen, X.Y.; Wang, C.G.; Hwang, J.S. Seasonal population structure of the copepod Temora turbinata (Dana, 1849) in the Kuroshio Current edge, Southeastern East China Sea. Appl. Sci. 2021, 11, 7545. [Google Scholar] [CrossRef]
  57. Chen, Q.C.; Zhang, S.Z. The planktonic copepods of the Yellow Sea and the East China Sea. I. Calanoida. Studia Mar. Sin. 1965, 7, 20–131, (In Chinese with English Summary). [Google Scholar]
  58. Chen, Q.C. Zooplankton of China Seas; Science Press: Beijing, China, 1992; Volume 1, pp. 1–87. ISBN 7-03-002599-7. [Google Scholar]
  59. Chihara, M.; Murano, M. An Illustrated Guide to Marine Plankton in Japan; Tokai University Press: Tokyo, Japan, 1997; pp. 1–1000. [Google Scholar]
  60. Lian, G.S.; Wang, Y.G.; Sun, R.X.; Hwang, J.S. Species Diversity of Marine Planktonic Copepods in China’s Seas; China Ocean Press: Beijing, China, 2019; p. 868. [Google Scholar]
  61. Oksanen, J.; Guillaume Blanchet, F.; Friendly, M.; Kindt, R.; Legendre, P.; McGlinn, D.; Peter, R.; Minchin, R.B.; O’Hara, G.; Simpson, L.; et al. Vegan: Community Ecology Package. R Package Version 2.5-7. 2020. Available online: https://CRAN.R-project.org/package=vegan (accessed on 25 August 2022).
  62. Simberloff, D.A. Flagships, umbrellas, and keystones: Is single-species management pass in the landscape era. Biol. Conserv. 1998, 83, 247–257. [Google Scholar] [CrossRef]
  63. Lindenmayer, D.B.; Margules, C.R.; Botkin, D.B. Indicators of forest sustainability biodiversity: The selection of forest indicator species. Conserv. Biol. 2000, 14, 941–950. [Google Scholar] [CrossRef]
  64. Dufrene, M.; Legendre, P. Species assemblages and indicator species: The need for a flexible asymmetrical approach. Ecol. Monogr. 1997, 67, 345–366. [Google Scholar] [CrossRef]
  65. Guan, B.X.; Fang, G.H. Winter counter-wind currents off the Southeastern China coast: A review. J. Oceanogr. 2006, 62, 1–24. [Google Scholar] [CrossRef]
  66. Liu, Z.; Gan, J.; Wu, H.; Deng, Y. Progress on circulation dynamics in the East China Sea and southern Yellow Sea: Origination, pathways, and destinations of shelf currents. Prog. Oceanogr. 2021, 193, 102553. [Google Scholar] [CrossRef]
  67. Chao, S.Y. Circulation of the East China Sea, a numerical study. J. Oceanogr. 1990, 46, 273–295. [Google Scholar] [CrossRef]
  68. Tang, T.Y.; Hsueh, Y.; Yang, Y.J.; Ma, J.C. Continental slope flow northeast of Taiwan. J. Oceanogr. 1999, 29, 1353–1362. [Google Scholar] [CrossRef]
  69. Gawarkiewicz, G.; Jan, S.; Lermusiaux, P.F.J.; Mcclean, J.; Centurioni, L.; Taylor, K.; Cornuelle, B.; Duda, T.F.; Wang, J.; Yang, Y.J.; et al. Circulation and intrusions northeast of Taiwan: Chasing and predicting uncertainty in the cold dome. Oceanography 2011, 24, 110–121. [Google Scholar] [CrossRef]
  70. Lee, H.J.; Chao, S.Y. A climatological description of circulation in and around the East China Sea. Deep-Sea Res. II 2003, 50, 1065–1084. [Google Scholar] [CrossRef]
  71. Liang, W.D.; Tang, T.Y.; Yang, T.J.; Ko, M.T.; Chuang, W.S. Upper-ocean currents around Taiwan. Deep-Sea Res. II 2003, 50, 1085–1106. [Google Scholar] [CrossRef]
  72. Liu, K.K.; Peng, T.H.; Shaw, P.T.; Shiah, F.K. Circulation and biogeochemical processes in the East China Sea and the vicinity of Taiwan: An overview and brief synthesis. Deep-Sea Res. II 2003, 50, 1055–1064. [Google Scholar] [CrossRef]
  73. Tseng, R.S.; Shen, Y.T. Lagrangian observations of surface flow patterns in the vicinity of Taiwan. Deep-Sea Res.II 2003, 50, 1107–1116. [Google Scholar] [CrossRef]
  74. Jan, S.; Chen, C.C.; Tsai, Y.L.; Yang, Y.J.; Wang, J.; Chern, C.S.; Gawarkiewicz, G.; Lien, R.C.; Centurioni, L.; Kuo, J.Y. Mean structure and variability of the cold dome Northeast of Taiwan. Oceanography 2011, 24, 100–109. [Google Scholar] [CrossRef]
  75. Wang, J.; Oey, Y. Seasonal exchanges of the Kuroshio and shelf waters and their impacts on the shelf currents of the East China Sea. J. Phys. Oceanogr. 2016, 46, 1615–1632. [Google Scholar] [CrossRef]
  76. Hsu, P.C.; Zheng, Q.; Lu, C.Y.; Cheng, K.H.; Lee, H.J.; Ho, C.R. Interaction of coastal countercurrent in I-Lan Bay with the Kuroshio Northeast of Taiwan. Cont. Shelf Res. 2018, 171, 30–41. [Google Scholar] [CrossRef]
  77. Zhou, P.; Song, X.X.; Yuan, Y.Q.; Wang, W.T.; Cao, X.H.; Yu, Z.M. Intrusion pattern of the Kuroshio subsurface water onto the East China Sea continental shelf traced by dissolved inorganic iodine species during the spring and autumn of 2014. Mar. Chem. 2017, 196, 24–34. [Google Scholar] [CrossRef]
  78. Webber, M.; Edwards-Myers, E.; Campbell, C.; Webber, D. Phytoplankton and zooplankton as indicators of water quality in Discovery Bay, Jamaica. Hydrobiologia 2005, 545, 177–193. [Google Scholar] [CrossRef]
  79. McKinnon, A.D.; Duggan, S. Community Ecology of Pelagic Copepods in Tropical Waters. In Copepods: Diversity, Habitat and Behavior; Nova Science Publisher: New York, NY, USA, 2014; pp. 25–49. [Google Scholar]
  80. Polunia, J.J.; Lange, E.K.; Krechik, V.A. Structure and distribution of autumn zooplankton in the Southeastern Baltic Sea in 2015. Oceanology 2019, 59, 66–74. [Google Scholar] [CrossRef]
  81. Anandavelu, I.; Robin, R.S.; Purvaja, R.; Ganguly, D.; Ramesh, R.R. Spatial heterogeneity of mesozooplankton along the tropical coastal waters. Cont. Shelf Res. 2020, 206, 104193. [Google Scholar] [CrossRef]
  82. Tseng, L.C.; Dahms, H.U.; Chen, Q.C.; Hwang, J.S. Mesozooplankton and copepod community structures in the southern East China Sea: The status during the monsoonal transition period in September. Helgol. Mar. Res. 2012, 66, 621–634. [Google Scholar] [CrossRef]
  83. Shi, C.T.; Young, S.S. A checklist of free-living copepods, including those associated with invertebrates, reported from the adjacent seas of Taiwan. Acta Zool. Taiwanica 1995, 6, 65–81. [Google Scholar]
  84. Gomez-Gutierrez, J.; Funes-Rodriguez, R.; Arroyo-Ramirez, K.; Sanchez-Ortiz, C.A.; Beltran-Castro, J.R.; Hernandez-Trujillo, S.; Palomares-Garcia, J.R.; Aburto-Oropeza, O.; Ezcurra, E. Oceanographic mechanisms that possibly explain dominance of neritic-tropical zooplankton species assemblages around the Islas Marias Archipelago, Mexico. Lat. Am. J. Aquat. Res. 2014, 42, 1009–1034. [Google Scholar] [CrossRef]
  85. Beltran-Castro, J.R.; Hernandez_Trujillo, S.; Gomez-Gutierrez, J.; Trasvia-Castro, A.; Aburto-Oropeza, O. Copepod species assemblage and carbon biomass during two anomalous warm periods of distinct origin during 2014–2015 in the southern Gulf of California. Cont. Shelf Res. 2020, 207, 104215. [Google Scholar] [CrossRef]
  86. Kazmi, Q.B. Copepods from shore and offshore waters of Pakistan. J. Mar. Sci. Technol. 2004, 12, 223–238. [Google Scholar] [CrossRef]
  87. Rakhesh, M.; Raman, A.V.; Sudarsan, D. Discriminating zooplankton assemblages in neritic and oceanic waters: A case for the northeast coast of India, Bay of Bengal. Mar. Environ. Res. 2006, 61, 93–109. [Google Scholar] [CrossRef] [PubMed]
  88. Jessica, G.; Thomas, H.; Ismar, S.M.H.; Sommer, U. Combined effects of ocean warming and acidification on copepod abundance, body size and fatty acid content. PLoS ONE 2016, 11, e0155952. [Google Scholar]
  89. Fitzer, S.C.; Caldwell, G.S.; Close, A.J.; Clare, A.S.; Upstill-Goddard, R.C.; Bentley, M.G. Ocean acidification induces multi-generational decline in copepod naupliar production with possible conflict for reproductive resource allocation. J. Exp. Mar. Biol. Ecol. 2012, 418, 30–36. [Google Scholar] [CrossRef]
  90. Aguilera, V.M. pH and other upwelling hydrographic drivers in regulating copepod reproduction during the 2015 El Niño event: A follow-up study. Estuar. Coast. Shelf Sci. 2020, 234, 106640. [Google Scholar] [CrossRef]
  91. Lee, E.H.; Choi, S.Y.; Seo, M.H.; Lee, S.J.; Soh, H.Y. Effects of temperature and pH on the egg production and hatching success of a common Korean copepod. Diversity 2020, 12, 372. [Google Scholar] [CrossRef]
  92. Halsband, C.; Dix, M.F.; Sperrea, K.H.; Reinardy, H.C. Reduced pH increases mortality and genotoxicity in an Arctic coastal copepod, Acartia longiremis. Aquat. Toxicol. 2021, 239, 105961. [Google Scholar] [CrossRef]
Figure 1. Research area and sampling stations.
Biology 11 01357 g001
Figure 2. Surface water environmental parameter characteristics during the research. (A) Sea surface water temperature changes; (B) Temperature; (C) Salinity; (D) Dissolved oxygen; (E) pH.
Biology 11 01357 g002
Figure 3. Cluster analysis of stations indicating 3 station groups: A, B, C.
Biology 11 01357 g003
Figure 4. Species number and abundance composition in the research area during autumn.
Biology 11 01357 g004
Figure 5. Horizontal distribution of copepod abundances in the study area.
Biology 11 01357 g005
Figure 6. RDA analysis of dominant species and environmental factors in the study area (Temp: temperature; Sal: salinity; DO: dissolved oxygen).
Biology 11 01357 g006
Table 1. Mean abundance (ind.m−3), relative abundance (RA) and occurrence rate (OR) of dominant species in the research area.
SpeciesMARA (%)OR (%)
Calanoid copepodites217.2428.06100.0
Paracalanus aculeatus142.7918.4488.0
Clausocalanus furcatus37.144.8096.0
Canthocalanus pauper27.793.5996.0
Oncaea venusta19.302.49100.0
Acrocalanus gracilis20.102.6092.0
Paracalanus parvus25.023.2368.0
Temora turbinata25.893.3464.0
Farranula gibbula18.082.3488.0
Oncaea media18.362.3772.0
Table 2. Mean abundance (inds. m−3) and IndVal (%) of indicator species in different cluster groups (Figure 3).
SpeciesGroup AGroup BGroup C
AbundanceIndValAbundanceIndValAbundanceIndVal
Acartia pacifica18.8358.837.823.920.040.04
Acrocalanus monachus1.473.860.631.84.2550.22
Calanopia elliptica8.4367.251.7111.910.310.73
Candacia aethiopica0.171.290.355.881.6666.60
Candacia (copepodites)////5.1575.00
Canthocalanus pauper60.8665.2523.4422.858.969.61
Centropages calaninus//0.254.891.1361.56
Centropages furcatus0.2714.721.2852.4//
Copilia mirabilis0.11.490.172.743.0992.01
Corycaeus agilis4.032.110.2623.3817.6355.22
Corycaeus speciosus7.6255.441.5212.072.3115.15
Euchaeta concinna12.2961.124.3623.680.10.15
Euchaeta (copepodites)31.120.9662.251.455.611.42
Farranula concinna1.310.620.690.7133.3294.36
Farranula gibbula8.3410.6717.430.3826.3350.58
Macrosetella gracilis15.4157.317.0826.354.3916.34
Oncaea clevei8.7418.8621.3155.198.5611.09
Paracalanus aculeatus184.7544.96217.1352.839.091.38
Paracalanus parvus42.8253.5823.9419.0613.168.23
Paracandacia truncata0.178.031.1869.470.041.53
Temora discaudata10.6661.824.526.082.097.56
Temora turbinata78.2869.0616.0715.470.10.01
Publisher’s Note: MDPI stays neutral with regard to jurisdictional claims in published maps and institutional affiliations.

