
Micrococcus lylae MW407006 Pigment: Production, Optimization, Nano-Pigment Synthesis, and Biological Activities


Abstract
:Simple Summary
Abstract
1. Introduction
2. Materials and Methods
2.1. Microorganisms
2.2. Pigment Producing Bacteria
2.2.1. Isolation
2.2.2. Pigment Extraction
2.2.3. Screening for Antimicrobial Activity
2.2.4. Identification of the Most Potent Pigment Producer
2.2.5. Liquid Chromatography–Mass Spectrometry (LC-MS), Nuclear Magnetic Resonance (NMR), and Fourier-Transform Infrared (FTIR) Spectroscopic Analysis
2.3. Optimization of the Cell Biomass Concentration, Pigment Production, and Antimicrobial Activity
2.3.1. Optimization Using One Factor at a Time
2.3.2. Optimization Using Central Composite Design (Response Surface Methodology)
2.4. Kinetic Study and Pigment Yield Calculation
2.5. Synthesis of the Nano-Pigment Using the Ball Milling Technique
2.5.1. Physicochemical Characterization of the Synthesized Nanoparticles
2.5.2. Antimicrobial Activity of the Synthesized Nanoparticles
2.5.3. Antioxidant Activity
2.5.4. Cytotoxicity Assay Using Human Cancer Cell Lines
2.5.5. Determination of Cellular Reactive Oxygen Species (ROS)
2.5.6. Relative Change in the Genetic Expression of Proapoptotic (p53 and BAX) and Anti-Apoptotic (Bcl2) Genes
2.6. Statistical Analyses
3. Results and Discussions
3.1. Isolation of Pigment-Producing Bacteria
3.2. Antimicrobial Activity of the Extracted Pigments
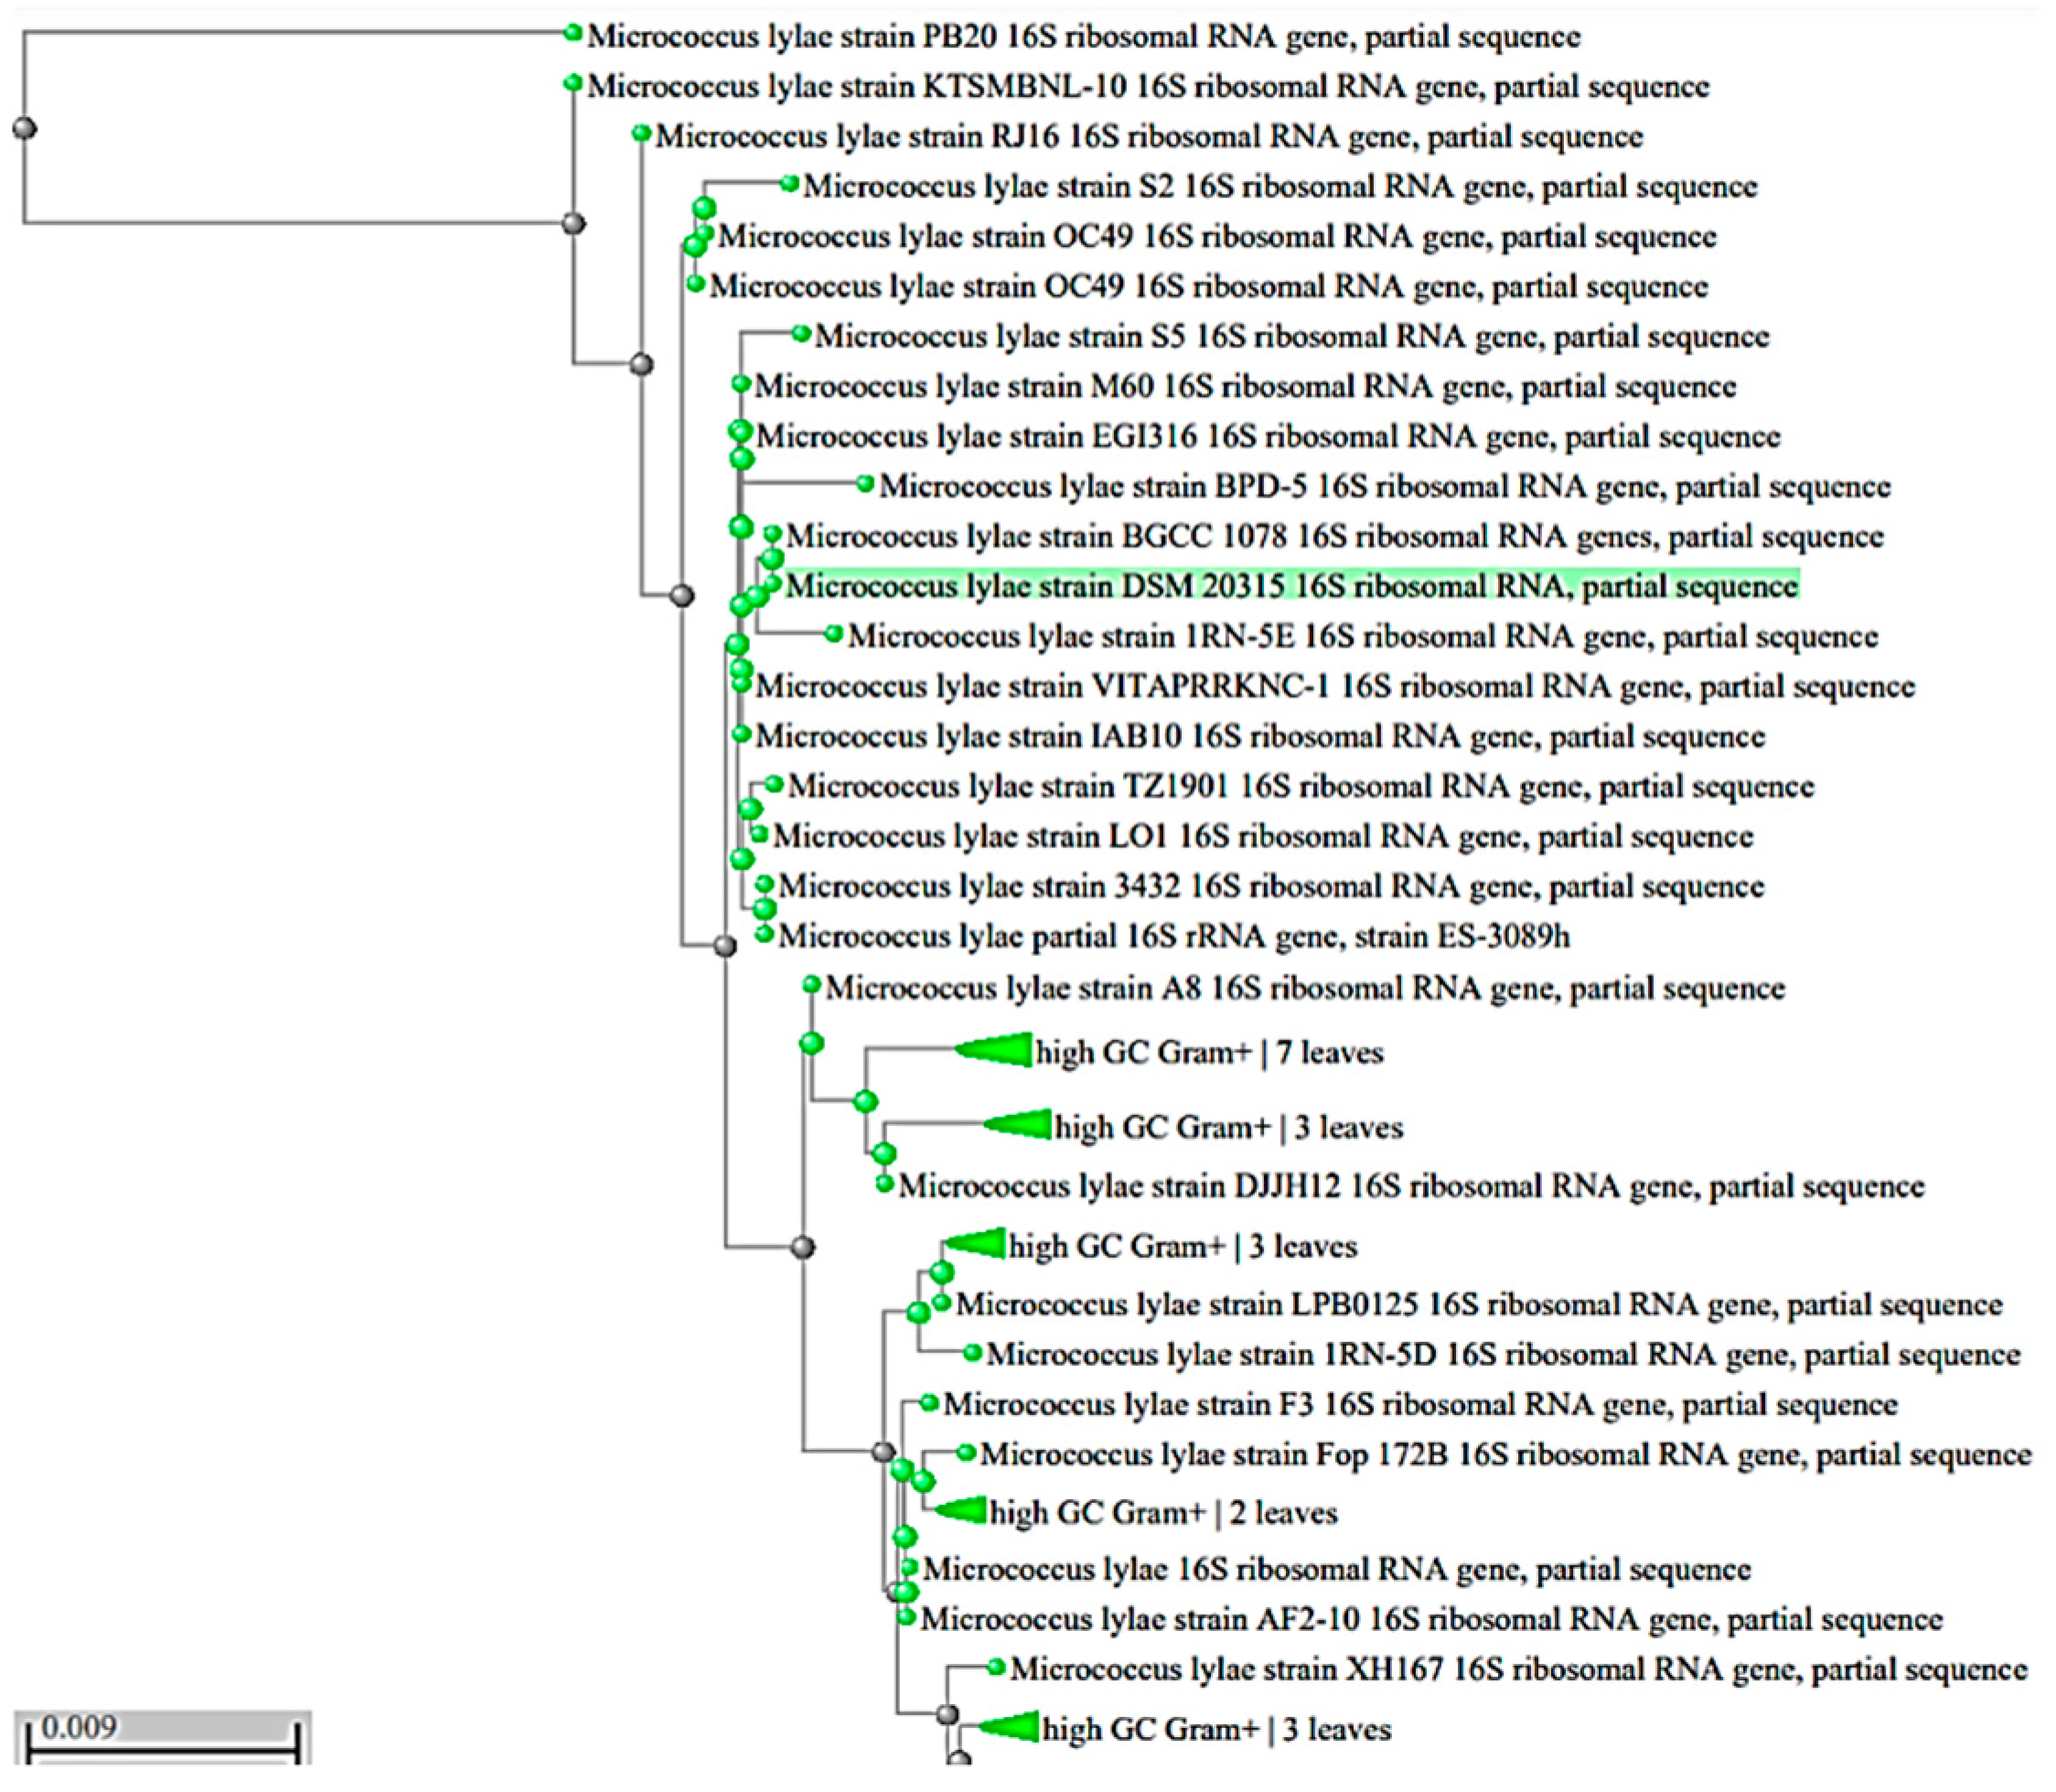
3.3. Identification of the Most Promising Isolate
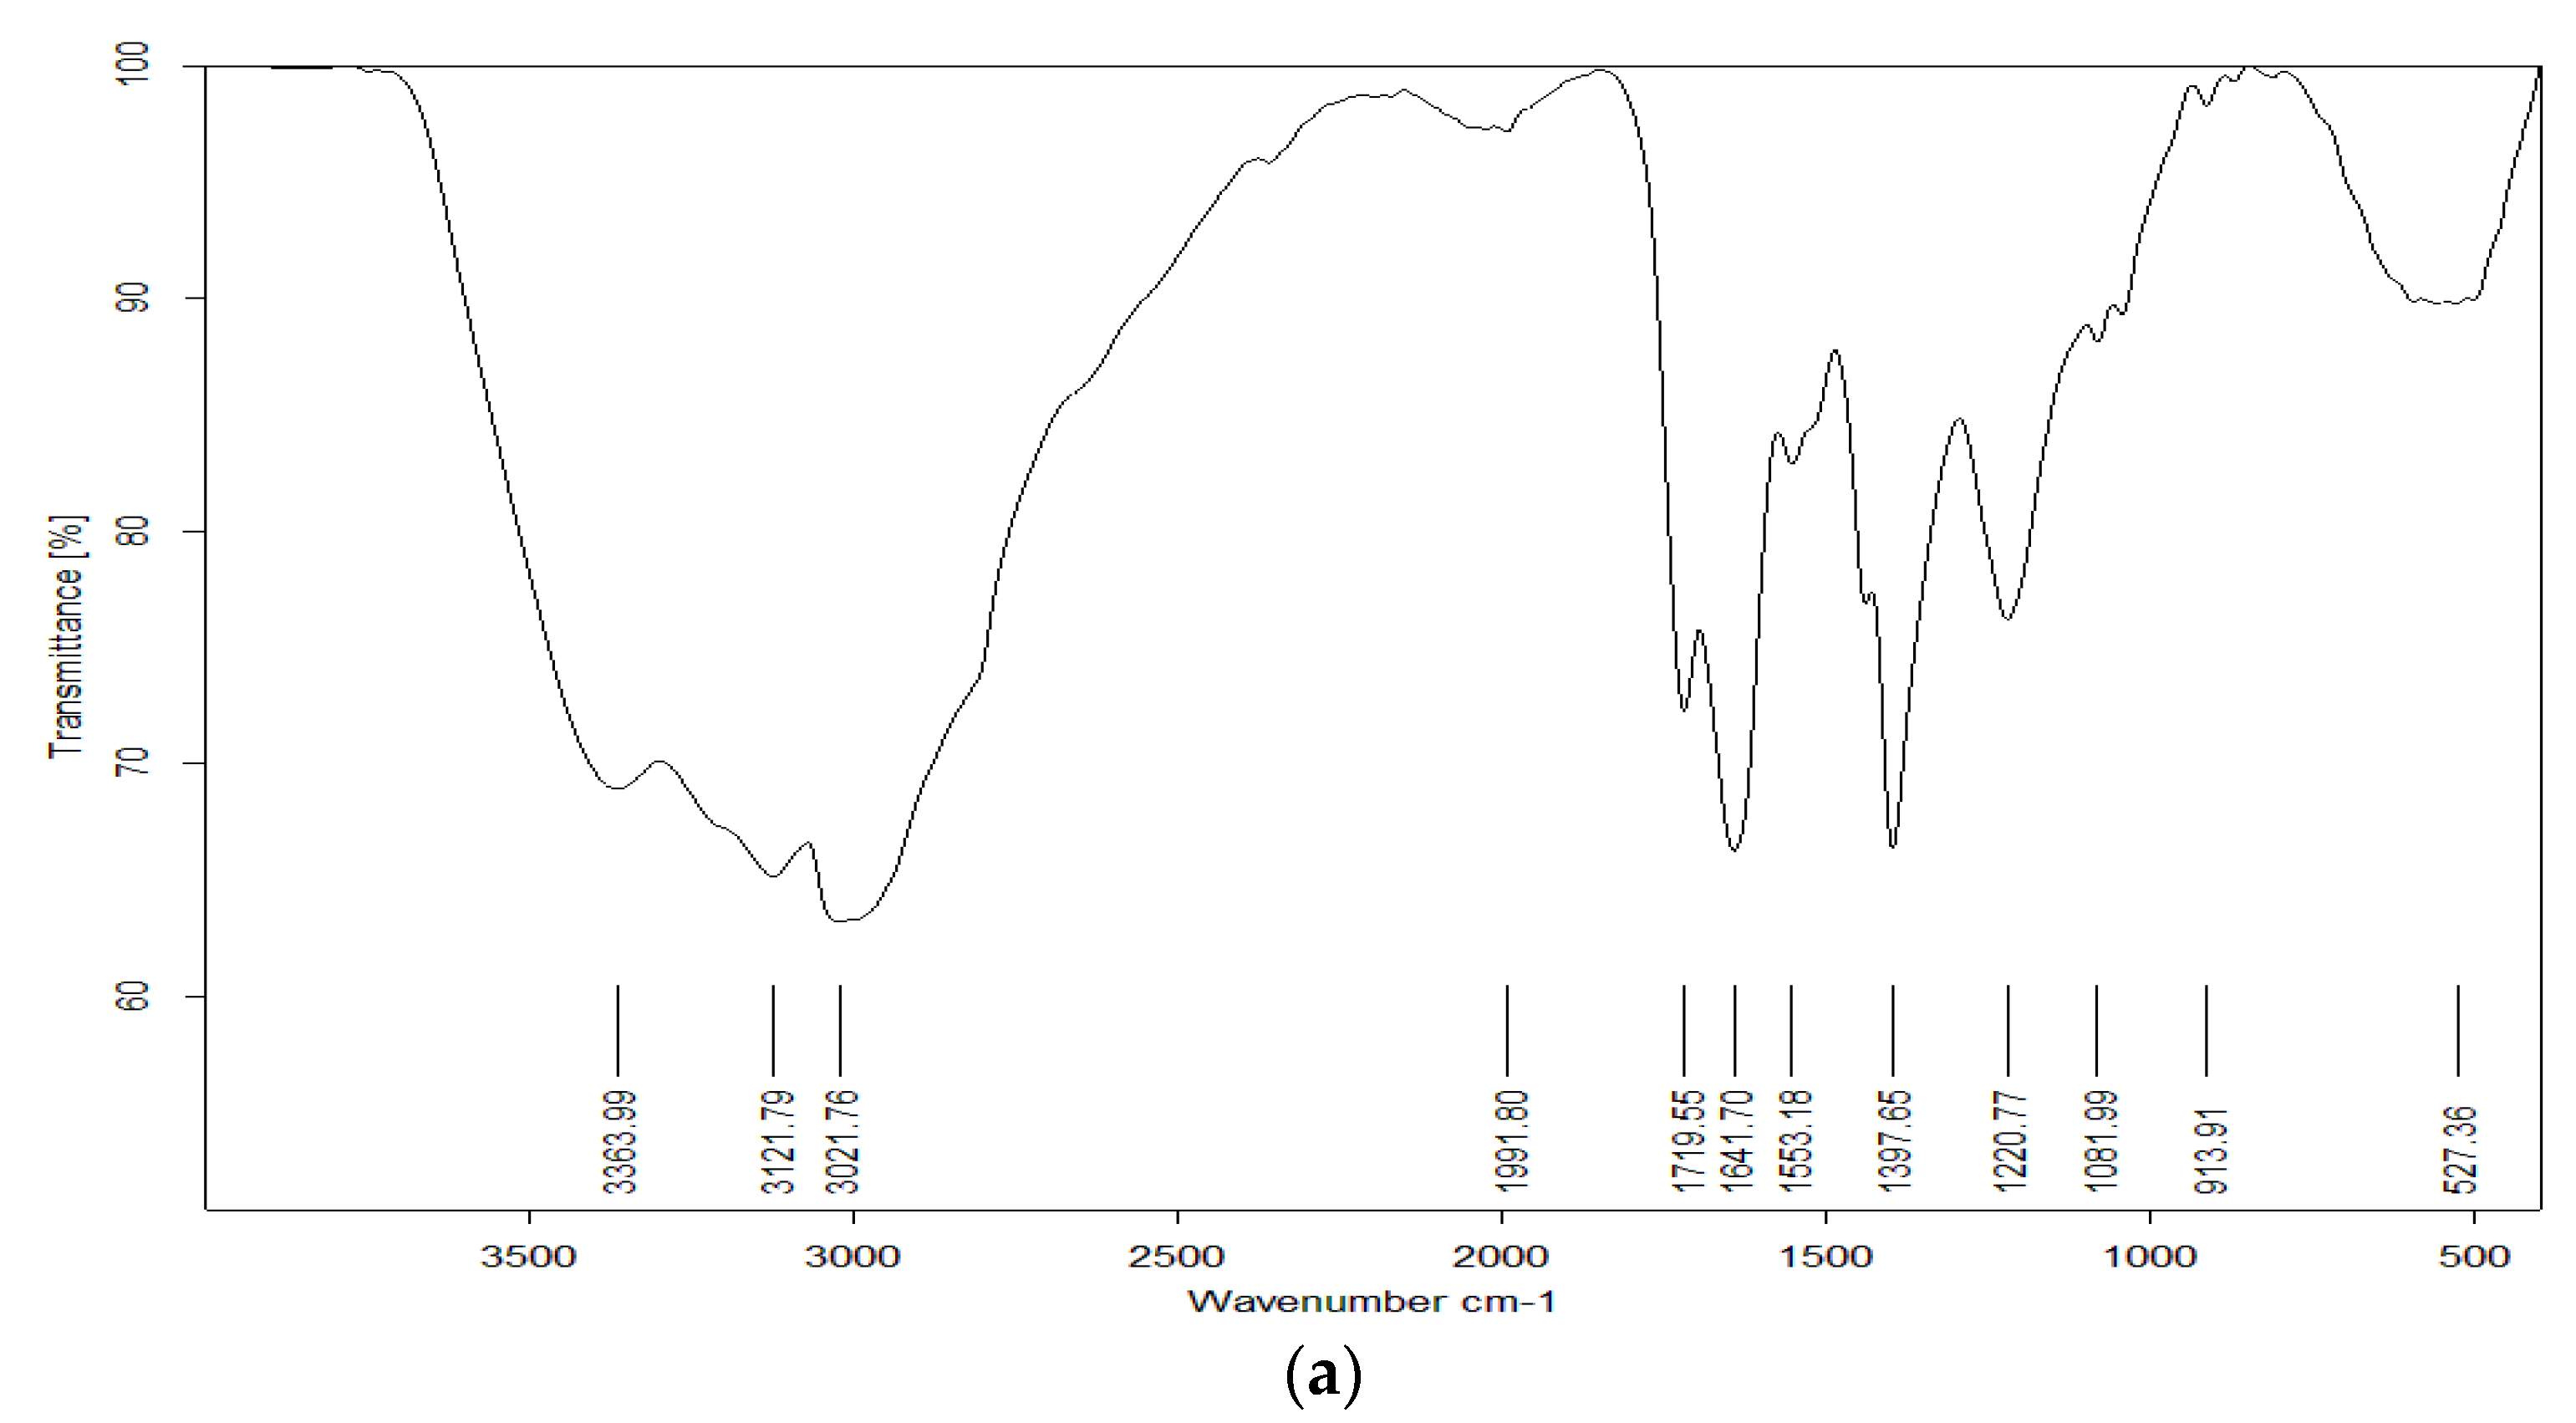
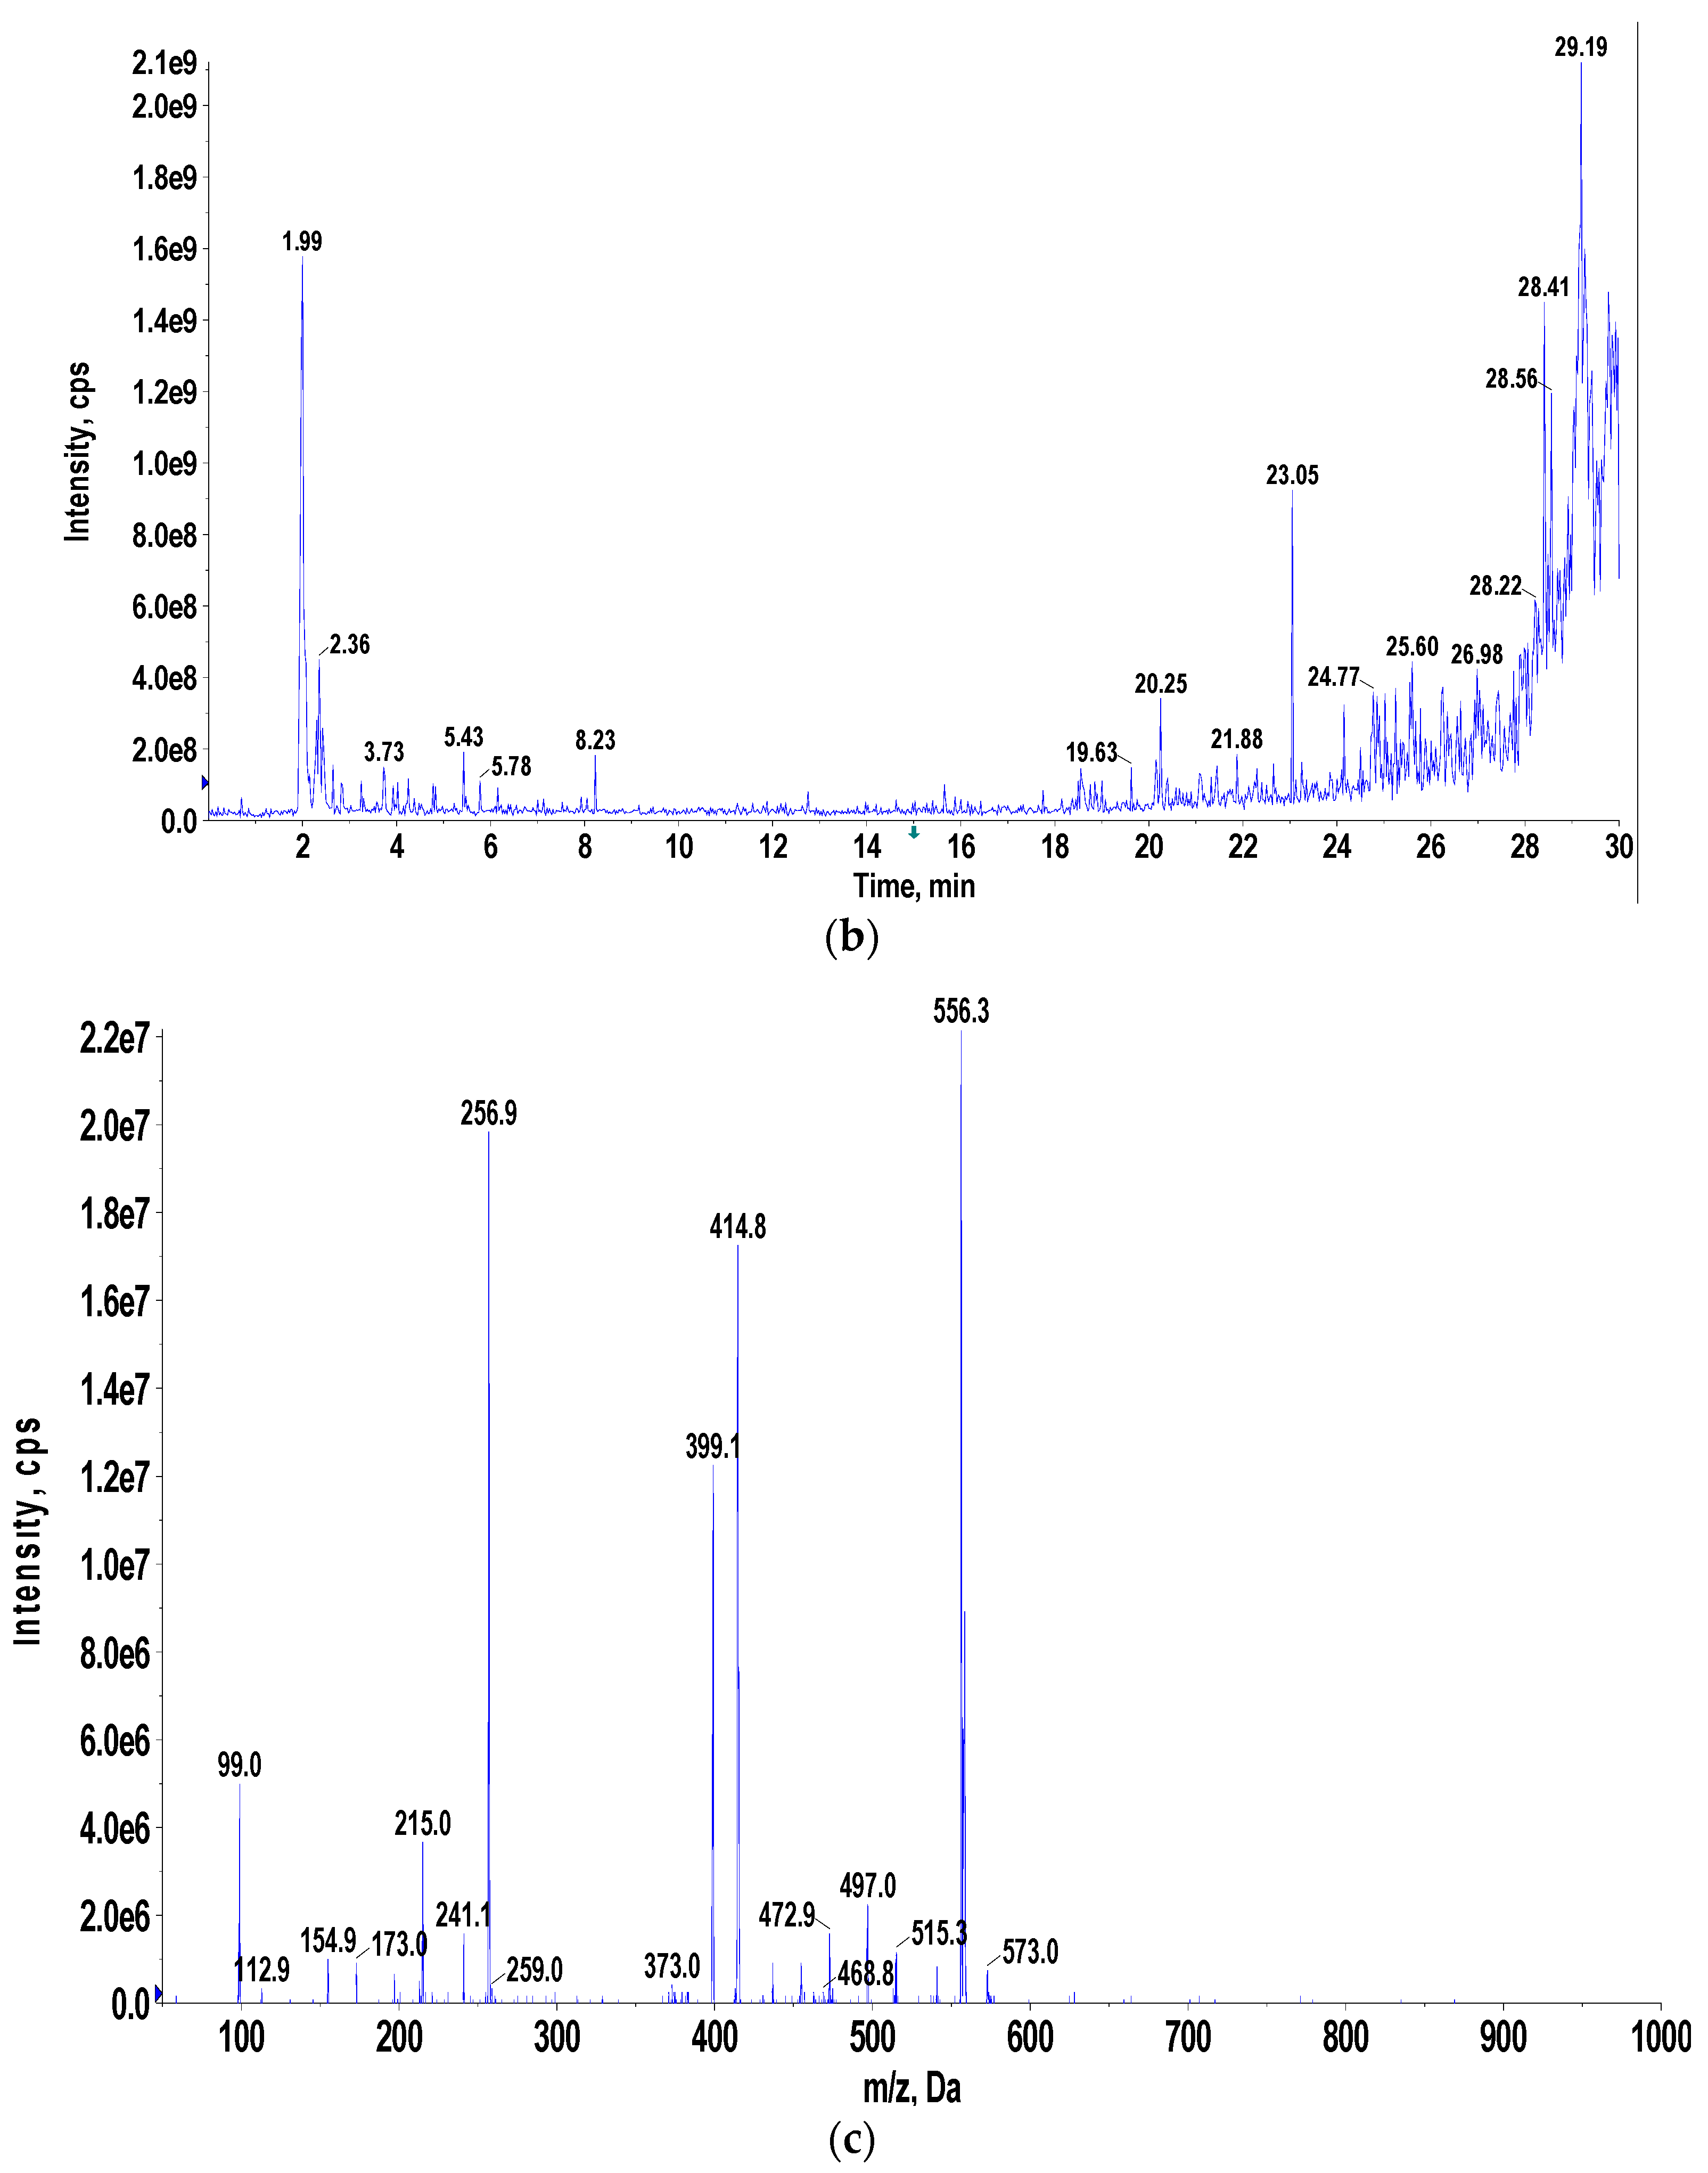
3.4. Pigment Identification and Characterization
3.5. Optimization of the Pigment Production, Biomass Concentration, and Antimicrobial Activity
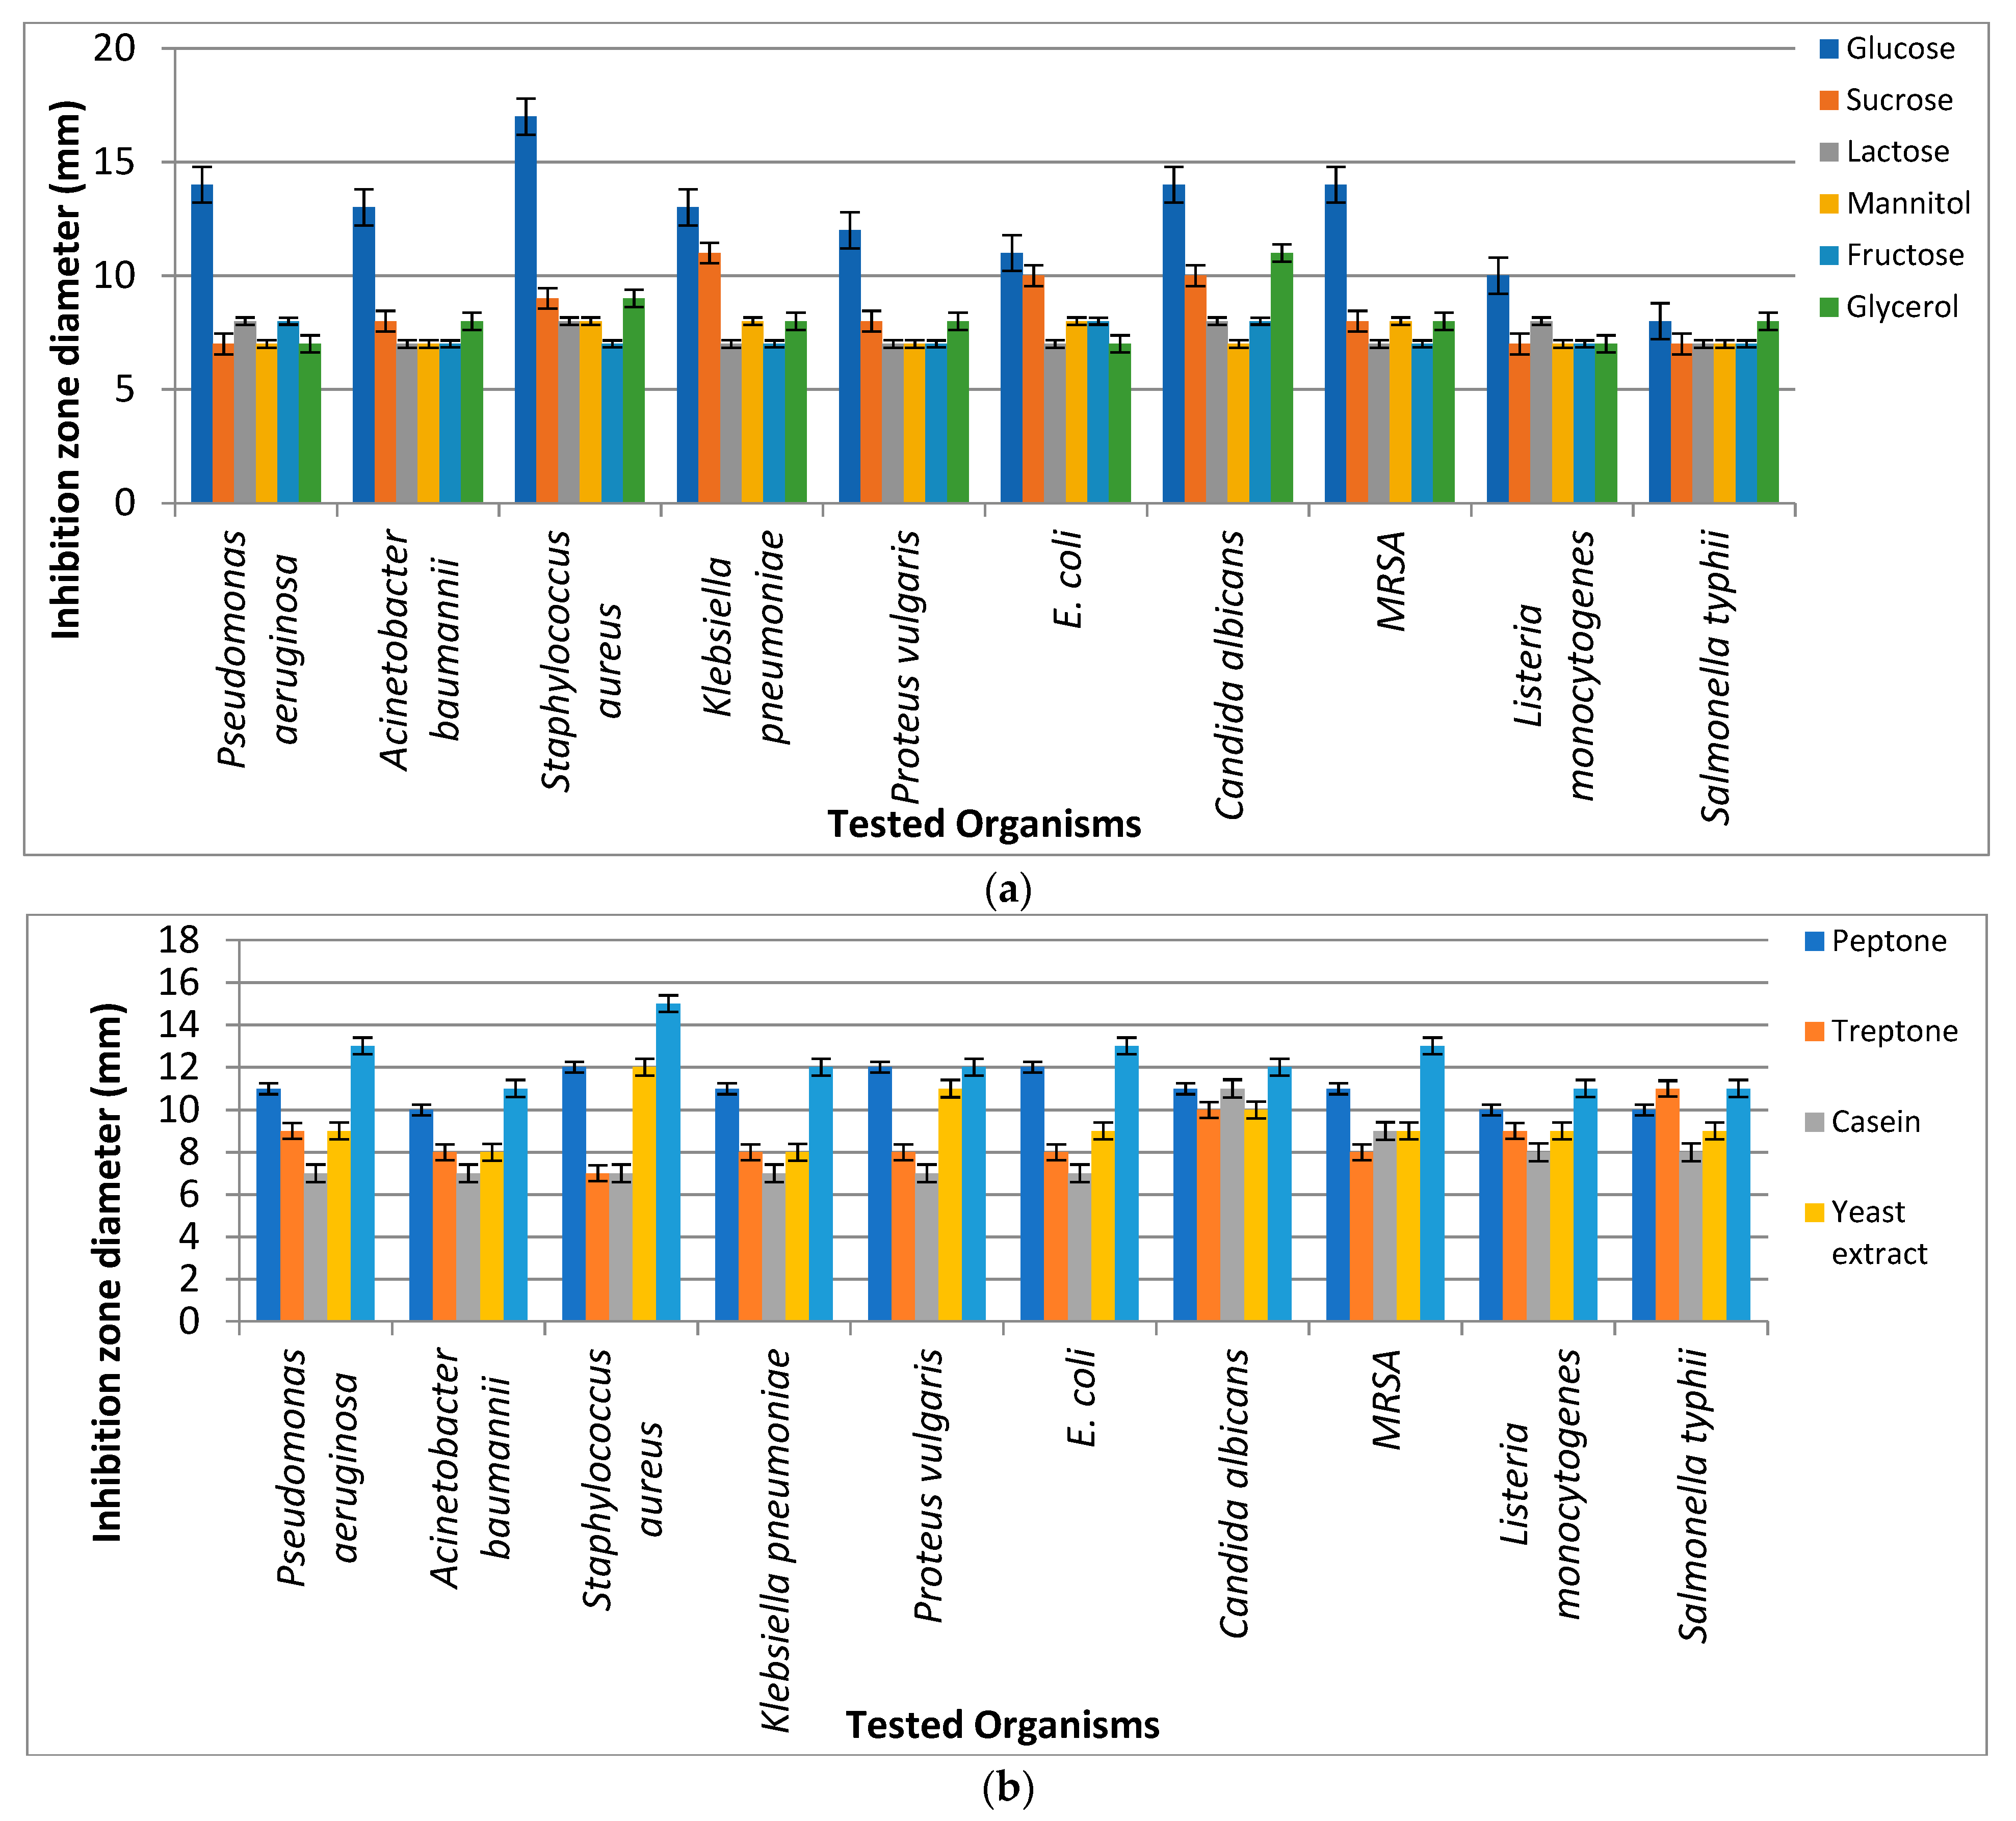
3.5.1. Optimization Using One Factor at a Time:
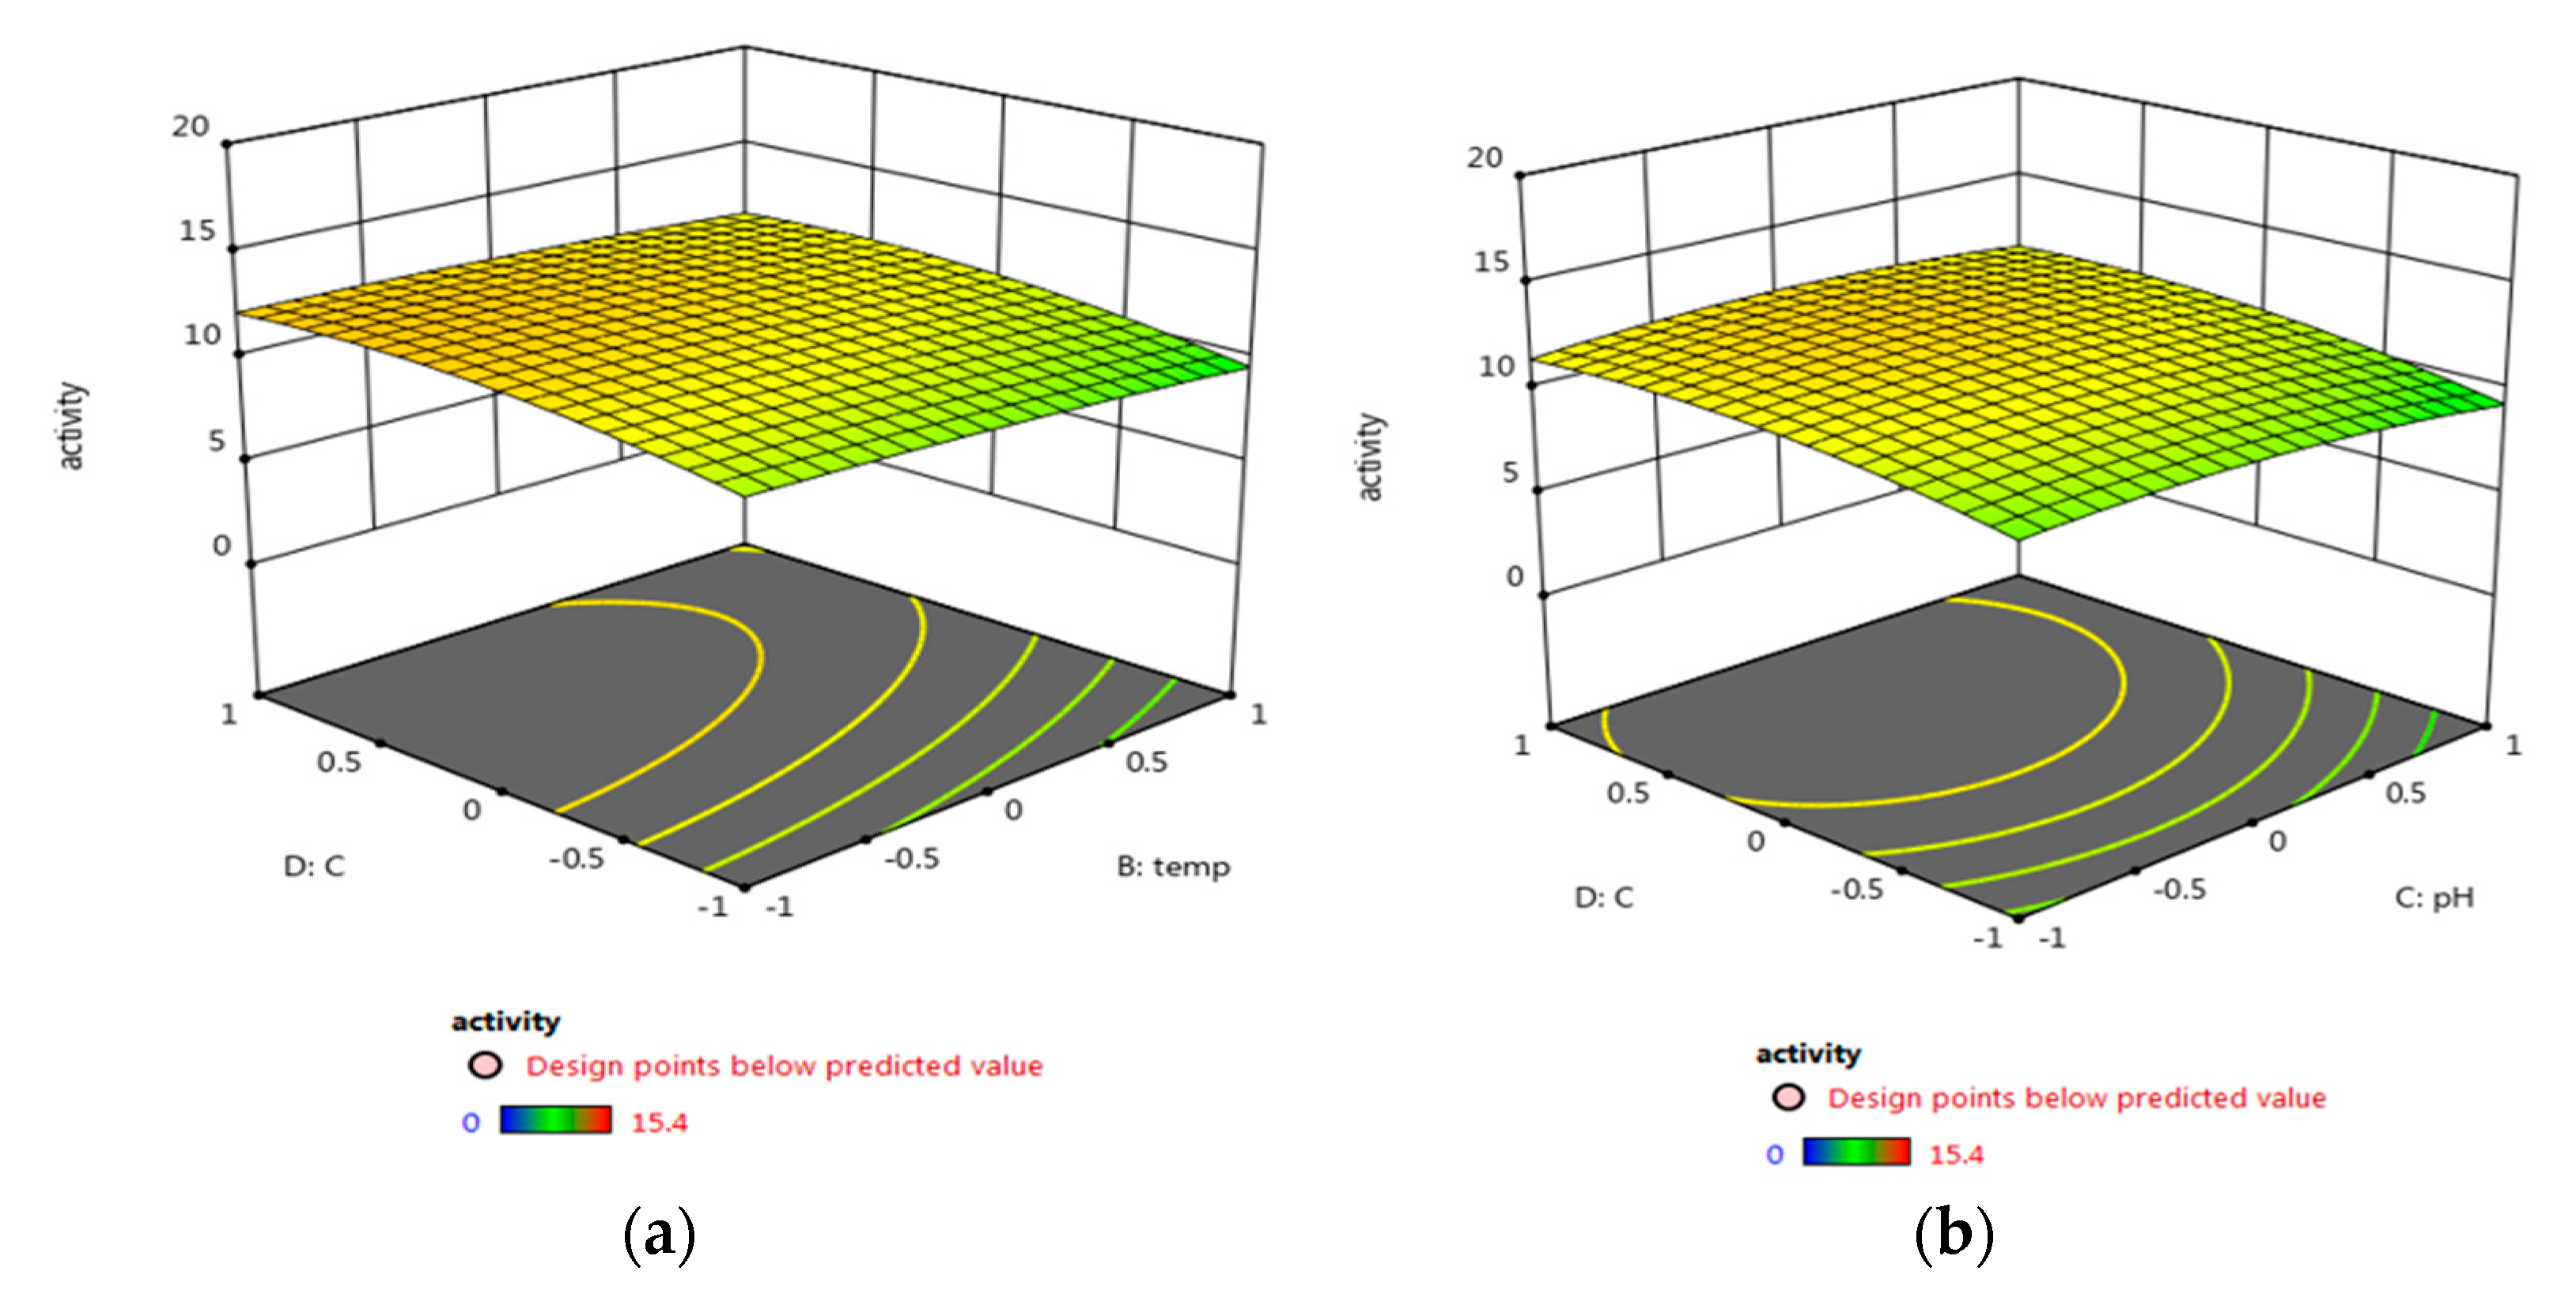
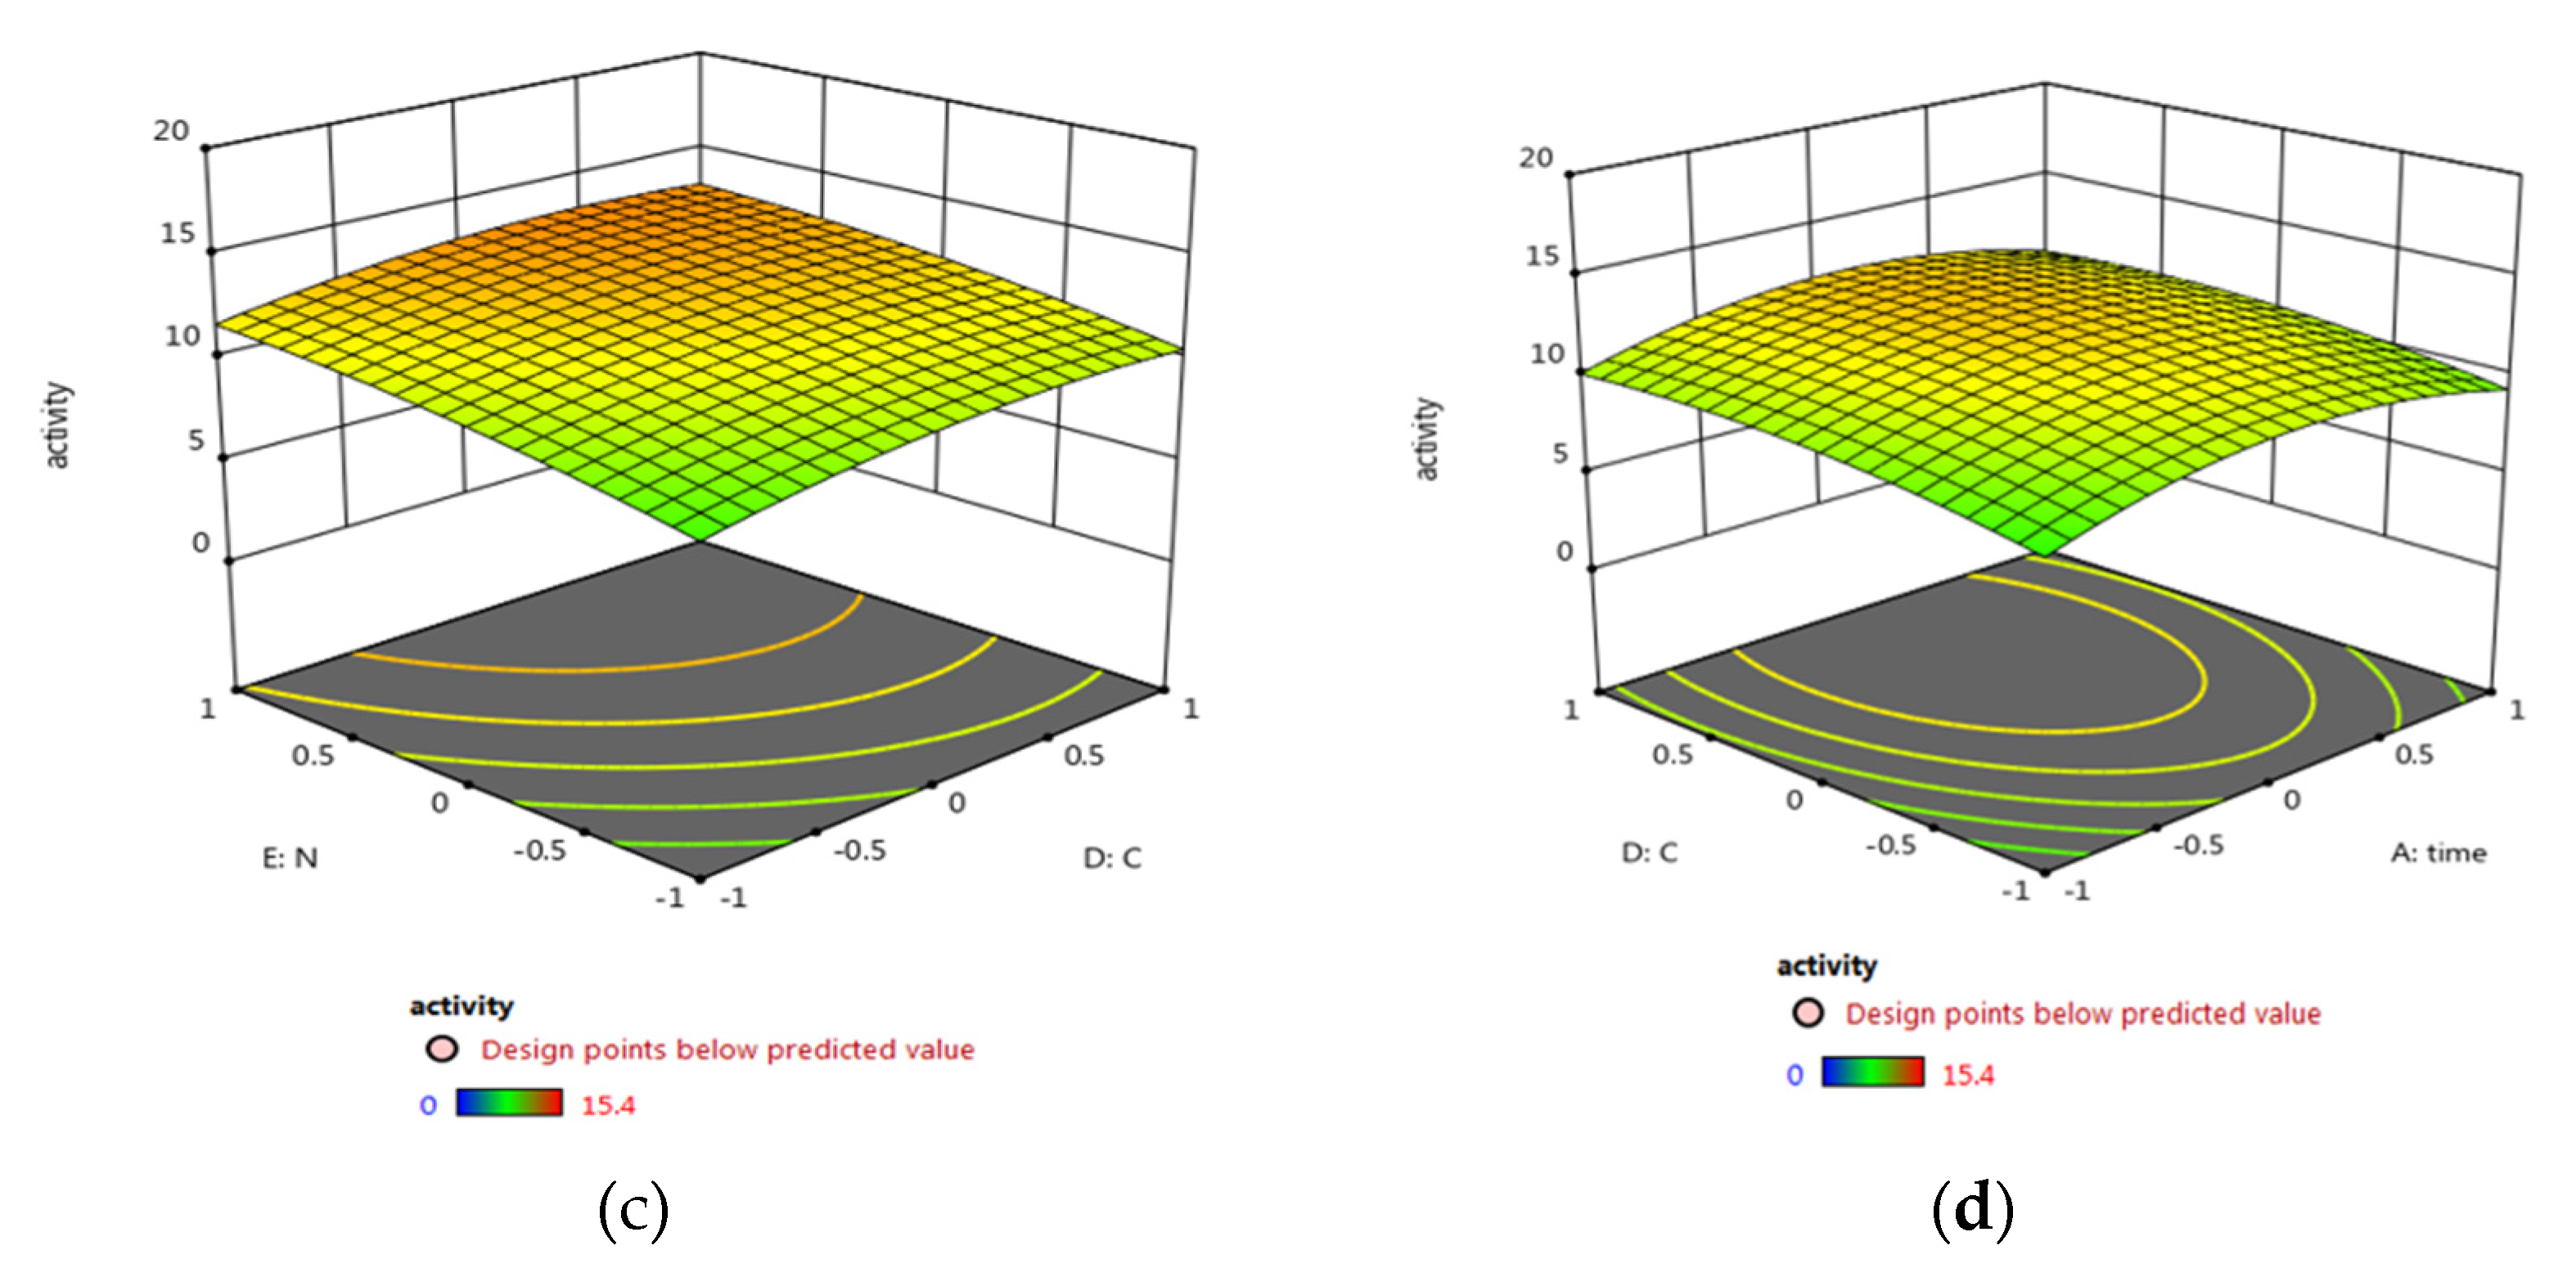
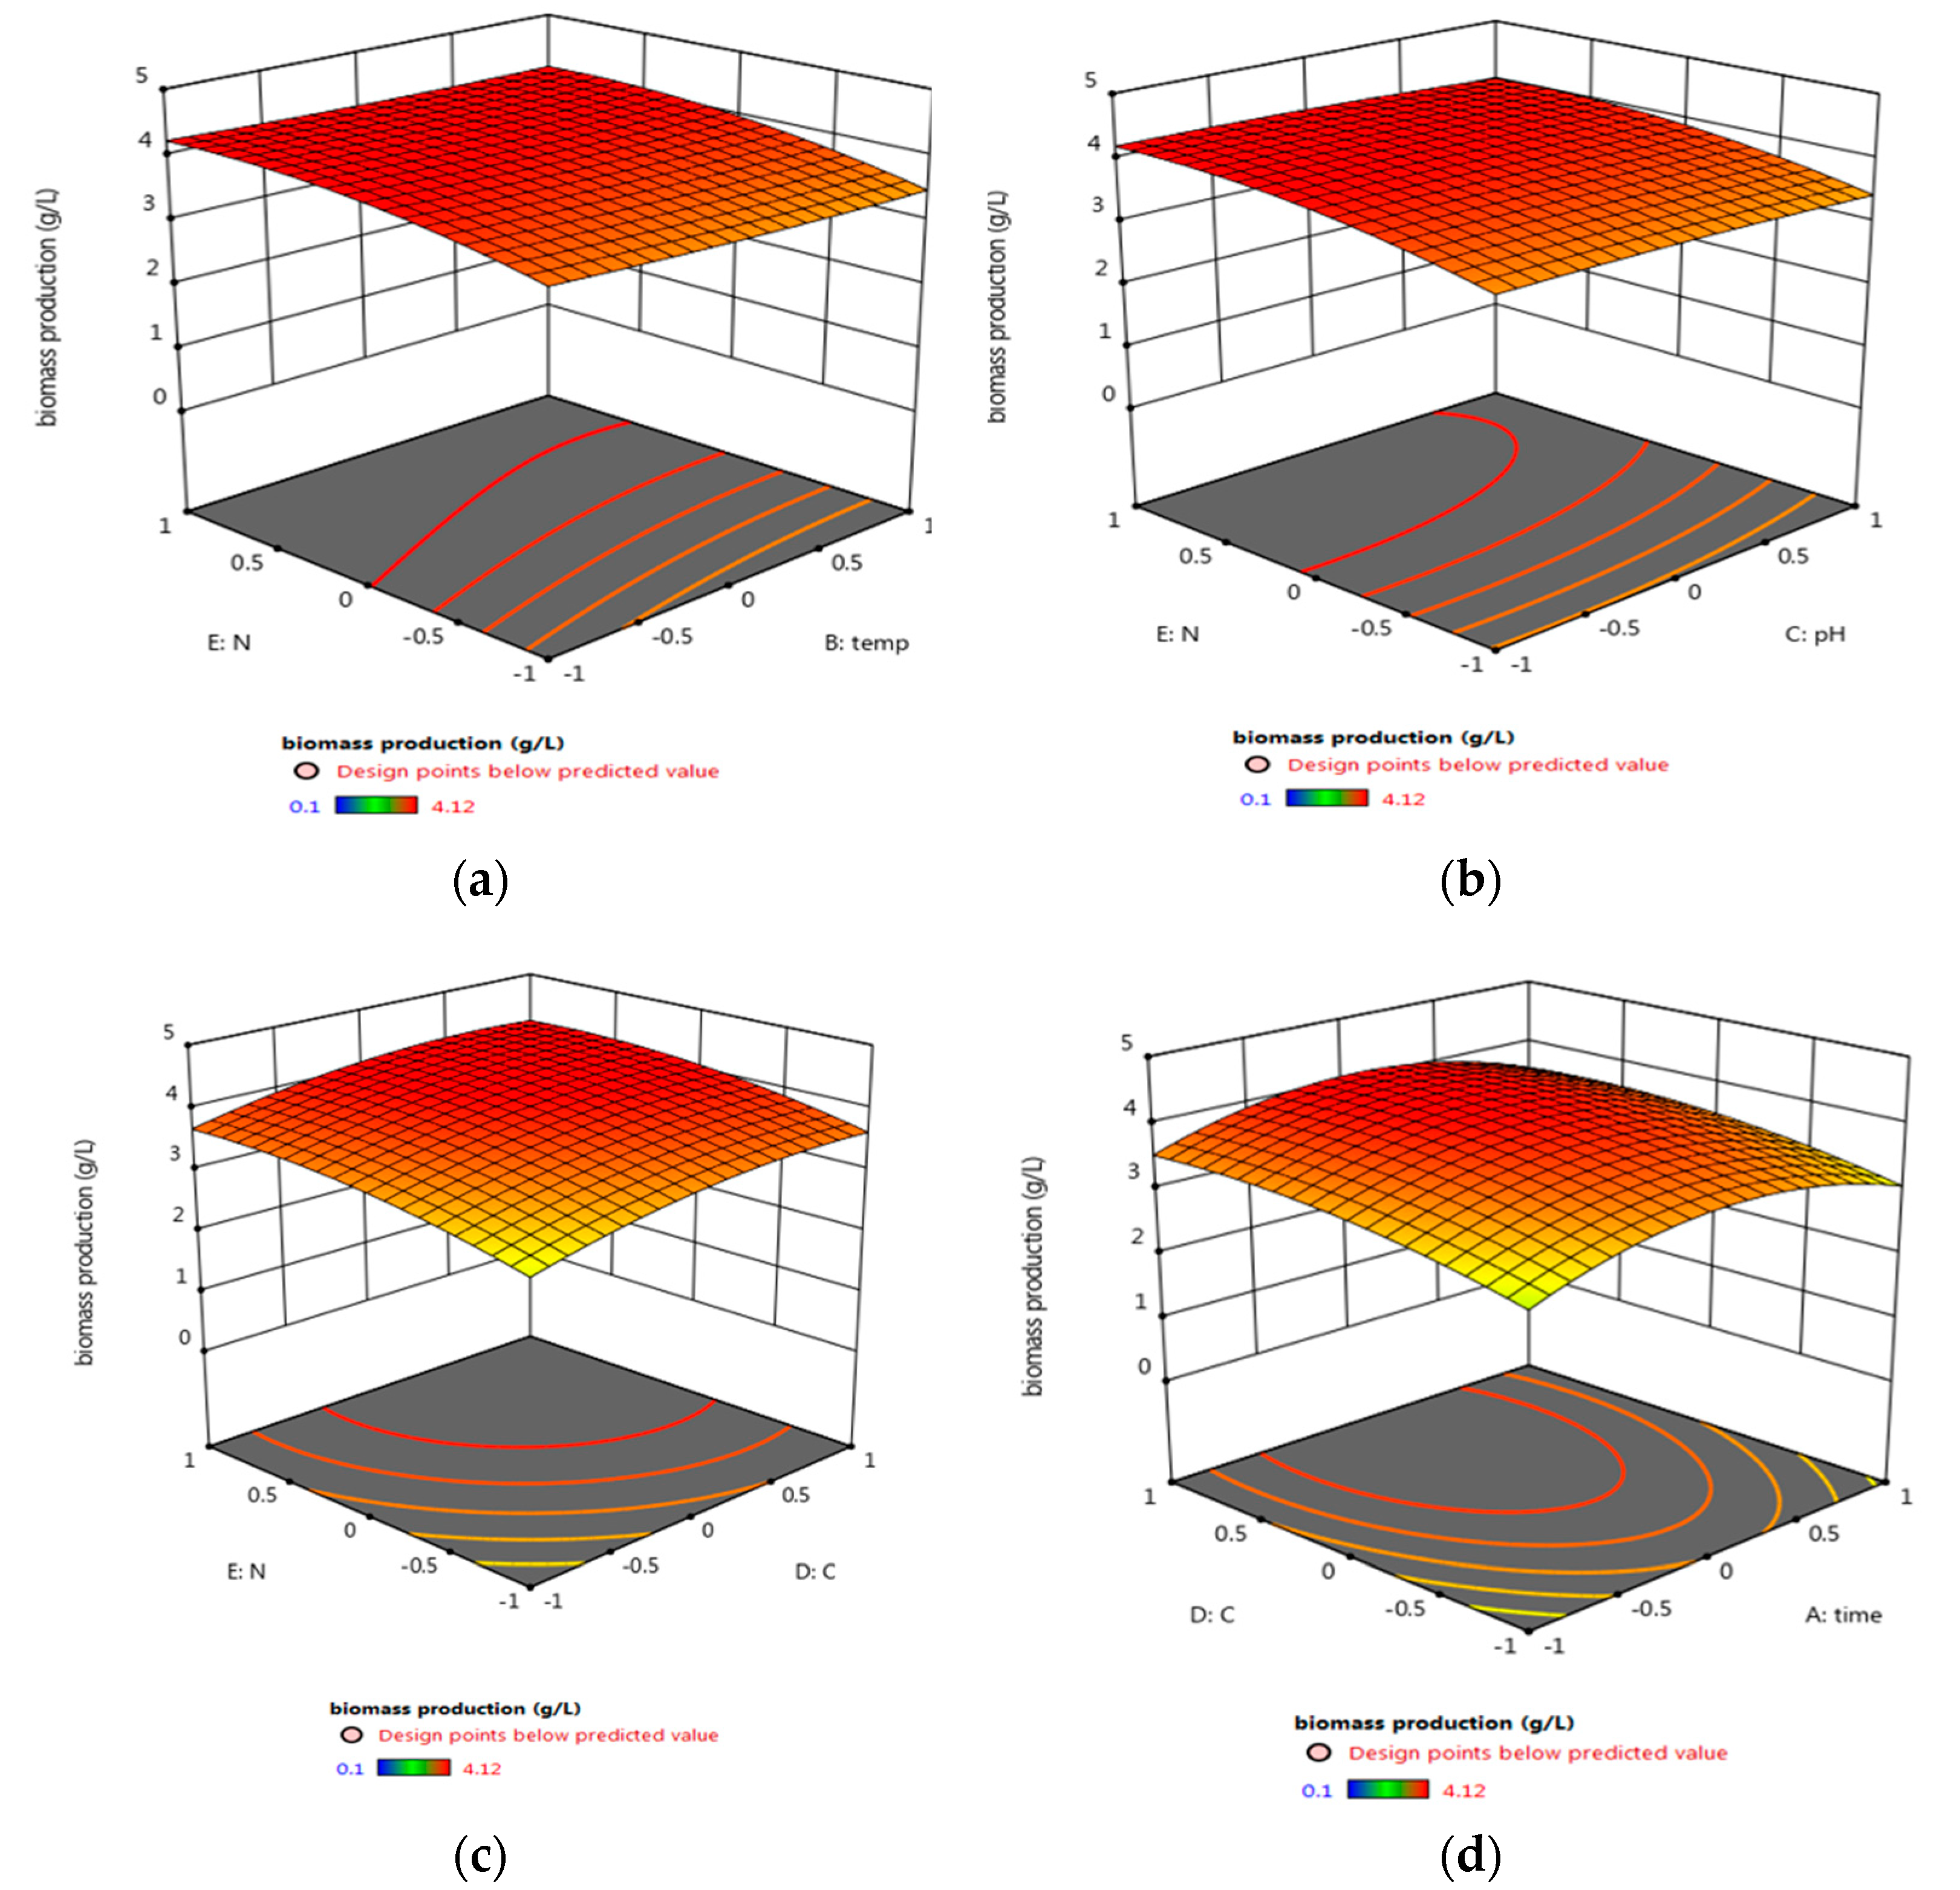
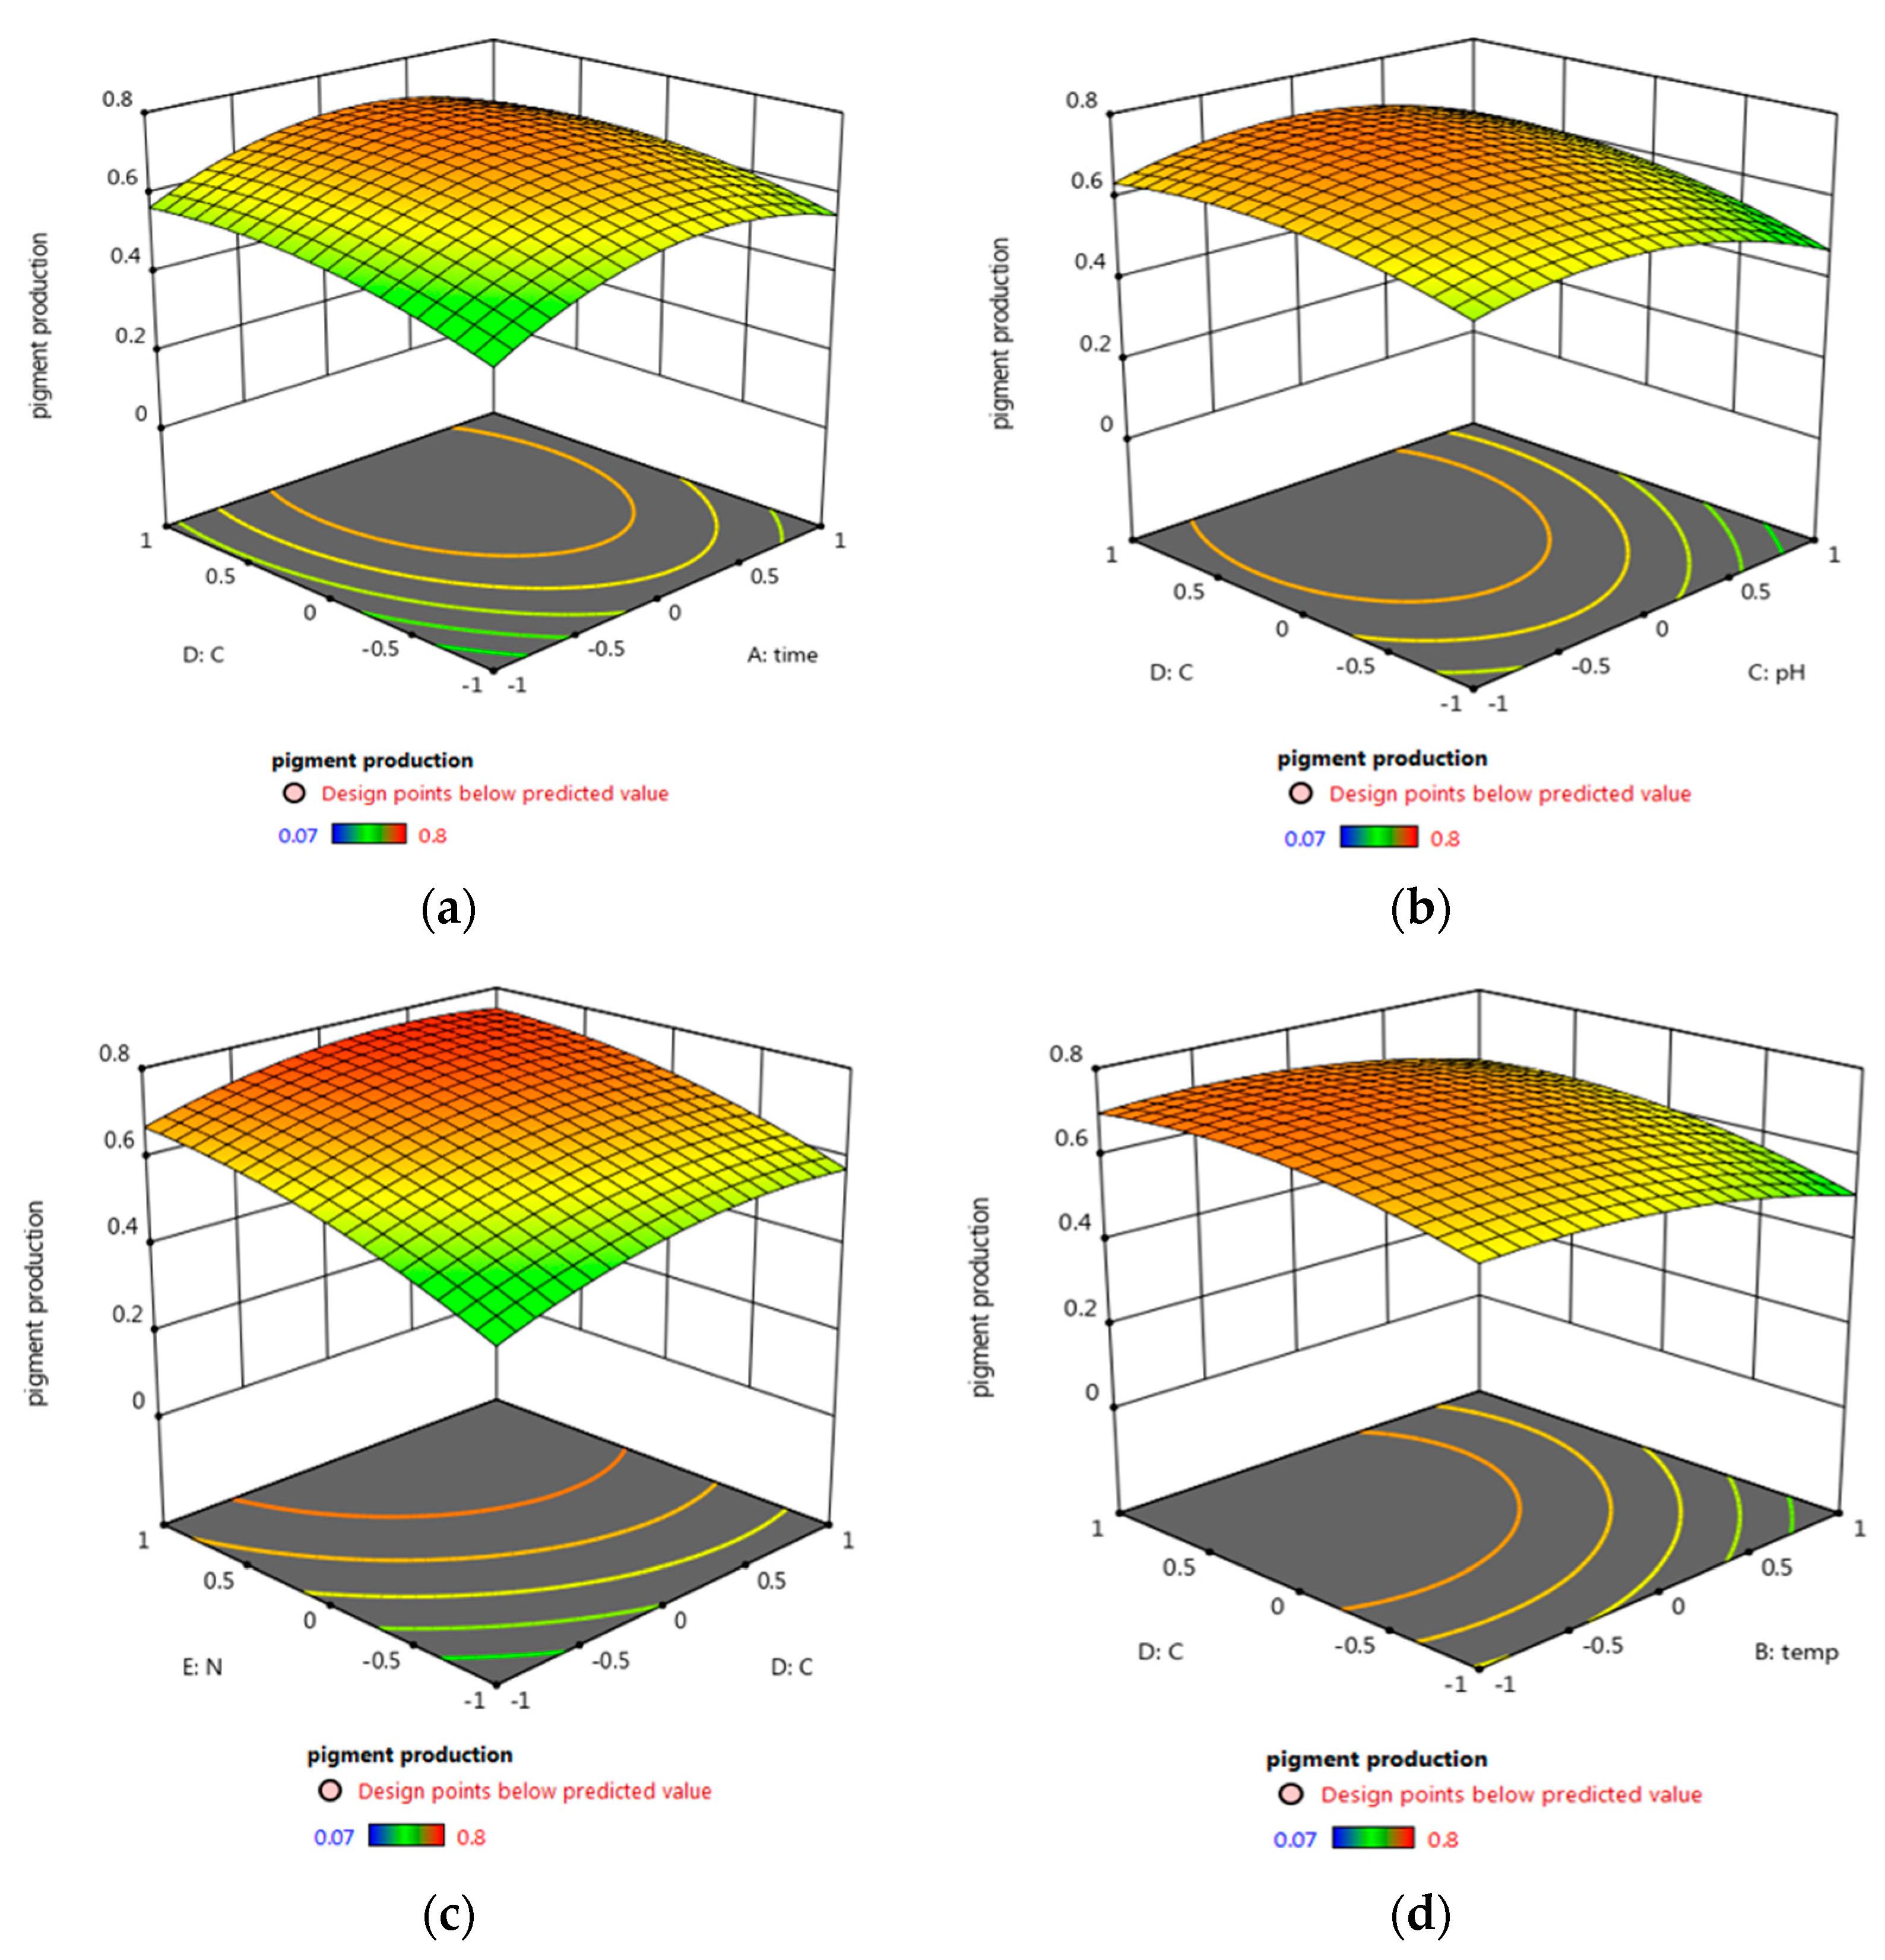
3.5.2. Central Composite Design (CCD) Optimization of Micrococcus lylae (MW407006)
3.6. Antimicrobial Investigations of the Optimized Pigment
MIC, MBC, and MIC Index
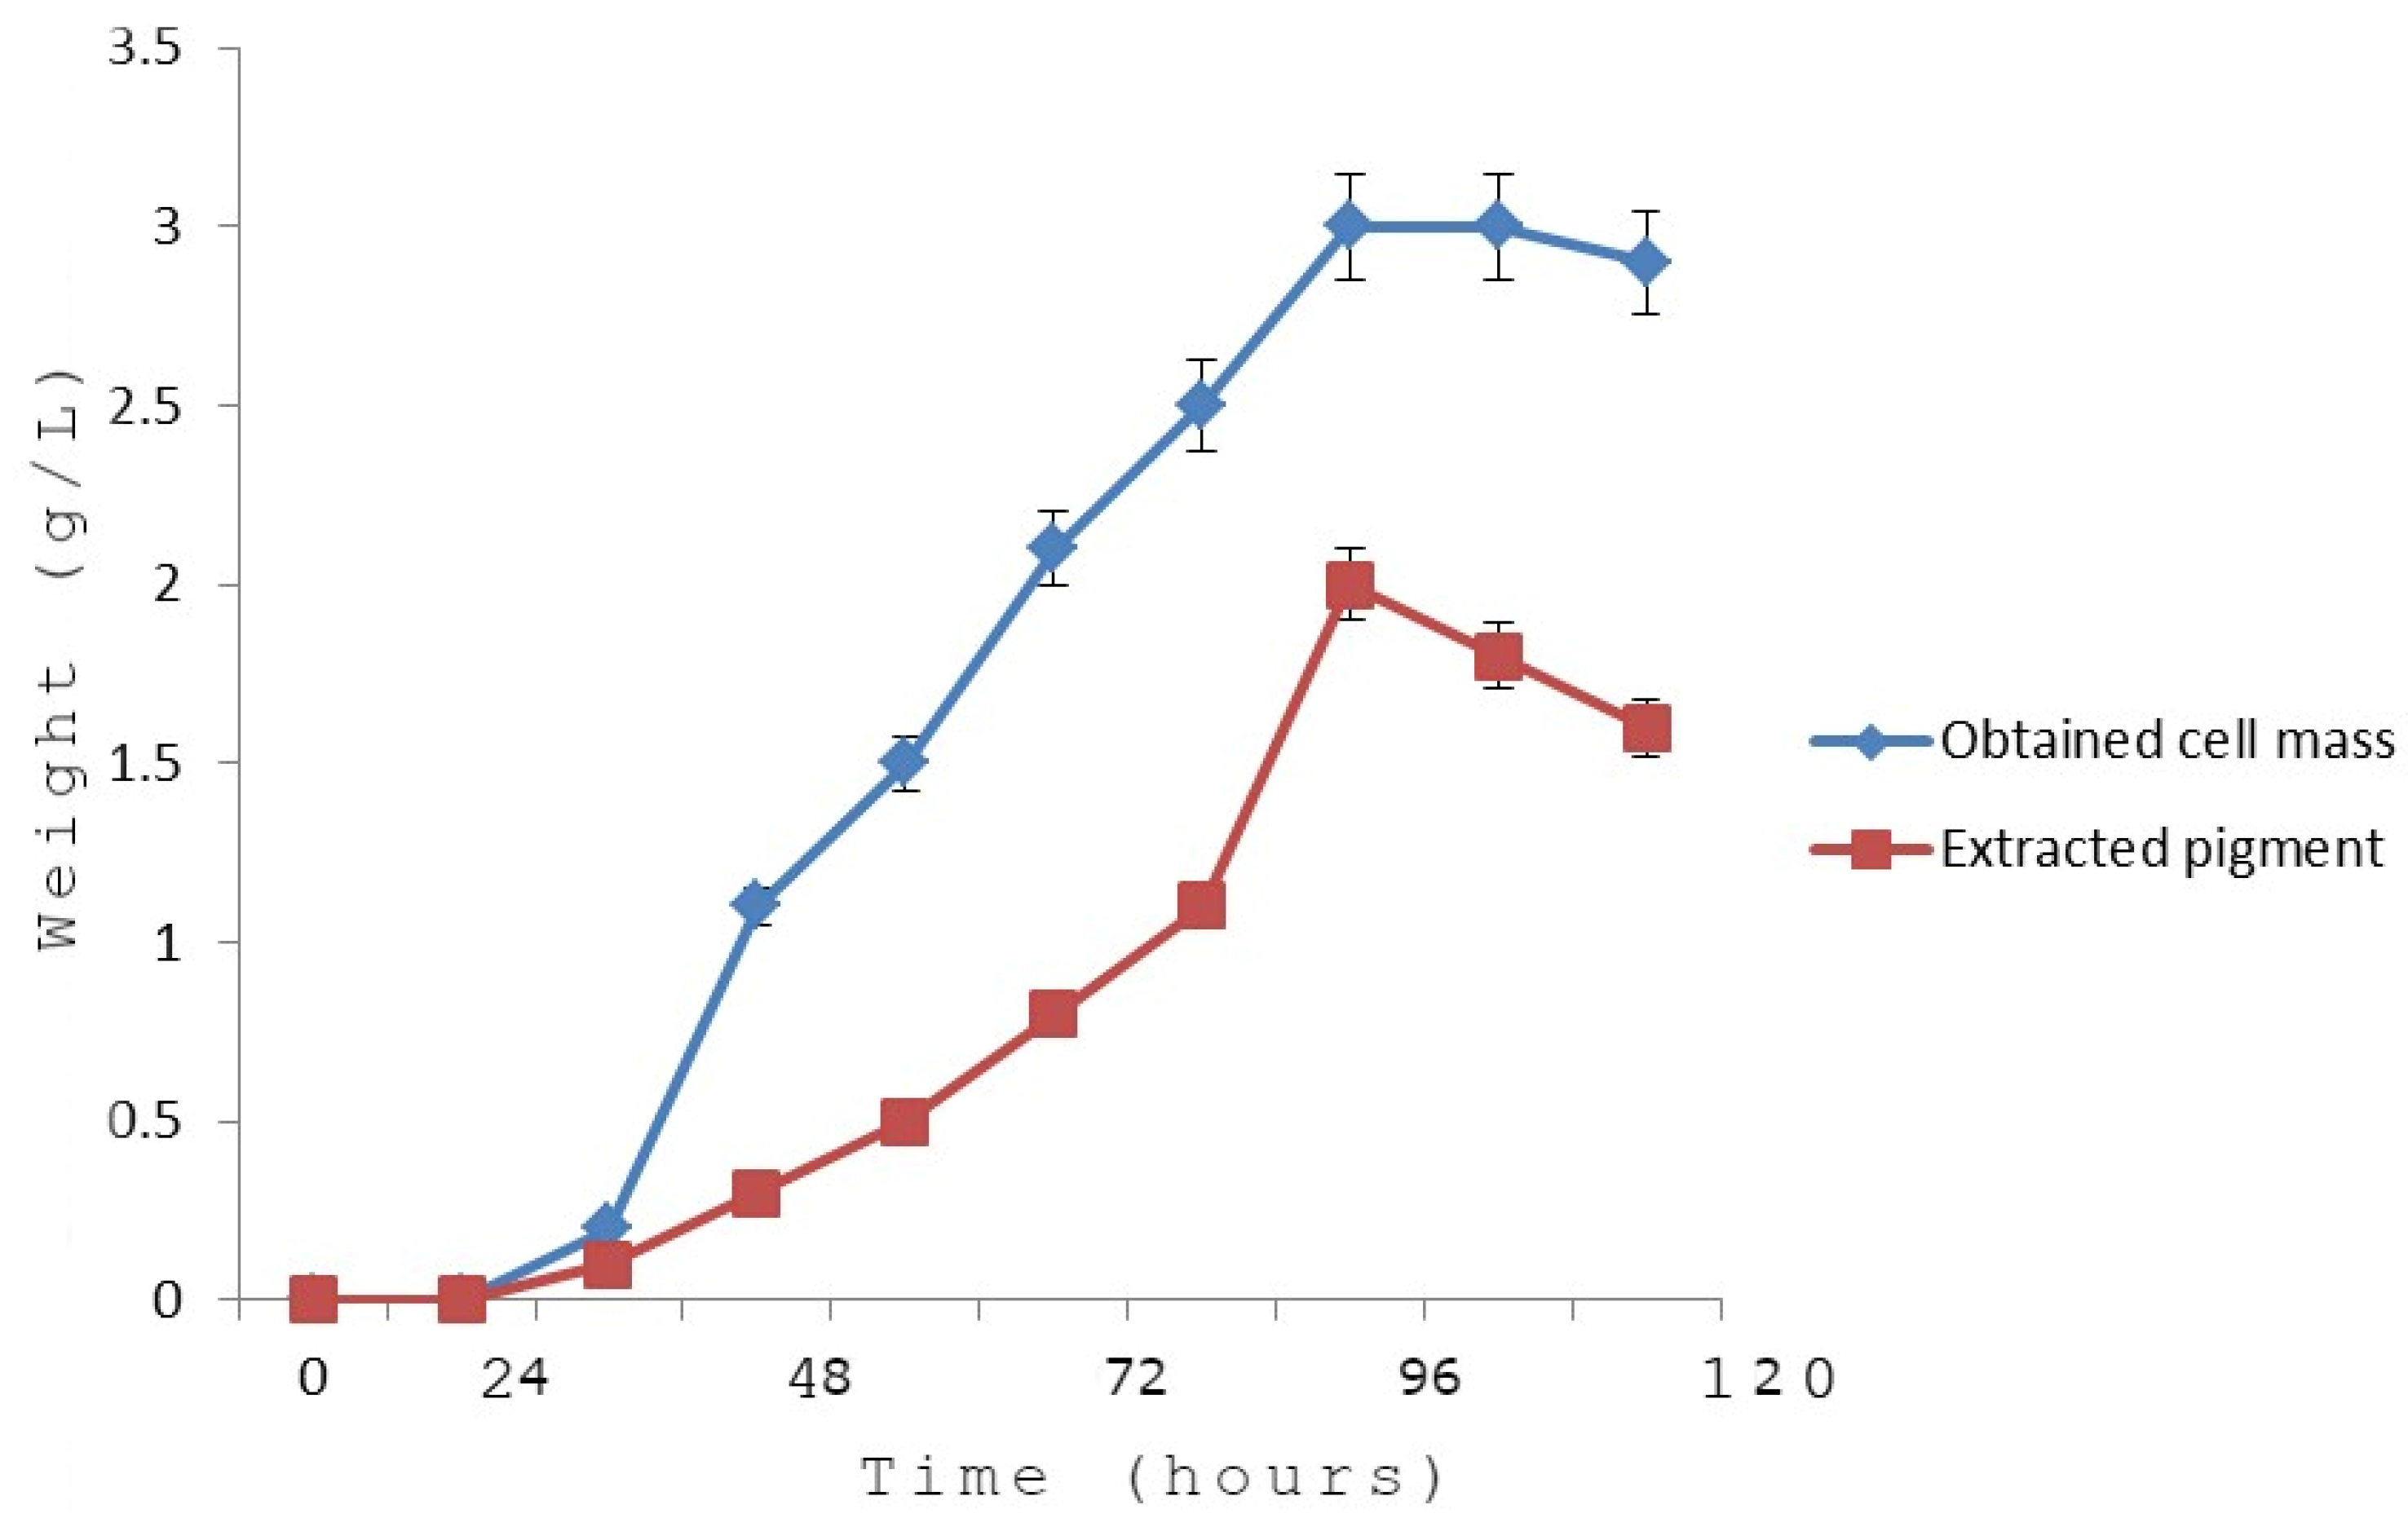
3.7. Growth Kinetics in Relation to the Pigment Yield
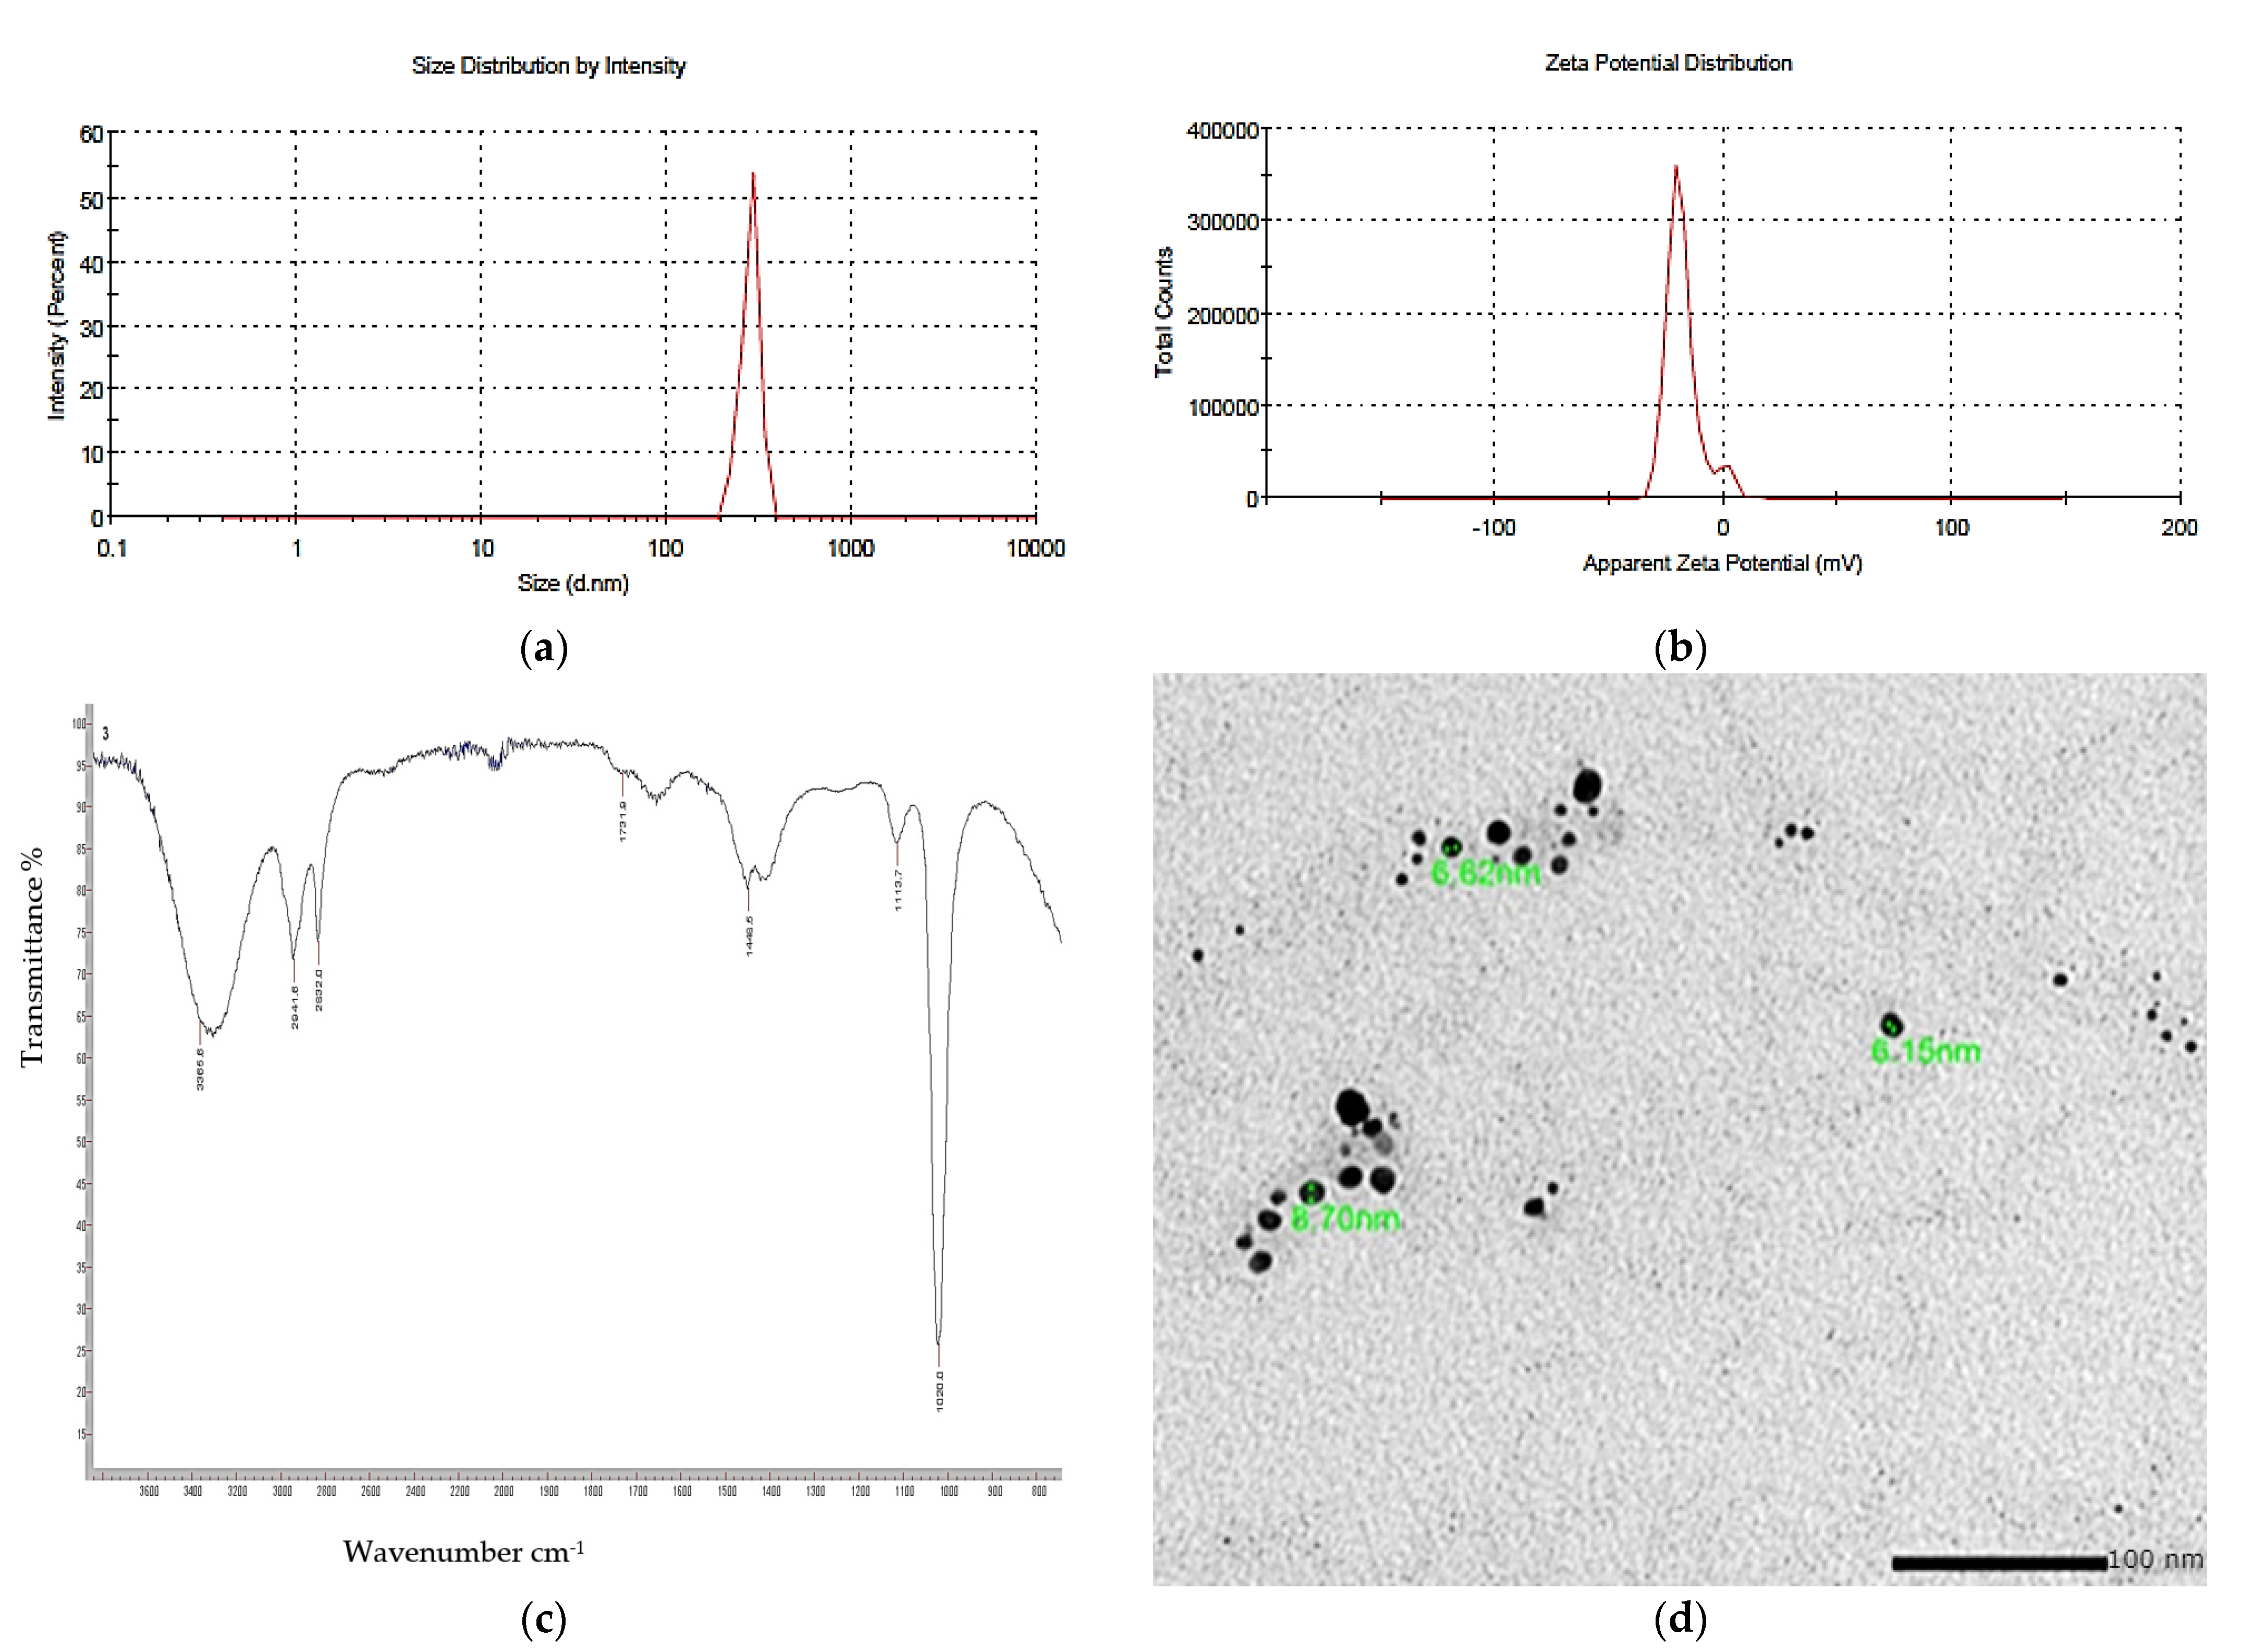
3.8. Nano-Pigment Synthesis and Characterization
3.9. Biological Activity of the Synthesized Nano-Echinenone
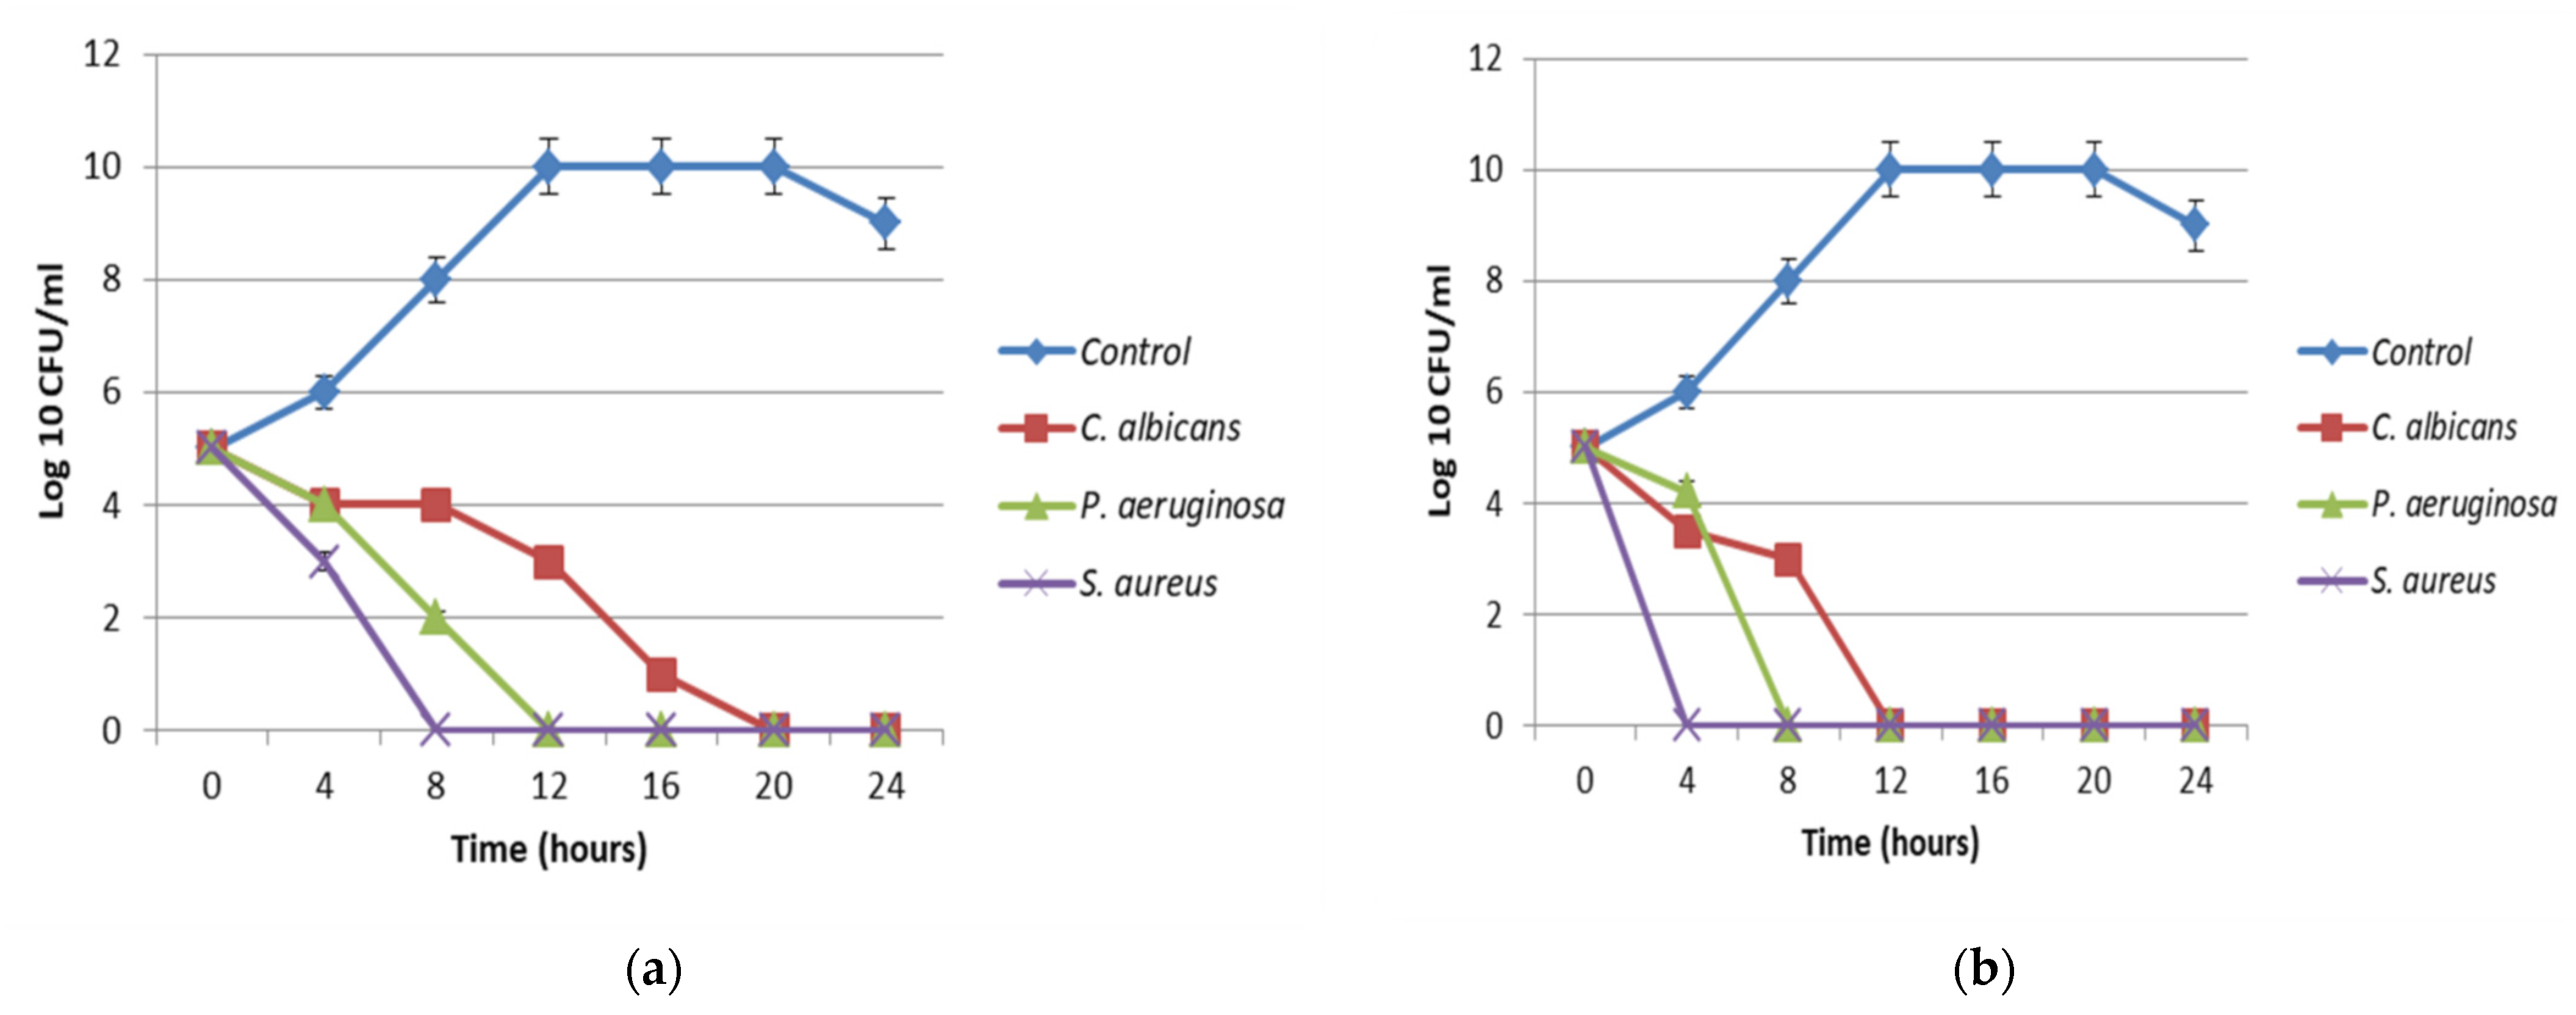
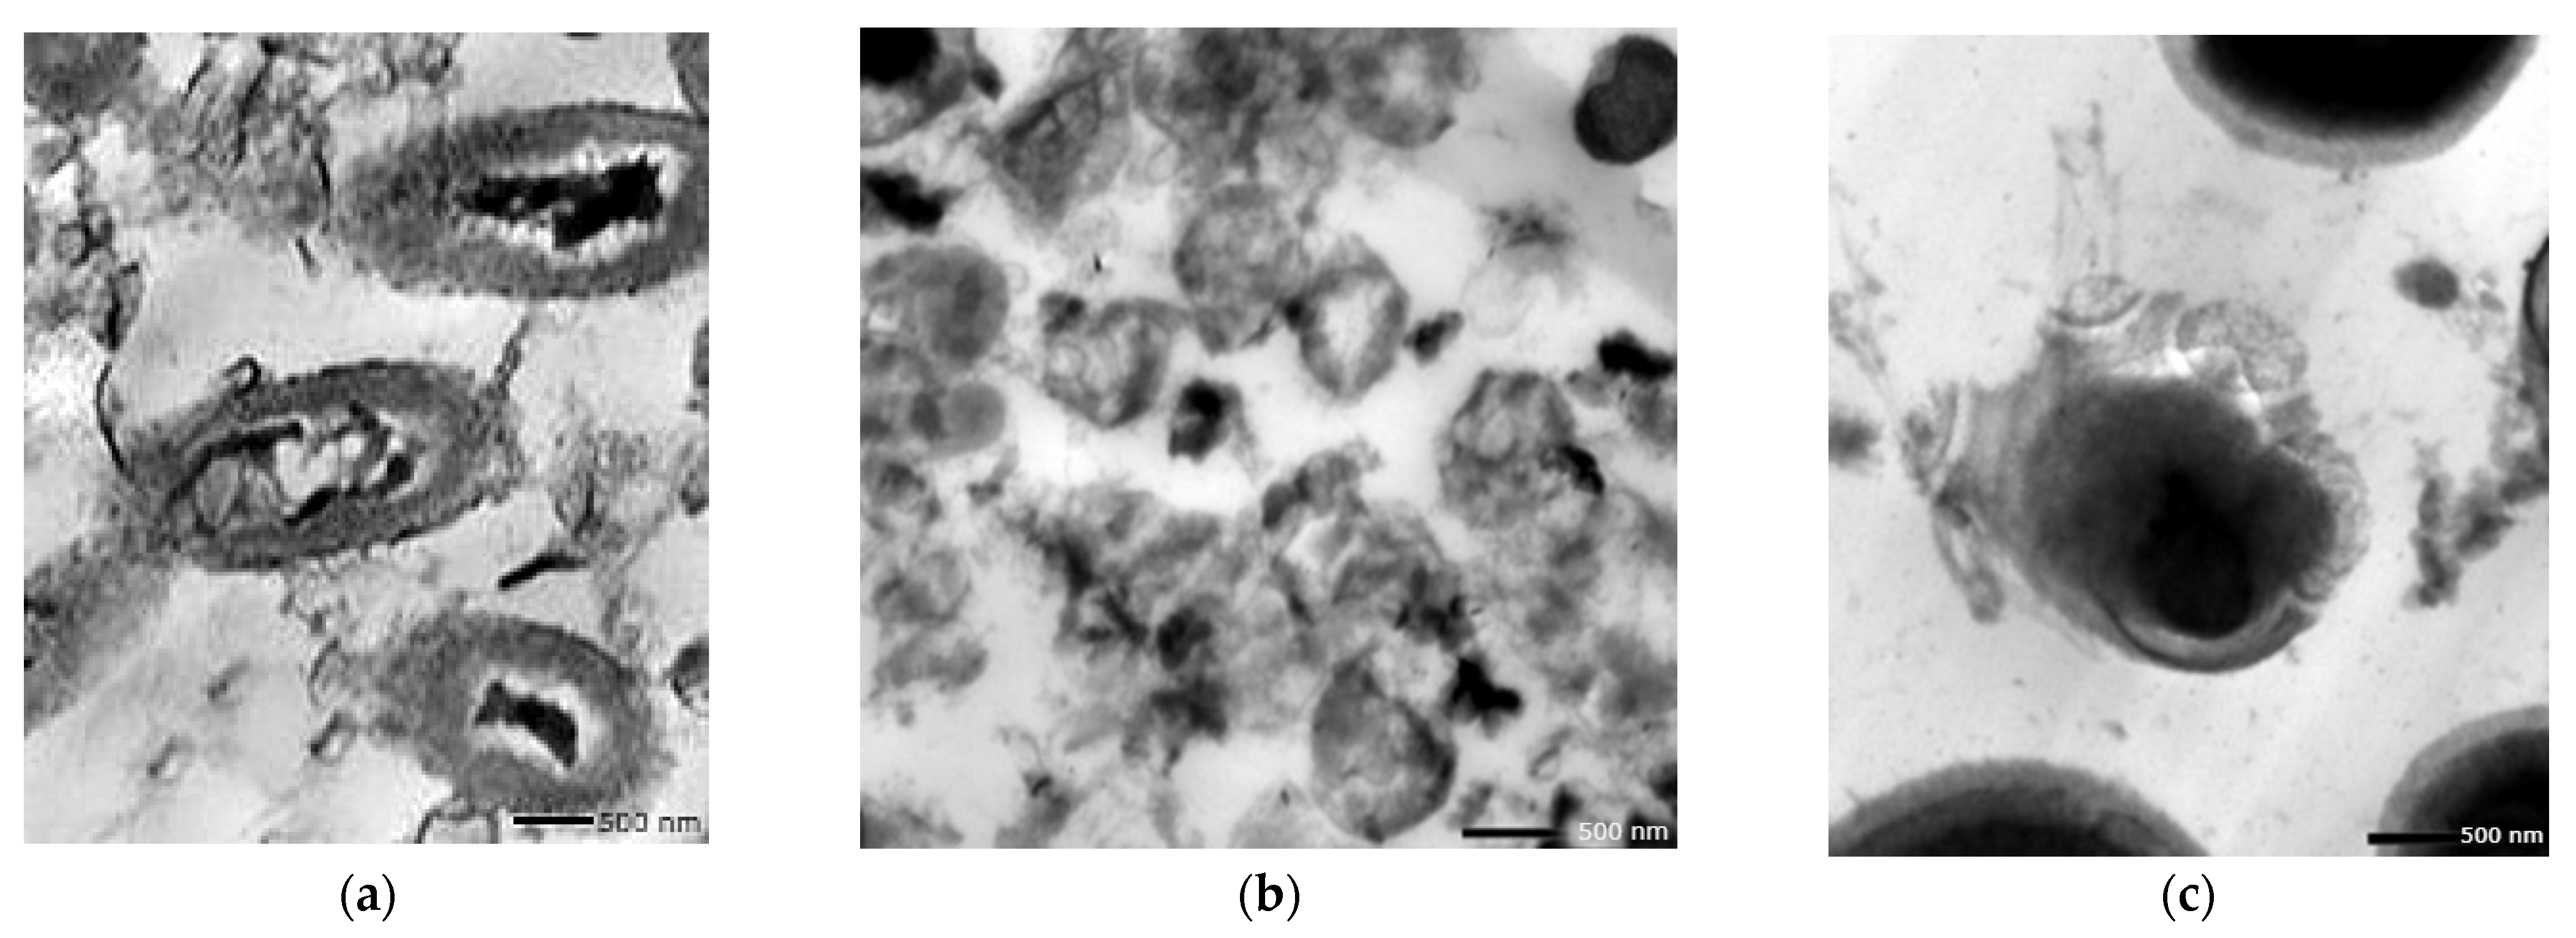
3.9.1. Antimicrobial Effect of the Nano-Echinenone
3.9.2. Antioxidant Activity
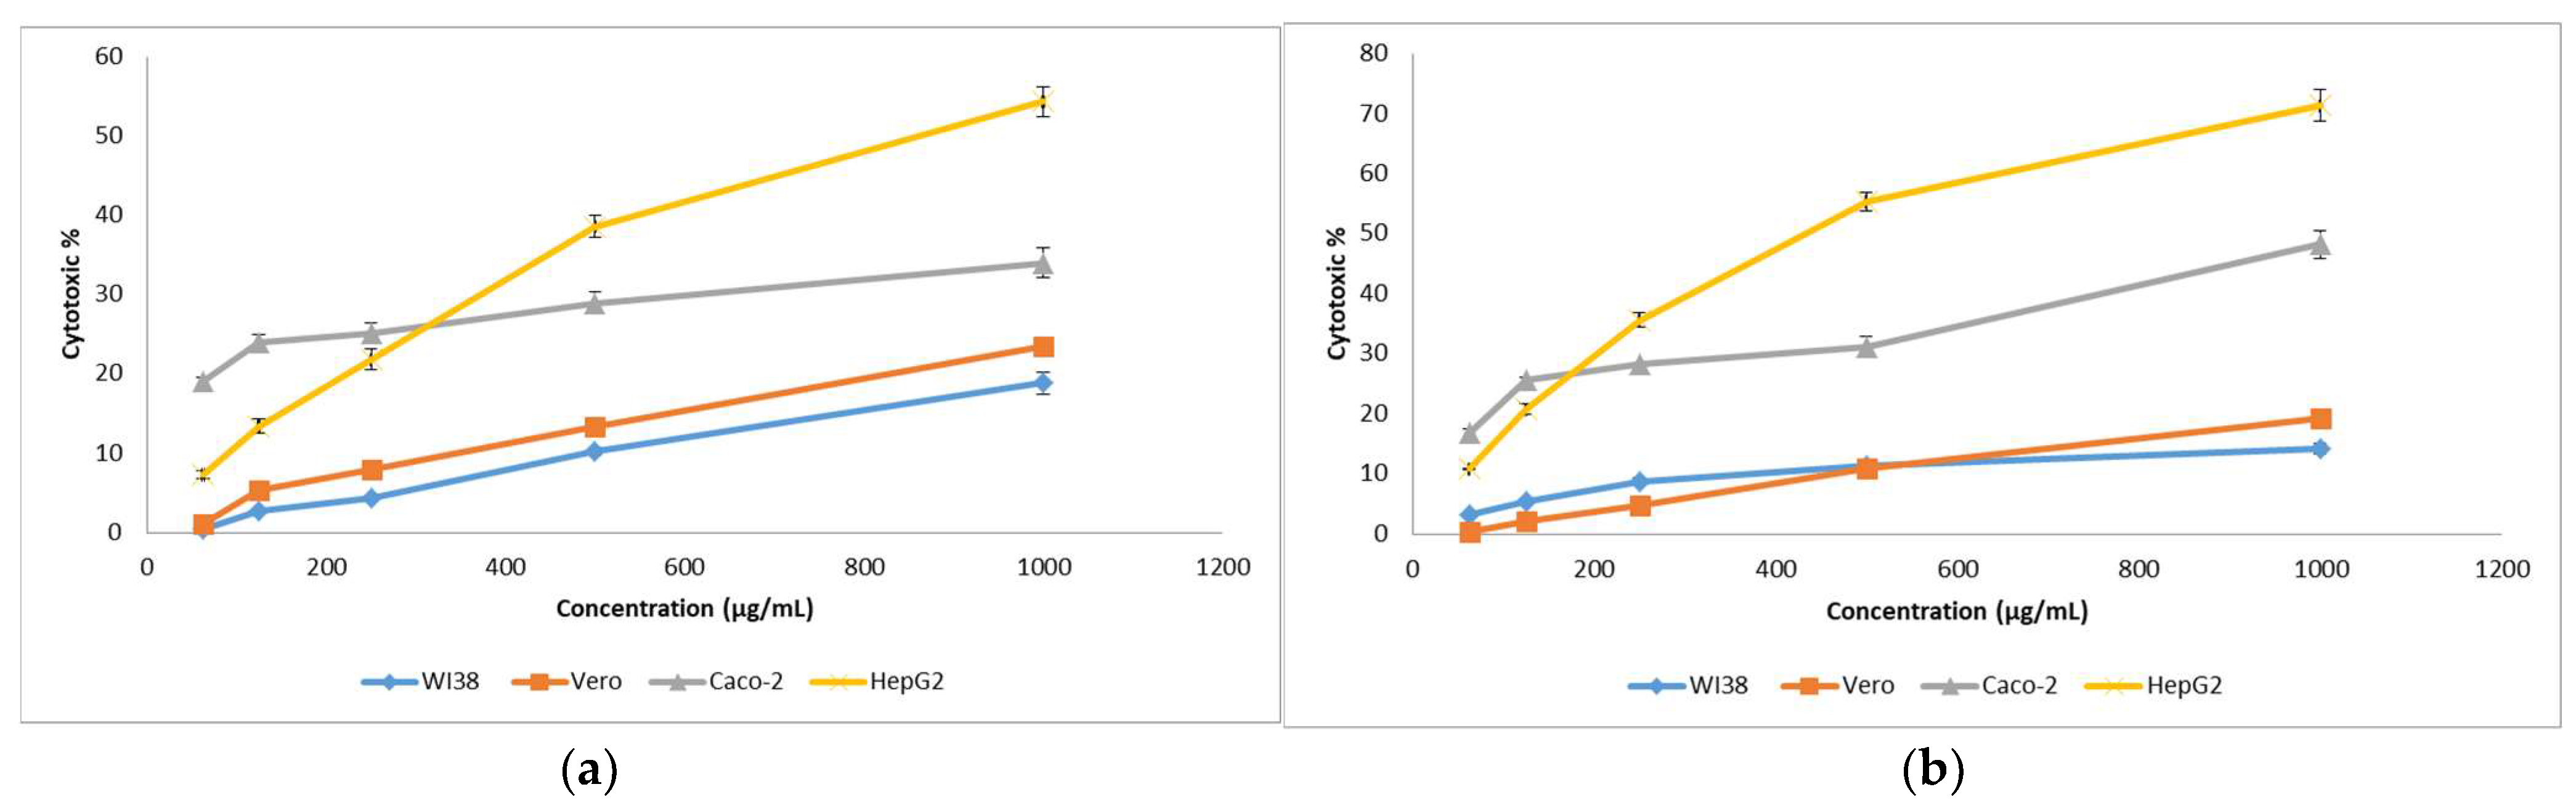
3.9.3. Cytotoxicity Assay against Human Cancer Cell Lines
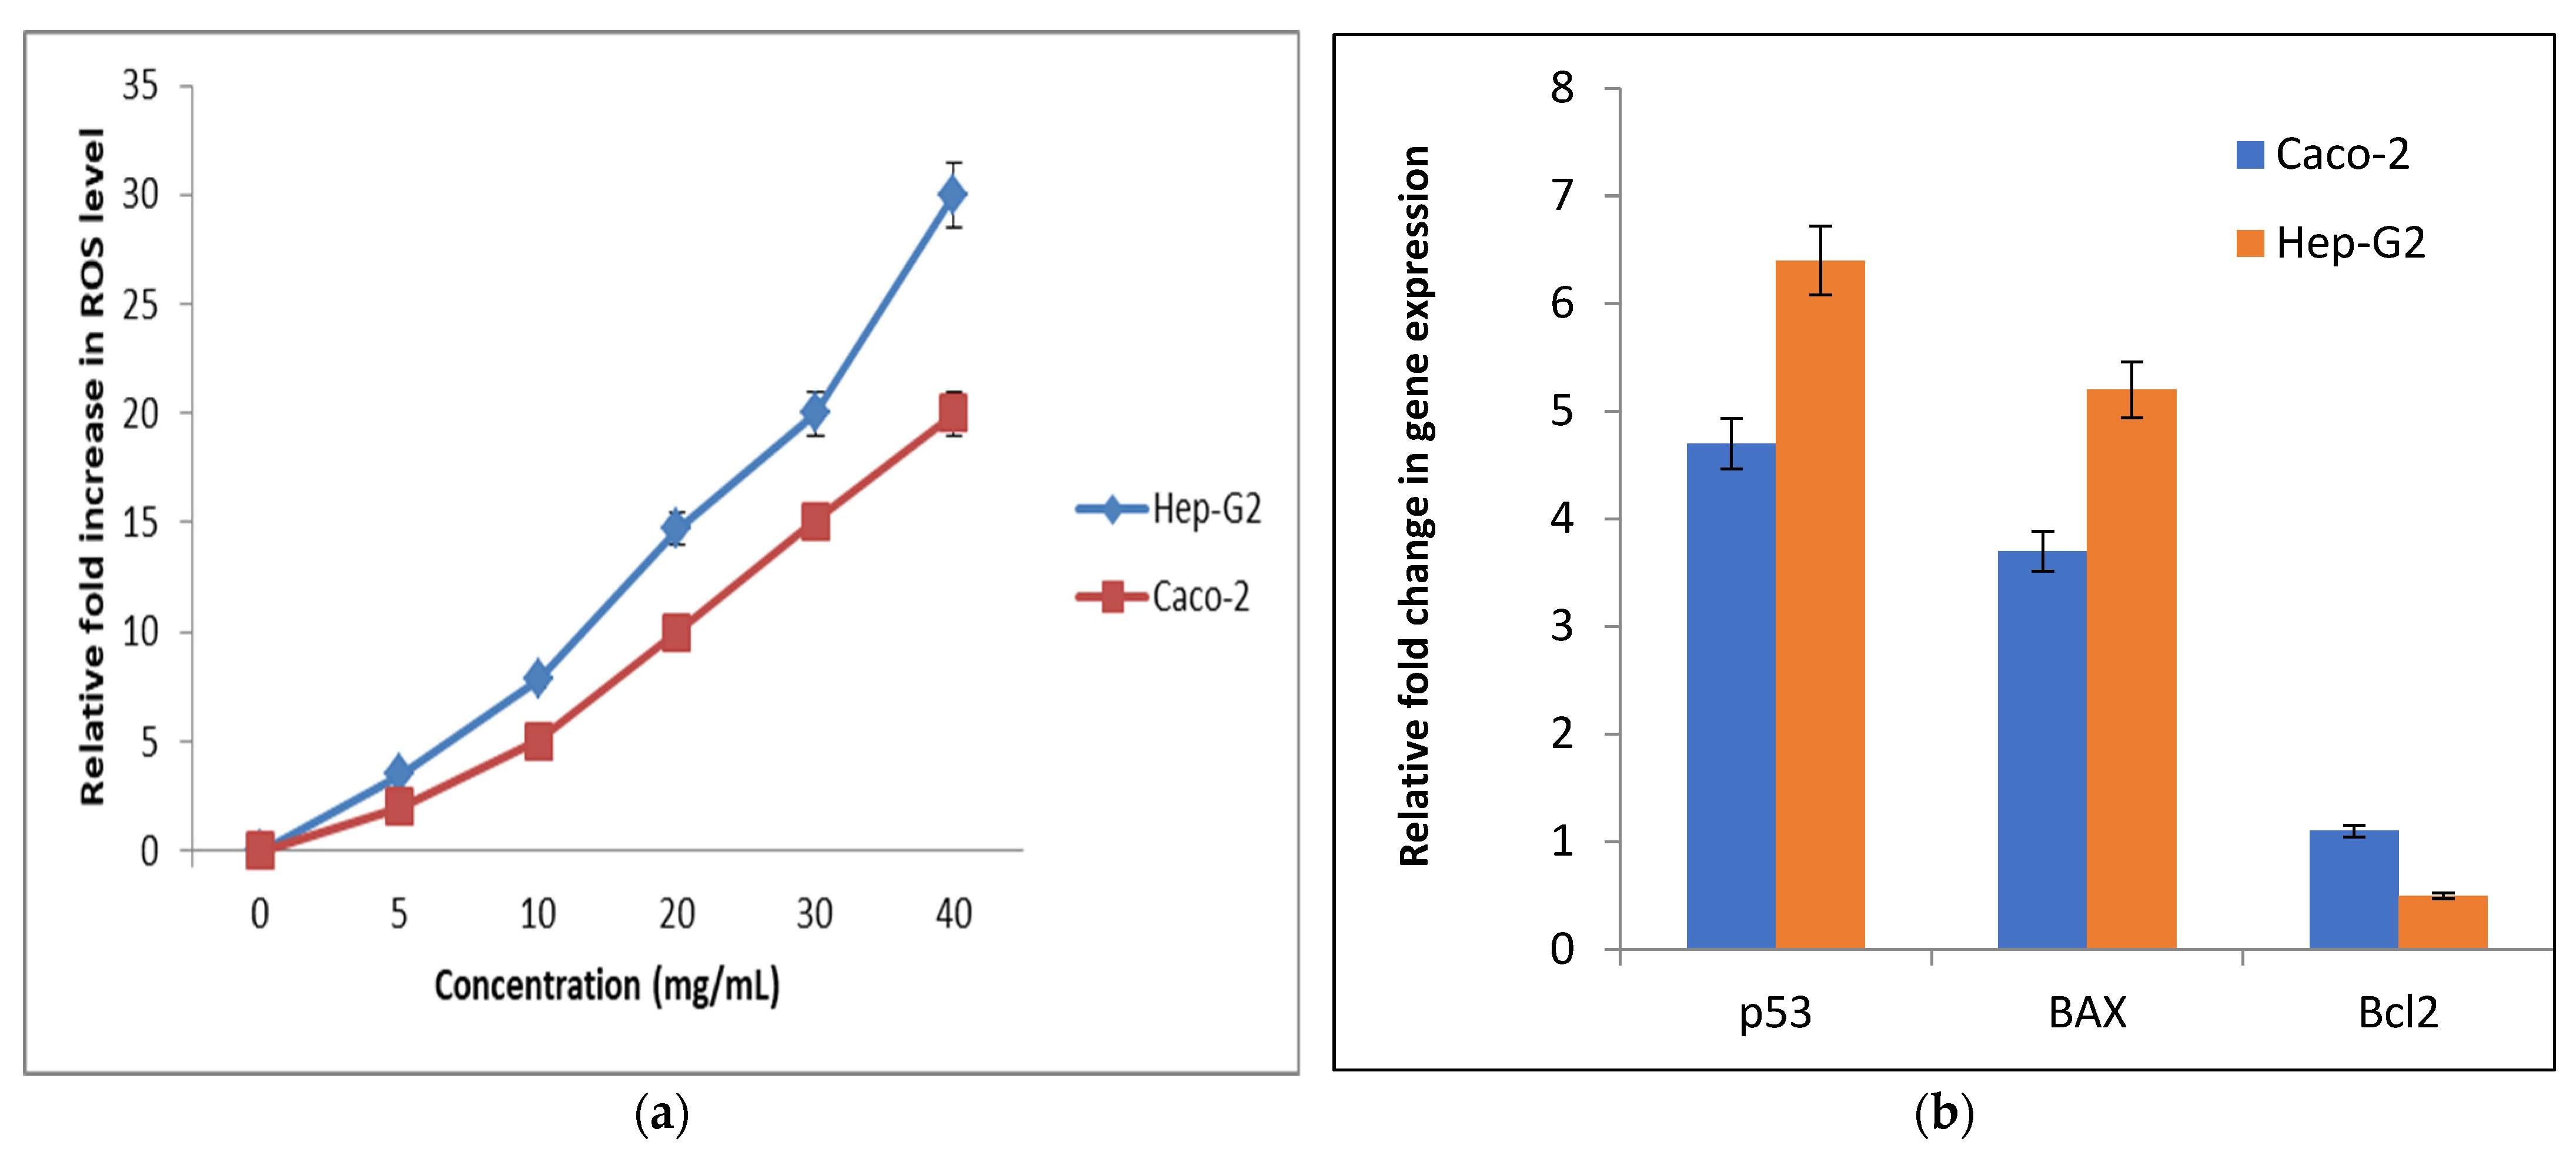
Determination of Cellular Reactive Oxygen Species (ROS)
Relative Changes in the Genetic Expression of Proapoptotic (p53 and BAX) and Anti-Apoptotic (Bcl2) Genes
4. Conclusions
Supplementary Materials
Author Contributions
Funding
Institutional Review Board Statement
Informed Consent Statement
Data Availability Statement
Conflicts of Interest
References
- Behera, H.T.; Mojumdar, A.; Nivedita, S.; Ray, L. Microbial Pigments: Secondary Metabolites with Multifaceted Roles. In Microbial Polymers; Vaishnav, A., Choudhary, D.K., Eds.; Springer: Singapore, 2021; pp. 631–654. [Google Scholar]
- Poddar, K.; Padhan, B.; Sarkar, D.; Sarkar, A. Purification and optimization of pink pigment produced by newly isolated bacterial strain Enterobacter sp. PWN1. SN Appl. Sci. 2021, 3, 105. [Google Scholar] [CrossRef]
- Narsing Rao, M.P.; Xiao, M.; Li, W.J. Fungal and bacterial pigments: Secondary metabolites with wide applications. Front. Microbiol. 2017, 8, 1113. [Google Scholar] [CrossRef] [PubMed]
- Venil, C.K.; Zakaria, Z.A.; Ahmad, W.A. Bacterial pigments and their applications. Process Biochem. 2013, 48, 1065–1079. [Google Scholar] [CrossRef]
- Park, H.; Park, S.; Yang, Y.H.; Choi, K.Y. Microbial synthesis of violacein pigment and its potential applications. Crit. Rev. Biotechnol. 2021, 41, 879–901. [Google Scholar] [CrossRef]
- Venkatachalam, P.; Nadumane, V.K. Enhanced production of an Anti-Cancer pigment from Bacillus endophyticus JUPR15: Single factor system Vs RSM. Res. J. Pharm. Technol. 2021, 14, 153–161. [Google Scholar] [CrossRef]
- Subramaniam, K.; Shaharuddin, N.A.; Tengku-Mazuki, T.A.; Zulkharnain, A.; Khalil, K.A.; Convey, P.; Ahmad, S.A. Statistical optimisation for enhancement of phenol biodegradation by the Antarctic soil bacterium Arthrobacter sp. strain AQ5-15 using response surface methodology. J. Environ. Biol. 2020, 41, 1560–1569. [Google Scholar] [CrossRef]
- Baláž, P.; Achimovičová, M.; Baláž, M.; Billik, P.; Cherkezova-Zheleva, Z.; Criado, J.M.; Delogu, F.; Dutková, E.; Gaffet, E.; Gotor, F.J.; et al. Hallmarks of mechanochemistry: From nanoparticles to technology. Chem. Soc. Rev. 2013, 42, 7571–7637. [Google Scholar] [CrossRef] [Green Version]
- Delogu, F.; Gorrasi, G.; Sorrentino, A. Fabrication of polymer nanocomposites via ball milling: Present status and future perspectives. Prog. Mater. Sci. 2017, 86, 75–126. [Google Scholar] [CrossRef]
- Qayyum, S.; Basharat, S.; Mian, A.H.; Qayum, S.; Ali, M.; Changsheng, P.; Shahzad, M.; Sultan, F. Isolation, identification, and antibacterial study of pigmented bacteria. Appl. Nanosci. 2020, 10, 4495–4503. [Google Scholar] [CrossRef]
- Mahmoud, A.; Afifi, M.M.; El Shenawy, F.; Salem, W.; Elesawy, B.H. Syzygium aromaticum Extracts as a Potential Antibacterial Inhibitors against Clinical Isolates of Acinetobacter baumannii: An In-Silico-Supported In-Vitro Study. Antibiotics 2021, 10, 1062. [Google Scholar] [CrossRef]
- Kumari, K.S.; Shivakrishna, P.; Al-Attar, A.M.; Ganduri, V.R. Antibacterial and cytotoxicity activities of bioactive compounds from Micrococcus species OUS9 isolated from sea water. J. King Saud Univ. Sci. 2020, 32, 2818–2825. [Google Scholar] [CrossRef]
- Shukla, M.; Nadumane, V.K. Yellow pigment from a novel bacteria, Micrococcus terreus, activates caspases and leads to apoptosis of cervical and liver cancer cell lines. J. Appl. Pharm. Sci. 2021, 11, 077–084. [Google Scholar]
- Loh, W.L.C.; Huang, K.C.; Ng, H.S.; Lan, J.C.W. Exploring the fermentation characteristics of a newly isolated marine bacteria strain, Gordonia terrae TWRH01 for carotenoids production. J. Biosci. Bioeng. 2020, 130, 187–194. [Google Scholar] [CrossRef] [PubMed]
- Keekan, K.K.; Hallur, S.; Modi, P.K.; Shastry, R.P. Antioxidant activity and role of culture condition in the optimization of red pigment production by Talaromyces purpureogenus KKP through response surface methodology. Curr. Microbiol. 2020, 77, 1780–1789. [Google Scholar] [CrossRef] [PubMed]
- Flores-Velázquez, V.; Córdova-Pérez, G.E.; Silahua-Pavón, A.A.; Torres-Torres, J.G.; Sierra, U.; Fernández, S.; Godavarthi, S.; Ortiz-Chi, F.; Espinosa-González, C.G. Cellulose obtained from banana plant waste for catalytic production of 5-HMF: Effect of grinding on the cellulose properties. Fuel 2020, 265, 116857. [Google Scholar] [CrossRef]
- Elnaggar, Y.S.; Elwakil, B.H.; Elshewemi, S.S.; El-Naggar, M.Y.; Bekhit, A.A.; Olama, Z.A. Novel Siwa propolis and colistin-integrated chitosan nanoparticles: Elaboration; in vitro and in vivo appraisal. Nanomedicine 2020, 15, 1269–1284. [Google Scholar] [CrossRef] [PubMed]
- Aljohani, F.S.; Hamed, M.T.; Bakr, B.A.; Shahin, Y.H.; Abu-Serie, M.M.; Awaad, A.K.; El-Kady, H.; Elwakil, B.H. In vivo bio-distribution and acute toxicity evaluation of greenly synthesized ultra-small gold nanoparticles with different biological activities. Sci. Rep. 2022, 12, 6269. [Google Scholar] [CrossRef]
- Elnahas, R.A.; Elwakil, B.H.; Elshewemi, S.S.; Olama, Z.A. Egyptian Olea europaea leaves bioactive extract: Antibacterial and wound healing activity in normal and diabetic rats. J. Tradit. Complement. Med. 2021, 11, 427–434. [Google Scholar] [CrossRef]
- Al-Shun, S.A.; El-Senduny, F.F.; Ismail, M.A.; El-Sayed, W.M.; Badria, F.A.; Youssef, M.M. Anticancer activity of new cationic arylthiophenes against hepatocellular carcinoma. Life Sci. 2021, 269, 119028. [Google Scholar] [CrossRef] [PubMed]
- Fuloria, S.; Subramaniyan, V.; Karupiah, S.; Kumari, U.; Sathasivam, K.; Meenakshi, D.U.; Wu, Y.S.; Sekar, M.; Chitranshi, N.; Malviya, R.; et al. Comprehensive review of methodology to detect reactive oxygen species (ROS) in mammalian species and establish its relationship with antioxidants and cancer. Antioxidants 2021, 10, 128. [Google Scholar] [CrossRef]
- Paeng, S.H.; Park, W.S.; Jung, W.K.; Lee, D.S.; Kim, G.Y.; Choi, Y.H.; Seo, S.-K.; Jang, W.H.; Choi, J.S.; Lee, Y.-M.; et al. YCG063 inhibits Pseudomonas aeruginosa LPS-induced inflammation in human retinal pigment epithelial cells through the TLR2-mediated AKT/NF-κB pathway and ROS-independent pathways. Int. J. Mol. Med. 2015, 36, 808–816. [Google Scholar] [CrossRef] [PubMed] [Green Version]
- Hassankhani, R.; Sam, M.R.; Esmaeilou, M.; Ahangar, P. Prodigiosin isolated from cell wall of Serratia marcescens alters expression of apoptosis-related genes and increases apoptosis in colorectal cancer cells. Med. Oncol. 2015, 32, 366. [Google Scholar] [CrossRef] [PubMed]
- Goswami, G.; Chaudhuri, S.; Dutta, D. Effect of pH and temperature on pigment production from an isolated bacterium. Chem. Eng. Trans. 2010, 20, 127–132. [Google Scholar]
- Zohari, M.; Sepahy, A.A.; Amini, K. Molecular Cloning and Anti-Cancer Activity of Carotenoid Pigments Isolated from Micrococcus spp. and Rhodotorula spp. J. Sci. Islamic Repub. Iran 2021, 32, 29–37. [Google Scholar]
- Wang, M.H.; Wang, R.Y.; Wei, X.Y.; Zhao, W.; Fan, X. Molecular characteristics of the oxidation products of a lignite based on the big data obtained from Fourier transform ion cyclotron resonance mass spectrometry. Fuel 2021, 295, 120644. [Google Scholar] [CrossRef]
- Salares, V.R.; Young, N.M.; Carey, P.R.; Bernstein, H.J. Excited state (excitation) interactions in polyene aggregates. Resonance Raman and absorption spectroscopic evidence. J. Raman Spectrosc. 1977, 6, 282–288. [Google Scholar] [CrossRef]
- Mendes-Pinto, M.M.; Sansiaume, E.; Hashimoto, H.; Pascal, A.A.; Gall, A.; Robert, B. Electronic absorption and ground state structure of carotenoid molecules. J. Phys. Chem. B 2013, 117, 11015–11021. [Google Scholar] [CrossRef] [PubMed]
- Kish, E.; Pinto, M.M.M.; Kirilovsky, D.; Spezia, R.; Robert, B. Echinenone vibrational properties: From solvents to the orange carotenoid protein. Biochim. Et Biophys. Acta BBA Bioenerg. 2015, 1847, 1044–1054. [Google Scholar] [CrossRef]
- Zohari, M.; Sepahy, A.A.; Amini, K. Optimization of Culture Conditions and Carotenoid Pigments production by Micrococcus spp. and Rhodotorula spp. J. Microb. World 2020, 13, 228–238. [Google Scholar]
- Fariq, A.; Yasmin, A.; Jamil, M. Production, characterization, and antimicrobial activities of bio-pigments by Aquisalibacillus elongatus MB592, Salinicoccus sesuvii MB597, and Halomonas aquamarina MB598 isolated from Khewra Salt Range, Pakistan. Extremophiles 2019, 23, 435–449. [Google Scholar] [CrossRef] [PubMed]
- Bhosale, P. Environmental and cultural stimulates in the production of carotenoids from microorganism. Appl. Microbiol. Biotechnol. 2004, 63, 351–361. [Google Scholar] [CrossRef]
- Rashid, M.M.; Fakruddin, M.; Mazumdar, R.M.; Kaniz, F.; Chowdhury, M.A. Anti-bacterial activity of pigments isolated from pigment-forming soil bacteria. J. Pharm. Res. Int. 2014, 4, 880–894. [Google Scholar] [CrossRef]
- Sibero, M.T.; Bachtiarini, T.U.; Trianto, A.; Lupita, A.H.; Sari, D.P.; Igarashi, Y.; Harunari, E.; Sharma, A.R.; Radjasa, O.K.; Sabdono, A. Characterization of a yellow pigmented coral-associated bacterium exhibiting anti-bacterial activity against multidrug resistant (MDR) organism. Egypt J. Aquat. Res. 2019, 45, 81–87. [Google Scholar] [CrossRef]
- Khanam, B.; Chandra, R. Comparative analysis of prodigiosin isolated from endophyte Serratia marcescens. Lett. Appl. Microbiol. 2018, 66, 194–201. [Google Scholar] [CrossRef]
- Mumtaz, R.; Bashir, S.; Numan, M.; Shinwari, Z.K.; Ali, M. Pigments from soil bacteria and their therapeutic properties: A mini review. Curr. Microbiol. 2019, 76, 783–790. [Google Scholar] [CrossRef]
- Heer, K.; Sharma, S. Microbial pigments as a natural color: A review. Int. J. Pharm. Sci. Res. 2017, 8, 1913–1922. [Google Scholar]
- Selvameenal, L.; Radhakrishnan, M.; Balagurunathan, R. Antibiotic pigment from desert soil actinomycetes; biological activity, purification, and chemical screening. Indian J. Pharm. Sci. 2009, 71, 499. [Google Scholar]
- Arulselvi, P.I.; Umamaheswari, S.; Ranandkumar, S.G.; Karthik, C.; Jayakrishna, C. Screening of yellow pigment producing bacterial isolates from various eco-climatic areas and analysis of the carotenoid produced by the isolate. Food Processing Technol. 2014, 5, 1000292. [Google Scholar]
- Sasidharan, P.; Raja, R.; Karthik, C.; Sharma, R.; Arulselvi, P.I. Isolation and characterization of yellow pigment producing Exiguobacterium sps. J. Biochem. Tech. 2013, 4, 632–635. [Google Scholar]
- Zare, M.; Norouzi Roshan, Z.; Assadpour, E.; Jafari, S.M. Improving the cancer prevention/treatment role of carotenoids through various nano-delivery systems. Crit. Rev. Food Sci. Nutr. 2021, 61, 522–534. [Google Scholar] [CrossRef] [PubMed]
- Siegel, R.L.; Miller, K.D.; Jemal, A. Cancer statistics. CA Cancer J. Clin. 2016, 66, 7–30. [Google Scholar] [CrossRef] [PubMed] [Green Version]
- Zhang, J.; Shen, Y.; Liu, J.; Wei, D. Antimetastatic effect of prodigiosin through inhibition of tumor invasion. Biochem. Pharm. 2005, 69, 407–414. [Google Scholar] [CrossRef]
- Han, A.R.; Park, J.W.; Lee, M.K.; Ban, Y.H.; Yoo, Y.J.; Kim, E.J.; Kim, E.; Kim, B.G.; Sohng, J.K.; Yoon, Y.J. Development of a Streptomyces venezuelae-based combinatorial biosynthetic system for the production of glycosylated derivatives of doxorubicin and its biosynthetic intermediates. Appl. Environ. Microbiol. 2011, 77, 4912–4923. [Google Scholar] [CrossRef] [PubMed] [Green Version]
- Kumar, B.N.V.; Kampe, B.; Rosch, P.; Popp, J. Characterization of carotenoids in soil bacteria and investigation of their photodegradation by UVA radiation via resonance Raman spectroscopy. Analst 2015, 140, 4584–4593. [Google Scholar] [CrossRef]

| Parameter | Coded Levels | ||||
|---|---|---|---|---|---|
| −2 | −1 | 0 | 1 | 2 | |
| Carbon source % (glucose) | 0.1 | 0.3 | 0.5 | 0.7 | 0.9 |
| Nitrogen source % (Aparagine) | 0.1 | 0.2 | 0.3 | 0.4 | 0.5 |
| Incubation time (days) | 2.0 | 3.0 | 4.0 | 5.0 | 6.0 |
| pH | 5.0 | 6.0 | 7.0 | 8.0 | 9.0 |
| Temperature (°C) | 15.0 | 20.0 | 25.0 | 30.0 | 35.0 |
| Tested Pathogens | Inhibition Zone Diameter (mm) ± SD | ||||||
|---|---|---|---|---|---|---|---|
| Pigment Producer | Isolate 1 | Isolate 2 | Isolate 3 | Isolate 4 | Isolate 5 | Isolate 6 | |
| Pseudomonas aeruginosa | 8.0 ± 0.21 | 8.0 ± 0.26 | 12.0 ± 0.2 | 8.0 ± 0.32 | 7.0 ± 0.1 | 9.0 ± 0.21 | |
| Acinetobacter baumannii | 8.0 ± 0.3 | 7.0 ± 0.21 | 10.0 ± 0.1 | 10.0 ± 0.25 | 0.0 ± 0 | 9.0 ± 0.19 | |
| MRSA | 8.0 ± 0.26 | 8.0 ± 0.13 | 11.0 ± 0.12 | 8.0 ± 0.22 | 7.0 ± 0 | 10.0 ± 0.25 | |
| Klebsiella pneumoniae | 9.0 ± 0.1 | 0.0 ± 0 | 10.0 ± 0.41 | 8.0 ± 0.33 | 0.0 ± 0.12 | 10.0 ± 0.27 | |
| Proteus vulgaris | 9.0 ± 0.2 | 7.0 ± 0.5 | 10.0 ± 0.35 | 7.0 ± 0.22 | 0.0 ± 0 | 10.0 ± 0.27 | |
| Listeria monocytogenes | 7.0 ± 0.2 | 8.0 ± 0.01 | 9.0 ± 0.25 | 9.0 ± 0.35 | 7.0 ± 0.12 | 9.0 ± 0.1 | |
| Escherichia coli | 7.0 ± 0.2 | 8.0 ± 0.29 | 9.0 ± 0.3 | 8.0 ± 0.1 | 7.0 ± 0.11 | 9.0 ± 0.15 | |
| Salmonella Typhi | 7.0 ± 0.3 | 8.0 ± 0.3 | 9.0 ± 0.41 | 8.0 ± 0.4 | 7.0 ± 0.11 | 9.0 ± 0.2 | |
| Candida albicans | 8.0 ± 0.4 | 0.0 ± 0 | 10.0 ± 0.42 | 8.0 ± 0.5 | 0.0 ± 0 | 9.0 ± 0.2 | |
| Staphylococcus aureus | 9.0 ± 0.45 | 8.0 ± 0.1 | 12.0 ± 0.26 | 0.0 ± 0 | 8.0 ± 0.25 | 10.0 ± 0.27 | |
| Trials | Time | Temp | pH | Carbon Source | Nitrogen Source | Inhibition Zone Diameter (mm) (R1) | Biomass Production Concentration (g/L) (R2) | Pigment Production Concentration (g/L) (R3) | ||
|---|---|---|---|---|---|---|---|---|---|---|
| Pseudomonas aeruginosa | Staphylococcus aureus | Candida albicans | ||||||||
| 1 | −1 | 1 | 1 | −1 | −1 | 6.0 ± 0 | 6.0 ± 0 | 6.0 ± 0.1 | 2.6 ± 0.1 | 0.1 ± 0.21 |
| 2 | 1 | 1 | 1 | 1 | −1 | 7.0 ± 0.1 | 7.5 ± 0.12 | 6.5 ± 0.12 | 3.2 ± 0.2 | 0.2 ± 0.32 |
| 3 | −1 | 1 | −1 | −1 | 1 | 11.5 ± 0.2 | 12.5 ± 0.2 | 11.5 ± 0.2 | 3.8 ± 0.21 | 0.65 ± 0.15 |
| 4 | −1 | −1 | 1 | −1 | −1 | 9.0 ± 0.2 | 10.0 ± 0.25 | 8.0 ± 0.24 | 3.4 ± 0.21 | 0.4 ± 0.21 |
| 5 | 1 | −1 | −1 | 1 | 1 | 10.0 ± 0.35 | 10.0 ± 0.41 | 10.0 ± 0.2 | 3.5 ± 0.1 | 0.5 ± 0.11 |
| 6 | 1 | 1 | 1 | −1 | 1 | 10.0 ± 0.32 | 10.0 ± 0.22 | 10.0 ± 0.41 | 3.5 ± 0.32 | 0.5 ± 0.13 |
| 7 | 1 | −1 | −1 | 1 | −1 | 9.0 ± 0.26 | 10.0 ± 0.21 | 8.0 ± 0.21 | 3.4 ± 0.35 | 0.4 ± 0.11 |
| 8 | 1 | −1 | 1 | 1 | −1 | 9.0 ± 0.24 | 10.0 ± 0.25 | 8.0 ± 0.22 | 3.4 ± 0.34 | 0.4 ± 0.05 |
| 9 | −1 | −1 | −1 | 1 | −1 | 7.0 ± 0.12 | 7.5 ± 0.01 | 6.5 ± 0 | 3.2 ± 0.32 | 0.2 ± 0.05 |
| 10 | 1 | 1 | 1 | −1 | −1 | 6.0 ± 0 | 6.0 ± 0 | 6.0 ± 0 | 2.7 ± 0.25 | 0.1 ± 0.01 |
| 11 | −1 | −1 | 1 | 1 | 1 | 8.0 ± 0.21 | 9.0 ± 0.21 | 8.0 ± 0.22 | 3.34 ± 0.21 | 0.3 ± 0.1 |
| 12 | 1 | 1 | −1 | 1 | 1 | 10.5 ± 0.3 | 11.0 ± 0.2 | 10.0 ± 0.41 | 3.56 ± 0.29 | 0.55 ± 0.1 |
| 13 | 1 | 1 | −1 | 1 | −1 | 10.0 ± 0.25 | 10.0 ± 0.24 | 9.0 ± 0.31 | 3.5 ± 0.42 | 0.5 ± 0.04 |
| 14 | −1 | 1 | −1 | 1 | 1 | 9.0 ± 0.21 | 9.0 ± 0.14 | 8.0 ± 0.56 | 3.4 ± 0.22 | 0.4 ± 0.12 |
| 15 | −1 | −1 | −1 | −1 | −1 | 6.0 ± 0.1 | 6.0 ± 0 | 6.0 ± 0 | 2.6 ± 0.33 | 0.1 ± 0.03 |
| 16 | 0 | 0 | 0 | 0 | 0 | 11.9 ± 0.26 | 12.0 ± 0.45 | 11.5 ± 0.2 | 3.9 ± 0.36 | 0.69 ± 0.21 |
| 17 | 0 | 0 | 0 | 0 | −2.37841 | 0.0 ± 0 | 0.0 ± 0 | 0.0 ± 0 | 0.1 ± 0.01 | 0.07 ± 0.01 |
| 18 | 1 | 1 | −1 | −1 | 1 | 9.0 ± 0.25 | 10.0 ± 0.2 | 9.0 ± 0.15 | 3.4 ± 0.31 | 0.4 ± 0.56 |
| 19 | 0 | 0 | 0 | −2.37841 | 0 | 0.0 ±0 | 0.0 ± 0 | 0.0 ± 0 | 0.1 ± 0 | 0.07 ± 0 |
| 20 | 0 | 0 | 0 | 0 | 2.37841 | 15.4 ± 0.2 | 20.0 ± 0.24 | 9.6 ± 0.47 | 4.12 ± 0.12 | 0.8 ± 0.1 |
| 21 | 0 | 0 | 0 | 0 | 0 | 11.9 ± 0.15 | 12.0 ± 0.25 | 11.0 ± 0.21 | 3.9 ± 0.21 | 0.69 ± 0.32 |
| 22 | −2.37841 | 0 | 0 | 0 | 0 | 0.0 ±0 | 0.0 ± 0 | 0.0 ± 0 | 0.1 ± 0.01 | 0.07 ± 0 |
| 23 | 1 | −1 | 1 | 1 | 1 | 11.0 ± 0.45 | 11.0 ± 0.54 | 10.0 ± 0.2 | 3.6 ± 0.21 | 0.6 ± 0.01 |
| 24 | −1 | −1 | −1 | −1 | 1 | 11.1 ±0.49 | 11.5 ± 0.52 | 10.0 ± 0.21 | 3.6 ± 0.21 | 0.6 ± 0.01 |
| 25 | 0 | 0 | −2.37841 | 0 | 0 | 8.0 ± 0.51 | 8.0 ± 0.25 | 8.0 ± 0.19 | 3.34 ± 0.21 | 0.3 ± 0.01 |
| 26 | 0 | 2.37841 | 0 | 0 | 0 | 6.8 ± 0.01 | 7.0 ± 0.32 | 5.0 ± 0 | 3.0 ± 0.25 | 0.18 ± 0 |
| 27 | −1 | 1 | −1 | 1 | −1 | 8.0 ± 0.17 | 9.0 ± 0.21 | 7.0± 0.1 | 3.34 ± 0.35 | 0.3 ± 0.03 |
| 28 | 0 | 0 | 0 | 0 | 0 | 11.9 ± 0.14 | 12.0 ± 0.28 | 11.0 ± 0.45 | 3.9 ±0.64 | 0.69 ± 0.35 |
| 29 | 0 | 0 | 0 | 0 | 0 | 11.9± 0.14 | 12.0 ± 0.28 | 10.0 ± 0.15 | 3.9 ± 0.63 | 0.69 ± 0.32 |
| 30 | 1 | −1 | 1 | −1 | −1 | 11.0 ±0.45 | 12.0 ± 0.31 | 9.0 ± 0.32 | 3.6 ± 0.25 | 0.6 ± 0.01 |
| 31 | 0 | 0 | 0 | 0 | 0 | 11.9 ± 0.14 | 12.5 ± 0.25 | 11.0 ± 0.56 | 3.9 ± 0.21 | 0.69 ± 0 |
| 32 | 1 | −1 | 1 | −1 | 1 | 11.0 ± 0.45 | 11.0 ± 0.21 | 10.0 ± 0.48 | 3.6 ± 0.32 | 0.6 ± 0 |
| 33 | 0 | 0 | 0 | 0 | 0 | 11.9 ± 0.15 | 12.4 ± 0.35 | 9.0 ± 0.37 | 3.9 ± 0.41 | 0.69 ± 0.1 |
| 34 | −1 | 1 | 1 | −1 | 1 | 8.0 ± 0.21 | 8.0 ± 0.24 | 8.0 ± 0.32 | 3.34 ± 0.65 | 0.3 ± 0 |
| 35 | −1 | 1 | 1 | 1 | 1 | 8.0 ± 0.22 | 8.0 ± 0.21 | 8.0 ± 0.31 | 3.34 ± 0.45 | 0.3 ± 0.02 |
| 36 | −1 | −1 | 1 | −1 | 1 | 8.0 ± 0.22 | 8.0 ± 0.45 | 8.0 ± 0.48 | 2.8 ± 0.21 | 0.14 ± 0 |
| 37 | 1 | −1 | −1 | −1 | −1 | 10.0 ± 0.31 | 10.0 ± 0.32 | 8.0 ± 0.5 | 3.34 ± 0.24 | 0.3 ± 0.02 |
| 38 | 1 | 1 | −1 | −1 | −1 | 11.0 ± 0.34 | 11.0 ± 0.34 | 10.0 ± 0.3 | 3.5 ± 0.64 | 0.5 ± 0 |
| 39 | 1 | −1 | −1 | −1 | 1 | 11.7 ± 0.32 | 11.9 ± 0.45 | 9.0 ± 0.25 | 3.6 ± 0.49 | 0.6 ± 0 |
| 40 | 0 | −2.37841 | 0 | 0 | 0 | 0.0 ± 0 | 0.0 ± 0 | 0.0 ± 0 | 3.85 ± 0.25 | 0.67 ± 0 |
| 41 | −1 | −1 | −1 | 1 | 1 | 11.7 ± 0.11 | 11.8 ± 0.24 | 9.4 ± 0.35 | 3.85 ± 0.32 | 0.67 ± 0.1 |
| 42 | −1 | 1 | −1 | −1 | −1 | 8.0 ± 0.23 | 8.5 ± 0.54 | 7.0 ± 0.12 | 3.34 ± 0.32 | 0.3 ± 0 |
| 43 | 0 | 0 | 2.37841 | 0 | 0 | 6.0 ± 0.02 | 6.0 ± 0.24 | 6.0 ± 0 | 2.6 ± 0.23 | 0.1 ± 0 |
| 44 | −1 | 1 | 1 | 1 | −1 | 9.0 ± 0.42 | 8.3 ± 0.51 | 7.6 ± 0.1 | 3.4 ± 0.21 | 0.4 ± 0.1 |
| 45 | 0 | 0 | 0 | 2.37841 | 0 | 11.9 ± 0.26 | 12.5 ± 0.26 | 11.2 ± 0.47 | 3.9 ± 0.36 | 0.69 ± 0.25 |
| 46 | 0 | 0 | 0 | 0 | 0 | 11.9 ± 0.15 | 12.0 ± 0.54 | 11.0 ± 0.42 | 3.9 ± 0.25 | 0.69 ± 0 |
| 47 | 2.37841 | 0 | 0 | 0 | 0 | 0.0 ± 0 | 0.0 ± 0 | 0.0 ± 0 | 0.1 ± 0 | 0.07 ± 0 |
| 48 | −1 | −1 | 1 | 1 | −1 | 10.0 ± 0.2 | 10.0 ± 0.21 | 8.0 ± 0.48 | 3.5 ± 0.21 | 0.5 ±0.01 |
| 49 | 1 | 1 | 1 | 1 | 1 | 11.5 ± 0.32 | 11.9 ± 0.32 | 11.0 ± 0.35 | 3.8 ± 0.35 | 0.65 ± 0.1 |
| 50 | 0 | 0 | 0 | 0 | 0 | 11.9 ± 0.25 | 12.0 ± 0.61 | 11.0 ± 0.34 | 3.9 ± 0.32 | 0.69 ± 0.12 |
| Tested Pathogens | Optimized Pigment of Micrococcus lylae MW407006 | ||
|---|---|---|---|
| MIC (μg/mL) | MBC (μg/mL) | MIC Index | |
| Pseudomonas aeruginosa | 32.0 | 256.0 | 8.0 |
| Staphylococcus aureus | 16.0 | 128.0 | 8.0 |
| Candida albicans | 64.0 | 512.0 | 8.0 |
| Tested Pathogen | Antimicrobial Effect | |||
|---|---|---|---|---|
| IZ (mm) | MIC (μg/mL) | MBC (μg/mL) | MIC Index | |
| Pseudomonas aeruginosa | 20.0 ± 0.17 | 20.0 | 150.0 | 7.5 |
| Staphylococcus aureus | 25.0 ± 0.42 | 7.0 | 100.0 | 14.2 |
| Candida albicans | 20.0 ± 0.09 | 20.0 | 150.0 | 7.5 |
| Sample | IC 50 (µg/mL) | Caco-2 Selectivity Index with | HEPG2 Selectivity Index with | |||||
|---|---|---|---|---|---|---|---|---|
| WI38 | Vero | Caco-2 | HepG2 | Vero | WI38 | Vero | WI38 | |
| Echinenone | 2645 | 2128 | 1496.4 | 920.8 | 1.422 | 1.768 | 2.311 | 2.87 |
| Nano-echinenone | 3521 | 2604 | 1537 | 450.1 | 1.694 | 2.29 | 5.785 | 7.822 |
Publisher’s Note: MDPI stays neutral with regard to jurisdictional claims in published maps and institutional affiliations. |
© 2022 by the authors. Licensee MDPI, Basel, Switzerland. This article is an open access article distributed under the terms and conditions of the Creative Commons Attribution (CC BY) license (https://creativecommons.org/licenses/by/4.0/).
Share and Cite
Shahin, Y.H.; Elwakil, B.H.; Ghareeb, D.A.; Olama, Z.A. Micrococcus lylae MW407006 Pigment: Production, Optimization, Nano-Pigment Synthesis, and Biological Activities. Biology 2022, 11, 1171. https://doi.org/10.3390/biology11081171
Shahin YH, Elwakil BH, Ghareeb DA, Olama ZA. Micrococcus lylae MW407006 Pigment: Production, Optimization, Nano-Pigment Synthesis, and Biological Activities. Biology. 2022; 11(8):1171. https://doi.org/10.3390/biology11081171
Chicago/Turabian StyleShahin, Yahya H., Bassma H. Elwakil, Doaa A. Ghareeb, and Zakia A. Olama. 2022. "Micrococcus lylae MW407006 Pigment: Production, Optimization, Nano-Pigment Synthesis, and Biological Activities" Biology 11, no. 8: 1171. https://doi.org/10.3390/biology11081171
APA StyleShahin, Y. H., Elwakil, B. H., Ghareeb, D. A., & Olama, Z. A. (2022). Micrococcus lylae MW407006 Pigment: Production, Optimization, Nano-Pigment Synthesis, and Biological Activities. Biology, 11(8), 1171. https://doi.org/10.3390/biology11081171