
Cardiovascular Stress and Characteristics of Cold-Induced Vasodilation in Women and Men during Cold-Water Immersion: A Randomized Control Study

 , , , , and
Abstract
:Simple Summary
Abstract
1. Introduction
2. Materials and Methods
2.1. Ethical Approval and Participants
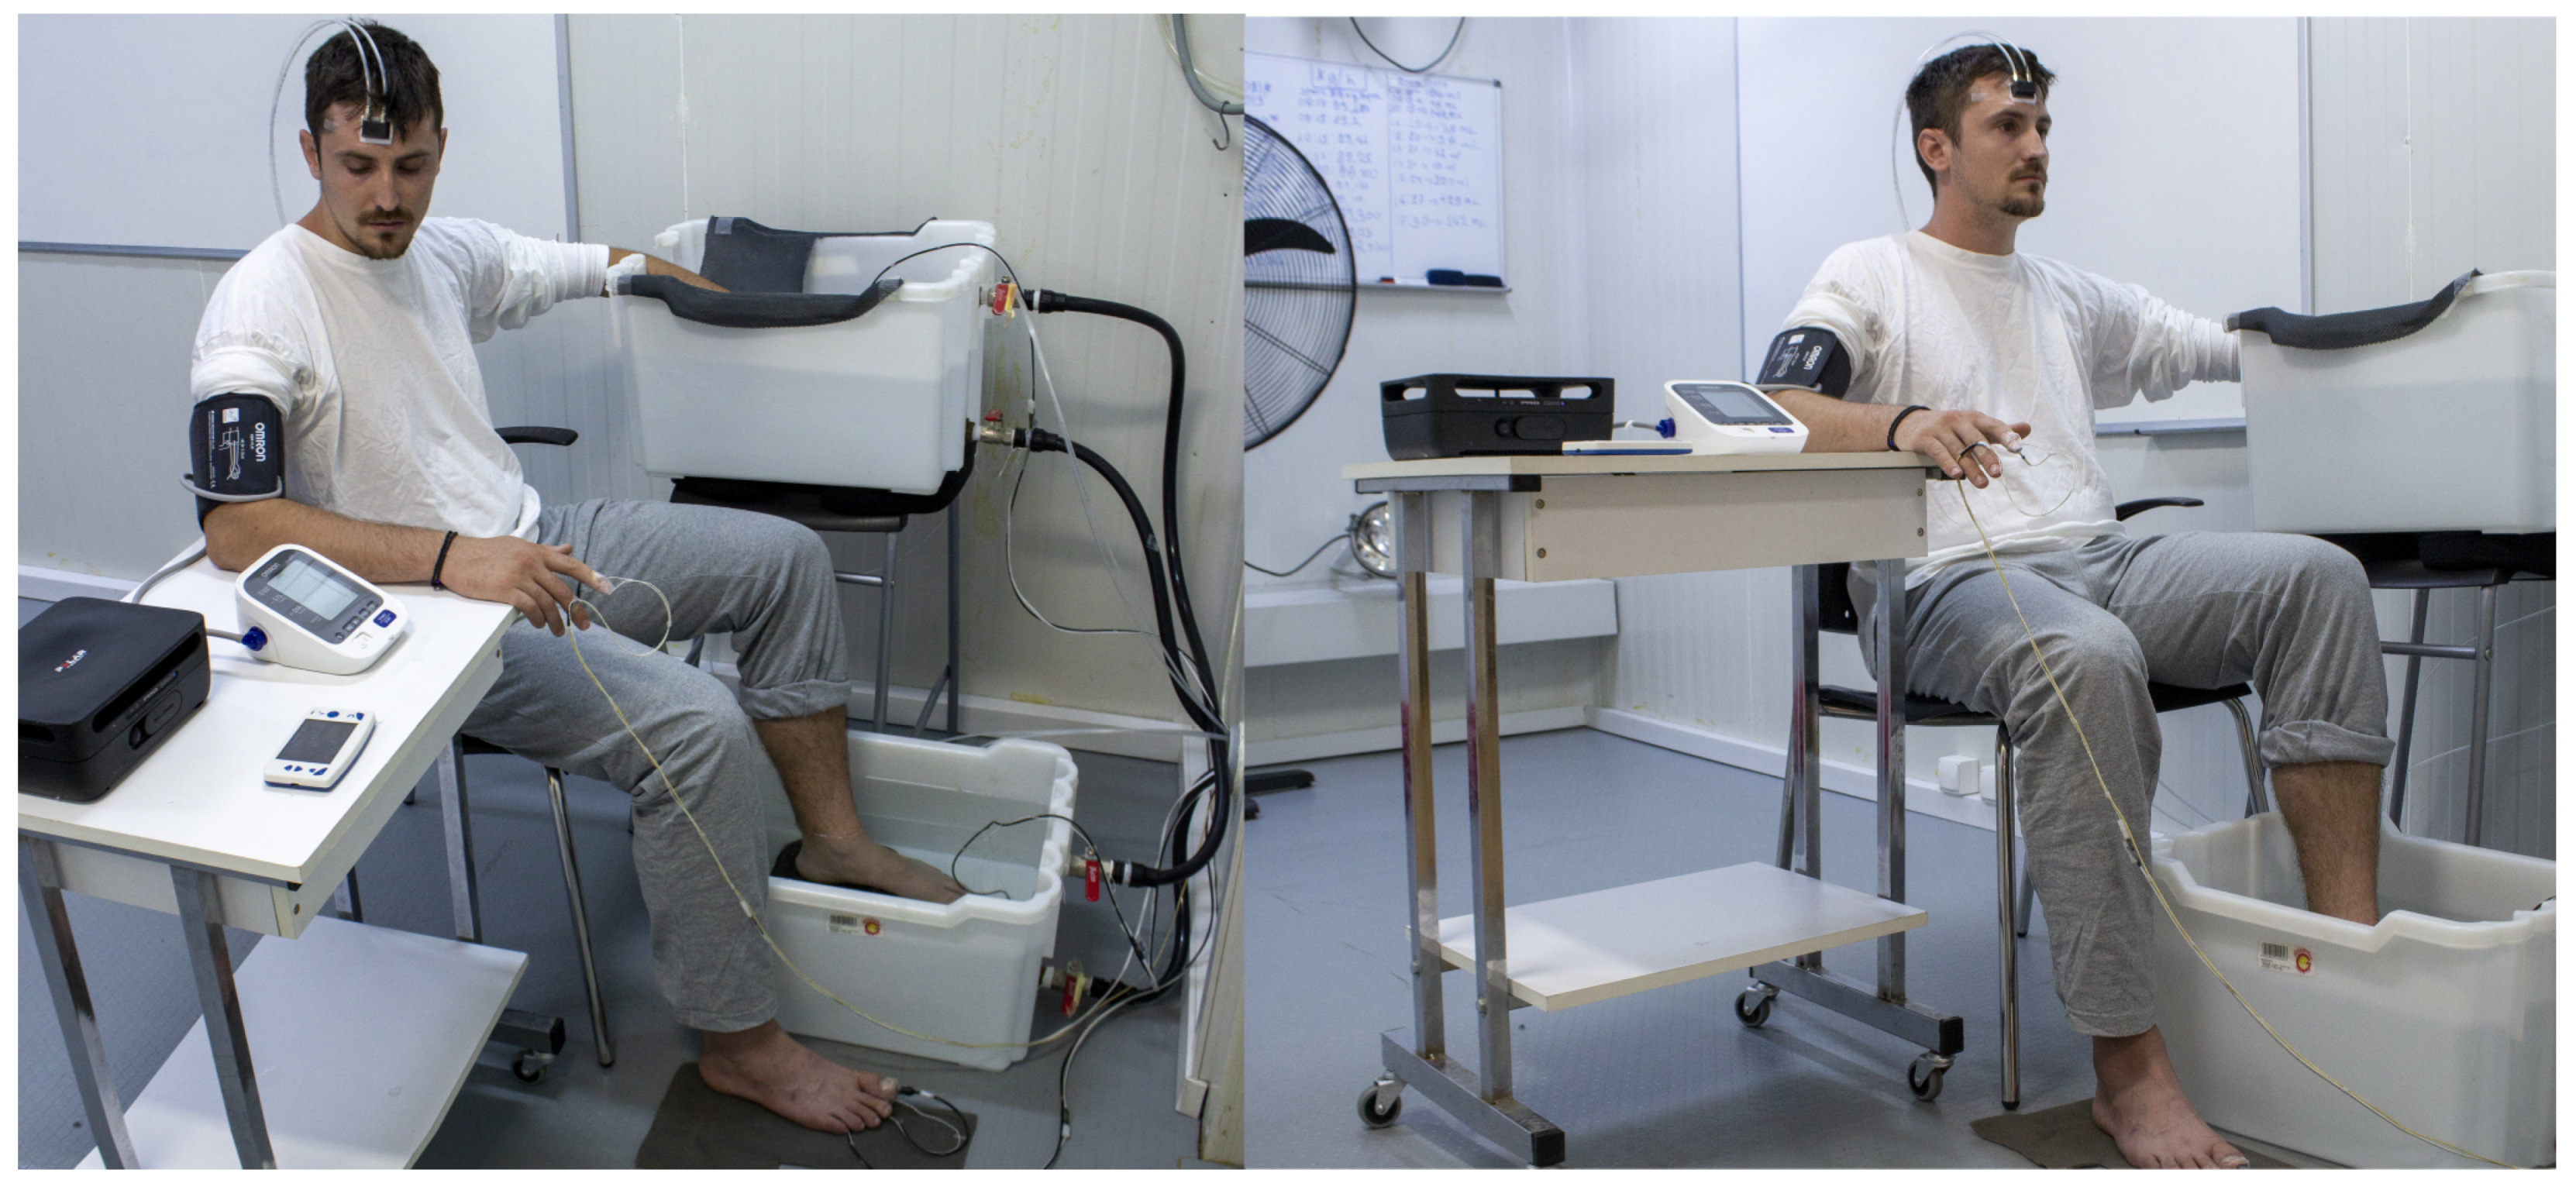
2.2. Experimental Protocol
2.3. Measurements
2.4. Statistical Analysis
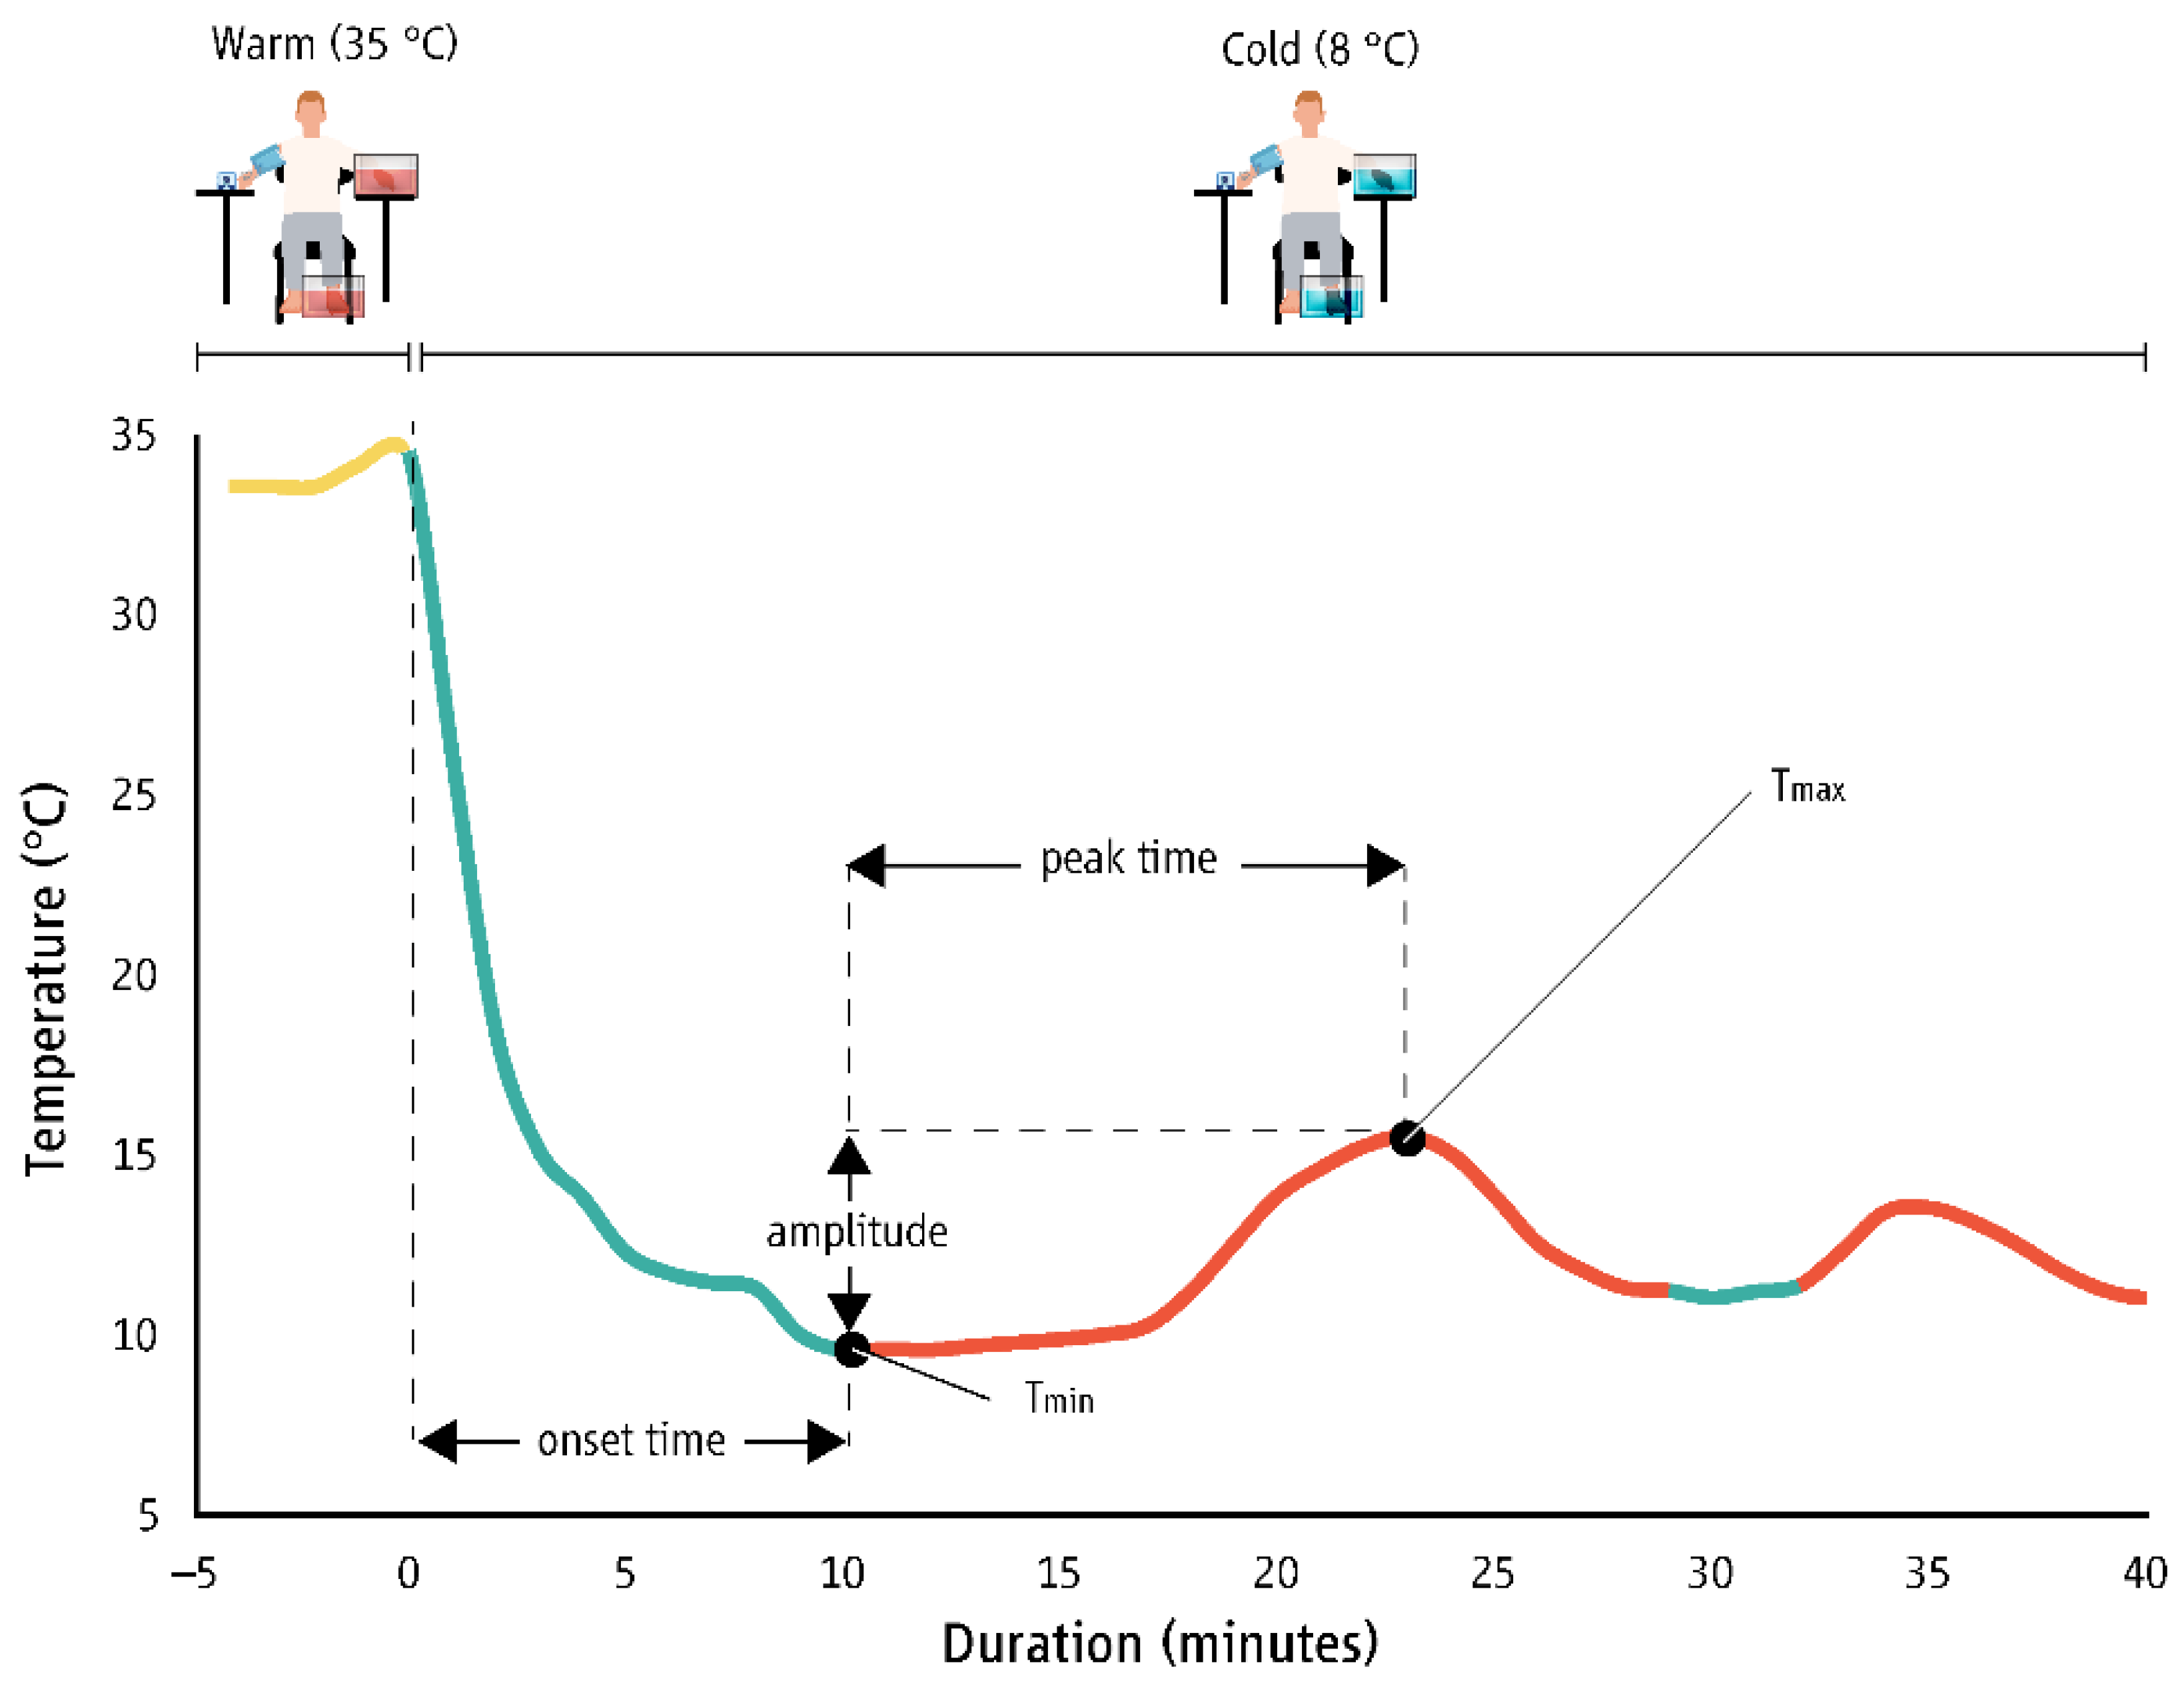
- Number of waves (n): the minimum temperature increase to define a CIVD response was set at 1 °C.
- Minimum temperature (Tmin): the lowest temperature just before the onset of CIVD in °C.
- Maximum temperature (Tmax): the highest temperature during the CIVD in °C.
- Onset time (Tonset): the time from immersion to Tmin in minutes.
- Peak time (Tpeak): the time to reach the maximum temperature (time at Tmax minus time at Tmin) in minutes.
- Average temperature (Tavg): the average temperature during the cold-water immersion period without the first five minutes of the cold-water immersion in °C.
- Temperature amplitude (ΔT): the difference between Tmin and Tmax in °C.
3. Results
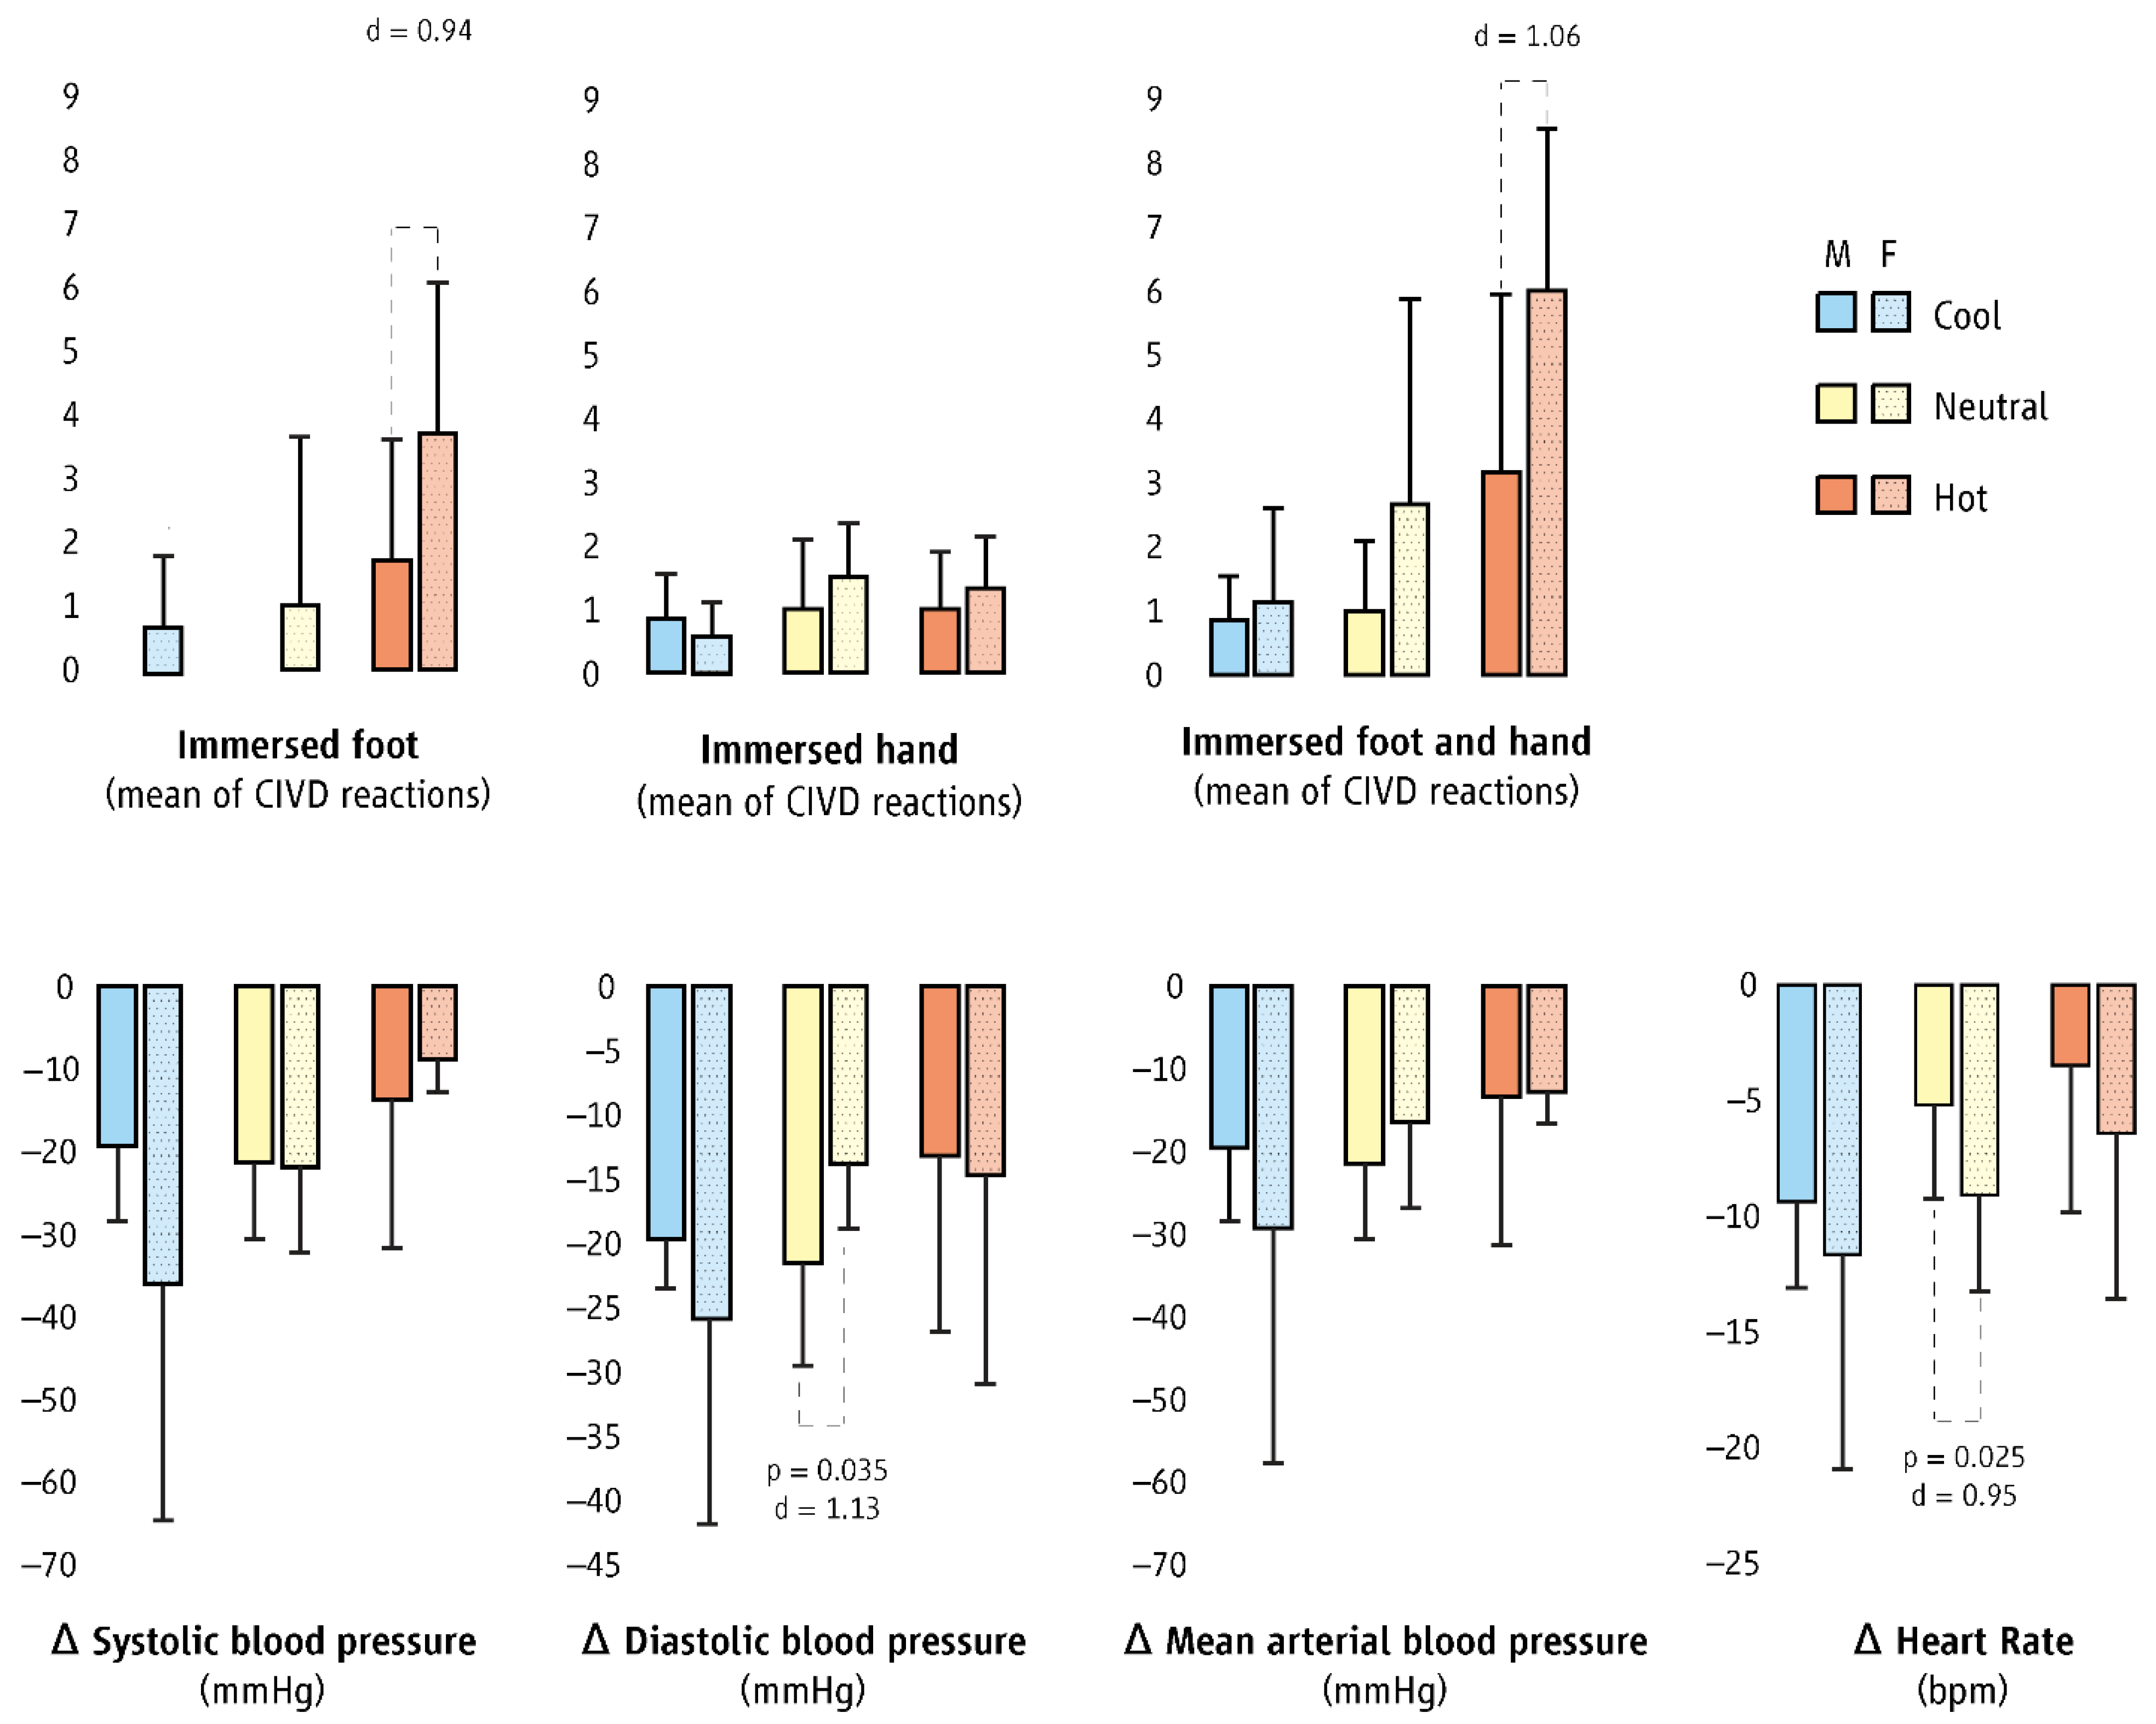
3.1. Frequency of CIVD
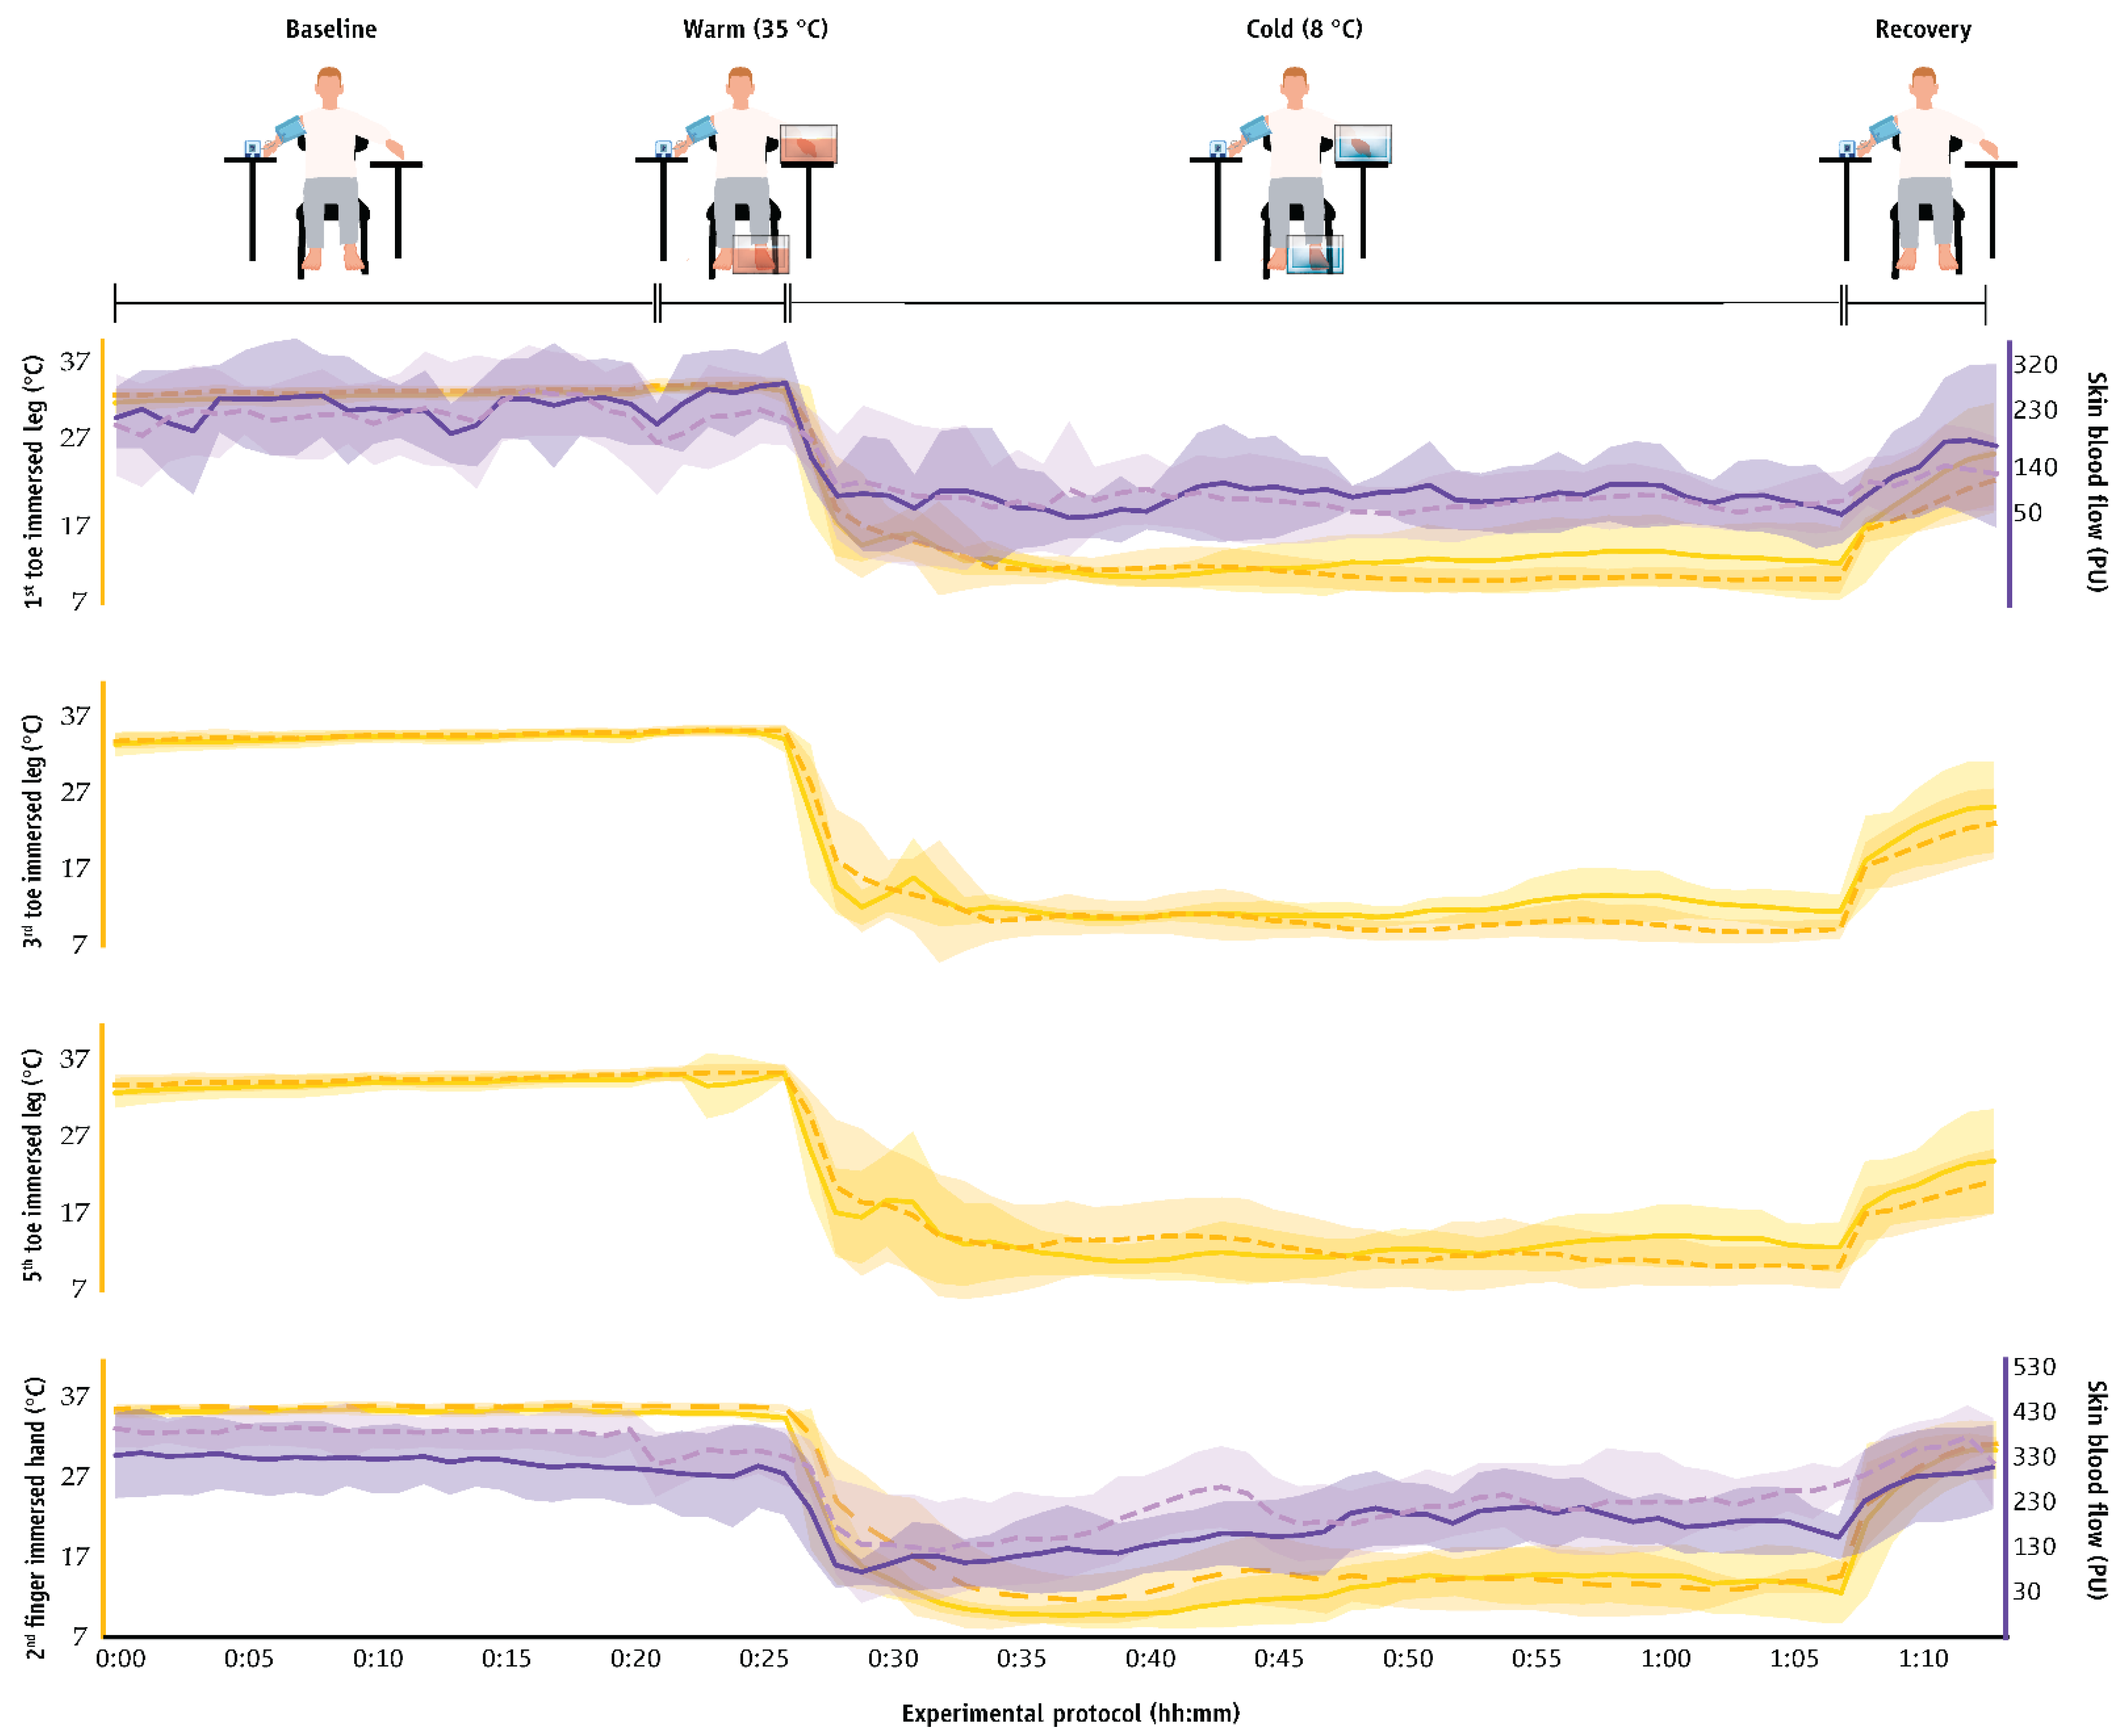
3.2. Characteristics of CIVD
3.3. Cardiovascular Strain
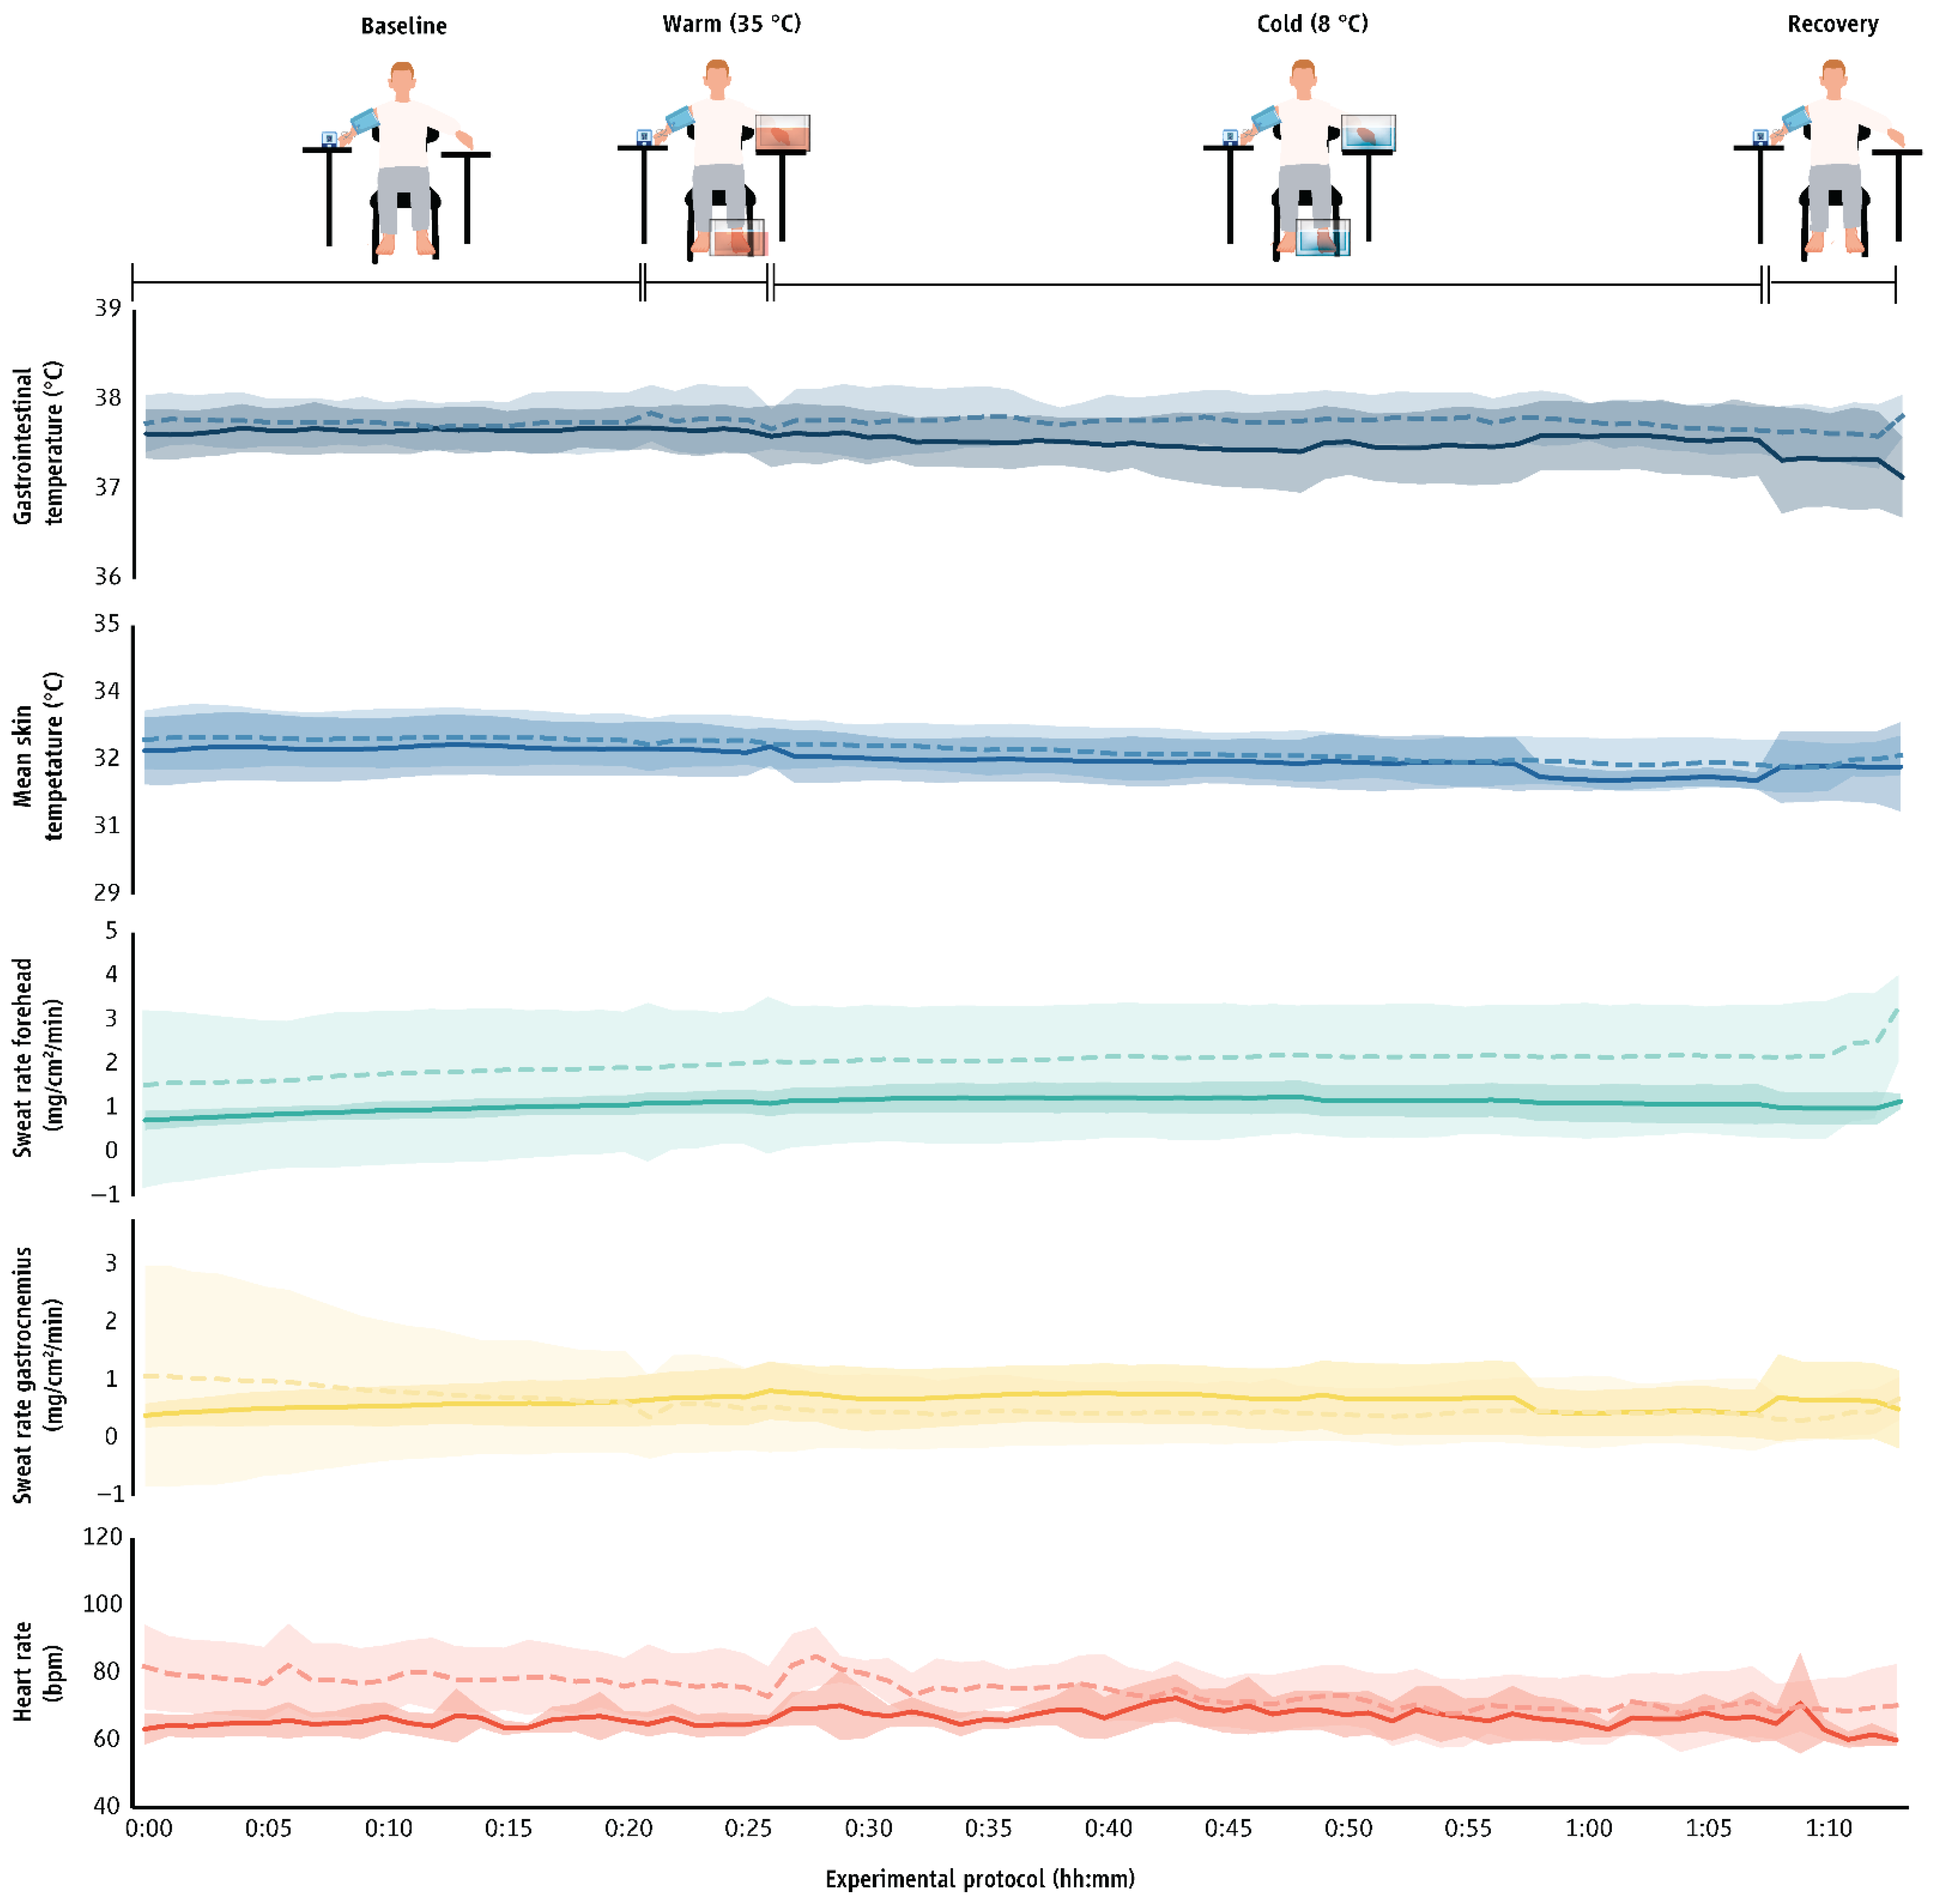
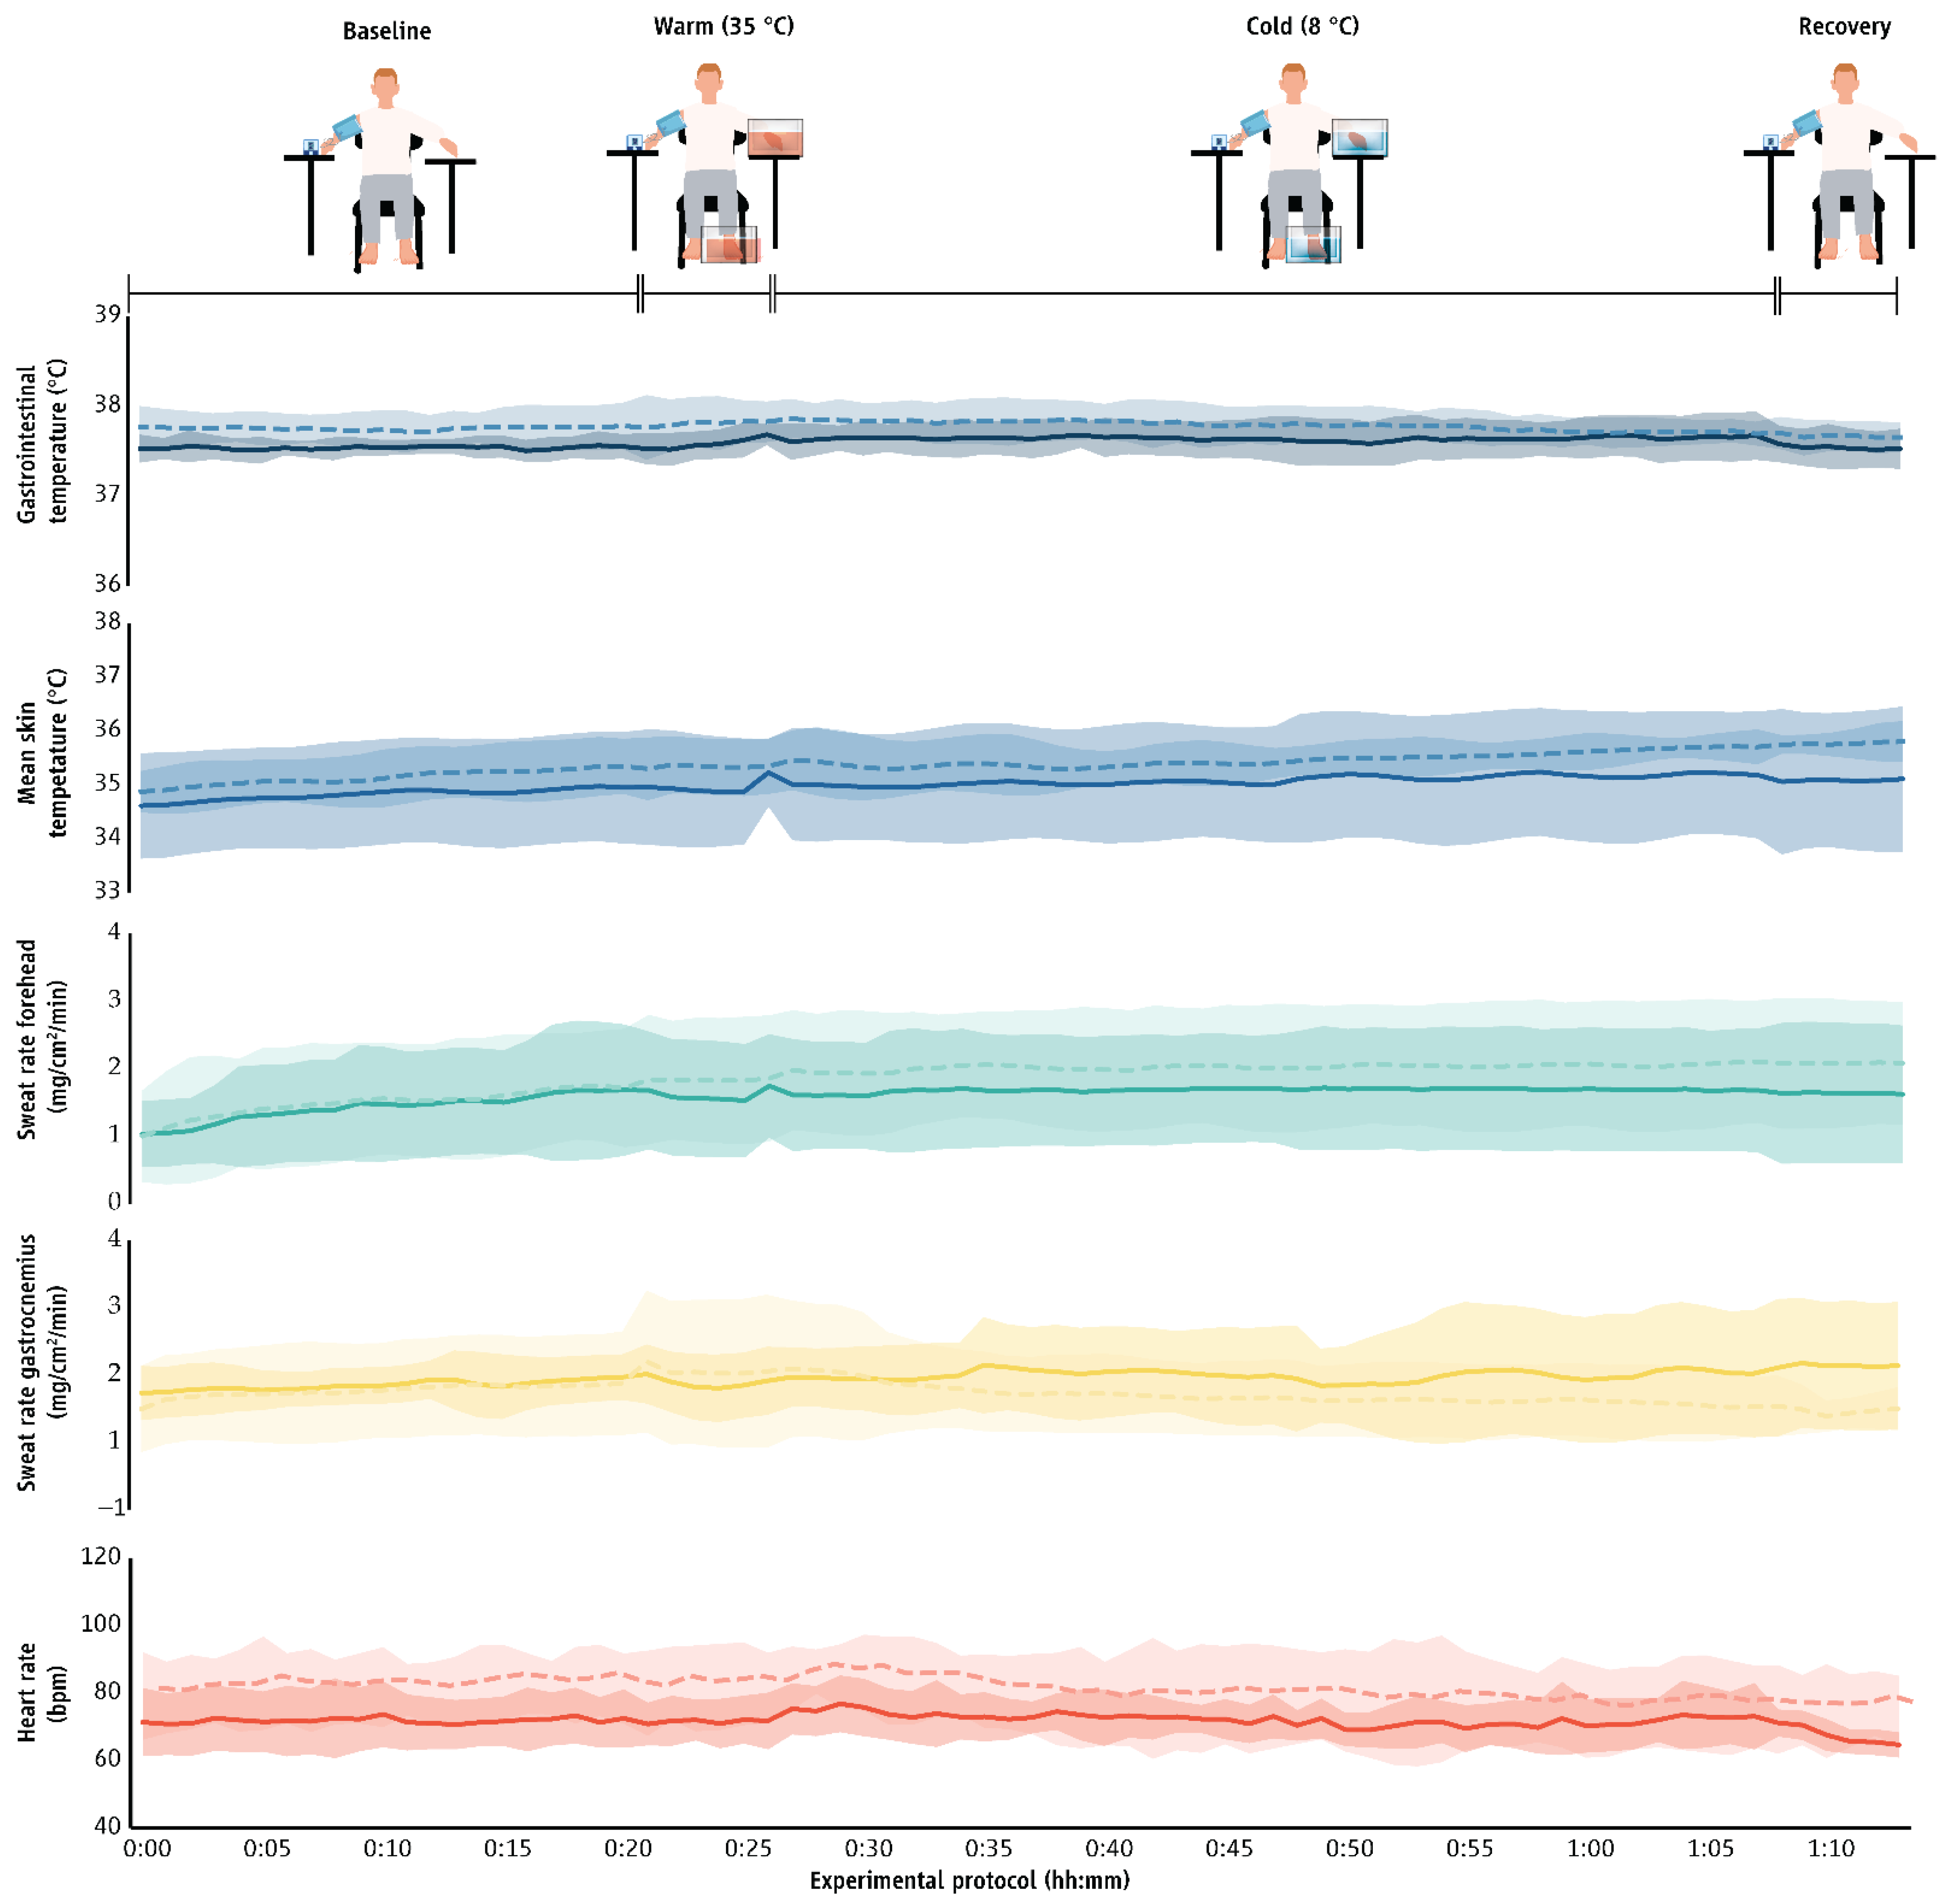
3.4. Other Physiological Responses
3.5. Perceptual Data
4. Discussion
5. Conclusions
Author Contributions
Funding
Institutional Review Board Statement
Informed Consent Statement
Data Availability Statement
Conflicts of Interest
Appendix A

| n | Minimum (°C) | Maximum (°C) | Onset Time (mm:ss) | Peak Time (mm:ss) | Average (°C) | Amplitude (°C) | |||
|---|---|---|---|---|---|---|---|---|---|
| 1st toe immersed leg | Wave 1 | ||||||||
| Cool | men | 0 | |||||||
| women | 2 | 8.7 ± 0.1 | 10.9 ± 0.1 | 17:23 ± 13:45 | 14:00 ± 04:15 | 10.0 ± 0.6 | 2.2 ± 0.0 | ||
| Neutral | men | 0 | |||||||
| women | 1 | 9.7 | 12.1 | 09:23 | 07:00 | 10.9 | 2.4 | ||
| Hot | men | 3 | 10.3 ± 1.4 | 14.3 ± 3.6 | 16:10 ± 07:08 | 09:00 ± 00:20 | 11.3 ± 1.3 | 4.0 ± 2.6 | |
| women | 5 | 10.8 ± 1.7 | 13.2 ± 2.1 | 13:43 ± 05:41 | 06:16 ± 03:33 | 12.4 ± 1.3 | 2.4 ± 1.4 | ||
| Wave 2 | |||||||||
| Cool | men | 0 | |||||||
| women | 0 | ||||||||
| Neutral | men | 0 | |||||||
| women | 1 | 10.7 | 12.0 | 27:44 | 06:00 | 10.9 | 1.3 | ||
| Hot | men | 0 | |||||||
| women | 3 | 11.1 ± 0.7 | 14.4 ± 2.1 | 20:56 ± 03:27 | 05:00 ± 03:06 | 13.4 ± 0.7 | 3.3 ± 2.5 | ||
| 3rd toe immersed leg | Wave 1 | ||||||||
| Cool | men | 0 | |||||||
| women | 1 | 9.4 | 10.9 | 19:41 | 01:40 | 10.0 | 1.4 | ||
| Neutral | men | 0 | |||||||
| women | 1 | 10.0 | 14.2 | 09:43 | 06:40 | 12.0 | 4.2 | ||
| Hot | men | 3 | 10.3 ± 0.9 | 12.9 ± 1.0 | 12:50 ± 01:02 | 05:00 ± 02:36 | 11.7 ± 1.1 | 2.6 ± 1.8 | |
| women | 6 | 9.2 ± 1.4 | 12.6 ± 3.2 | 11:31 ± 05:55 | 04:43 ± 02:57 | 10.3 ± 1.9 | 3.4 ± 1.9 | ||
| Wave 2 | |||||||||
| Cool | men | 0 | |||||||
| women | 0 | ||||||||
| Neutral | men | 0 | |||||||
| women | 1 | 11.4 | 14.7 | 31:43 | 06:00 | 12.0 | 3.3 | ||
| Hot | men | 1 | 8.5 | 20.0 | 21:24 | 09:40 | 12.9 | 11.6 | |
| women | 3 | 10.3 ± 1.1 | 13.3 ± 1.6 | 24:57 ± 02:51 | 06:00 ± 01:46 | 11.9 ± 1.0 | 3.0 ± 1.2 | ||
| Wave 3 | |||||||||
| Cool | men | 0 | |||||||
| women | 0 | ||||||||
| Neutral | men | 0 | |||||||
| women | 0 | ||||||||
| Hot | men | 0 | |||||||
| women | 1 | 9.7 | 10.8 | 35:07 | 02:00 | 11.2 | 1.0 | ||
| 5th toe immersed leg | Wave 1 | ||||||||
| Cool | men | 0 | |||||||
| women | 1 | 10.0 | 11.7 | 19:01 | 03:40 | 11.2 | 1.7 | ||
| Neutral | men | 0 | |||||||
| women | 1 | 9.0 | 14.4 | 09:43 | 05:40 | 11.6 | 5.4 | ||
| Hot | men | 4 | 10.6 ± 2.5 | 14.6 ± 4.3 | 17:08 ± 06:32 | 06:00 ± 02:42 | 11.4 ± 1.8 | 3.9 ± 2.7 | |
| women | 6 | 11.7 ± 4.8 | 14.9 ± 5.4 | 11:46 ± 06:20 | 05:48 ± 04:27 | 13.3 ± 3.5 | 3.2 ± 1.5 | ||
| Wave 2 | |||||||||
| Cool | men | 0 | |||||||
| women | 0 | ||||||||
| Neutral | men | 0 | |||||||
| women | 1 | 9.0 | 12.5 | 22:43 | 04:40 | 11.3 | 3.5 | ||
| Hot | men | 2 | 12.1 ± 0.1 | 16.2 ± 4.5 | 30:23 ± 06:35 | 05:10 ± 04:00 | 12.7 ± 1.8 | 4.2 ± 4.3 | |
| women | 3 | 12.8 ± 3.9 | 15.0 ± 5.5 | 21:30 ± 04:49 | 02:20 ± 00:00 | 14.2 ± 5.1 | 2.2 ± 1.7 | ||
| Wave 3 | |||||||||
| Cool | men | 0 | |||||||
| women | 0 | ||||||||
| Neutral | men | 0 | |||||||
| women | 1 | 8.6 | 15.5 | 30:43 | 07:00 | 11.6 | 6.9 | ||
| Hot | men | 0 | |||||||
| women | 1 | 14.0 | 15.8 | 31:21 | 02:00 | 13.5 | 1.9 | ||
| 2nd finger immersed hand | Wave 1 | ||||||||
| Cool | men | 5 | 9.5 ± 0.9 | 12.7 ± 2.3 | 11:10 ± 06:00 | 08:07 ± 10:40 | 10.6 ± 1.2 | 3.2 ± 1.4 | |
| women | 4 | 8.4 ± 0.9 | 11.6 ± 1.7 | 13:29 ± 02:36 | 09:10 ± 04:08 | 10.1 ± 1.5 | 3.2 ± 1.6 | ||
| Neutral | men | 3 | 10.0 ± 0.5 | 12.5 ± 1.3 | 10:57 ± 02:33 | 10:40 ± 01:09 | 12.4 ± 1.8 | 5.2 ± 1.1 | |
| women | 5 | 9.1 ± 1.2 | 12.5 ± 2.1 | 09:57 ± 01:38 | 07:36 ± 00:59 | 10.8 ± 1.6 | 3.4 ± 1.4 | ||
| Hot | men | 4 | 9.0 ± 0.8 | 15.0 ± 2.6 | 10:53 ± 03:25 | 08:50 ± 05:12 | 12.5 ± 1.8 | 6.0 ± 3.2 | |
| women | 5 | 11.1 ± 1.4 | 18.7 ± 1.9 | 08:50 ± 01:49 | 08:33 ± 04:54 | 15.1 ± 2.3 | 7.6 ± 1.7 | ||
| Wave 2 | |||||||||
| Cool | men | 1 | 10.2 | 12.9 | 15:10 | 01:40 | 11.27 | 2.7 | |
| women | 0 | ||||||||
| Neutral | men | 3 | 10.9 ± 2.2 | 14.7 ± 2.2 | 30:37 ± 04:24 | 07:20 ± 04:11 | 12.4 ± 1.8 | 3.8 ± 1.2 | |
| women | 4 | 9.9 ± 1.9 | 11.9 ± 1.8 | 25:25 ± 03:19 | 05:05 ± 03:06 | 10.4 ± 1.6 | 2.0 ± 0.9 | ||
| Hot | men | 2 | 10.4 ± 1.4 | 13.3 ± 1.7 | 24:04 ± 03:46 | 04:50 ± 01:11 | 11.5 ± 1.3 | 2.9 ± 0.3 | |
| women | 3 | 11.1 ± 0.7 | 14.4 ± 2.1 | 20:56 ± 03:27 | 05:40 ± 00:20 | 13.4 ± 0.7 | 3.3 ± 2.5 | ||
| Baseline | Warm Immersion | Cold Immersion | Recovery | Effect Size (d) | ||||||
|---|---|---|---|---|---|---|---|---|---|---|
| Base | WI | CI | Rec | |||||||
| Gastrointestinal temperature (°C) | Cool | men | 37.18 ± 0.17 | 37.24 ± 0.23 | 37.01 ± 0.32 | 36.94 ± 0.44 | 0.86 | 0.33 | 0.24 | 0.10 |
| women | 37.30 ± 0.10 | 37.30 ± 0.11 | 37.07 ± 0.17 | 36.90 ± 0.15 | ||||||
| Neutral | men | 37.15 ± 0.25 | 37.16 ± 0.27 | 37.00 ± 0.32 | 36.83 ± 0.55 | 0.32 | 0.36 | 0.88 | 0.73 | |
| women | 37.24 ± 0.28 | 37.28 ± 0.35 | 37.26 ± 0.27 | 37.17 ± 0.35 | ||||||
| Hot | men | 37.03 ± 0.10 | 37.07 ± 0.16 | 37.14 ± 0.19 | 37.01 ± 0.26 | 1.40 | 1.01 | 0.76 | 0.19 | |
| women | 37.25 ± 0.20 | 37.31 ± 0.27 | 37.28 ± 0.18 | 37.05 ± 0.07 | ||||||
| Mean skin temperature (°C) | Cool | men | 30.34 ± 0.86 | 30.06 ± 0.96 | 29.55 ± 0.91 | 29.42 ± 1.06 | 0.23 | 0.10 | 0.01 | 0.18 |
| women | 30.51 ± 0.61 | 30.15 ± 0.70 | 29.56 ± 0.82 | 29.59 ± 0.91 | ||||||
| Neutral | men | 32.27 ± 0.68 | 32.20 ± 0.56 | 31.92 ± 0.53 | 31.84 ± 0.79 | 0.32 | 0.41 | 0.33 | 0.25 | |
| women | 32.48 ± 0.64 | 32.43 ± 0.56 | 32.09 ± 0.53 | 32.00 ± 0.43 | ||||||
| Hot | men | 34.80 ± 0.97 | 34.90 ± 1.03 | 35.05 ± 1.06 | 35.08 ± 1.29 | 0.43 | 0.54 | 0.53 | 0.68 | |
| women | 35.13 ± 0.47 | 35.35 ± 0.52 | 35.47 ± 0.36 | 35.72 ± 0.31 | ||||||
| Arm temperature (°C) | Cool | men | 31.35 ± 1.01 | 31.09 ± 1.11 | 30.67 ± 1.08 | 30.29 ± 1.08 | 0.54 | 0.52 | 0.60 | 0.02 |
| women | 30.85 ± 0.85 | 30.60 ± 0.72 | 30.06 ± 0.87 | 30.30 ± 0.78 | ||||||
| Neutral | men | 33.20 ± 0.77 | 33.31 ± 0.64 | 33.04 ± 0.72 | 33.10 ± 1.03 | 0.31 | 0.39 | 0.19 | 0.21 | |
| women | 32.95 ± 0.85 | 33.04 ± 0.75 | 32.92 ± 0.54 | 32.93 ± 0.42 | ||||||
| Hot | men | 35.58 ± 0.51 | 35.79 ± 0.51 | 35.97 ± 0.51 | 36.07 ± 0.50 | 0.33 | 0.33 | 0.53 | 0.44 | |
| women | 35.38 ± 0.71 | 35.60 ± 0.67 | 35.71 ± 0.49 | 35.88 ± 0.30 | ||||||
| Chest temperature (°C) | Cool | men | 30.67 ± 1.27 | 30.57 ± 1.38 | 30.23 ± 1.47 | 30.72 ± 1.82 | 1.49 | 1.26 | 1.32 | 1.12 |
| women | 32.30 ± 0.88 | 32.11 ± 1.04 | 31.89 ± 1.01 | 32.32 ± 0.90 | ||||||
| Neutral | men | 32.49 ± 0.74 0.009 | 32.48 ± 0.6 0.006 | 32.37 ± 0.56 | 32.50 ± 0.81 | 1.62 | 2.11 | 1.71 | 1.37 | |
| women | 33.60 ± 0.64 | 33.73 ± 0.58 | 33.44 ± 0.68 | 33.54 ± 0.70 | ||||||
| Hot | men | 34.39 ± 2.05 | 34.36 ± 2.10 | 34.44 ± 2.25 | 34.29 ± 3.00 | 0.78 | 0.84 | 0.80 | 0.90 | |
| women | 35.56 ± 0.47 | 35.64 ± 0.45 | 35.73 ± 0.37 | 36.22 ± 0.36 | ||||||
| Leg temperature (°C) | Cool | men | 29.17 ± 1.07 | 28.59 ± 1.09 | 27.79 ± 1.20 | 27.10 ± 1.35 | 0.40 | 0.34 | 0.48 | 0.65 |
| women | 28.71 ± 1.62 | 28.13 ± 1.58 | 27.02 ± 1.95 | 25.92 ± 2.20 | ||||||
| Neutral | men | 31.20 ± 0.88 | 30.91 ± 0.83 | 30.28 ± 0.75 | 29.62 ± 0.73 | 0.24 | 0.28 | 0.42 | 0.47 | |
| women | 30.99 ± 0.81 | 30.67 ± 0.89 | 29.93 ± 0.95 | 29.23 ± 0.90 | ||||||
| Hot | men | 34.43 ± 0.53 | 34.52 ± 0.68 | 34069 ± 0.63 | 34.87 ± 0.40 | 0.16 | 0.35 | 0.30 | 0.36 | |
| women | 34.36 ± 0.39 | 34.73 ± 0.55 | 34.84 ± 0.35 | 34.75 ± 0.24 | ||||||
| Thigh temperature (°C) | Cool | men | 29.47 ± 1.03 | 29.21 ± 1.16 | 28.63 ± 1.19 | 28.47 ± 1.45 | 0.33 | 0.59 | 0.65 | 0.31 |
| women | 29.10 ± 1.25 | 28.52 ± 1.19 | 27.86 ± 1.17 | 28.10 ± 0.88 | ||||||
| Neutral | men | 31.61 ± 0.72 | 31.43 ± 0.62 | 31.20 ± 0.70 | 31.19 ± 0.83 | 0.01 | 0.11 | 0.31 | 0.15 | |
| women | 31.60 ± 0.75 | 31.35 ± 0.72 | 30.98 ± 0.73 | 31.06 ± 0.75 | ||||||
| Hot | men | 34.63 ± 1.25 | 34.76 ± 1.23 | 34.90 ± 1.42 | 34.98 ± 1.83 | 0.27 | 0.41 | 0.41 | 0.54 | |
| women | 34.89 ± 0.47 | 35.16 ± 0.58 | 35.34 ± 0.53 | 35.70 ± 0.50 | ||||||
| 1st toe immersed leg (°C) | Cool | men | 21.48 ± 1.39 | 31.51 ± 2.48 | 10.10 ± 0.60 | 11.63 ± 0.87 | 0.02 | 0.40 | 0.49 | 0.59 |
| women | 21.44 ± 2.27 | 30.34 ± 3.38 | 10.48 ± 0.93 | 12.73 ± 2.47 | ||||||
| Neutral | men | 26.30 ± 3.24 | 33.08 ± 1.02 | 10.80 ± 1.17 | 13.92 ± 2.09 | 0.42 | 0.42 | 0.51 | 0.20 | |
| women | 28.05 ± 4.83 | 33.76 ± 2.05 | 10.32 ± 0.62 | 14.33 ± 1.93 | ||||||
| Hot | men | 34.40 ± 0.83 | 35.47 ± 0.77 | 13.03 ± 2.59 | 23.10 ± 5.26 | 0.89 | 0.61 | 0.39 | 0.69 | |
| women | 35.01 ± 0.55 | 35.96 ± 0.86 | 12.19 ± 1.59 | 20.24 ± 2.65 | ||||||
| 3rd toe immersed leg (°C) | Cool | men | 19.55 ± 1.55 | 32.17 ± 2.42 | 9.91 ± 0.79 | 12.05 ± 0.83 | 0.45 | 0.56 | 0.21 | 0.27 |
| women | 20.46 ± 2.338 | 30.57 ± 3.24 | 10.10 ± 1.05 | 12.46 ± 1.92 | ||||||
| Neutral | men | 25.15 ± 3.22 | 32.74 ± 1.11 | 10.62 ± 1.05 | 13.54 ± 1.35 | 0.41 | 0.93 | 0.59 | 0.68 | |
| women | 26.90 ± 5.07 | 33.87 ± 1.33 | 9.93 ± 1.30 | 14.81 ± 2.29 | ||||||
| Hot | men | 34.43 ± 0.97 | 35.22 ± 0.56 | 12.40 ± 1.08 | 23.05 ± 4.78 | 0.34 | 0.38 | 0.67 | 0.34 | |
| women | 34.72 ± 0.74 | 35.47 ± 0.73 | 11.29 ± 2.05 | 21.43 ± 4.66 | ||||||
| 5th toe immersed leg (°C) | Cool | men | 20.10 ± 1.71 | 31.66 ± 1.72 | 10.97 ± 1.88 | 12.19 ± 1.21 | 0.62 | 0.53 | 0.10 | 0.49 |
| women | 21.74 ± 3.32 | 30.13 ± 3.69 | 10.81 ± 1.22 | 13.23 ± 2.79 | ||||||
| Neutral | men | 25.54 ± 3.15 | 32.02 ± 1.23 | 10.91 ± 0.73 | 13.30 ± 1.81 | 0.41 | 1.38 | 0.57 | 0.95 | |
| women | 27.21 ± 4.76 | 33.68 ± 1.18 | 10.39 ± 1.07 | 15.40 ± 2.56 | ||||||
| Hot | men | 34.02 ± 1.25 | 35.06 ± 1.44 | 13.28 ± 2.24 | 21.87 ± 5.01 | 0.49 | 0.39 | 0.01 | 0.31 | |
| women | 34.58 ± 1.00 | 35.54 ± 1.00 | 13.24 ± 4.26 | 20.46 ± 4.12 | ||||||
| 1st toe non immersed leg (°C) | Cool | men | 21.82 ± 1.46 | 21.10 ± 1.06 | 18.31 ± 0.92 | 16.93 ± 0.91 | 0.03 | 0.17 | 0.13 | 0.20 |
| women | 21.89 ± 2.33 | 21.38 ± 2.14 | 18.47 ± 1.38 | 17.12 ± 0.99 | ||||||
| Neutral | men | 26.45 ± 3.85 | 26.67 ± 3.74 | 24.34 ± 2.97 | 24.33 ± 3.81 | 0.34 | 0.16 | 0.34 | 0.81 | |
| women | 27.79 ± 4.00 | 27.24 ± 3.59 | 23.52 ± 1.70 | 22.09 ± 0.89 | ||||||
| Hot | men | 34.44 ± 0.91 | 34.80 ± 0.62 | 34.08 ± 0.94 | 34.48 ± 0.47 | 0.88 | 0.85 | 0.27 | 1.17 | |
| women | 35.10 ± 0.55 | 35.30 ± 0.56 | 34.32 ± 0.77 | 33.03 ± 1.69 | ||||||
| 2nd finger immersed hand (°C) | Cool | men | 20.77 ± 4.30 | 30.74 ± 2.38 | 11.00 ± 1.18 | 14.25 ± 2.96 | 0.13 | 0.55 | 0.03 | 0.14 |
| women | 21.35 ± 4.80 | 29.27 ± 3.00 | 11.04 ± 0.98 | 14.64 ± 2.48 | ||||||
| Neutral | men | 29.37 ± 3.48 | 33.99 ± 1.24 | 11.87 ± 1.48 | 18.15 ± 5.32 | 0.70 | 0.36 | 0.45 | 0.25 | |
| women | 31.49 ± 2.43 | 34.51 ± 1.64 | 11.18 ± 1.59 | 17.13 ± 2.19 | ||||||
| Hot | men | 35.46 ± 0.59 | 35.17 ± 0.44 | 13.02 ± 2.46 | 28.50 ± 4.83 | 1.16 | 1.95 | 0.69 | 0.02 | |
| women | 36.01 ± 0.40 | 36.01 ± 0.43 | 14.80 ± 2.68 | 28.41 ± 3.21 | ||||||
| 2nd finger immersed hand (°C) | Cool | men | 21.04 ± 3.99 | 19.73 ± 4.02 | 17.36 ± 1.41 | 16.52 ± 0.53 | 0.12 | 0.24 | 0.15 | 0.07 |
| women | 20.54 ± 4.19 | 18.81 ± 3.50 | 17.13 ± 1.59 | 16.57 ± 0.72 | ||||||
| Neutral | men | 28.65 ± 3.17 | 27.85 ± 2.89 | 24.84 ± 2.09 | 24.07 ± 2.34 | 1.07 | 0.62 | 0.18 | 0.69 | |
| women | 31.32 ± 1.58 | 29.64 ± 2.92 | 25.25 ± 2.30 | 22.92 ± 0.30 | ||||||
| Hot | men | 35.50 ± 0.59 | 35.51 ± 0.51 | 35.21 ± 0.59 | 35.39 ± 0.17 | 0.05 | 0.18 | 0.40 | 1.35 | |
| women | 35.53 ± 0.57 | 35.39 ± 0.74 | 34.93 ± 0.79 | 34.58 ± 0.83 | ||||||
| SkBF 1st toe immersed leg (PU) | Cool | men | 8.47 ± 5.29 | 39.54 ± 31.54 | 20.88 ± 11.09 | 38.74 ± 7.97 | 0.44 | 0.42 | 0.41 | 0.53 |
| women | 17.76 ± 29.25 | 28.59 ± 19.62 | 28.05 ± 22.40 | 56.91 ± 47.73 | ||||||
| Neutral | men | 52.14 ± 47.67 | 79.53 ± 28.06 | 20.68 ± 13.98 | 33.26 ± 15.27 | 0.37 | 0.43 | 0.71 | 0.90 | |
| women | 80.81 ± 98.23 | 102.68 ± 70.38 | 42.56 ± 41.34 | 60.48 ± 39.83 | ||||||
| Hot | men | 262.48 ± 72.15 | 282.51 ± 67.05 | 82.22 ± 45.71 | 157.16 ± 108.53 | 0.12 | 0.92 | 0.01 | 0.29 | |
| women | 253.28 ± 78.81 | 210.34 ± 88.42 | 81.59 ± 57.26 | 131.52 ± 63.37 | ||||||
| SkBF 1st toe non immersed leg (PU) | Cool | men | 11.81 ± 5.15 | 14.02 ± 10.42 | 14.84 ± 8.88 | 12.50 ± 2.42 | 0.52 | 0.52 | 0.43 | 0.25 |
| women | 28.11 ± 44.44 | 50.32 ± 98.45 | 21.51 ± 20.34 | 11.29 ± 6.38 | ||||||
| Neutral | men | 63.75 ± 43.87 | 48.65 ± 38.23 | 28.82 ± 26.19 | 38.20 ± 33.55 | 0.03 | 0.07 | 0.50 | 1.08 | |
| women | 62.39 ± 56.62 | 45.74 ± 43.06 | 18.504.03 | 12.44 ± 1.33 | ||||||
| Hot | men | 221.14 ± 75.13 | 233.12 ± 62.66 | 193.68 ± 63.98 | 210.73 ± 58.43 | 0.18 | 0.39 | 0.33 | 3.15 | |
| women | 203.14 ± 120.04 | 197.30 ± 112.78 | 160.92 ± 123.61 | 67.76 ± 26.62 | ||||||
| SkBF 2nd finger immersed hand (PU) | Cool | men | 89.75 ± 121.99 | 105.82 ± 110.72 | 103.67 ± 64.71 | 108.13 ± 13.86 | 0.14 | 0.13 | 0.27 | 0.33 |
| women | 72.60 ± 116.16 | 91.30 ± 116.72 | 85.49 ± 71.23 | 139.03 ± 82.32 | ||||||
| Neutral | men | 224.96 ± 126.19 | 202.69 ± 118.12 | 100.06 ± 62.93 | 178.11 ± 94.11 | 0.63 | 0.70 | 0.63 | 0.06 | |
| women | 293.38 ± 87.65 | 275.99 ± 89.71 | 137.65 ± 56.96 | 173.18 ± 83.76 | ||||||
| Hot | men | 329.08 ± 75.45 | 301.39 ± 91.38 | 151.01 ± 66.33 | 290.01 ± 101.76 | 1.04 | 0.50 | 0.75 | 0.86 | |
| women | 392.06 ± 39.75 | 339.34 ± 56.45 | 199.13 ± 62.69 | 354.43 ± 28.27 | ||||||
| SkBF 2nd finger non immersed hand (PU) | Cool | men | 46.71 ± 54.65 | 40.38 ± 63.60 | 19.44 ± 8.97 | 15.34 ± 7.40 | 0.21 | 0.10 | 0.23 | 0.22 |
| women | 59.57 ± 69.78 | 34.40 ± 50.08 | 2.75 ± 18.24 | 17.48 ± 11.46 | ||||||
| Neutral | men | 148.45 ± 73.52 | 95.70 ± 54.05 | 44.06 ± 24.55 | 42.13 ± 21.85 | 0.76 | 0.55 | 0.24 | 0.63 | |
| women | 205 ± 0.37 ± 76.72 | 137.69 ± 94.24 | 54.56 ± 56.13 | 28.05 ± 22.58 | ||||||
| Hot | men | 248.85 ± 78.47 | 253.97 ± 75.61 | 209.77 ± 68.63 | 246.72 ± 31.68 | 0.02 | 0.29 | 0.22 | 0.38 | |
| women | 247.17 ± 56.27 | 233.98 ± 61.27 | 210.44 ± 47.45 | 224.17 ± 76.81 | ||||||
| Sweat rate forehead (mg/cm2/min) | Cool | men | 1.20 ± 0.36 | 1.42 ± 0.30 | 1.51 ± 0.40 | 1.31 ± 0.61 | 0.27 | 0.28 | 0.11 | 0.57 |
| women | 1.07 ± 0.58 | 1.28 ± 0.64 | 1.45 ± 0.76 | 1.74 ± 0.89 | ||||||
| Neutral | men | 0.93 ± 0.19 | 1.14 ± 0.25 | 1.23 ± 0.35 | 1.01 ± 0.36 | 0.66 | 0.76 | 0.84 | 2.47 | |
| women | 1.75 ± 1.74 | 2.00 ± 1.56 | 2.15 ± 1.50 | 3.00 ± 1.08 | ||||||
| Hot | men | 1.39 ± 0.71 | 1.57 ± 0.85 | 1.67 ± 0.82 | 1.64 ± 1.03 | 0.13 | 0.30 | 0.41 | 0.59 | |
| women | 1.49 ± 0.83 | 1.84 ± 0.91 | 2.03 ± 0.89 | 2.28 ± 1.13 | ||||||
| Sweat rate leg (mg/cm2/min) | Cool | men | 0.56 ± 0.38 | 0.61 ± 0.48 | 0.74 ± 0.46 | 0.78 ± 0.57 | 0.58 | 0.23 | 0.06 | 0.02 |
| women | 0.80 ± 0.44 | 0.70 ± 0.28 | 0.76 ± 0.30 | 0.77 ± 0.33 | ||||||
| Neutral | men | 0.75 ± 0.33 | 0.90 ± 0.47 | 0.89 ± 0.50 | 0.85 ± 0.66 | 0.66 | 0.23 | 0.56 | 0.26 | |
| women | 1.04 ± 1.30 | 0.76 ± 0.79 | 0.64 ± 0.55 | 0.71 ± 0.38 | ||||||
| Hot | men | 1.34 ± 0.29 | 1.40 ± 0.42 | 1.55 ± 0.71 | 1.64 ± 0.95 | 0.15 | 0.30 | 0.02 | 0.91 | |
| women | 1.26 ± 0.71 | 1.53 ± 1.08 | 1.20 ± 0.54 | 0.99 ± 0.36 | ||||||
| Heart rate (beats/min) | Cool | men | 64.89 ± 4.62 | 64.31 ± 3.57 | 71.17 ± 6.33 | 68.46 ± 9.52 | 1.43 | 1.05 | 0.90 | 1.29 |
| women | 75.68 ± 9.60 | 71.78 ± 9.45 | 77.76 ± 8.21 | 80.90 ± 9.74 | ||||||
| Neutral | men | 65.46 ± 2.87 | 65.11 ± 3.04 | 68.63 ± 4.08 | 64.07 ± 5.26 | 1.81 | 1.55 | 0.73 | 0.58 | |
| women | 78.68 ± 9.90 | 76.15 ± 9.57 | 73.11 ± 7.61 | 68.98 ± 10.76 | ||||||
| Hot | men | 72.48 ± 9.43 | 72.34 ± 7.84 | 72.53 ± 6.41 | 68.02 ± 4.22 | 0.87 | 0.94 | 0.62 | 0.66 | |
| women | 81.20 ± 10.48 | 81.52 ± 11.44 | 78.75 ± 12.63 | 75.38 ± 15.12 | ||||||
| Systolic blood pressure (mmHg) | Cool | men | 108.48 ± 8.17 | 109.71 ± 5.96 | 122.20 ± 7.48 | 127.00 ± 11.75 | 0.17 | 0.07 | 0.84 | 0.10 |
| women | 110.17 ± 11.35 | 109.14 ± 9.04 | 131.95 ± 14.60 | 125.50 ± 18.86 | ||||||
| Neutral | men | 106.45 ± 6.07 | 107.67 ± 11.34 | 126.31 ± 13.98 | 121.00 ± 8.25 | 0.44 | 0.70 | 0.42 | 0.73 | |
| women | 103.17 ± 8.49 | 100.83 ± 7.88 | 121.17 ± 10.45 | 113.75 ± 11.27 | ||||||
| Hot | men | 102.83 ± 10.64 | 104.17 ± 8.73 | 111.03 ± 12.26 | 102.75 ± 12.50 | 0.05 | 0.25 | 0.46 | 0.22 | |
| women | 102.39 ± 7.16 | 101.50 ± 12.37 | 106.40 ± 7.34 | 105.00 ± 7.16 | ||||||
| Diastolic blood Pressure (mmHg) | Cool | men | 71.86 ± 8.58 | 71.43 ± 4.83 <0.001 | 86.52 ± 7.71 | 86.75 ± 12.50 | 0.66 | 0.94 | 1.08 | 0.28 |
| women | 77.17 ± 7.59 | 75.86 ± 4.63 | 95.38 ± 8.64 | 92.50 ± 26.06 | ||||||
| Neutral | men | 70.06 ± 8.16 | 68.33 ± 10.67 | 86.78 ± 9.83 | 78.28 ± 10.37 | 0.42 | 0.44 | 0.11 | 0.18 | |
| women | 73.00 ± 5.56 | 72.33 ± 7.09 | 87.75 ± 6.96 | 80.00 ± 9.20 | ||||||
| Hot | men | 67.78 ± 9.22 | 66.00 ± 7.80 | 74.88 ± 10.11 | 67.25 ± 10.69 | 0.67 | 0.47 | 0.36 | 0.99 | |
| women | 72.83 ± 5.23 | 69.00 ± 4.60 | 77.53 ± 2.91 | 78.25 ± 11.41 | ||||||
| Pain index hand (Likert) | Cool | men | 7.09 ± 1.89 | 0.09 | ||||||
| women | 7.32 ± 2.99 | |||||||||
| Neutral | men | 6.86 ± 2.16 | 0.15 | |||||||
| women | 6.45 ± 3.32 | |||||||||
| Hot | men | 5.35 ± 1.96 | 0.59 | |||||||
| women | 3.98 ± 2.62 | |||||||||
| Pain index foot (Likert) | Cool | men | 7.58 ± 1.05 | 0.19 | ||||||
| women | 7.15 ± 3.02 | |||||||||
| Neutral | men | 6.97 ± 1.98 | 0.21 | |||||||
| women | 6.38 ± 3.31 | |||||||||
| Hot | men | 5.37 ± 1.91 | 0.47 | |||||||
| women | 4.31 ± 2.62 | |||||||||
| Pain index hand (VAS) | Cool | men | 6.84 ± 2.04 | 0.01 | ||||||
| women | 6.81 ± 3.05 | |||||||||
| Neutral | men | 6.46 ± 2.33 | 0.07 | |||||||
| women | 6.27 ± 306 | |||||||||
| Hot | men | 5.08 ± 2.21 | 0.34 | |||||||
| women | 4.25 ± 2.65 | |||||||||
| Pain index foot (VAS) | Cool | men | 7.10 ± 1.25 | 0.20 | ||||||
| women | 6.63 ± 3.04 | |||||||||
| Neutral | men | 6.54 ± 1.91 | 0.08 | |||||||
| women | 6.32 ± 3.15 | |||||||||
| Hot | men | 4.90 ± 1.78 | 0.24 | |||||||
| women | 4.38 ± 2.53 | |||||||||
| Distress index hand (Likert) | Cool | men | 7.20 ± 1.89 | 0.06 | ||||||
| women | 7.37 ± 3.48 | |||||||||
| Neutral | men | 6.83 ± 2.44 | 0.03 | |||||||
| women | 6.93 ± 3.61 | |||||||||
| Hot | men | 5.51 ± 1.95 | 0.52 | |||||||
| women | 4.23 ± 2.88 | |||||||||
| Distress index foot (Likert) | Cool | men | 7.54 ± 0.95 | 0.11 | ||||||
| women | 7.26 ± 3.46 | |||||||||
| Neutral | men | 6.66 ± 1.86 | 0.09 | |||||||
| women | 6.91 ± 3.62 | |||||||||
| Hot | men | 5.15 ± 2.04 | 0.26 | |||||||
| women | 4.51 ± 2.77 | |||||||||
| Tactile sensitivity hand (monofil.) | Cool | men | 0.62 ± 0.94 | 0.35 ± 0.73 | 26.14 ± 60.70 | 0.55 | 0.17 | 0.26 | ||
| women | 1.42 ± 1.80 | 0.25 ± 0.25 | 51.55 ± 122.21 | |||||||
| Neutral | men | 0.07 ± 0.00 | 0.13 ± 0.13 | 29.34 ± 59.73 | 0.69 | 0.47 | 0.67 | |||
| women | 0.45 ± 0.77 | 0.39 ± 0.79 | 1.04 ± 0.87 | |||||||
| Hot | men | 0.39 ± 0.79 | 0.07 ± 0.00 | 25.56 ± 60.99 | 0.36 | 0.58 | 0.50 | |||
| women | 0.71 ± 1.00 | 0.39 ± 0.79 | 3.64 ± 7.41 | |||||||
| Tactile sensitivity foot (monofil.) | Cool | men | 0.72 ± 0.89 | 1.72 ± 0.73 | 77.01 ± 124.08 | 0.66 | 0.01 | 0.01 | ||
| women | 1.51 ± 1.43 | 1.73 ± 1.35 | 76.25 ± 124.78 | |||||||
| Neutral | men | 0.82 ± 0.92 | 1.15 ± 0.94 | 76.19 ± 124.66 | 0.00 | 0.22 | 0.20 | |||
| women | 0.82 ± 0.92 | 1.42 ± 1.55 | 51.73 ± 121.63 | |||||||
| Hot | men | 1.41 ± 0.92 | 0.88 ± 0.88 | 1.63 ± 0.48 | 0.91 | 0.51 | 0.58 | |||
| women | 100.52 ± 154.52 | 1.36 ± 1.00 | 51.38 ± 121.80 | |||||||
| Tactile sensitivity hand (esthesiometer) | Cool | men | 2.57 ± 0.74 | 3.46 ± 0.92 | 4.37 ± 1.96 | 0.37 | 0.40 | 0.74 | ||
| women | 3.01 ± 1.52 | 2.99 ± 1.41 | 2.97 ± 1.83 | |||||||
| Neutral | men | 3.11 ± 1.27 | 3.32 ± 1.11 | 3.76 ± 1.55 | 0.10 | 0.49 | 0.47 | |||
| women | 2.99 ± 1.08 | 2.68 ± 1.44 | 2.94 ± 1.93 | |||||||
| Hot | men | 2.80 ± 0.74 | 2.46 ± 0.81 | 3.02 ± 0.55 | 0.63 | 0.19 | 0.12 | |||
| women | 2.17 ± 1.20 | 2.26 ± 1.25 | 2.92 ± 1.08 | |||||||
| Tactile sensitivity Foot (esthesiometer) | Cool | men | 8.28 ± 2.52 | 6.82 ± 2.08 | 7.75 ± 2.31 0.005 | 0.70 | 0.29 | 0.80 | ||
| women | 6.32 ± 3.08 | 6.15 ± 2.51 | 6.03 ± 2.00 | |||||||
| Neutral | men | 5.59 ± 1.05 | 5.02 ± 2.56 | 4.93 ± 2.39 | 0.63 | 0.15 | 0.53 | |||
| women | 6.97 ± 2.91 | 5.43 ± 2.91 | 6.58 ± 365 | |||||||
| Hot | men | 7.30 ± 1.39 | 6.40 ± 2.05 | 6.13 ± 2.41 | 0.36 | 0.56 | 0.01 | |||
| women | 6.43 ± 3.18 | 4.86 ± 3.31 | 6.15 ± 2.86 | |||||||
| Thermal comfort | Cool | men | 2.31 ± 0.94 | 2.36 ± 1.11 | 2.97 ± 0.96 | 2.13 ± 0.63 | 0.29 | 0.06 | 0.13 | 0.93 |
| women | 2.05 ± 0.84 | 2.29 ± 1.25 | 3.13 ± 1.45 | 3.38 ± 1.80 | ||||||
| Neutral | men | 1.33 ± 0.30 | 1.33 ± 0.61 | 1.47 ± 0.43 | 1.88 ± 1.11 | 0.18 | 0.32 | 0.63 | 0.49 | |
| women | 1.25 ± 0.61 | 1.17 ± 0.41 | 1.88 ± 0.82 | 2.38 ± 0.95 | ||||||
| Hot | men | 1.72 ± 0.49 | 2.00 ± 0.89 | 1.58 ± 0.57 | 1.38 ± 0.25 | 0.10 | 0.16 | 0.64 | 0.00 | |
| women | 1.78 ± 0.64 | 2.00 ± 0.89 | 1.29 ± 0.29 | 1.38 ± 0.25 | ||||||
| Thermal sensation | Cool | men | 1.81 ± 0.74 | 1.43 ± 0.98 | 1.84 ± 0.57 | 1.50 ± 1.91 | 0.17 | 0.42 | 0.98 | 0.65 |
| women | 1.67 ± 0.90 | 1.86 ± 1.07 | 2.50 ± 0.78 | 2.50 ± 1.00 | ||||||
| Neutral | men | 0.56 ± 0.46 | 0.17 ± 0.98 | 0.19 ± 0.38 | 1.00 ± 1.15 | 0.82 | 0.16 | 0.80 | 0.62 | |
| women | 0.22 ± 0.35 | 0.00 ± 1.10 | 0.67 ± 0.75 | 1.75 ± 1.26 | ||||||
| Hot | men | 1.72 ± 0.49 | 1.67 ± 0.82 | 1.01 ± 0.74 | 1.50 ± 0.58 | 0.14 | 0.58 | 0.44 | 0.26 | |
| women | 1.78 ± 0.27 | 0.00 ± 1.10 | 1.40 ± 1.00 | 1.25 ± 1.26 | ||||||
| Key: Superscript numbers indicate p values for statistically significant differences at p < 0.008 from paired-samples t tests with a Bonferroni correction. | ||||||||||
| Note: Base = baseline; WI = warm-water immersion; CI = cold-water immersion; Rec = recovery; SkBF = skin blood flow; VAS = visual analogue scale. | ||||||||||
| Effect size (d) interpretation: | very small 0.010.19 | small 0.20.49 | medium 0.50.79 | large 0.81.19 | very large 1.21.99 | huge ≥2.0 | ||||
| higher values in men | ||||||||||
| lower values in men | ||||||||||


References
- Cheung, S.S. Responses of the hands and feet to cold exposure. Temperature 2015, 2, 105–120. [Google Scholar] [CrossRef] [PubMed]
- Daanen, H.A.M.; Koedam, J.; Cheung, S.S. Trainability of cold induced vasodilatation in fingers and toes. Eur. J. Appl. Physiol. 2012, 112, 2595–2601. [Google Scholar] [CrossRef] [PubMed] [Green Version]
- Flouris, A.D.; Cheung, S.S. Influence of thermal balance on cold-induced vasodilation. J. Appl. Physiol. 2009, 106, 1264–1271. [Google Scholar] [CrossRef] [PubMed] [Green Version]
- Flouris, A.D.; Westwood, D.A.; Mekjavic, I.B.; Cheung, S.S. Effect of body temperature on cold induced vasodilation. Eur. J. Appl. Physiol. 2008, 104, 491–499. [Google Scholar] [CrossRef]
- Iida, T. Studies concerning vascular reaction to cold (Part I), Physiological significance of vascular reactions to cold. J. Physiol. Soc. Jpn. 1949, 11, 73–78. [Google Scholar]
- Lewis, T. Observations upon the reactions of the vessels of the human skin to cold. Heart 1930, 15, 177–208. [Google Scholar]
- Mekjavic, I.B.; Dobnikar, U.; Kounalakis, S.N. Cold-induced vasodilatation response in the fingers at 4 different water temperatures. Appl. Physiol. Nutr. Metab. 2012, 38, 14–20. [Google Scholar] [CrossRef]
- Daanen, H.A. Finger cold-induced vasodilation: A review. Eur. J. Appl. Physiol. 2003, 89, 411–426. [Google Scholar] [CrossRef]
- Van der Struijs, N.R.; Van Es, E.M.; Raymann, R.J.; Daanen, H.A. Finger and toe temperatures on exposure to cold water and cold air. Aviat. Space Environ. Med. 2008, 79, 941–946. [Google Scholar] [CrossRef]
- Tyler, C.J.; Reeve, T.; Cheung, S.S. Cold-induced vasodilation during single digit immersion in 0 degrees C and 8 degrees C water in men and women. PLoS ONE 2015, 10, e0122592. [Google Scholar] [CrossRef]
- Castellani, J.W.; O’Brien, C. Peripheral Vasodilation Responses to Prevent Local Cold Injuries; U.S. Army Research Institute of Environmental Medicine: Natick, MA, USA, 2005; pp. KN2-1–KN2-14. [Google Scholar]
- Cheung, S.S.; Mekjavic, I.B. Cold-induced vasodilatation is not homogenous or generalizable across the hand and feet. Eur. J. Appl. Physiol. 2007, 99, 701–705. [Google Scholar] [CrossRef] [PubMed]
- Daanen, H.A.; Ducharme, M.B. Finger cold-induced vasodilation during mild hypothermia, hyperthermia and at thermoneutrality. Aviat. Space Environ. Med. 1999, 70, 1206–1210. [Google Scholar]
- Ciuha, U.; Sotiridis, A.; Mlinar, T.; Royal, J.T.; Eiken, O.; Mekjavic, I.B. Heat acclimation enhances the cold-induced vasodilation response. Eur. J. Appl. Physiol. 2021, 121, 3005–3015. [Google Scholar] [CrossRef] [PubMed]
- Mekjavic, I.B.; Dobnikar, U.; Kounalakis, S.N.; Musizza, B.; Cheung, S.S. The trainability and contralateral response of cold-induced vasodilatation in the fingers following repeated cold exposure. Eur. J. Appl. Physiol. 2008, 104, 193–199. [Google Scholar] [CrossRef] [PubMed]
- Bergersen, T.K.; Eriksen, M.; Walloe, L. Local constriction of arteriovenous anastomoses in the cooled finger. Am. J. Physiol. 1997, 273, R880–R886. [Google Scholar] [CrossRef]
- Bergersen, T.K.; Hisdal, J.; Walloe, L. Perfusion of the human finger during cold-induced vasodilatation. Am. J. Physiol. 1999, 276, R731–R737. [Google Scholar] [CrossRef]
- Reynolds, L.F.; Mekjavic, I.B.; Cheung, S.S. Cold-induced vasodilatation in the foot is not homogenous or trainable over repeated cold exposure. Eur. J. Appl. Physiol. 2007, 102, 73–78. [Google Scholar] [CrossRef]
- Leblanc, J.; Hildes, J.A.; Heroux, O. Tolerance of Gaspe fishermen to cold water. J. Appl. Physiol. 1960, 15, 1031–1034. [Google Scholar] [CrossRef]
- Kramer, K.; Schultze, W. Die Kältedilatation der Hautgefäße. I. Fortlaufende Sauerstoff-, Blutgehalt-, Blutgeschwindigkeits-und Temperaturmessungen an der Haut des Fingers. Pflügers Arch. Physiol. 1948, 250, 141. [Google Scholar] [CrossRef]
- Purkayastha, S.S.; Sharma, R.P.; Ilavazhagan, G.; Sridharan, K.; Ranganathan, S.; Selvamurthy, W. Effect of Vitamin C and E in Modulating Peripheral Vascular Response to Local Cold Stimulus in Man at High Altitude. Jpn. J. Physiol. 1999, 49, 159–167. [Google Scholar] [CrossRef] [Green Version]
- Daanen, H.A.; van Ruiten, H.J. Cold-induced peripheral vasodilation at high altitudes—A field study. High Alt. Med. Biol. 2000, 1, 323–329. [Google Scholar] [CrossRef] [PubMed]
- Cooke, J.P.; Creager, M.A.; Osmundson, P.J.; Shepherd, J.T. Sex differences in control of cutaneous blood flow. Circulation 1990, 82, 1607–1615. [Google Scholar] [CrossRef] [PubMed] [Green Version]
- Daanen, H. Cold Injury Risk of Marines; Report TM-A050; TNO Human Factors: Soesterberg, The Netherlands, 2001. [Google Scholar]
- Khan, F.; Spence, V.A.; Belch, J.J.F. Cutaneous vascular responses and thermoregulation in relation to age. Clin. Sci. 1992, 82, 521–528. [Google Scholar] [CrossRef] [PubMed] [Green Version]
- Miller, L.K.; Irving, L. Local reactions to air cooling in an Eskimo population. J. Appl. Physiol. 1962, 17, 449–455. [Google Scholar] [CrossRef]
- Reading, J.E.; Roberts, D.E.; Prusaczyk, W.K. Gender Differences in Finger Temperatures During Cold Air Exposur; Naval Health Research Center: San Diego, CA, USA, 1997; pp. 1–19. [Google Scholar]
- Tanaka, M. Experimental studies on human reaction to cold. Differences in the vascular hunting reaction to cold according to sex, season, and environmental temperature. Bull. Tokyo Med. Dent. Univ. 1971, 18, 269–280. [Google Scholar]
- Maley, M.J.; Eglin, C.M.; House, J.R.; Tipton, M.J. The effect of ethnicity on the vascular responses to cold exposure of the extremities. Eur. J. Appl. Physiol. 2014, 114, 2369–2379. [Google Scholar] [CrossRef] [Green Version]
- Leteux, S. The place of women in butchery: The role of the spouse in the French butcher’s retail business (1860–1960). Hist. Retail. Consum. 2017, 3, 184–200. [Google Scholar] [CrossRef]
- Gustavsson, M.; Riley, M. Women, capitals and fishing lives: Exploring gendered dynamics in the Llŷn Peninsula small-scale fishery (Wales, UK). Marit. Stud. 2018, 17, 223–231. [Google Scholar] [CrossRef] [Green Version]
- Alvinius, A.; Krekula, C.; Larsson, G. Managing visibility and differentiating in recruitment of women as leaders in the armed forces. J. Gend. Stud. 2018, 27, 534–546. [Google Scholar] [CrossRef]
- Patten, E.; Parker, K. Women in the US Military: Growing Share, Distinctive Profile; Pew Research Center Washington: Washington, DC, USA, 2011. [Google Scholar]
- Cohen, J. Statistical Power Analysis for the Behavioral Sciences, 2nd ed.; Routledge: New York, NY, USA, 2013. [Google Scholar]
- Faul, F.; Erdfelder, E.; Lang, A.G.; Buchner, A. G*Power 3: A flexible statistical power analysis program for the social, behavioral, and biomedical sciences. Behav. Res. Methods 2007, 39, 175–191. [Google Scholar] [CrossRef]
- Notley, S.R.; Dervis, S.; Poirier, M.P.; Kenny, G.P. Menstrual cycle phase does not modulate whole body heat loss during exercise in hot, dry conditions. J. Appl. Physiol. 2019, 126, 286–293. [Google Scholar] [CrossRef] [PubMed]
- Hirata, K.; Nagasaka, T.; Hirai, A.; Hirashita, M.; Takahata, T.; Nunomura, T. Effects of human menstrual cycle on thermoregulatory vasodilation during exercise. Eur. J. Appl. Physiol. Occup. Physiol. 1986, 54, 559–565. [Google Scholar] [CrossRef] [PubMed]
- Ioannou, L.G.; Notley, S.R.; Dinas, P.C.; Gofa, F.; Gourzoulidis, G.A.; Brearley, M.; Epstein, Y.; Havenith, G.; Sawka, M.N.; Bröde, P.; et al. Indicators to assess physiological heat strain—Part 2: Delphi exercise. Temperature, 2022; in press. [Google Scholar] [CrossRef]
- Ioannou, L.G.; Tsoutsoubi, L.; Mantzios, K.; Vliora, M.; Nintou, E.; Piil, J.F.; Notley, S.R.; Dinas, P.C.; Gourzoulidis, G.A.; Brearley, M.; et al. Indicators to assess physiological heat strain—Part 3: Multi-country field evaluation and consensus recommendations. Temperature, 2022; in press. [Google Scholar] [CrossRef]
- Ioannou, L.G.; Mantzios, K.; Tsoutsoubi, L.; Notley, S.R.; Dinas, P.C.; Brearley, M.; Epstein, Y.; Havenith, G.; Sawka, M.N.; Bröde, P.; et al. Indicators to assess physiological heat strain—Part 1: Systematic review. Temperature, 2022; in press. [Google Scholar] [CrossRef]
- Standard 55:2004; Thermal Environmental Conditions for Human Occupancy. American Society of Heating Refrigerating and Air-Conditioning Engineers: Atlanta, GA, USA, 2004.
- Ioannou, L.G.; Tsoutsoubi, L.; Mantzios, K.; Flouris, A.D. A free software to predict heat strain according to the ISO 7933:2018. Ind. Health 2019, 57, 711–720. [Google Scholar] [CrossRef] [Green Version]
- Notley, S.R.; Meade, R.D.; Kenny, G.P. Time following ingestion does not influence the validity of telemetry pill measurements of core temperature during exercise-heat stress: The journal Temperature toolbox. Temperature 2021, 8, 12–20. [Google Scholar] [CrossRef]
- Ramanathan, N.L. A New Weighting System for Mean Surface Temperature of the Human Body. J. Appl. Physiol. 1964, 19, 531–533. [Google Scholar] [CrossRef] [Green Version]
- DeMers, D.; Wachs, D. Physiology, Mean Arterial Pressure; StatPearls: Treasure Island, FL, USA, 2022. [Google Scholar]
- Gagge, A.P.; Stolwijk, J.A.J.; Hardy, J.D. Comfort and thermal sensations and associated physiological responses at various ambient temperatures. Environ. Res. 1967, 1, 1–20. [Google Scholar] [CrossRef]
- Sapa, M.C.; Sagot, J.C.; Touvenot, G.; Xavier, F.; Hidalgo Diaz, J.J.; Facca, S.; Zare, M.; Liverneaux, P. Comparison of tactile sensitivity measured with a new digital esthesiometer (Beam Test) relative to Semmes-Weinstein monofilament analog esthesiometer. Hand Surg. Rehabil. 2019, 38, 242–245. [Google Scholar] [CrossRef]
- Sawilowsky, S.S. New Effect Size Rules of Thumb. J. Mod. Appl. Stat. Methods 2009, 8, 26. [Google Scholar] [CrossRef]
- Bartelink, M.L.; De Wit, A.; Wollersheim, H.; Theeuwes, A.; Thien, T. Skin vascular reactivity in healthy subjects: Influence of hormonal status. J. Appl. Physiol. 1993, 74, 727–732. [Google Scholar] [CrossRef]
- Gagnon, D.; Crandall, C.G.; Kenny, G.P. Sex differences in postsynaptic sweating and cutaneous vasodilation. J. Appl. Physiol. 2013, 114, 394–401. [Google Scholar] [CrossRef] [Green Version]
- Li, X.; Petrini, L.; Defrin, R.; Madeleine, P.; Arendt-Nielsen, L. High resolution topographical mapping of warm and cold sensitivities. Clin. Neurophysiol. 2008, 119, 2641–2646. [Google Scholar] [CrossRef] [PubMed]
- Lunt, H.; Tipton, M. Differences in conductive foot cooling: A comparison between males and females. Eur. J. Appl. Physiol. 2014, 114, 2635–2644. [Google Scholar] [CrossRef] [PubMed]
- Yu, C.-Y.; Tu, H.-H. Foot surface area database and estimation formula. Appl. Ergon. 2009, 40, 767–774. [Google Scholar] [CrossRef] [PubMed]
- Ioannou, L.G.; Foster, J.; Morris, N.B.; Piil, J.F.; Havenith, G.; Mekjavic, I.B.; Kenny, G.P.; Nybo, L.; Flouris, A.D. Occupational heat strain in outdoor workers: A comprehensive review and meta-analysis. Temperature, 2022; in press. [Google Scholar] [CrossRef]
- Flouris, A.D.; McGinn, R.; Poirier, M.P.; Louie, J.C.; Ioannou, L.G.; Tsoutsoubi, L.; Sigal, R.J.; Boulay, P.; Hardcastle, S.G.; Kenny, G.P. Screening criteria for increased susceptibility to heat stress during work or leisure in hot environments in healthy individuals aged 31–70 years. Temperature 2018, 5, 86–99. [Google Scholar] [CrossRef] [Green Version]
- Ioannou, L.G.; Gkikas, G.; Mantzios, K.; Tsoutsoubi, L.; Flouris, A.D. Chapter 32—Risk assessment for heat stress during work and leisure. In Toxicological Risk Assessment and Multi-System Health Impacts from Exposure; Tsatsakis, A.M., Ed.; Academic Press: Amsterdam, The Netherlands, 2021; pp. 373–385. [Google Scholar]
- Armed Forces Health Surveillance Branch. Update: Cold Weather Injuries, Active and Reserve Components, U.S. Armed Forces, July 2015–June 2020. Msmr 2020, 27, 15–24. [Google Scholar]
- Imray, C.H.E.; Oakley, E.H.N. Cold Still Kills: Cold-Related Illnesses In Military Practice Freezing And Non-Freezing Cold Injury. J. R. Army Med. Corps 2005, 151, 218. [Google Scholar] [CrossRef] [Green Version]
- Heil, K.; Thomas, R.; Robertson, G.; Porter, A.; Milner, R.; Wood, A. Freezing and non-freezing cold weather injuries: A systematic review. Br. Med. Bull. 2016, 117, 79–93. [Google Scholar] [CrossRef]
- Connor, R.R. Update: Cold weather injuries, active and reserve components, U.S. Armed Forces, July 2009–June 2014. Msmr 2014, 21, 14–19. [Google Scholar]
- Fudge, J. Preventing and Managing Hypothermia and Frostbite Injury. Sports Health 2016, 8, 133–139. [Google Scholar] [CrossRef] [Green Version]


| Group | n | Age (Years) | Weight (kg) | Height (m) | BMI (kg/m2) | BSA (m2) |
|---|---|---|---|---|---|---|
| Men | 7 | 34.0 ± 12.2 | 81.1 ± 17.7 | 1.76 ± 0.5 | 26.0 ± 5.0 | 2.0 ± 0.2 |
| Women | 7 | 32.1 ± 8.5 | 75.5 ± 15.9 | 1.72 ± 0.5 | 25.4 ± 5.1 | 1.9 ± 1.8 |
| Time (min) | ||||||||||||||||||||||||||||||||||||||||||
|---|---|---|---|---|---|---|---|---|---|---|---|---|---|---|---|---|---|---|---|---|---|---|---|---|---|---|---|---|---|---|---|---|---|---|---|---|---|---|---|---|---|---|
| 0 | 1 | 2 | 3 | 4 | 5 | 6 | 7 | 8 | 9 | 10 | 11 | 12 | 13 | 14 | 15 | 16 | 17 | 18 | 19 | 20 | 21 | 22 | 23 | 24 | 25 | 26 | 27 | 28 | 29 | 30 | 31 | 32 | 33 | 34 | 35 | 36 | 37 | 38 | 39 | 40 | ||
| Women | Second finger | 1 | 1 | 2 | 2 | 2 | 3 | 4 | 4 | 4 | 4 | 4 | 4 | 4 | 4 | 3 | 3 | 3 | 3 | 3 | 2 | 2 | 1 | 1 | 1 | 1 | 1 | 1 | 1 | 1 | 1 | |||||||||||
| First toe | 1 | 1 | 1 | 1 | 1 | 1 | 1 | 1 | 1 | 1 | 1 | 1 | 1 | 1 | 1 | 1 | 1 | 1 | 1 | 1 | 1 | 1 | 1 | 1 | 1 | |||||||||||||||||
| Third toe | 1 | 1 | 1 | 1 | 1 | |||||||||||||||||||||||||||||||||||||
| Fifth toe | 1 | 1 | 1 | 1 | 1 | 1 | ||||||||||||||||||||||||||||||||||||
| First toe * | ||||||||||||||||||||||||||||||||||||||||||
| Men | Second finger | 2 | 2 | 2 | 2 | 3 | 4 | 4 | 4 | 4 | 4 | 5 | 5 | 5 | 5 | 5 | 5 | 5 | 3 | 3 | 3 | 3 | 3 | 3 | 3 | 2 | 2 | 2 | 2 | 2 | 2 | 2 | 2 | 2 | ||||||||
| First toe | ||||||||||||||||||||||||||||||||||||||||||
| Third toe | ||||||||||||||||||||||||||||||||||||||||||
| Fifth toe | ||||||||||||||||||||||||||||||||||||||||||
| First toe * | ||||||||||||||||||||||||||||||||||||||||||
| Time (min) | ||||||||||||||||||||||||||||||||||||||||||
|---|---|---|---|---|---|---|---|---|---|---|---|---|---|---|---|---|---|---|---|---|---|---|---|---|---|---|---|---|---|---|---|---|---|---|---|---|---|---|---|---|---|---|
| 0 | 1 | 2 | 3 | 4 | 5 | 6 | 7 | 8 | 9 | 10 | 11 | 12 | 13 | 14 | 15 | 16 | 17 | 18 | 19 | 20 | 21 | 22 | 23 | 24 | 25 | 26 | 27 | 28 | 29 | 30 | 31 | 32 | 33 | 34 | 35 | 36 | 37 | 38 | 39 | 40 | ||
| Women | 2nd finger | 1 | 1 | 2 | 4 | 5 | 5 | 5 | 5 | 5 | 5 | 4 | 3 | 1 | 1 | 2 | 2 | 2 | 2 | 2 | 2 | 4 | 4 | 4 | 3 | 3 | 3 | 3 | 2 | 2 | 2 | 1 | 1 | 1 | ||||||||
| 1st toe | 1 | 1 | 1 | 1 | 1 | 1 | 1 | 1 | 1 | 1 | 1 | 1 | 1 | 1 | ||||||||||||||||||||||||||||
| 3rd toe | 1 | 1 | 1 | 1 | 1 | 1 | 1 | 1 | 1 | 1 | 1 | 1 | 1 | |||||||||||||||||||||||||||||
| 5th toe | 1 | 1 | 1 | 1 | 1 | 1 | 1 | 1 | 1 | 1 | 1 | 1 | 1 | 1 | 1 | 1 | 1 | 1 | 1 | 1 | 1 | 1 | 1 | 1 | 1 | 1 | 1 | 1 | ||||||||||||||
| 1st toe * | ||||||||||||||||||||||||||||||||||||||||||
| Men | 2nd finger | 1 | 1 | 1 | 2 | 2 | 3 | 3 | 3 | 3 | 3 | 3 | 3 | 3 | 3 | 3 | 3 | 3 | 3 | 3 | 3 | 3 | 2 | 2 | 3 | 2 | 2 | 2 | 3 | 3 | 3 | 3 | 3 | 2 | ||||||||
| 1st toe | ||||||||||||||||||||||||||||||||||||||||||
| 3rd toe | ||||||||||||||||||||||||||||||||||||||||||
| 5th toe | ||||||||||||||||||||||||||||||||||||||||||
| 1st toe * | ||||||||||||||||||||||||||||||||||||||||||
| Time (min) | ||||||||||||||||||||||||||||||||||||||||||
|---|---|---|---|---|---|---|---|---|---|---|---|---|---|---|---|---|---|---|---|---|---|---|---|---|---|---|---|---|---|---|---|---|---|---|---|---|---|---|---|---|---|---|
| 0 | 1 | 2 | 3 | 4 | 5 | 6 | 7 | 8 | 9 | 10 | 11 | 12 | 13 | 14 | 15 | 16 | 17 | 18 | 19 | 20 | 21 | 22 | 23 | 24 | 25 | 26 | 27 | 28 | 29 | 30 | 31 | 32 | 33 | 34 | 35 | 36 | 37 | 38 | 39 | 40 | ||
| Women | 2nd finger | 1 | 1 | 1 | 3 | 4 | 4 | 5 | 5 | 5 | 5 | 5 | 5 | 5 | 5 | 5 | 5 | 5 | 5 | 5 | 5 | 5 | 5 | 5 | 5 | 5 | 5 | 3 | 3 | 3 | 3 | 3 | 2 | 2 | 2 | |||||||
| 1st toe | 1 | 2 | 2 | 2 | 2 | 2 | 3 | 4 | 4 | 4 | 4 | 3 | 3 | 4 | 4 | 4 | 3 | 4 | 2 | 3 | 3 | 3 | 3 | 4 | 4 | 4 | 4 | 4 | 3 | 3 | 3 | 2 | 2 | |||||||||
| 3rd toe | 1 | 1 | 3 | 3 | 3 | 4 | 4 | 5 | 5 | 5 | 5 | 4 | 4 | 4 | 3 | 2 | 3 | 2 | 3 | 3 | 3 | 3 | 4 | 4 | 4 | 4 | 4 | 3 | 3 | 3 | 2 | 1 | 1 | 1 | 1 | |||||||
| 5th toe | 2 | 3 | 3 | 4 | 5 | 5 | 5 | 5 | 5 | 5 | 4 | 4 | 4 | 3 | 2 | 2 | 2 | 2 | 2 | 2 | 2 | 2 | 2 | 3 | 2 | 2 | 2 | 2 | 1 | 1 | 1 | 1 | ||||||||||
| 1st toe * | 1 | 1 | 1 | 1 | 1 | 1 | 1 | 1 | 1 | 1 | 1 | 1 | 1 | 1 | 1 | 1 | 1 | 1 | 1 | 1 | 1 | 1 | ||||||||||||||||||||
| Men | 2nd finger | 1 | 1 | 1 | 1 | 1 | 1 | 2 | 2 | 3 | 3 | 3 | 3 | 2 | 2 | 3 | 3 | 3 | 3 | 3 | 3 | 3 | 4 | 4 | 4 | 4 | 4 | 4 | 4 | 4 | 4 | 3 | 2 | 2 | 2 | 2 | ||||||
| 1st toe | 2 | 2 | 2 | 2 | 2 | 2 | 2 | 2 | 2 | 2 | 2 | 1 | 2 | 2 | 2 | 2 | 2 | 2 | 2 | 1 | 1 | 1 | 1 | 1 | 1 | 1 | 1 | |||||||||||||||
| 3rd toe | 1 | 2 | 3 | 3 | 3 | 3 | 2 | 2 | 2 | 3 | 3 | 2 | 2 | 2 | 1 | 1 | 1 | 1 | 1 | 1 | 1 | 1 | 1 | 1 | 1 | 1 | 1 | 1 | 1 | |||||||||||||
| 5th toe | 1 | 2 | 2 | 2 | 2 | 2 | 2 | 2 | 2 | 2 | 2 | 3 | 1 | 1 | 1 | 1 | 1 | 2 | 2 | 2 | 2 | 2 | 1 | 1 | 1 | 1 | 1 | |||||||||||||||
| 1st toe * | 1 | 2 | 2 | 2 | 2 | 2 | 1 | 1 | 1 | 1 | 1 | 1 | 1 | 1 | 1 | 1 | 2 | 1 | 1 | 1 | 1 | 1 | 1 | 1 | 1 | 1 | 1 | 1 | 1 | |||||||||||||
Publisher’s Note: MDPI stays neutral with regard to jurisdictional claims in published maps and institutional affiliations. |
© 2022 by the authors. Licensee MDPI, Basel, Switzerland. This article is an open access article distributed under the terms and conditions of the Creative Commons Attribution (CC BY) license (https://creativecommons.org/licenses/by/4.0/).
Share and Cite
Tsoutsoubi, L.; Ioannou, L.G.; Mantzios, K.; Ziaka, S.; Nybo, L.; Flouris, A.D. Cardiovascular Stress and Characteristics of Cold-Induced Vasodilation in Women and Men during Cold-Water Immersion: A Randomized Control Study. Biology 2022, 11, 1054. https://doi.org/10.3390/biology11071054
Tsoutsoubi L, Ioannou LG, Mantzios K, Ziaka S, Nybo L, Flouris AD. Cardiovascular Stress and Characteristics of Cold-Induced Vasodilation in Women and Men during Cold-Water Immersion: A Randomized Control Study. Biology. 2022; 11(7):1054. https://doi.org/10.3390/biology11071054
Chicago/Turabian StyleTsoutsoubi, Lydia, Leonidas G. Ioannou, Konstantinos Mantzios, Styliani Ziaka, Lars Nybo, and Andreas D. Flouris. 2022. "Cardiovascular Stress and Characteristics of Cold-Induced Vasodilation in Women and Men during Cold-Water Immersion: A Randomized Control Study" Biology 11, no. 7: 1054. https://doi.org/10.3390/biology11071054
APA StyleTsoutsoubi, L., Ioannou, L. G., Mantzios, K., Ziaka, S., Nybo, L., & Flouris, A. D. (2022). Cardiovascular Stress and Characteristics of Cold-Induced Vasodilation in Women and Men during Cold-Water Immersion: A Randomized Control Study. Biology, 11(7), 1054. https://doi.org/10.3390/biology11071054