Possible Event-Related Potential Correlates of Voluntary Attention and Reflexive Attention in the Emei Music Frog
Abstract
Simple Summary
Abstract
1. Introduction
2. Materials and Methods
2.1. Animals
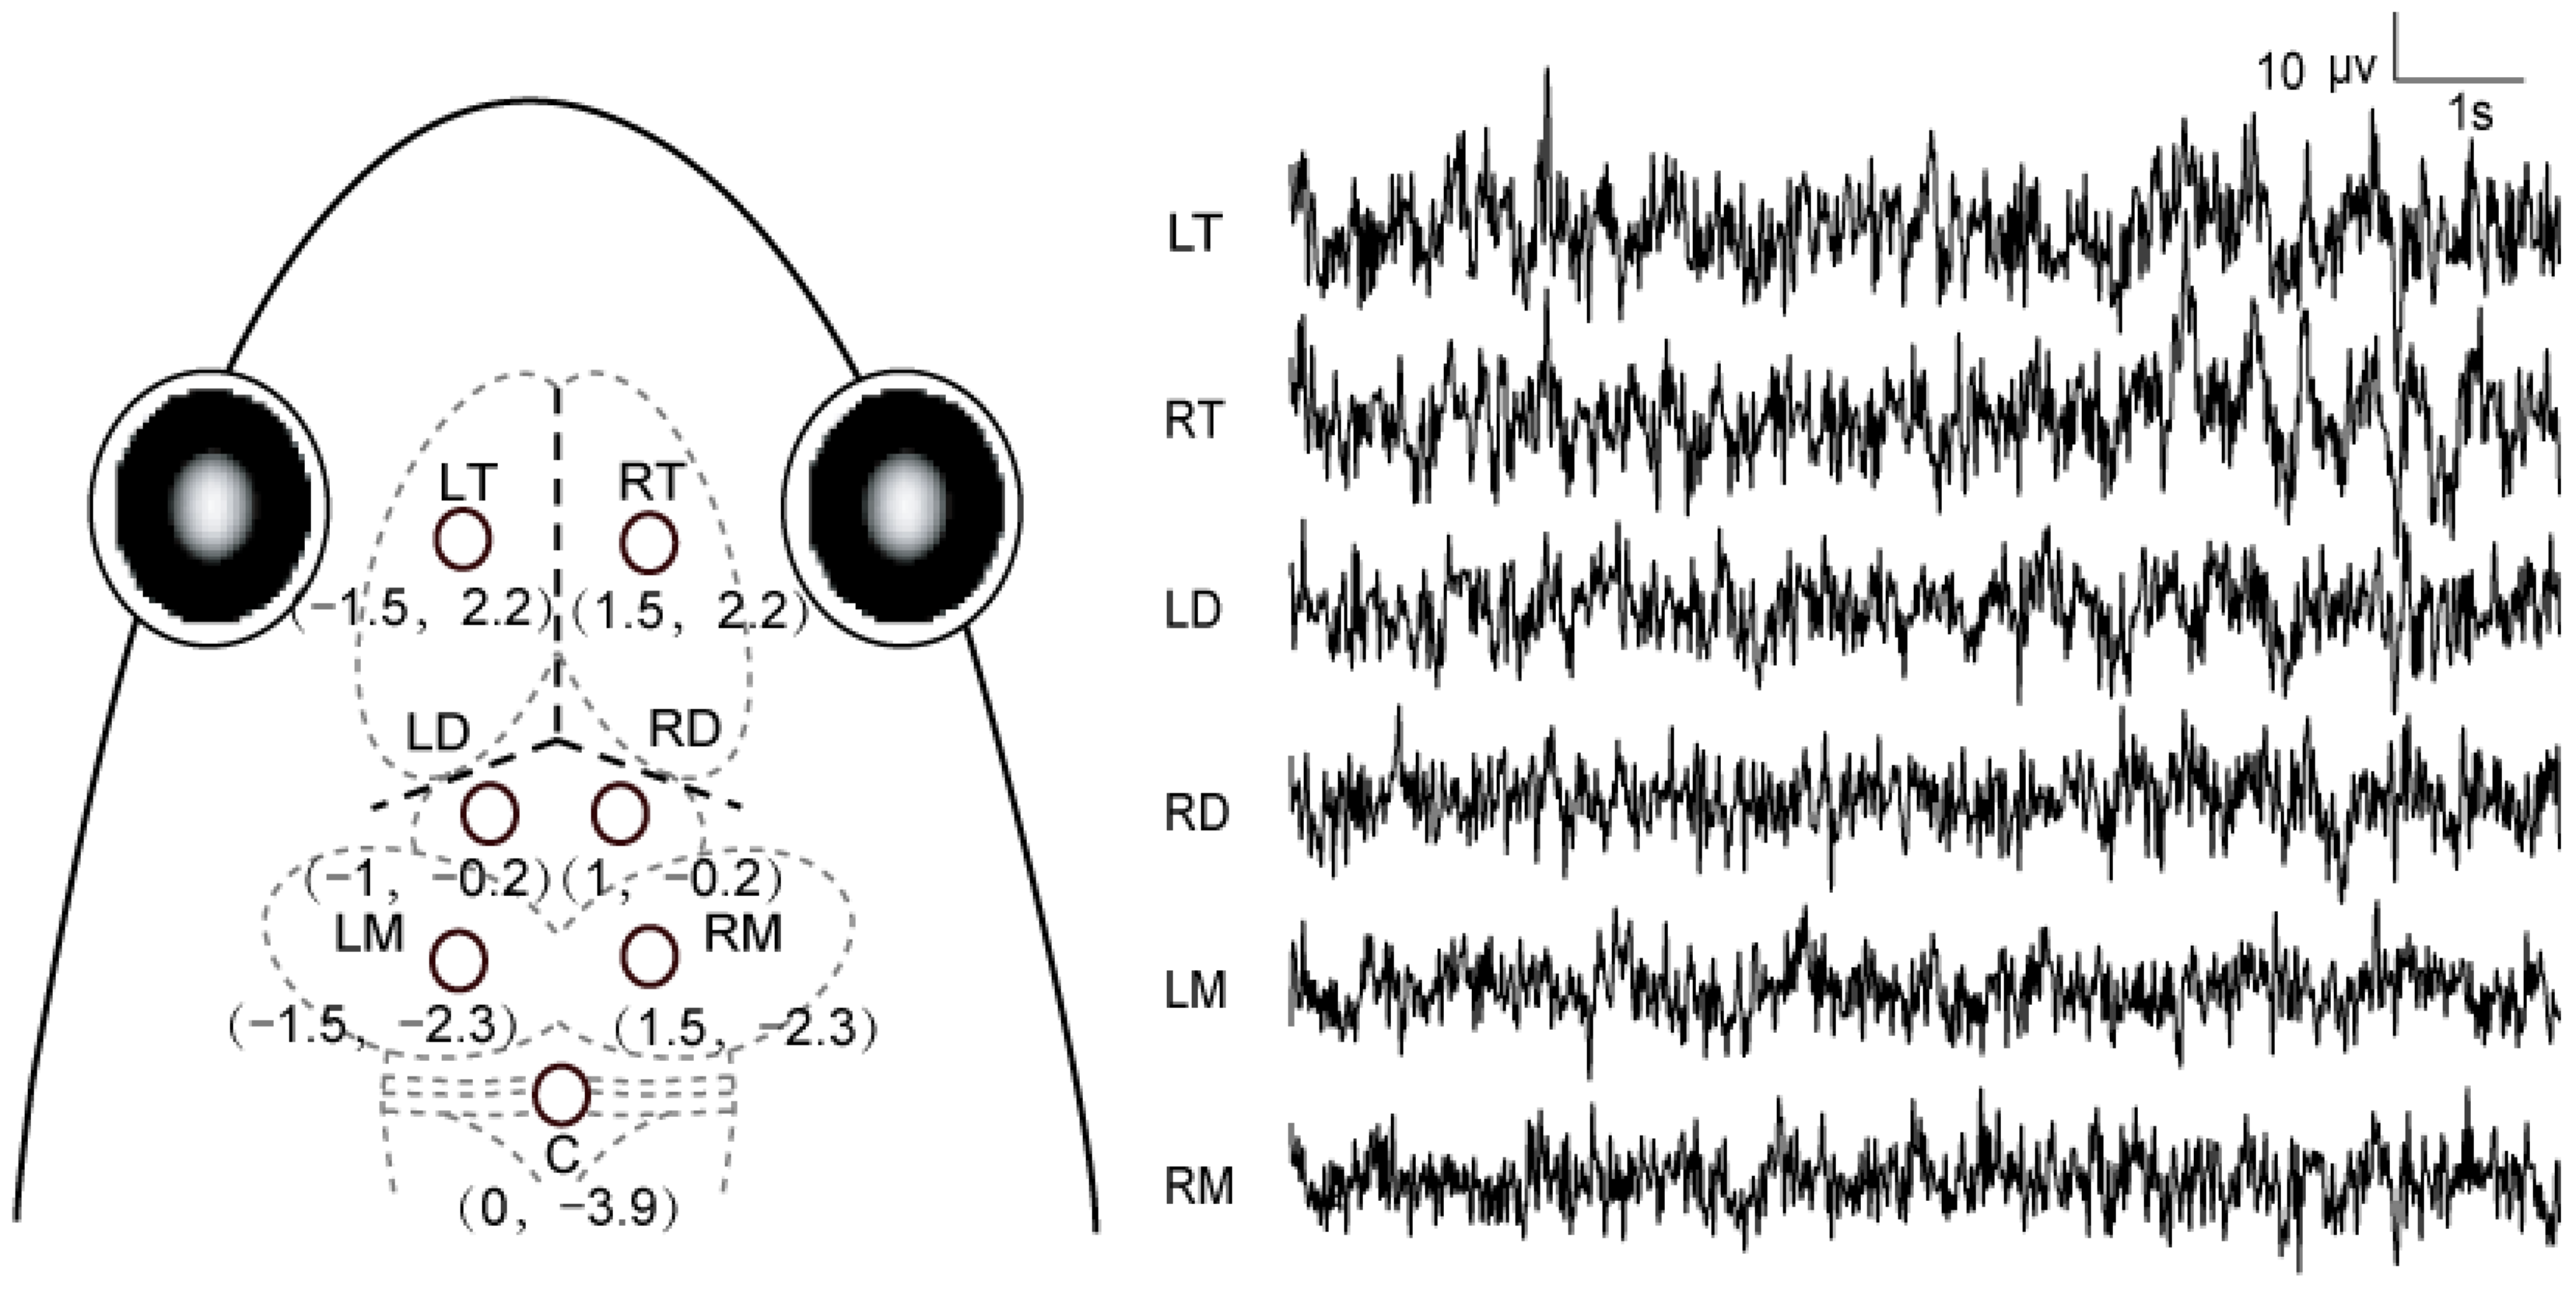
2.2. Surgery
2.3. Recording Conditions
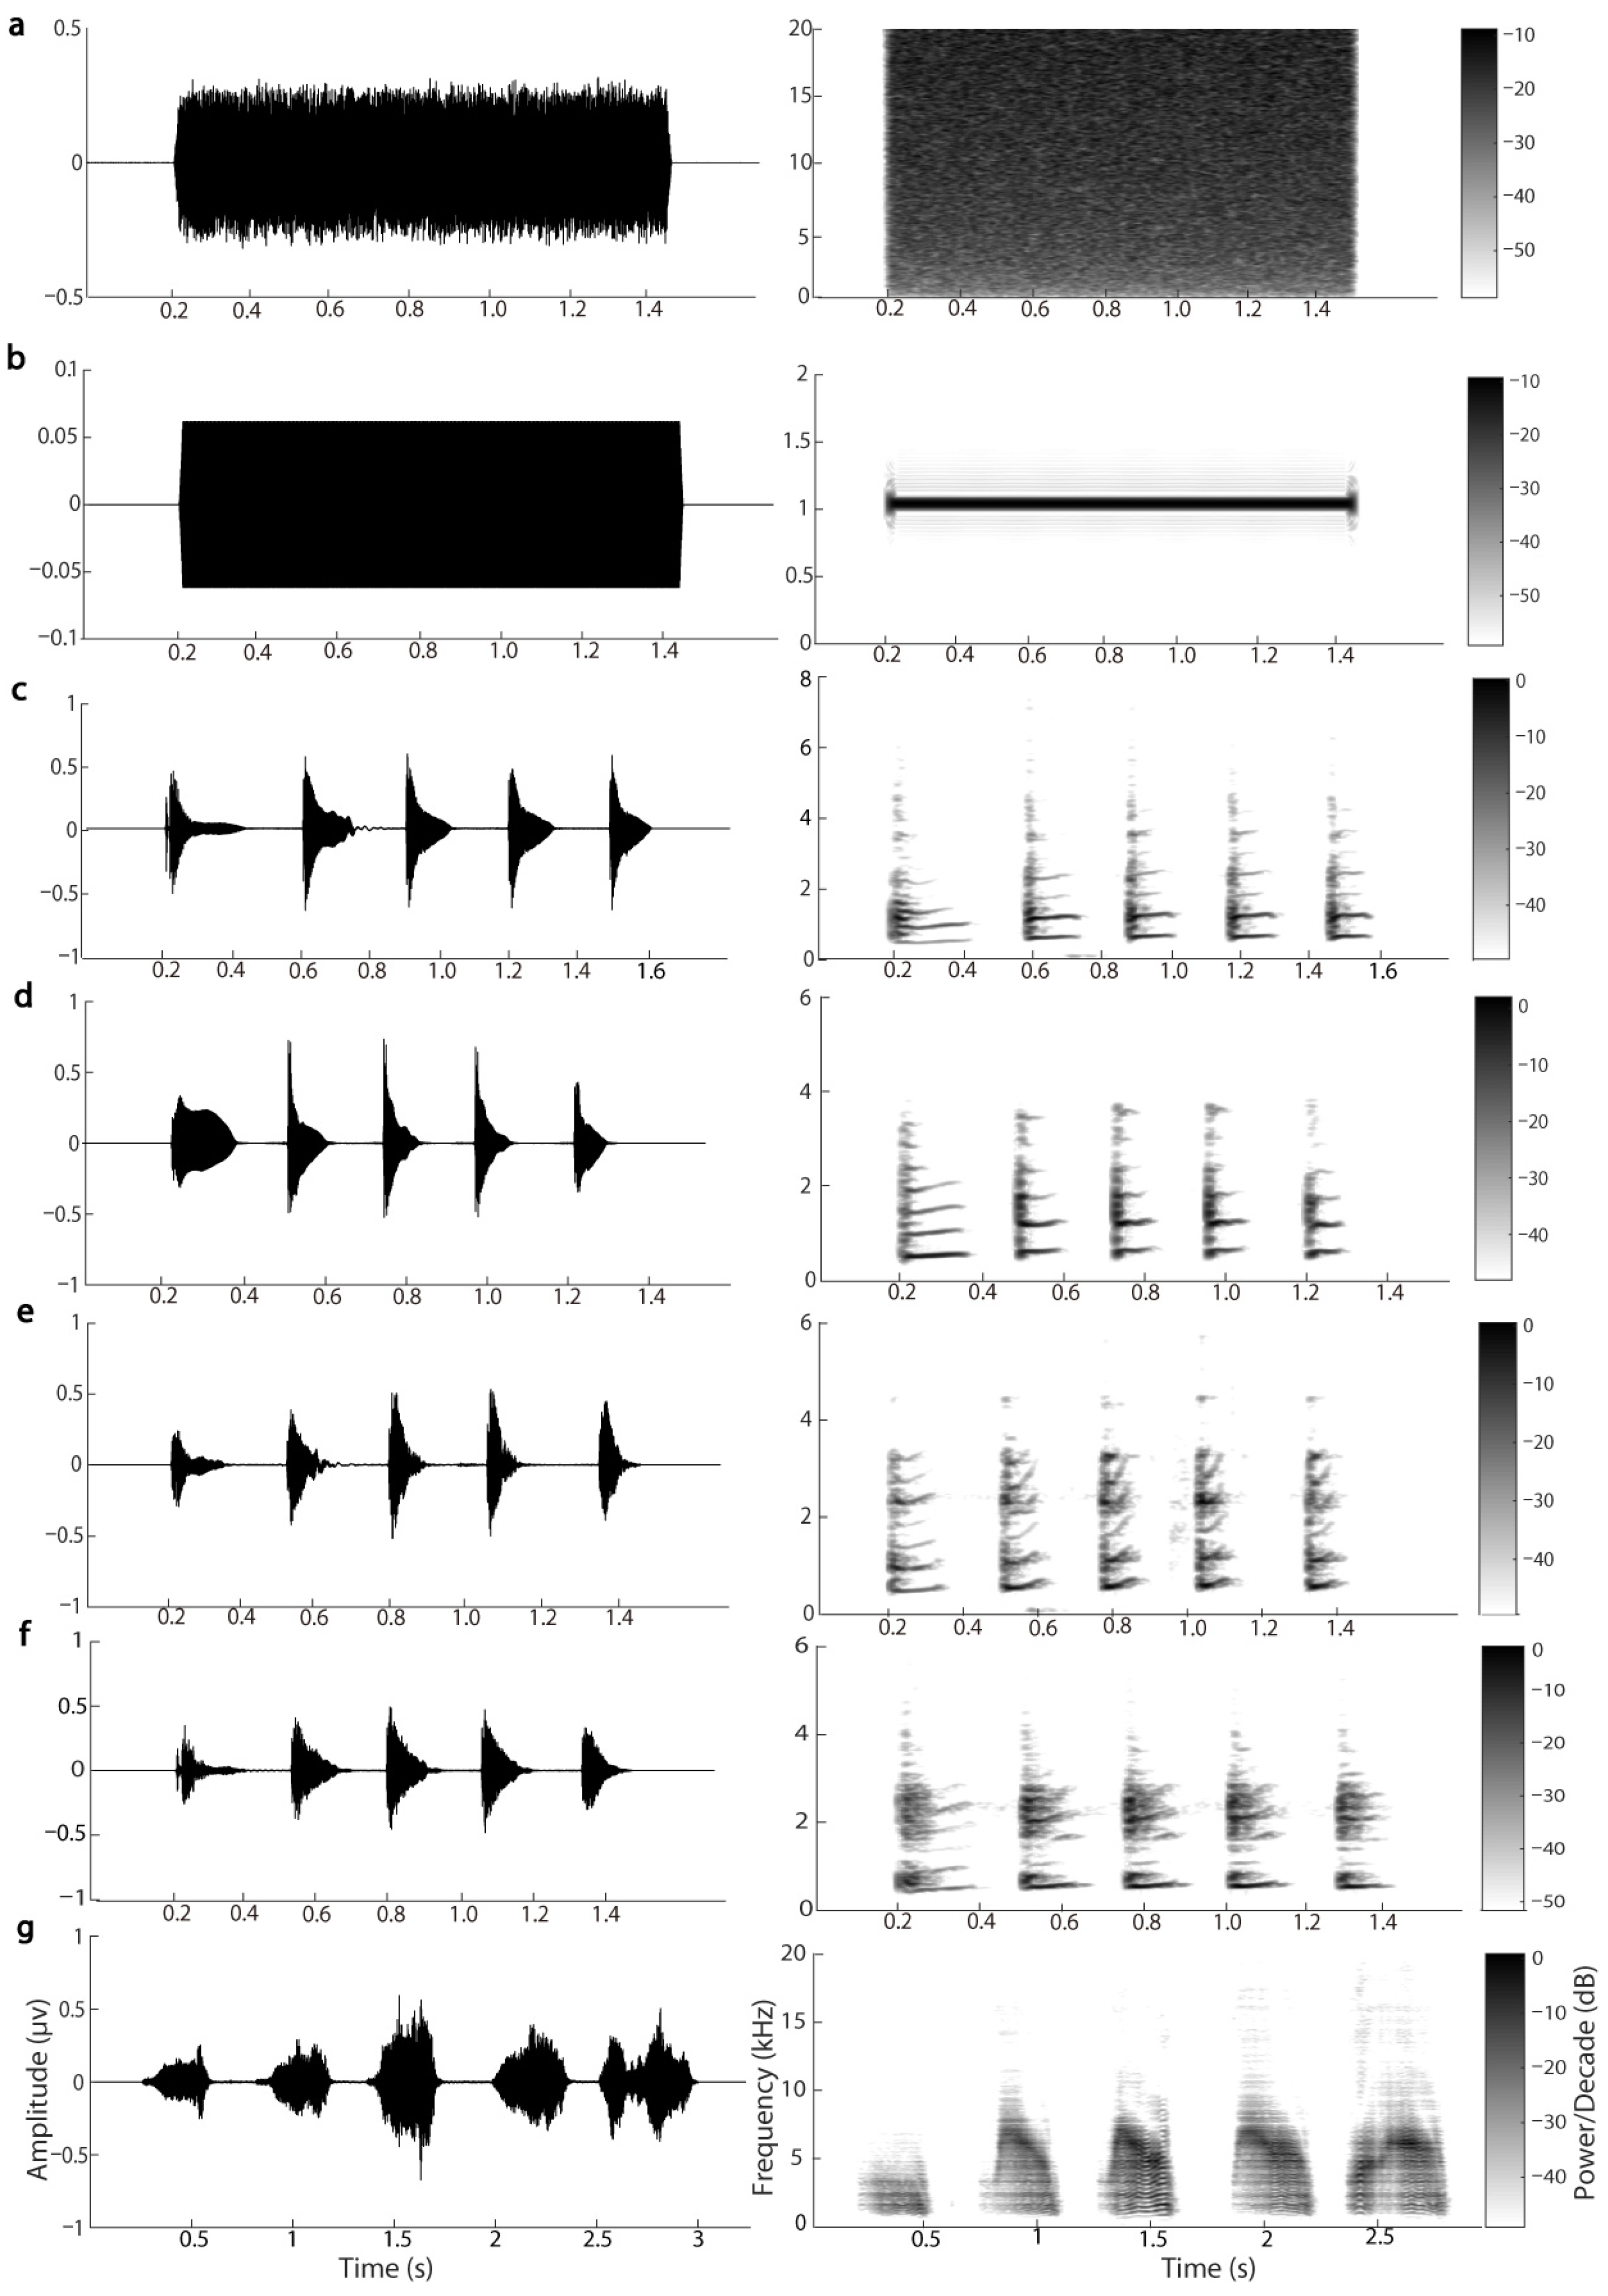
2.4. Stimulus and Procedure
2.5. Data Acquisition and Processing
2.6. Statistical Analyses
3. Results
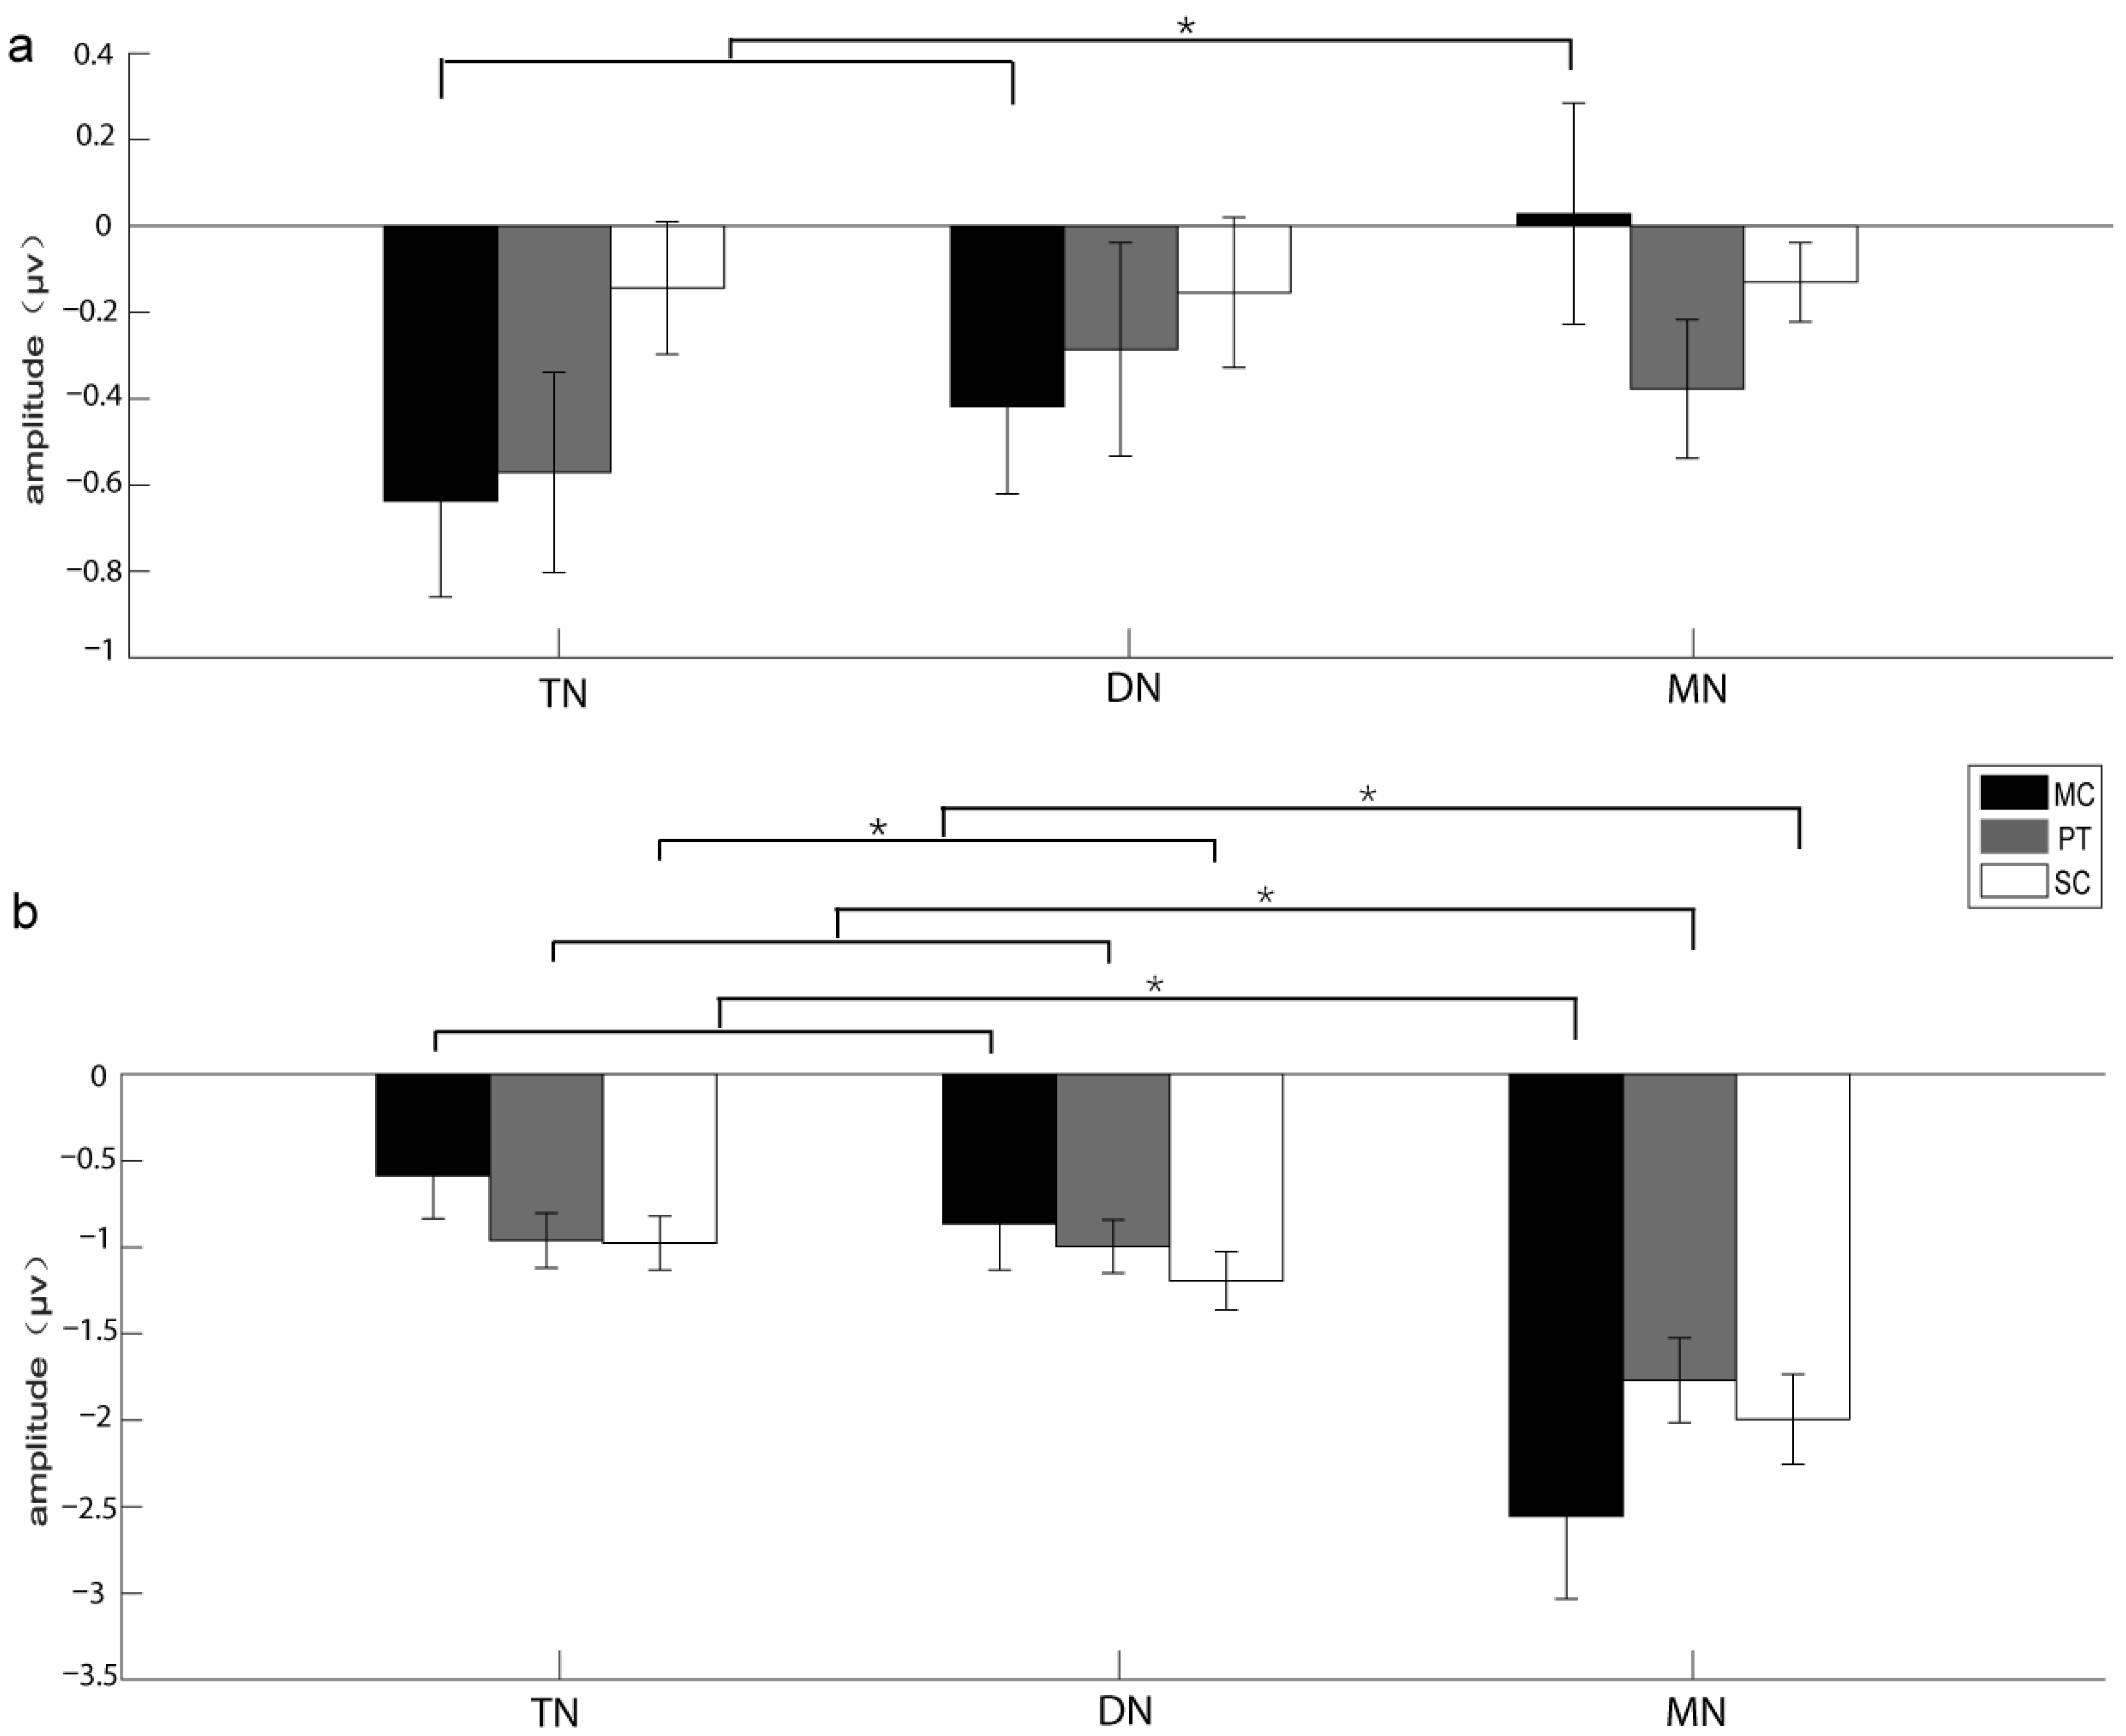
3.1. The Results of the Experiments Recruiting Voluntary Attention
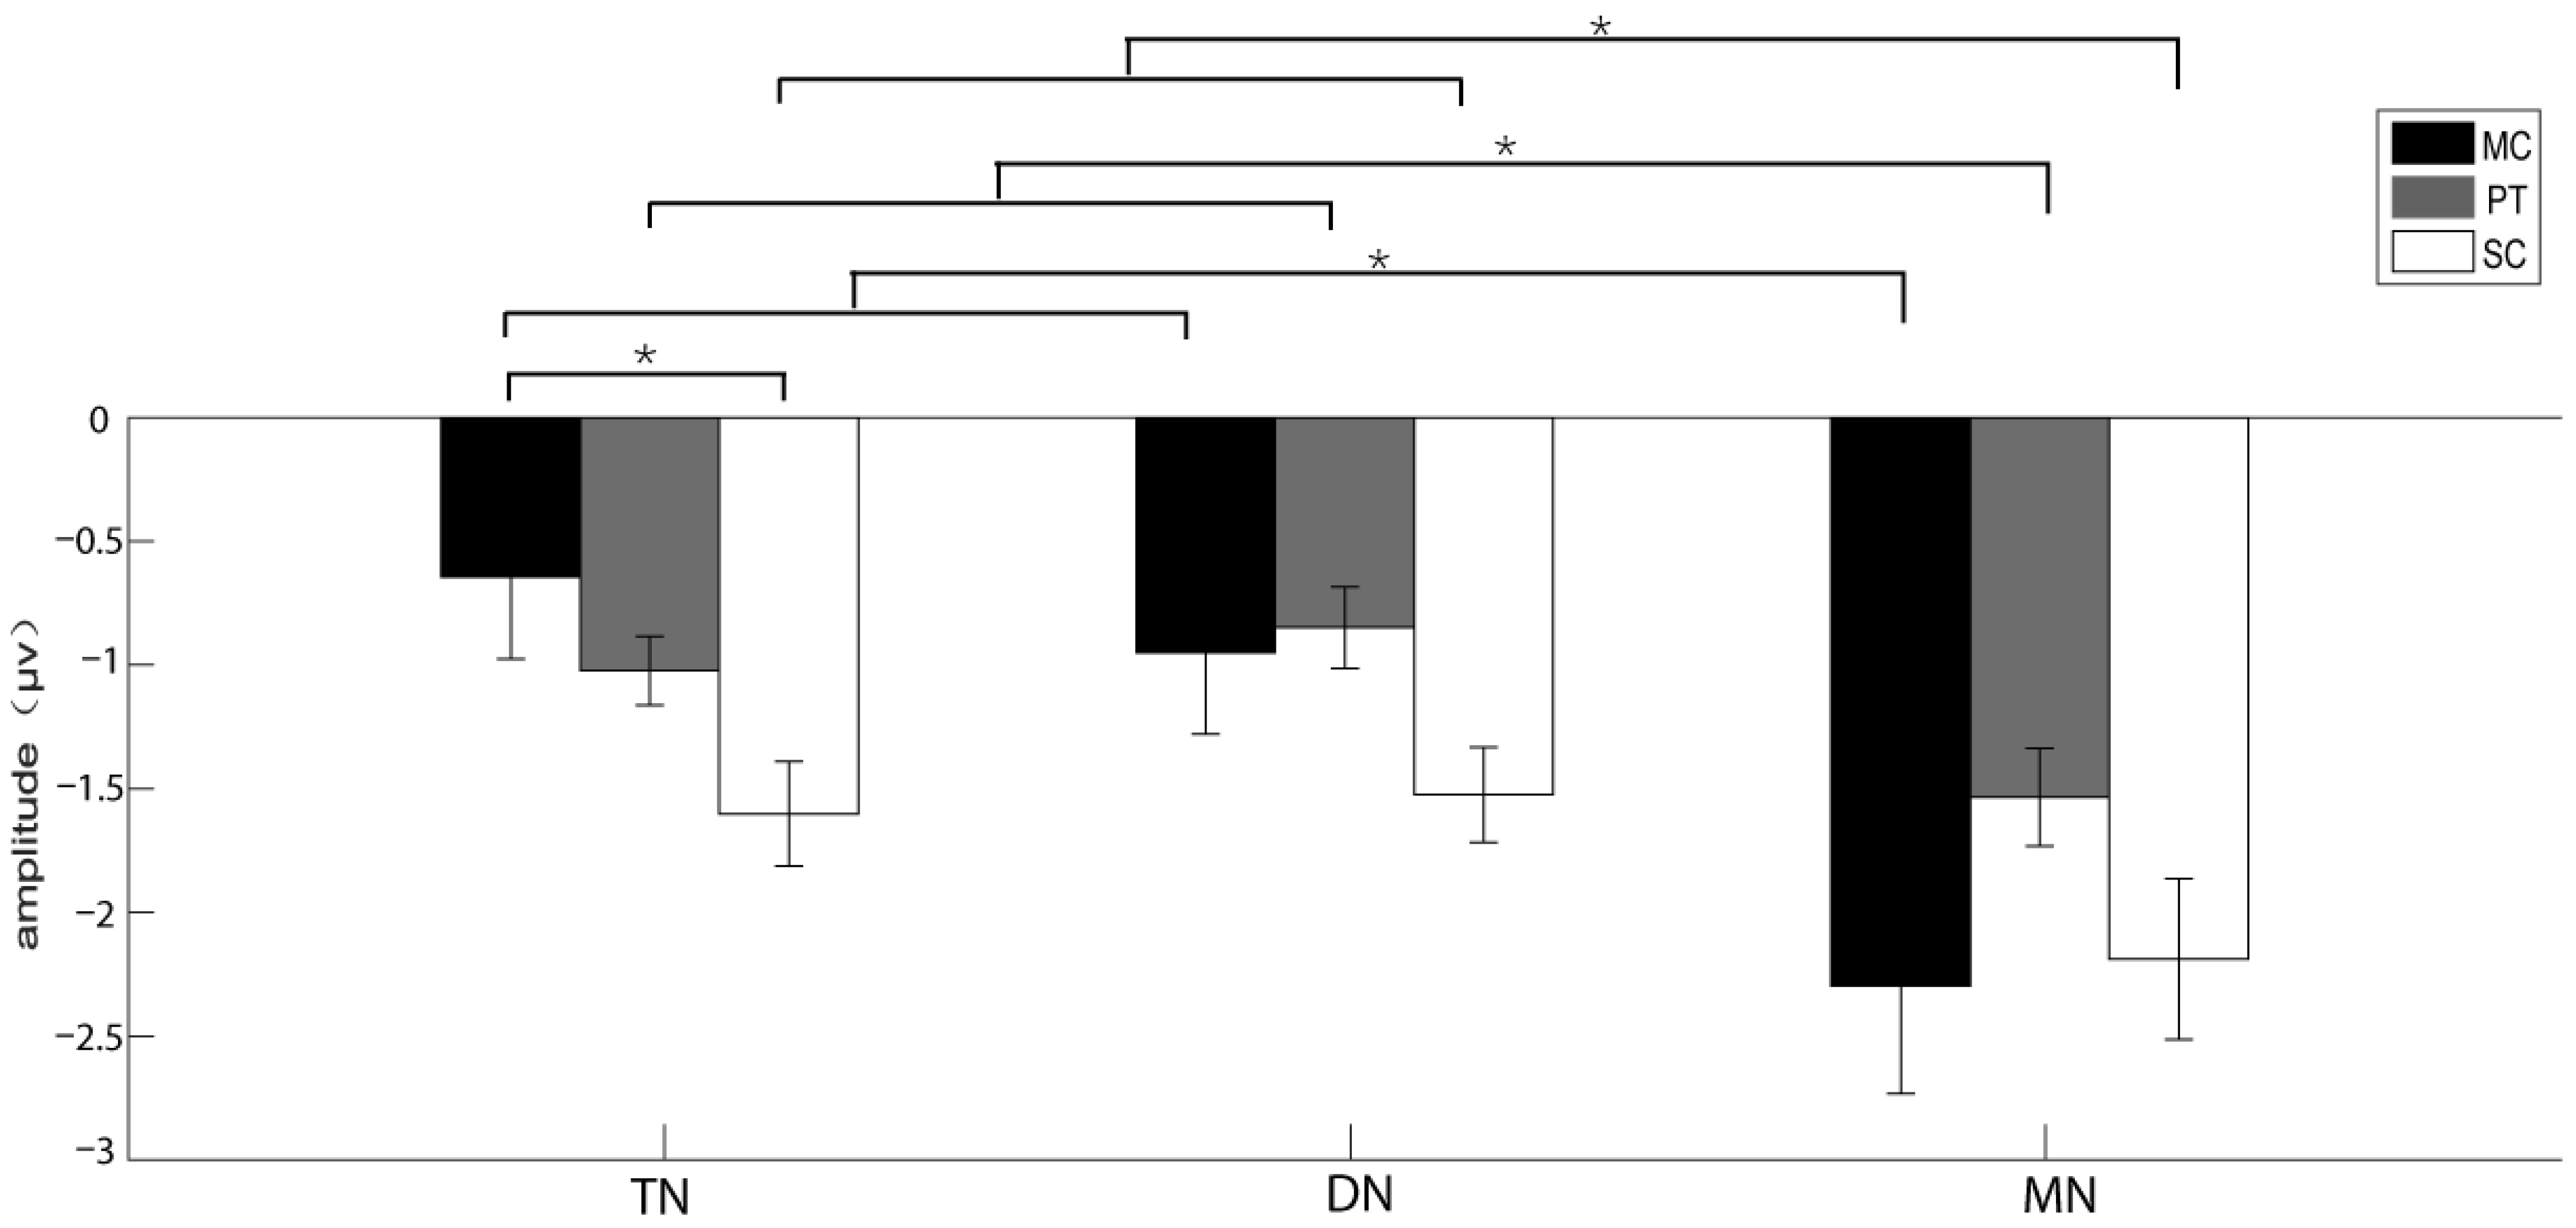
3.2. The Results of the Experiments Recruiting Reflexive Attention
4. Discussion
4.1. Voluntary Attention Involved in Auditory Perception of Music Frogs
4.2. Reflexive Attention Also Involved in Auditory Perception of Music Frogs
4.3. The Combination of Voluntary Attention and Reflexive Attention May Guide Auditory Perception in Music Frogs
5. Conclusions
Supplementary Materials
Author Contributions
Funding
Institutional Review Board Statement
Informed Consent Statement
Data Availability Statement
Conflicts of Interest
References
- Knudsen, E.I. Neural circuits that mediate selective attention: A comparative perspective. Trends Neurosci. 2018, 41, 789–805. [Google Scholar] [CrossRef] [PubMed]
- Pinto, Y.; Van, D.; Sligte, I.G.; Lamme, V.; Scholte, H.S. Bottom-up and top-down attention are independent. J. Vis. 2013, 13, 16. [Google Scholar] [CrossRef] [PubMed]
- Corbetta, M.; Shulman, G.L. Control of goal-directed and stimulus-driven attention in the brain. Nat. Rev. Neurosci. 2002, 3, 201–215. [Google Scholar] [CrossRef] [PubMed]
- Bugg, J.M.; Crump, M.J. In support of a distinction between voluntary and stimulus-driven control: A review of the literature on proportion congruent effects. Front. Psychol. 2012, 3, 367. [Google Scholar] [CrossRef]
- Van Moorselaar, D.; Slagter, H.A. Inhibition in selective attention. Ann. N. Y. Acad. Sci. 2020, 1464, 204–221. [Google Scholar] [CrossRef]
- Müller, H.J.; Rabbitt, P.M. Reflexive and voluntary orienting of visual attention: Time course of activation and resistance to interruption. J. Exp. Psychol. Hum. Percept. Perform. 1989, 15, 315–330. [Google Scholar] [CrossRef]
- Bizley, J.K.; Cohen, Y.E. The what, where and how of auditory-object perception. Nat. Rev. Neurosci. 2013, 14, 693–707. [Google Scholar] [CrossRef]
- Soha, J. The auditory template hypothesis: A review and comparative perspective. Anim. Behav. 2017, 124, 247–254. [Google Scholar] [CrossRef]
- Schwartz, Z.P.; David, S.V. Focal suppression of distractor sounds by selective attention in auditory cortex. Cereb. Cortex 2018, 28, 323–339. [Google Scholar] [CrossRef]
- Rajala, A.Z.; Jenison, R.L.; Populin, L.C. Neural correlate of auditory spatial attention allocation in the superior colliculus. J. Neurophysiol. 2018, 119, 1450–1460. [Google Scholar] [CrossRef]
- Shinn-Cunningham, B. Auditory attention and the active listener. J. Acoust. Soc. Am. 2009, 125, 2651. [Google Scholar] [CrossRef]
- Suzuki, T.N.; Wheatcroft, D.; Griesser, M. Experimental evidence for compositional syntax in bird calls. Nat. Commun. 2016, 7, 10986. [Google Scholar] [CrossRef] [PubMed]
- Alho, K.; Salmi, J.; Koistinen, S.; Salonen, O.; Rinne, T. Top-down controlled and bottom-up triggered orienting of auditory attention to pitch activate overlapping brain networks. Brain Res. 2015, 1626, 136–145. [Google Scholar] [CrossRef] [PubMed]
- Katsuki, F.; Constantinidis, C. Bottom-up and top-down attention: Different processes and overlapping neural systems. Neuroscientist 2014, 20, 509–521. [Google Scholar] [CrossRef] [PubMed]
- Salmi, J.; Rinne, T.; Koistinen, S.; Salonen, O.; Alho, K. Brain networks of bottom-up triggered and top-down controlled shifting of auditory attention. Brain Res. 2009, 1286, 155–164. [Google Scholar] [CrossRef]
- Kelley, D.B. Vocal communication in frogs. Curr. Opin. Neurobiol. 2004, 14, 751–757. [Google Scholar] [CrossRef]
- Gerhardt, H.C.; Bee, M.A. Recognition and localization of acoustic signals. In Hearing and Sound Communication in Amphibians; Narins, P.M., Feng, A.S., Fay, R.R., Popper, A.N., Eds.; Springer: New York, NY, USA, 2007; pp. 113–146. [Google Scholar]
- Bee, M.A.; Micheyl, C. The cocktail party problem: What is it? How can it be solved? And why should animal behaviorists study it? J. Comp. Psychol. 2008, 122, 235–251. [Google Scholar] [CrossRef]
- Marshall, V.T.; Schwartz, J.J.; Gerhardt, H.C. Effects of heterospecific call overlap on the phonotactic behaviour of grey treefrogs. Anim. Behav. 2006, 72, 449–459. [Google Scholar] [CrossRef]
- Wells, K.D.; Schwartz, J.J. The behavioral ecology of anuran communication. In Hearing and Sound Communication in Amphibians; Springer: New York, NY, USA, 2007; pp. 44–86. [Google Scholar]
- Brumm, H.; Slabbekoorn, H. Acoustic communication in noise. Adv. Study Behav. 2005, 35, 151–209. [Google Scholar]
- Vélez, A.; Schwartz, J.J.; Bee, M.A. Anuran acoustic signal perception in noisy environments. In Animal Communication and Noise; Brumm, H., Ed.; Springer: Berlin/Heidelberg, Germany, 2013; pp. 133–185. [Google Scholar]
- Bee, M.A. Sound source perception in anuran amphibians. Curr. Opin. Neurobiol. 2012, 22, 301–310. [Google Scholar] [CrossRef]
- Brush, J.S.; Narins, P.M. Chorus dynamics of a neotropical amphibian assemblage: Comparison of computer simulation and natural behaviour. Anim. Behav. 1989, 37, 33–44. [Google Scholar] [CrossRef]
- Schwartz, J.J. Male calling behavior, female discrimination and acoustic interference in the Neotropical treefrog Hyla microcephala under realistic acoustic conditions. Behav. Ecol. Sociobiol. 1993, 32, 401–414. [Google Scholar] [CrossRef]
- Greenfield, M.D. Signalers and Receivers: Mechanisms and Evolution of Arthropod Communication; Oxford University Press: Oxford, UK, 2002. [Google Scholar]
- Greenfield, M.D. Mechanisms and evolution of communal sexual displays in arthropods and anurans. Adv. Study Behav. 2005, 35, 1–62. [Google Scholar]
- Zurek, P.M. The precedence effect. In Directional Hearing; Springer: New York, NY, USA, 1987; pp. 85–105. [Google Scholar]
- Litovsky, R.Y.; Colburn, H.S.; Yost, W.A.; Guzman, S.J. The precedence effect. J. Acoust. Soc. Am. 1999, 106, 1633–1654. [Google Scholar] [CrossRef] [PubMed]
- Luck, S.J. An Introduction to the Event-Related Potential Technique; MIT Press: Cambridge, MA, USA, 2014. [Google Scholar]
- Tremblay, K.; Kraus, N.; Mcgee, T.; Ponton, C.; Otis, B. Central auditory plasticity: Changes in the N1-P2 complex after speech-sound training. Ear Hear. 2001, 22, 79–90. [Google Scholar] [CrossRef] [PubMed]
- Polich, J.; Criado, J.R. Neuropsychology and neuropharmacology of P3a and P3b. Int. J. Psychophysiol. 2006, 60, 172–185. [Google Scholar] [CrossRef]
- Näätänen, R.; Sams, M.; Alho, K.; Paavilainen, P.; Reinikainen, K.; Sokolov, E.N. Frequency and location specificity of the human vertex N1 wave. Electroencephalogr. Clin. Neurophysiol. 1988, 69, 23–31. [Google Scholar] [CrossRef]
- Näätänen, R.; Picton, T. The N1 wave of the human electric and magnetic response to sound: A review and an analysis of the component structure. Psychophysiology 1987, 24, 375–425. [Google Scholar] [CrossRef]
- Tanovic, E.; Joormann, J. Anticipating the unknown: The stimulus-preceding negativity is enhanced by uncertain threat. Int. J. Psychophysiol. 2019, 139, 68–73. [Google Scholar] [CrossRef]
- Walentowska, W.; Paul, K.; Severo, M.C.; Moors, A.; Pourtois, G. Relevance and uncertainty jointly influence reward anticipation at the level of the SPN ERP component. Int. J. Psychophysiol. 2017, 132, 287–297. [Google Scholar] [CrossRef]
- Greimel, E.; Bakos, S.; Landes, I.; Töllner, T.; Schulte-Körne, G. Sex differences in the neural underpinnings of social and monetary incentive processing during adolescence. Cogn. Affect. Behav. Neurosci. 2018, 18, 296–312. [Google Scholar] [CrossRef]
- Ehlers, C.L. EEG and ERP responses to naloxone and ethanol in monkeys. Prog. Neuro-Psychopharmacol. Biol. Psychiatry 1989, 13, 217–228. [Google Scholar] [CrossRef]
- Pincze, Z.; Lakatos, P.; Rajkai, C.; Ulbert, I.; Karmos, G. Separation of mismatch negativity and the N1 wave in the auditory cortex of the cat: A topographic study. Clin. Neurophysiol. 2001, 112, 778–784. [Google Scholar] [CrossRef]
- Woods, D.L.; Ridgway, S.H.; Carder, D.A.; Bullock, T.H. Middle-and Long-Latency Auditory Event-Related Potentials in Dolphins; Lawrence Erlbaum Associates: London, UK, 1986. [Google Scholar]
- Wang, Y.; Kawai, Y.; Nakashima, K. Rabbit P300-like potential depends on cortical muscarinic receptor activation. Neuroscience 1999, 89, 423–427. [Google Scholar] [CrossRef]
- Morzorati, S.L.; Stewart, R.B. Development of acute tolerance during steady-state arterial alcohol concentrations: A study of auditory event-related potentials in rats. Alcohol. Clin. Exp. Res. 2005, 29, 347–352. [Google Scholar] [CrossRef]
- Fang, G.Z.; Yang, P.; Xue, F.; Cui, J.G.; Brauth, S.E.; Tang, Y.Z. Sound classification and call discrimination are decoded in order as revealed by event-related potential components in frogs. Brain Behav. Evol. 2015, 86, 234–245. [Google Scholar] [CrossRef]
- Fan, Y.Z.; Fang, K.; Sun, R.L.; Shen, D.; Yang, J.; Tang, Y.Z.; Fang, G.Z. Hierarchical auditory perception for species discrimination and individual recognition in the music frog. Curr. Zool. 2021, zoab085. [Google Scholar] [CrossRef]
- Fan, Y.Z.; Yue, X.Z.; Yang, J.; Shen, J.Y.; Fang, G.Z. Preference of spectral features in auditory processing for advertisement calls in the music frogs. Front. Zool. 2019, 16, 13. [Google Scholar] [CrossRef]
- Yang, P.; Xue, F.; Cui, J.G.; Brauth, S.E.; Tang, Y.Z.; Fang, G.Z. Auditory sensitivity exhibits sexual dimorphism and seasonal plasticity in music frogs. J. Comp. Physiol. A 2018, 204, 1029–1044. [Google Scholar] [CrossRef]
- Yue, X.Z.; Fan, Y.Z.; Xue, F.; Brauth, S.E.; Tang, Y.Z.; Fang, G.Z. The first call note plays a crucial role in frog vocal communication. Sci. Rep. 2017, 7, 10128. [Google Scholar] [CrossRef]
- Finlay, B.L.; Darlington, R.B.; Nicastro, N. Developmental structure in brain evolution. Behav. Brain Sci. 2001, 24, 298–308. [Google Scholar] [CrossRef]
- Northcutt, R.G. Understanding Vertebrate Brain Evolution. Integr. Comp. Biol. 2002, 42, 743–756. [Google Scholar] [CrossRef]
- Krauzlis, R.J.; Bogadhi, A.R.; Herman, J.P.; Bollimunta, A. Selective attention without a neocortex. Cortex 2018, 102, 161–175. [Google Scholar] [CrossRef]
- Cui, J.G.; Tang, Y.Z.; Narins, P.M. Real estate ads in Emei music frog vocalizations: Female preference for calls emanating from burrows. Biol. Lett. 2012, 8, 337–340. [Google Scholar] [CrossRef]
- Fang, G.Z.; Jiang, F.; Yang, P.; Cui, J.G.; Brauth, S.E.; Tang, Y.Z. Male vocal competition is dynamic and strongly affected by social contexts in music frogs. Anim. Cogn. 2014, 17, 483–494. [Google Scholar] [CrossRef]
- Fang, G.Z.; Xue, F.; Yang, P.; Cui, J.G.; Brauth, S.E.; Tang, Y.Z. Right ear advantage for vocal communication in frogs results from both structural asymmetry and attention modulation. Behav. Brain Res. 2014, 266, 77–84. [Google Scholar] [CrossRef]
- Yang, P.; Fang, G.Z.; Xue, F.; Cui, J.G.; Brauth, S.E.; Tang, Y.Z. Electroencephalographic signals synchronize with behaviors and are sexually dimorphic during the light–dark cycle in reproductive frogs. J. Comp. Physiol. A 2014, 200, 117–127. [Google Scholar] [CrossRef][Green Version]
- Culic, M.; Grbic, G.; Martac Blanusa, L.; Spasic, S.; Jankovic, B.; Rankovic, R. Slow and fast oscillations in the activity of parietal cortex after brain injury. In From Basic Motor Control to Functional Recovery III; Gantchev, N., Ed.; St. Kliment Ohridski University Press: Sofia, Bulgaria, 2003; pp. 41–45. [Google Scholar]
- Fang, G.Z.; Chen, Q.; Cui, J.G.; Tang, Y.Z. Electroencephalogram bands modulated by vigilance states in an anuran species: A factor analytic approach. J. Comp. Physiol. A 2012, 198, 119–127. [Google Scholar] [CrossRef]
- Kroodsma, D.E.; Byers, B.E.; Goodale, E.; Johnson, S.; Liu, W.-C. Pseudoreplication in playback experiments, revisited a decade later. Anim. Behav. 2001, 61, 1029–1033. [Google Scholar] [CrossRef]
- Freeberg, T.M.; Lucas, J.R. Pseudoreplication is (still) a problem. J. Comp. Psychol. 2009, 123, 450–451. [Google Scholar] [CrossRef]
- Schank, J.C.; Koehnle, T.J. Pseudoreplication is a pseudoproblem. J. Comp. Psychol. 2009, 123, 421–433. [Google Scholar] [CrossRef]
- Lazic, S.E. The problem of pseudoreplication in neuroscientific studies: Is it affecting your analysis? BMC Neurosci. 2010, 11, 5. [Google Scholar] [CrossRef]
- Bonett, D.G.; Woodward, J.A. Analysis of simple main effects in fractional factorial experimental designs of resolution v. Commun. Stat. Theory Methods 1993, 22, 1585–1593. [Google Scholar] [CrossRef]
- Cohen, J. A power primer. Psychol. Bull. 1992, 112, 155–159. [Google Scholar] [CrossRef]
- Prinzmetal, W.; Zvinyatskovskiy, A.; Gutierrez, P.; Dilem, L. Voluntary and involuntary attention have different consequences: The effect of perceptual difficulty. Q. J. Exp. Psychol. 2009, 62, 352–369. [Google Scholar] [CrossRef]
- Posner, M.I.; Rothbart, M.K.; Voelker, P. Developing brain networks of attention. Curr. Opin. Pediatr. 2016, 28, 720–724. [Google Scholar] [CrossRef]
- Brunia, C.H.; Hackley, S.A.; van Boxtel, G.J.; Kotani, Y.; Ohgami, Y. Waiting to perceive: Reward or punishment? Clin. Neurophysiol. 2011, 122, 858–868. [Google Scholar] [CrossRef]
- Vossel, S.; Geng, J.J.; Fink, G.R. Dorsal and ventral attention systems: Distinct neural circuits but collaborative roles. Neuroscientist 2014, 20, 150–159. [Google Scholar] [CrossRef]
- Arak, A. Sexual selection by male–male competition in natterjack toad choruses. Nature 1983, 306, 261–262. [Google Scholar] [CrossRef]
- Gerhardt, H.C.; Huber, F. Acoustic Communication in Insects and Anurans: Common Problems and Diverse Solutions; University of Chicago Press: Chicago, IL, USA, 2002. [Google Scholar]
- Tobias, M.L.; Barnard, C.; O’Hagan, R.; Horng, S.H.; Rand, M.; Kelley, D.B. Vocal communication between male Xenopus laevis. Anim. Behav. 2004, 67, 353–365. [Google Scholar] [CrossRef][Green Version]
- Marshall, V.T.; Humfeld, S.C.; Bee, M.A. Plasticity of aggressive signalling and its evolution in male spring peepers, Pseudacris crucifer. Anim. Behav. 2003, 65, 1223–1234. [Google Scholar] [CrossRef][Green Version]
- Hillyard, S.A.; Hink, R.F.; Schwent, V.L.; Picton, T.W. Electrical signs of selective attention in the human brain. Science 1973, 182, 177–180. [Google Scholar] [CrossRef] [PubMed]
- Shen, D.; Fang, K.; Fan, Y.Z.; Shen, J.Y.; Yang, J.; Cui, J.G.; Fang, G.Z. Sex differences in vocalization are reflected by event-related potential components in the music frog. Anim. Cogn. 2020, 23, 477–490. [Google Scholar] [CrossRef] [PubMed]
- Wolpaw, J.R.; Penry, J.K. A temporal component of the auditory evoked response. Electroencephalogr. Clin. Neurophysiol. 1975, 39, 609–620. [Google Scholar] [CrossRef]
- Stake, M.M.; Thompson, F.R.; Faaborg, J.; Burhans, D.E. Patterns of snake predation at songbird nests in missouri and texas. J. Herpetol. 2005, 39, 215–222. [Google Scholar] [CrossRef]
- Loveland, J.L.; Fernald, R.D. Differential activation of vasotocin neurons in contexts that elicit aggression and courtship. Behav. Brain Res. 2017, 317, 188–203. [Google Scholar] [CrossRef]
- Ewert, J.-P.; Buxbaum-Conradi, H.; Dreisvogt, F.; Glagow, M.; Merkel-Harff, C.; Röttgen, A.; Schürg-Pfeiffer, E.; Schwippert, W. Neural modulation of visuomotor functions underlying prey-catching behaviour in anurans: Perception, attention, motor performance, learning. Comp. Biochem. Physiol. Part A Mol. Integr. Physiol. 2001, 128, 417–460. [Google Scholar] [CrossRef]
- Butler, A.B.; Hodos, W. Comparative Vertebrate Neuroanatomy: Evolution and Adaptation; John Wiley & Sons: Hoboken, NJ, USA, 2005. [Google Scholar]
- Wilczynski, W.; Endepols, H. Central auditory pathways in anuran amphibians: The anatomical basis of hearing and sound communication. In Hearing and Sound Communication in Amphibians; Narins, P.M., Feng, A.S., Fay, R.R., Popper, A.N., Eds.; Springer: New York, NY, USA, 2007; pp. 221–249. [Google Scholar]
- Schafer, R.J.; Moore, T. Attention governs action in the primate frontal eye field. Neuron 2007, 56, 541–551. [Google Scholar] [CrossRef]
- Birrell, J.M.; Brown, V.J. Medial frontal cortex mediates perceptual attentional set shifting in the rat. J. Neurosci. 2000, 20, 4320–4324. [Google Scholar] [CrossRef]
- Gazzaniga, M.S.; Ivry, R.B.; Mangun, G. Cognitive Neuroscience. The Biology of the Mind; W.W. Norton & Company, Inc.: New York, NY, USA, 2014. [Google Scholar]
- Sridharan, D.; Schwarz, J.S.; Knudsen, E.I. Selective attention in birds. Curr. Biol. 2014, 24, R510–R513. [Google Scholar] [CrossRef][Green Version]
- Xue, F.; Yue, X.Z.; Fan, Y.Z.; Cui, J.G.; Brauth, S.E.; Tang, Y.Z.; Fang, G.Z. Auditory neural networks involved in attention modulation prefer biologically significant sounds and exhibit sexual dimorphism in anurans. J. Exp. Biol. 2018, 221, jeb167775. [Google Scholar] [CrossRef] [PubMed]


| For the Amplitude (1,14)(2,28)(2,28)(4,56) | For the Latency (1,14)(2,28)(2,28)(4,56) | |||||||||
|---|---|---|---|---|---|---|---|---|---|---|
| F | ε | p | Partial η2 | MCBC | F | ε | p | Partial η2 | MCBC | |
| SPN | ||||||||||
| Sex | 1.994 | NA | 0.18 | 0.125 | NA | 0.177 | NA | 0.681 | 0.012 | NA |
| Acoustic stimulus | 0.783 | 0.905 | 0.467 | 0.053 | NA | 2.391 | 0.925 | 0.110 | 0.146 | NA |
| Brain area | 6.281 | 0.928 | 0.006 * | 0.164 | TN > MN | 0.893 | 0.845 | 0.421 | 0.06 | NA |
| Acoustic stimulus*Brain area | 2.582 | 0.666 | 0.047 * | 0.102 | see Table 2 | 1.343 | 0.688 | 0.266 | 0.088 | NA |
| N1 | ||||||||||
| Sex | 0.677 | NA | 0.424 | 0.046 | NA | 0.021 | NA | 0.886 | 0.005 | NA |
| Acoustic stimulus | 0.235 | 0.878 | 0.792 | 0.017 | NA | 3.538 | 0.65 | 0.067 | 0.202 | NA |
| Brain area | 20.859 | 0.596 | 0.000 ** | 0.598 | MN > TN, DN | 1.357 | 0.711 | 0.272 | 0.088 | NA |
| Acoustic stimulus*Brain area | 12.265 | 0.375 | 0.001 * | 0.467 | see Table 2 | 3.627 | 0.409 | 0.051 | 0.206 | NA |
| F | p | Partial η2 | MCBC | |
|---|---|---|---|---|
| SPN | ||||
| Brain area|MC | 6.331 | 0.012 * | 0.493 | TN, DN > MN |
| N1 | ||||
| Brain area|MC | 11.236 | 0.001 * | 0.634 | MN > TN, DN |
| Brain area|PT | 9.543 | 0.003 * | 0.595 | MN > TN, DN |
| Brain area|SC | 8.754 | 0.004 * | 0.574 | MN > DN > TN |
| For the Amplitude (1,14)(2,28)(2,28)(4,56) | For the Latency (1,14)(2,28)(2,28)(4,56) | |||||||||
|---|---|---|---|---|---|---|---|---|---|---|
| F | ε | p | Partial η2 | MCBC | F | ε | p | Partial η2 | MCBC | |
| N1 | ||||||||||
| Sex | 0.689 | NA | 0.42 | 0.047 | NA | 0.735 | NA | 0.406 | 0.05 | NA |
| Acoustic stimulus | 3.183 | 0.97 | 0.057 | 0.185 | NA | 2.526 | 0.782 | 0.098 | 0.153 | NA |
| Brain area | 14.053 | 0.691 | 0.001 * | 0.501 | MN > TN, DN | 0.843 | 0.645 | 0.485 | 0.057 | NA |
| Acoustic stimulus*Brain area | 10.263 | 0.49 | 0.001 * | 0.423 | see Table 4 | 0.602 | 0.446 | 0.68 | 0.041 | NA |
| F | p | Partial η2 | MCBC | |
|---|---|---|---|---|
| Stimulus|TN | 4.148 | 0.040 * | 0.39 | SC > MC |
| Brain area|MC | 10.147 | 0.002 * | 0.391 | MN > TN, DN |
| Brain area|PT | 5.502 | 0.019 * | 0.771 | MN > TN, DN |
| Brain area|SC | 5.823 | 0.016 * | 0.688 | MN > TN, DN |
Publisher’s Note: MDPI stays neutral with regard to jurisdictional claims in published maps and institutional affiliations. |
© 2022 by the authors. Licensee MDPI, Basel, Switzerland. This article is an open access article distributed under the terms and conditions of the Creative Commons Attribution (CC BY) license (https://creativecommons.org/licenses/by/4.0/).
Share and Cite
Niu, W.; Shen, D.; Sun, R.; Fan, Y.; Yang, J.; Zhang, B.; Fang, G. Possible Event-Related Potential Correlates of Voluntary Attention and Reflexive Attention in the Emei Music Frog. Biology 2022, 11, 879. https://doi.org/10.3390/biology11060879
Niu W, Shen D, Sun R, Fan Y, Yang J, Zhang B, Fang G. Possible Event-Related Potential Correlates of Voluntary Attention and Reflexive Attention in the Emei Music Frog. Biology. 2022; 11(6):879. https://doi.org/10.3390/biology11060879
Chicago/Turabian StyleNiu, Wenjun, Di Shen, Ruolei Sun, Yanzhu Fan, Jing Yang, Baowei Zhang, and Guangzhan Fang. 2022. "Possible Event-Related Potential Correlates of Voluntary Attention and Reflexive Attention in the Emei Music Frog" Biology 11, no. 6: 879. https://doi.org/10.3390/biology11060879
APA StyleNiu, W., Shen, D., Sun, R., Fan, Y., Yang, J., Zhang, B., & Fang, G. (2022). Possible Event-Related Potential Correlates of Voluntary Attention and Reflexive Attention in the Emei Music Frog. Biology, 11(6), 879. https://doi.org/10.3390/biology11060879


