
Climate-Growth Relationships of Chinese Pine (Pinus tabulaeformis Carr.) at Mt. Shiren in Climatic Transition Zone, Central China


Abstract
:Simple Summary
Abstract
1. Introduction
2. Data and Methods
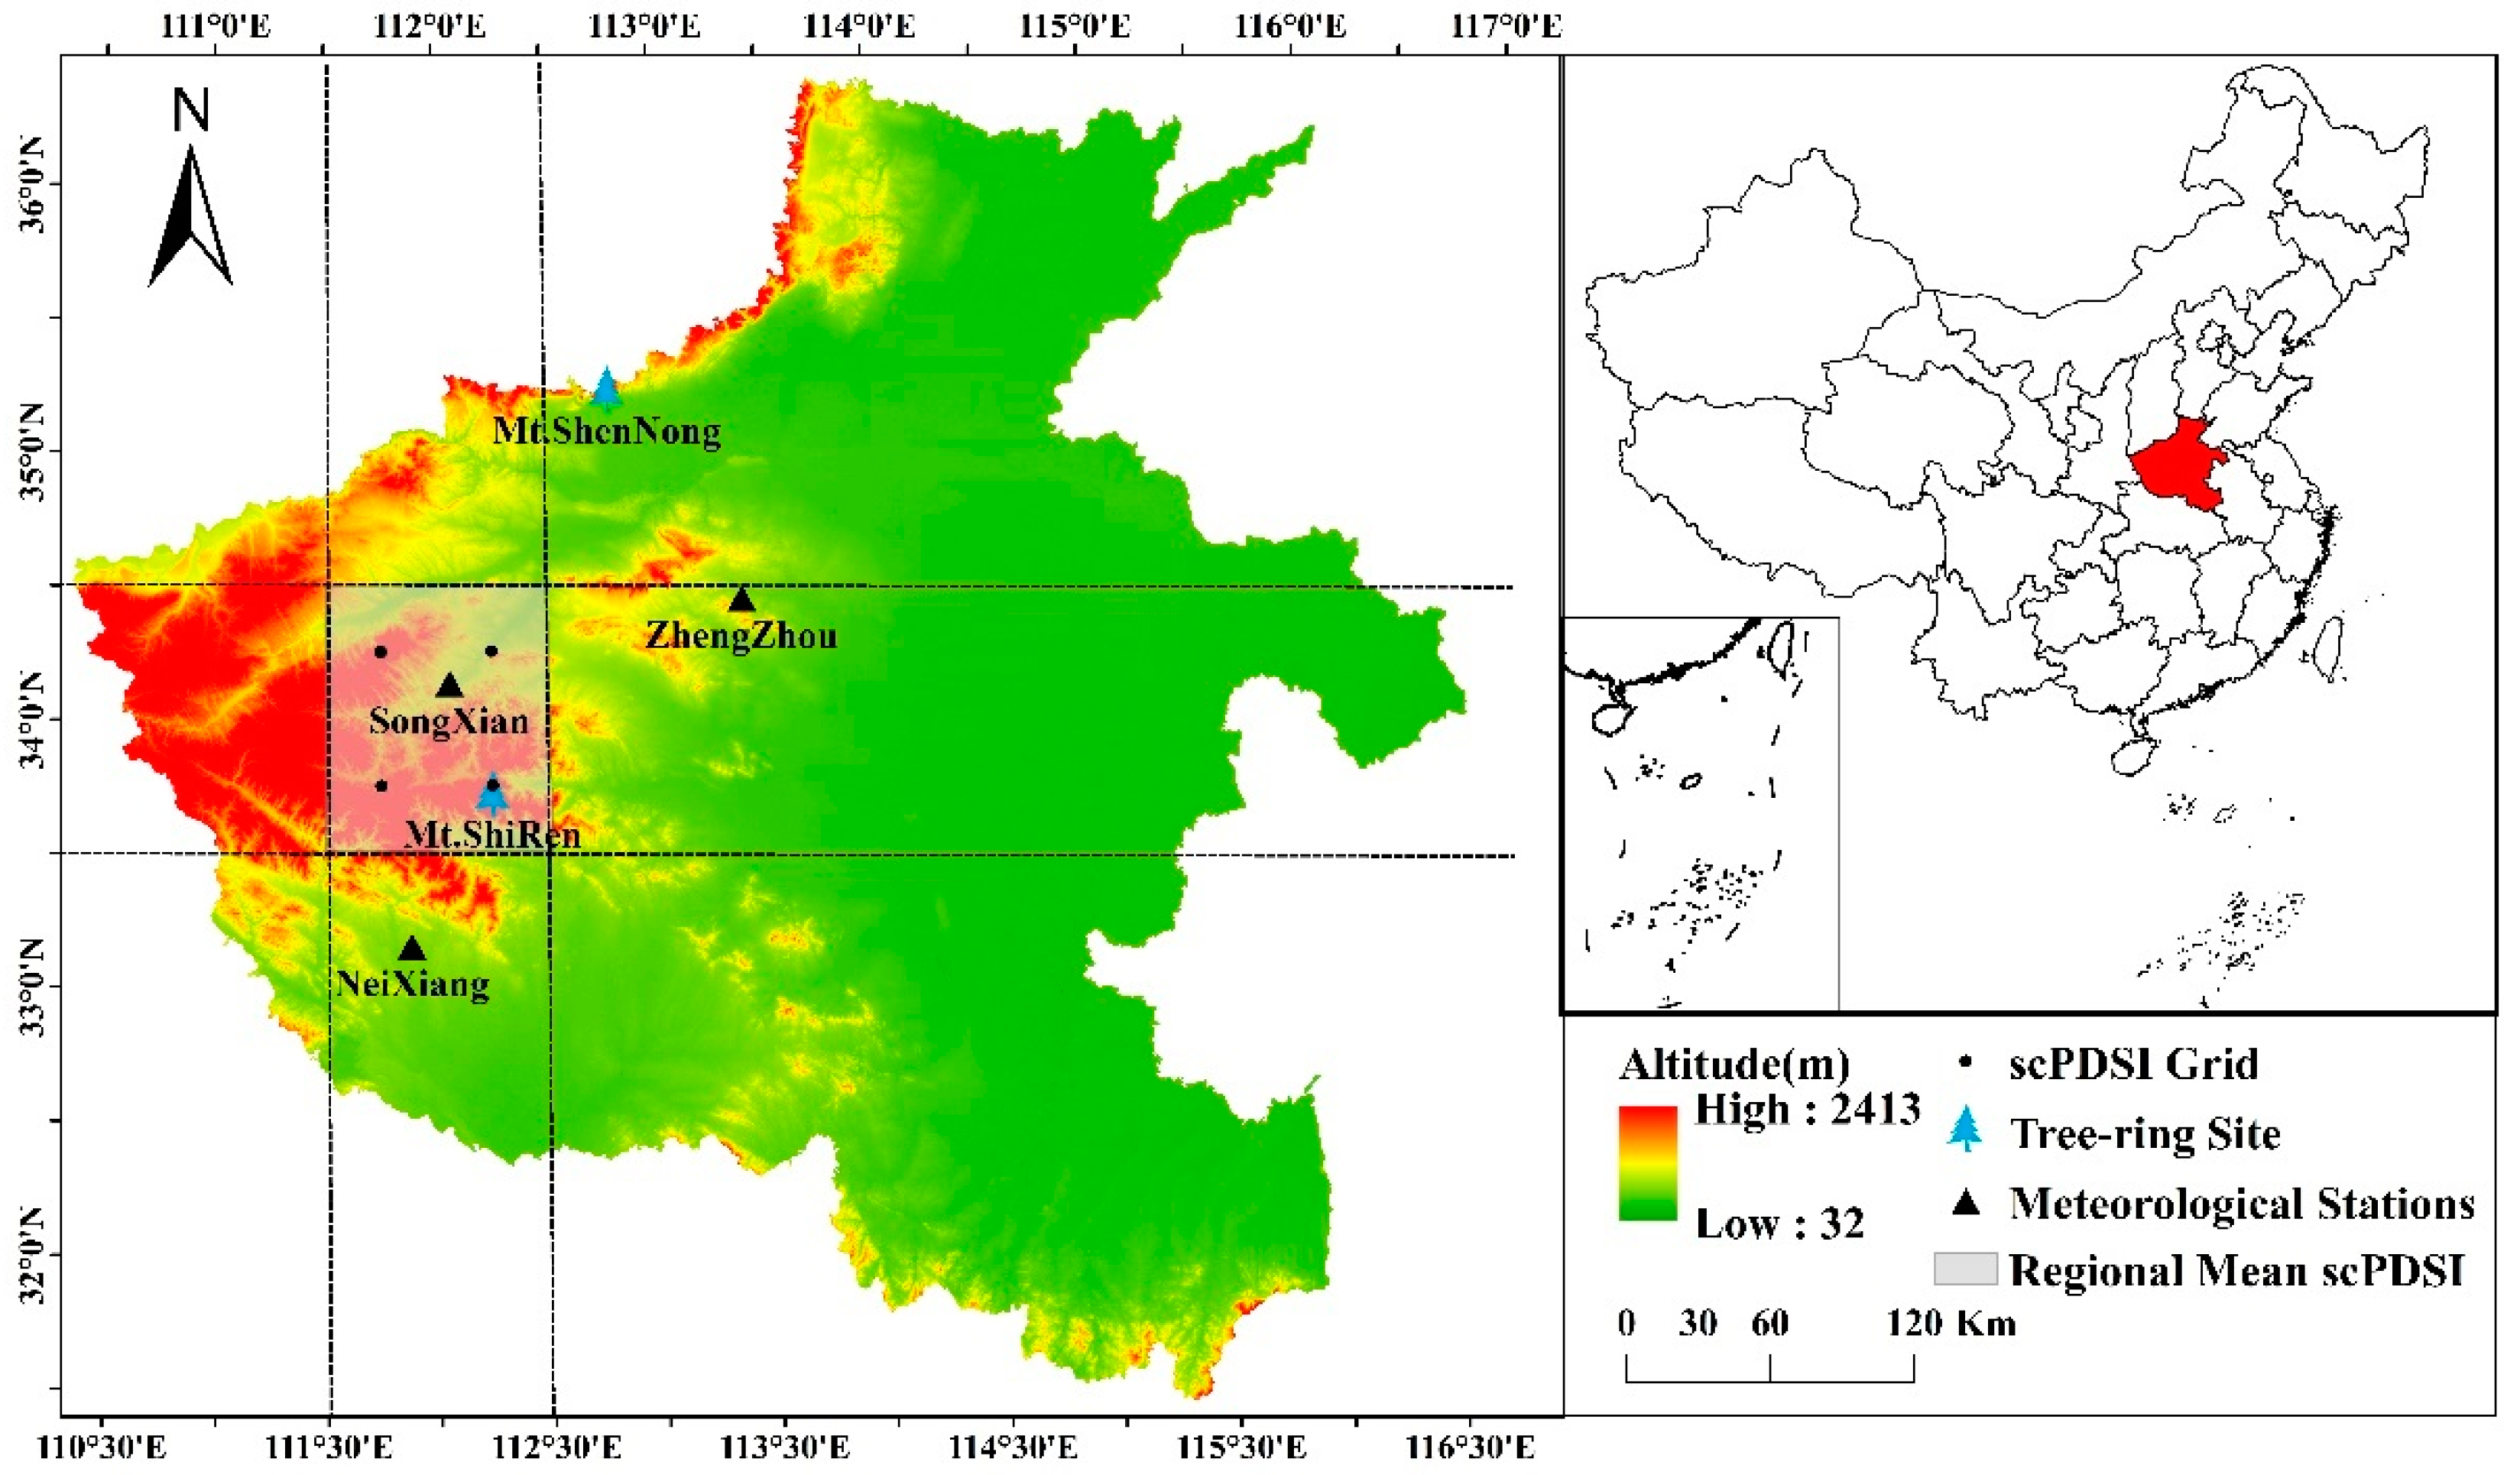
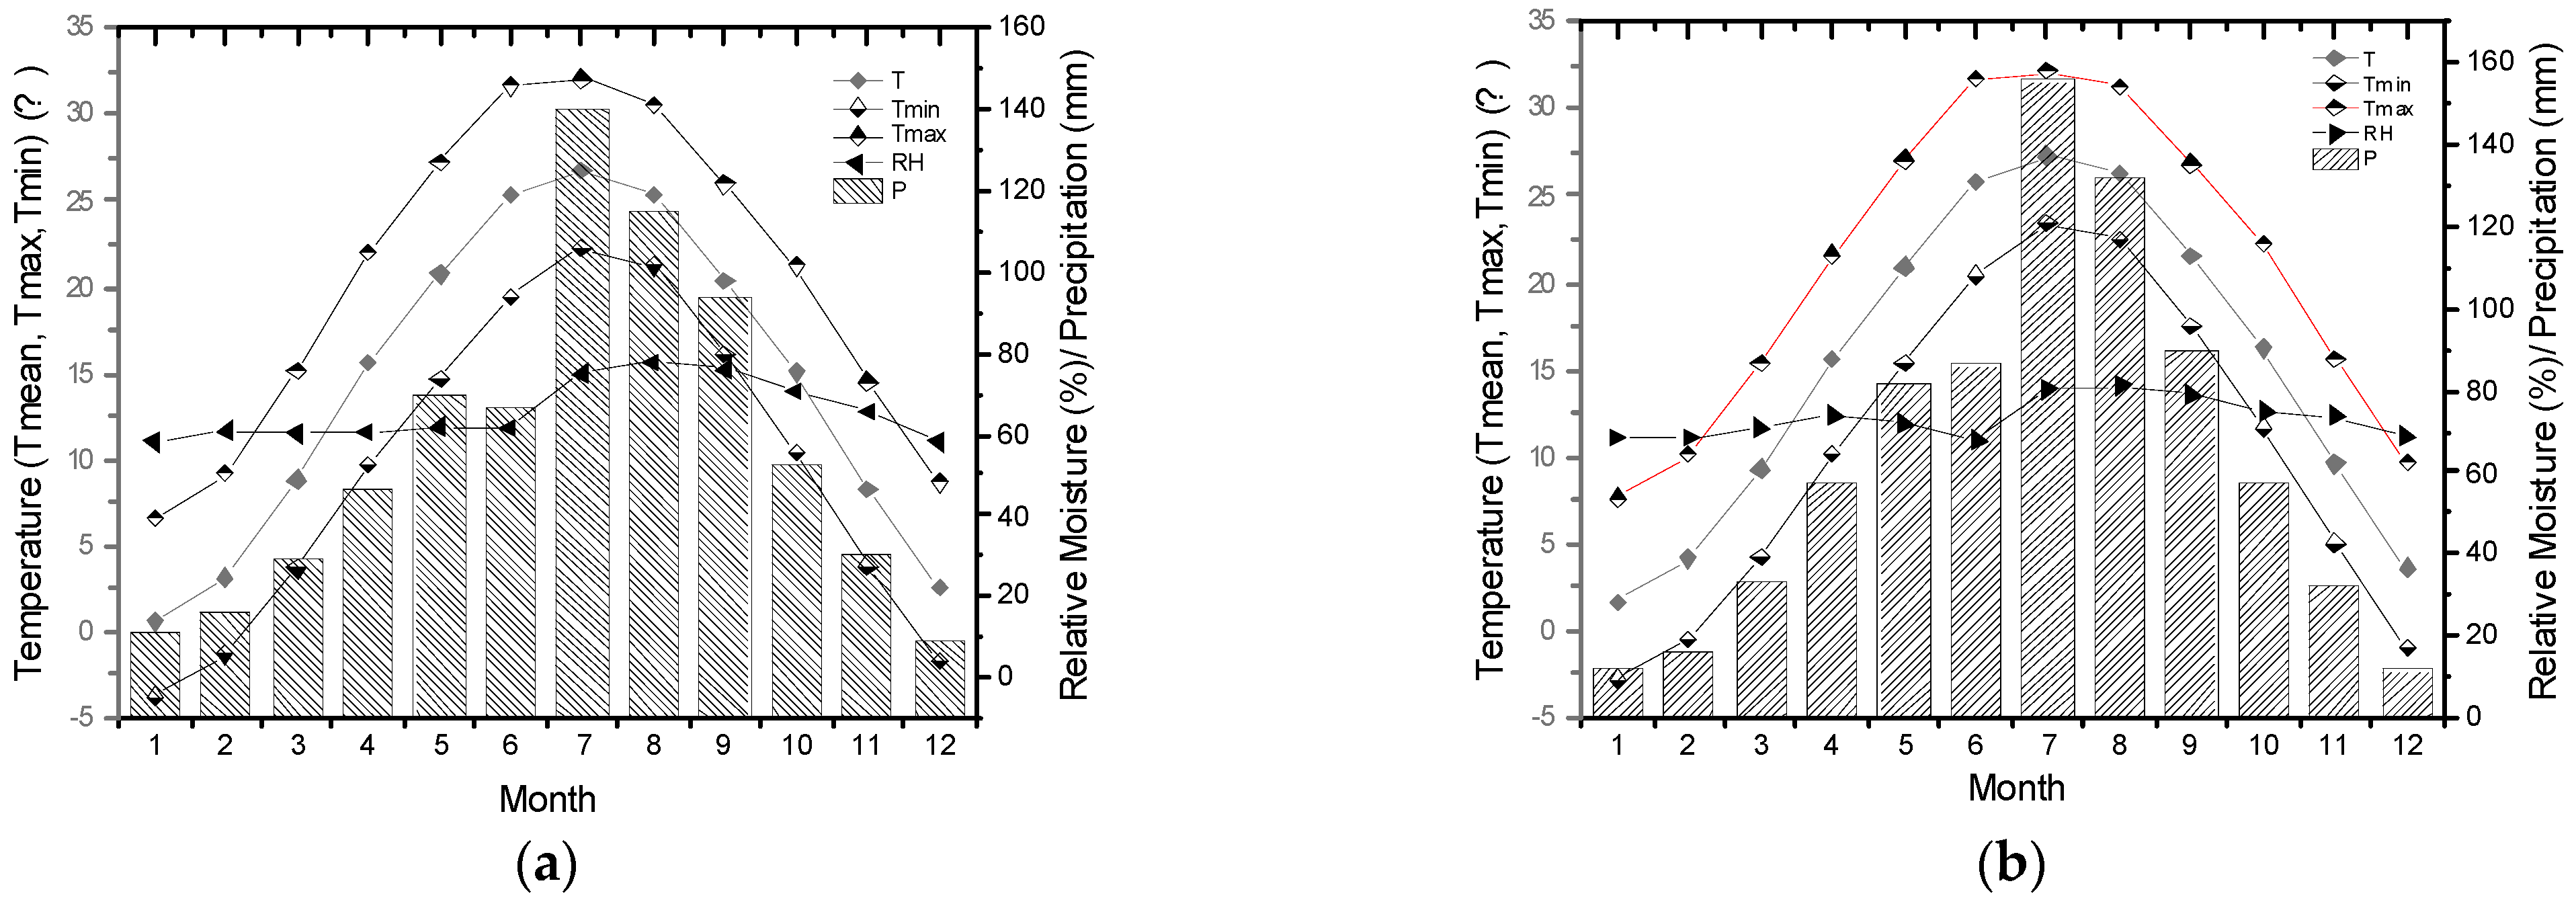
2.1. Study Area
2.2. Chronology and Climate Data
2.3. Statistical Methods
3. Results
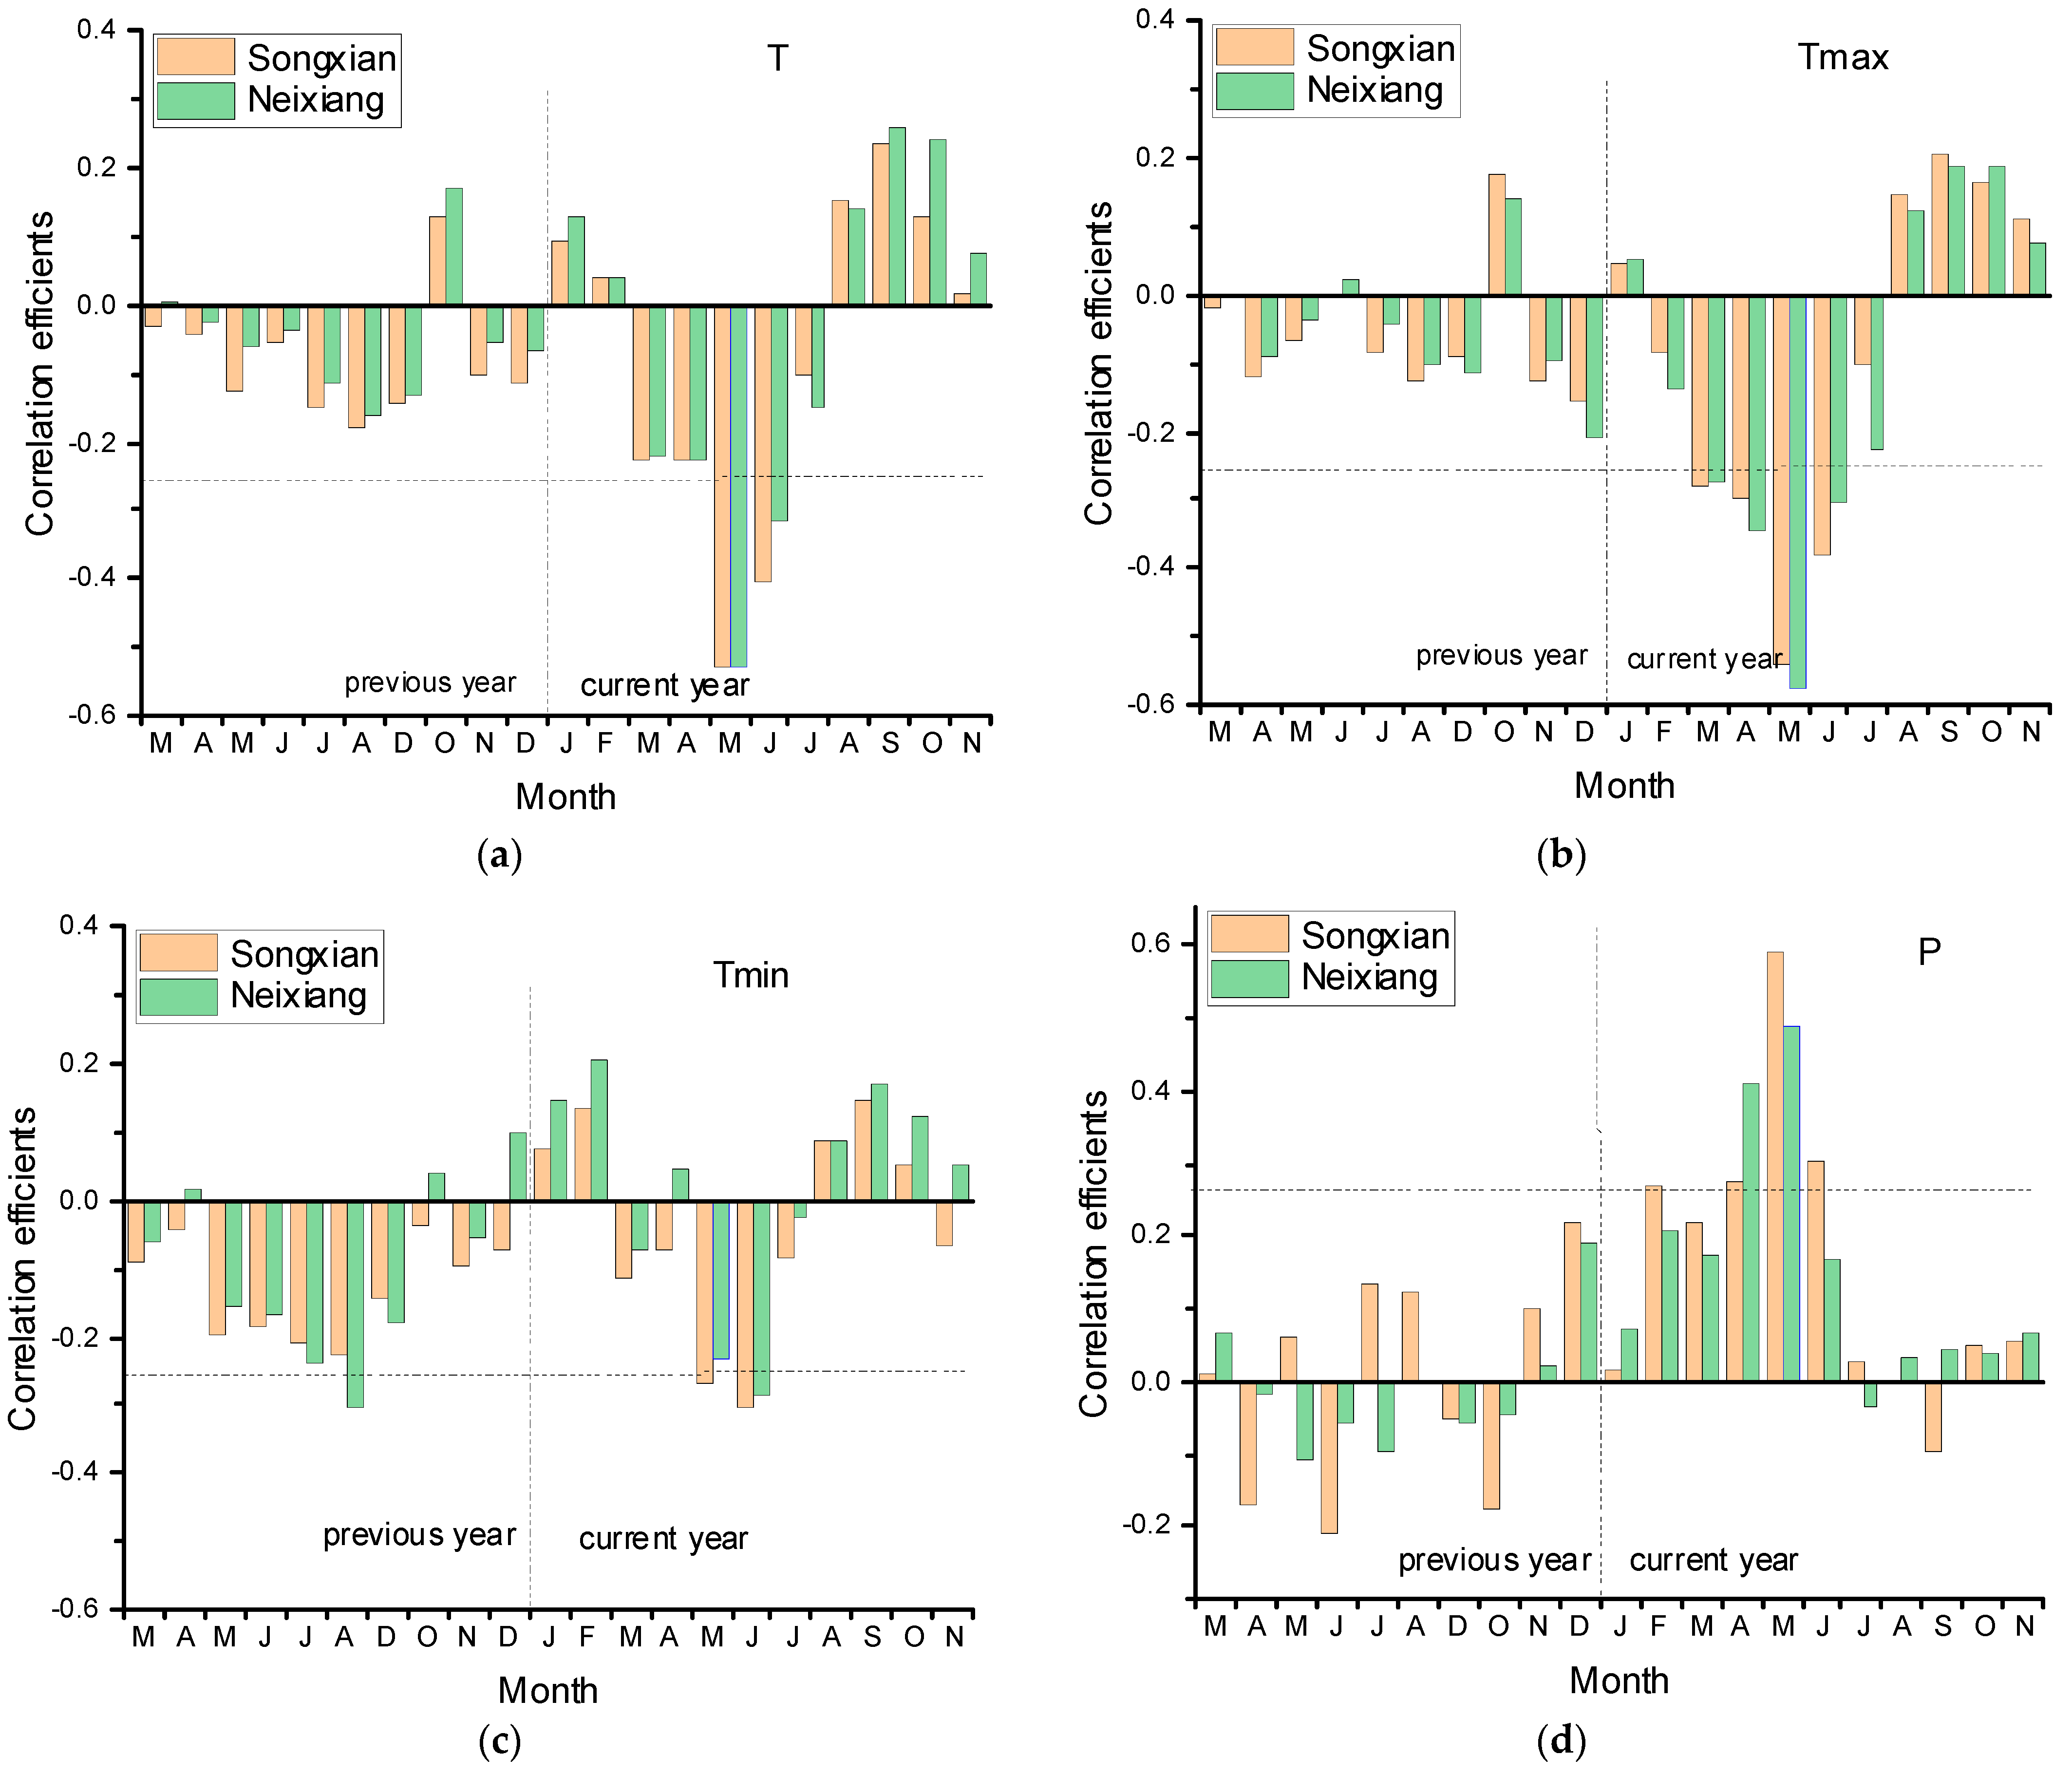
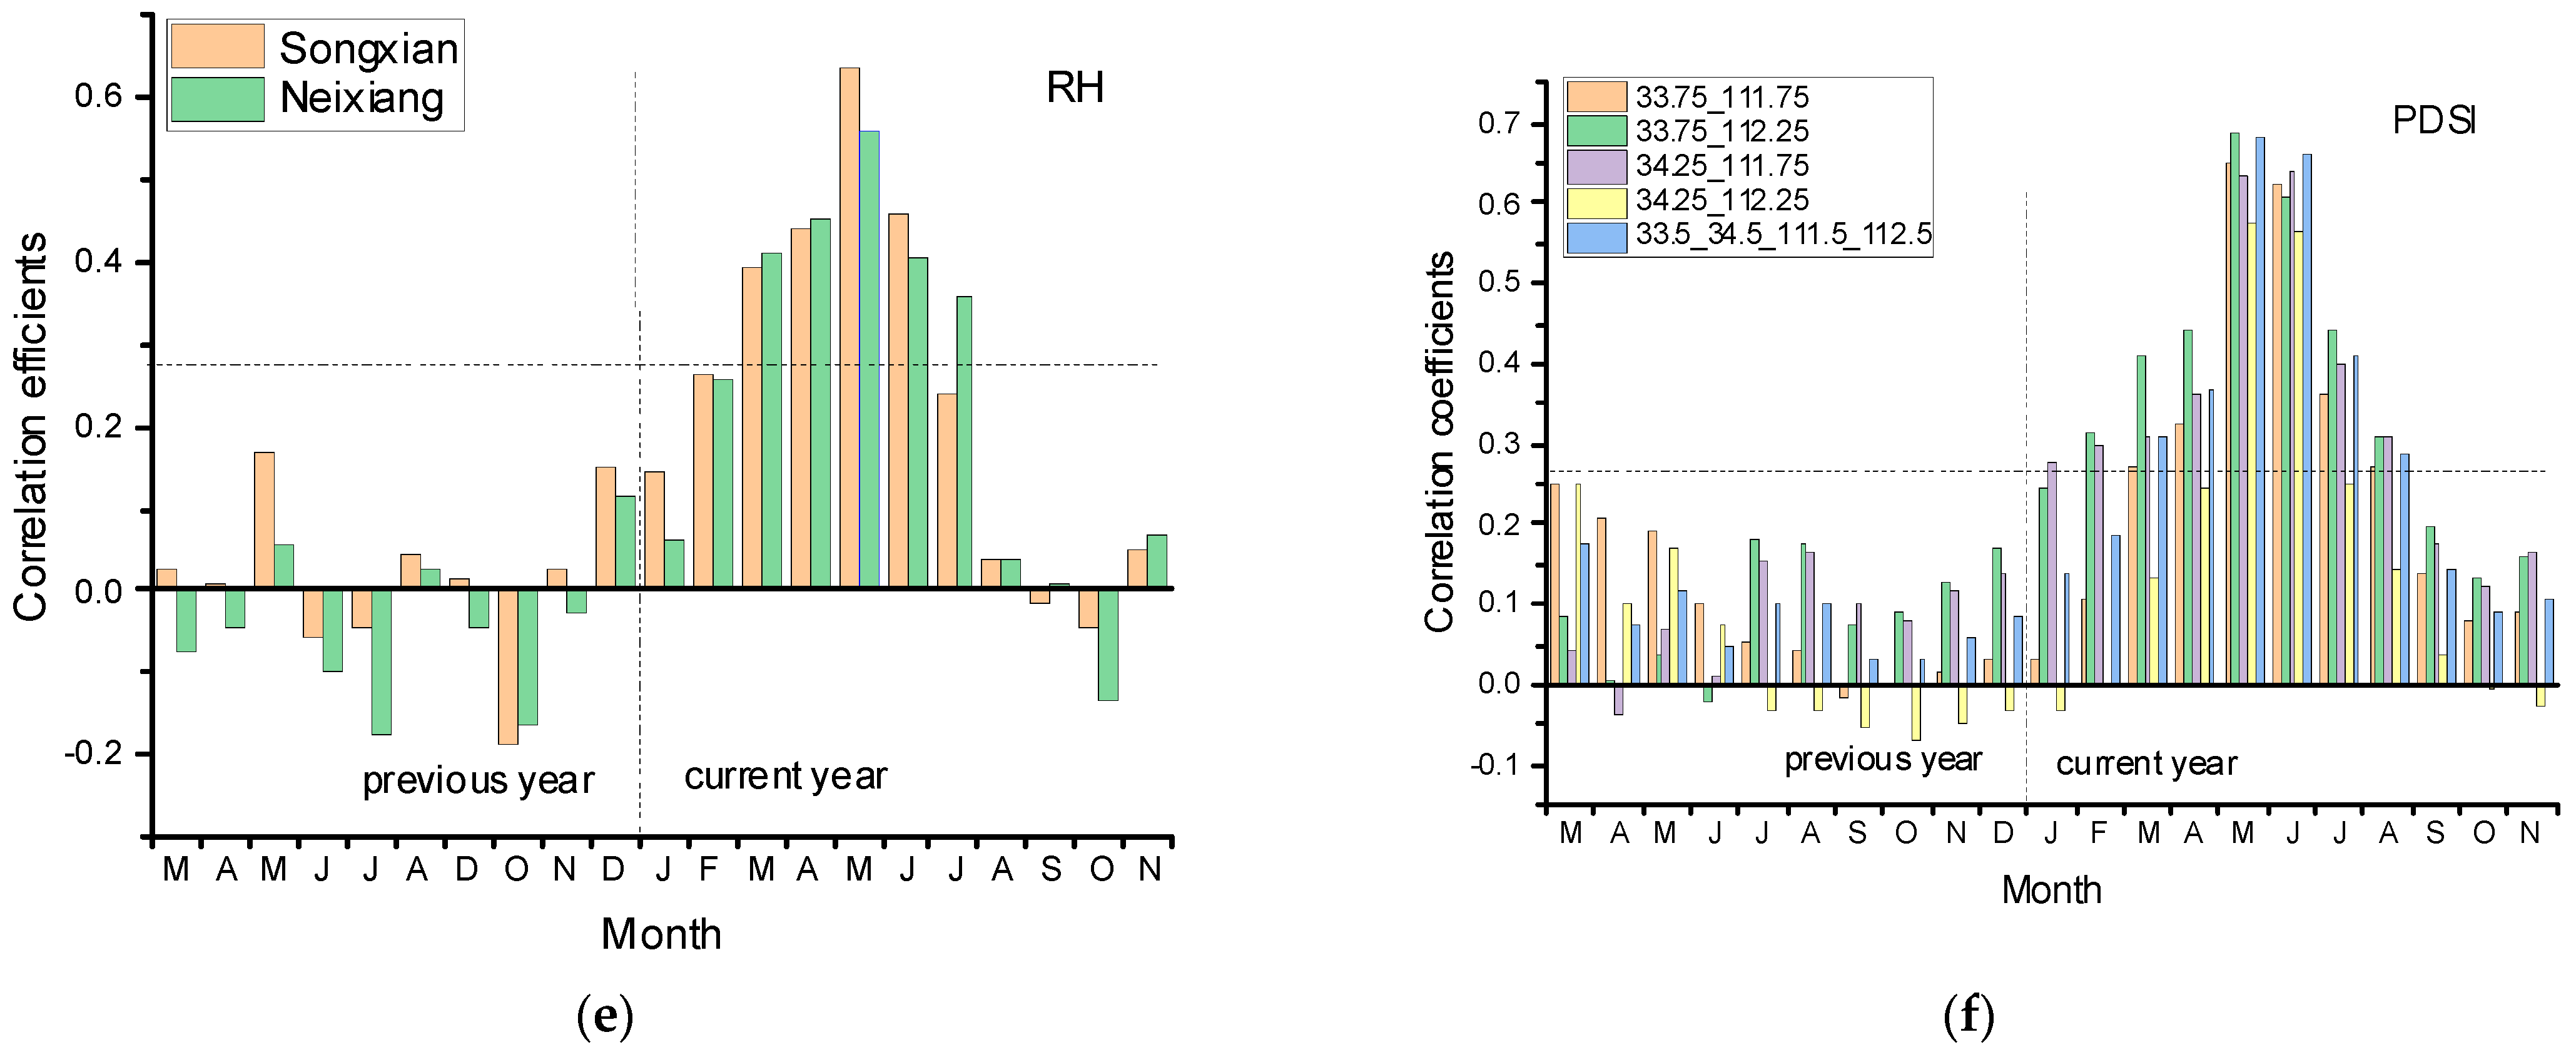
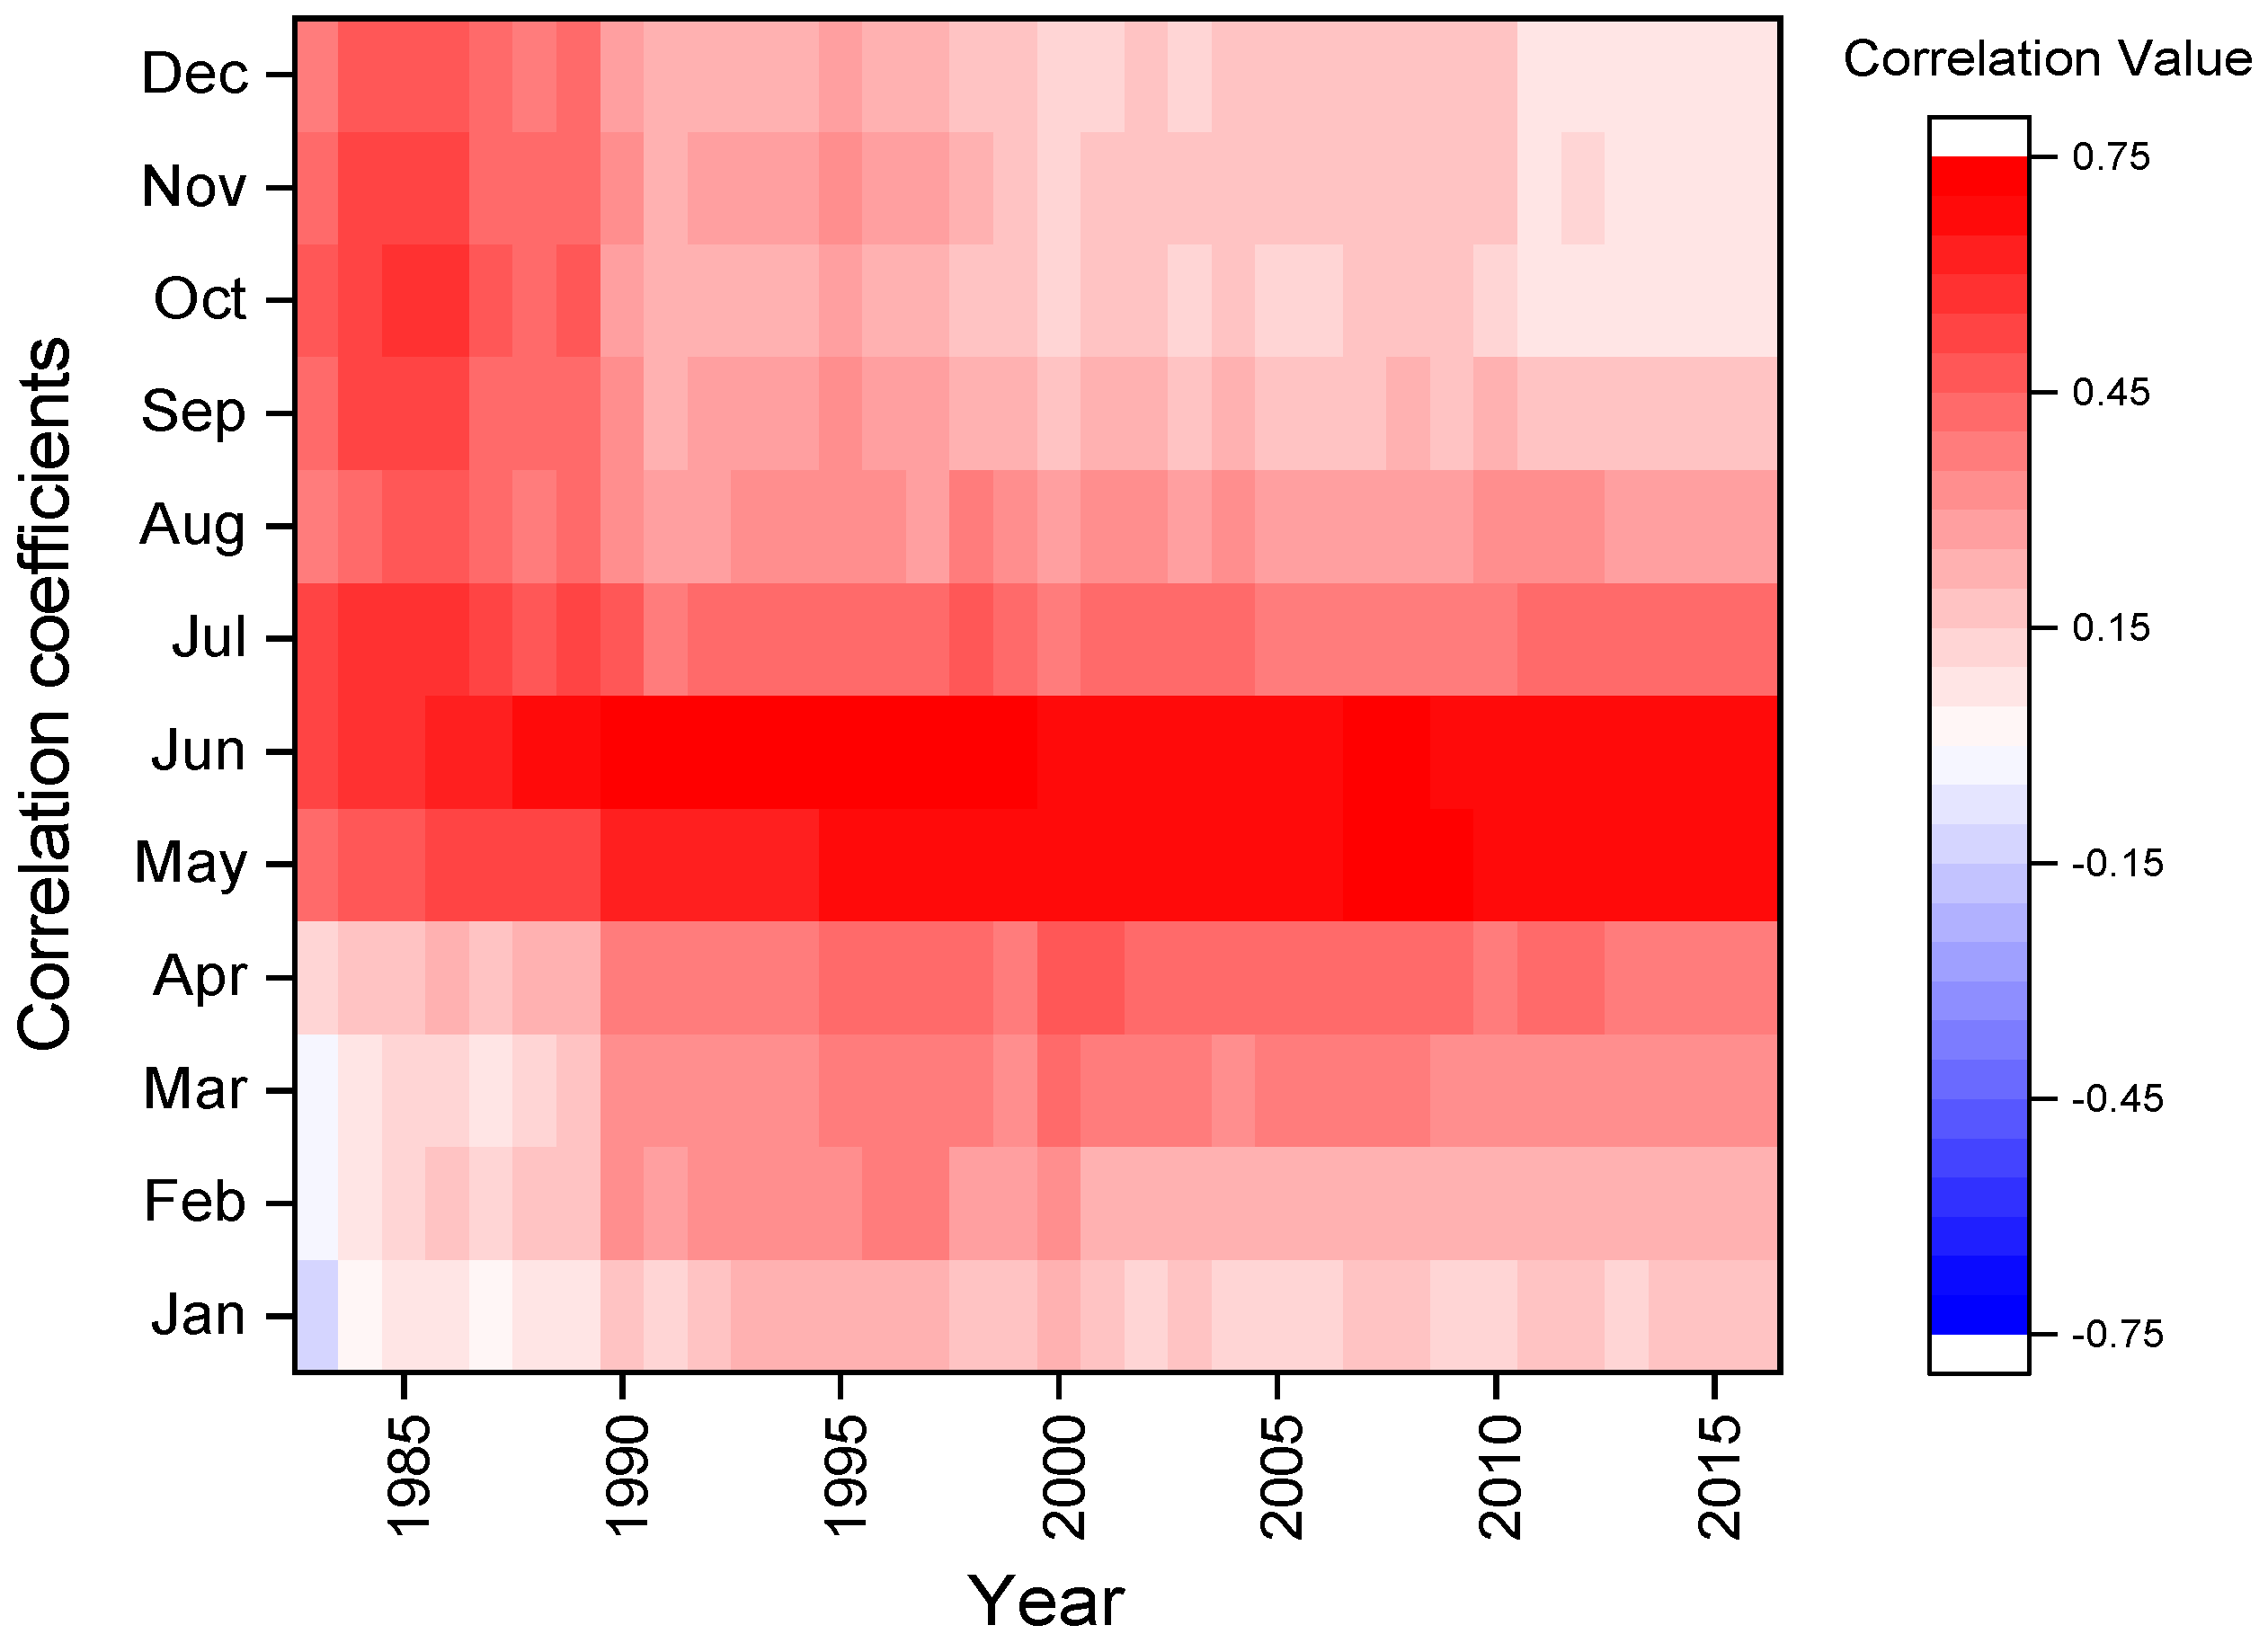
3.1. Climate–Growth Relationship
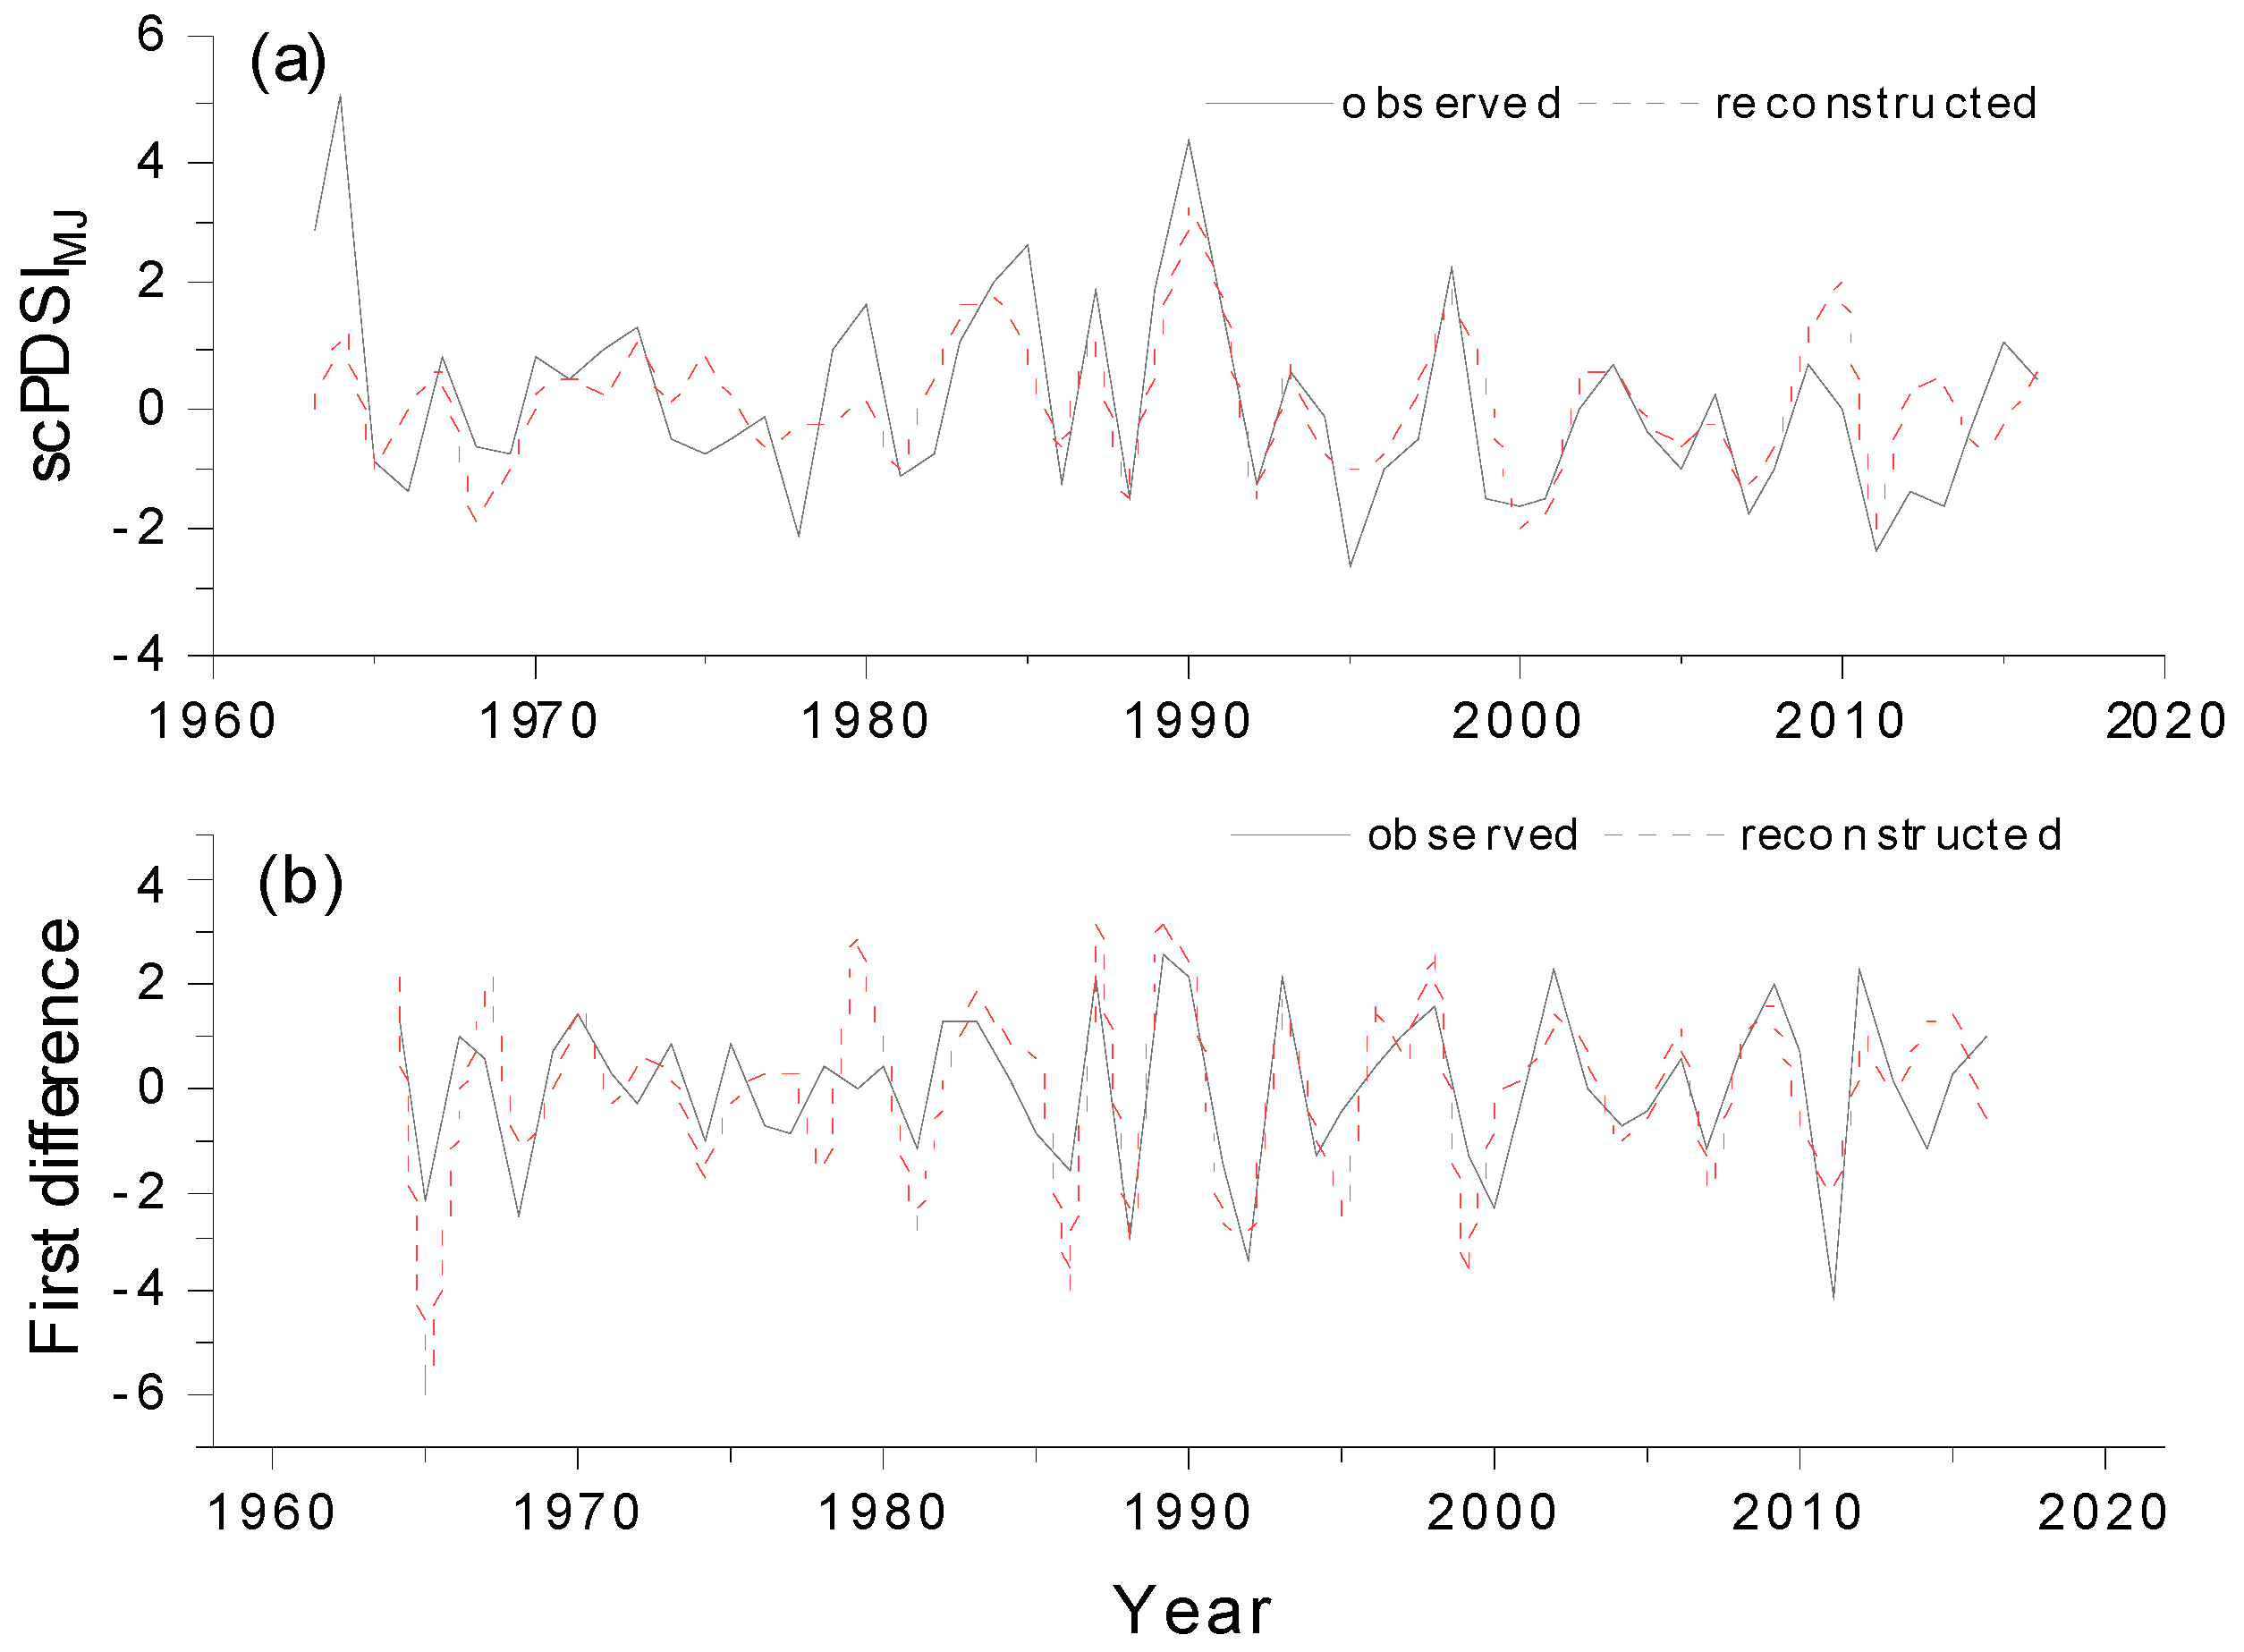
3.2. Transfer Function and Regional scPDSI Reconstruction
4. Discussion
4.1. Tree Growth Influenced by Temperature, Precipitation, or scPDSI
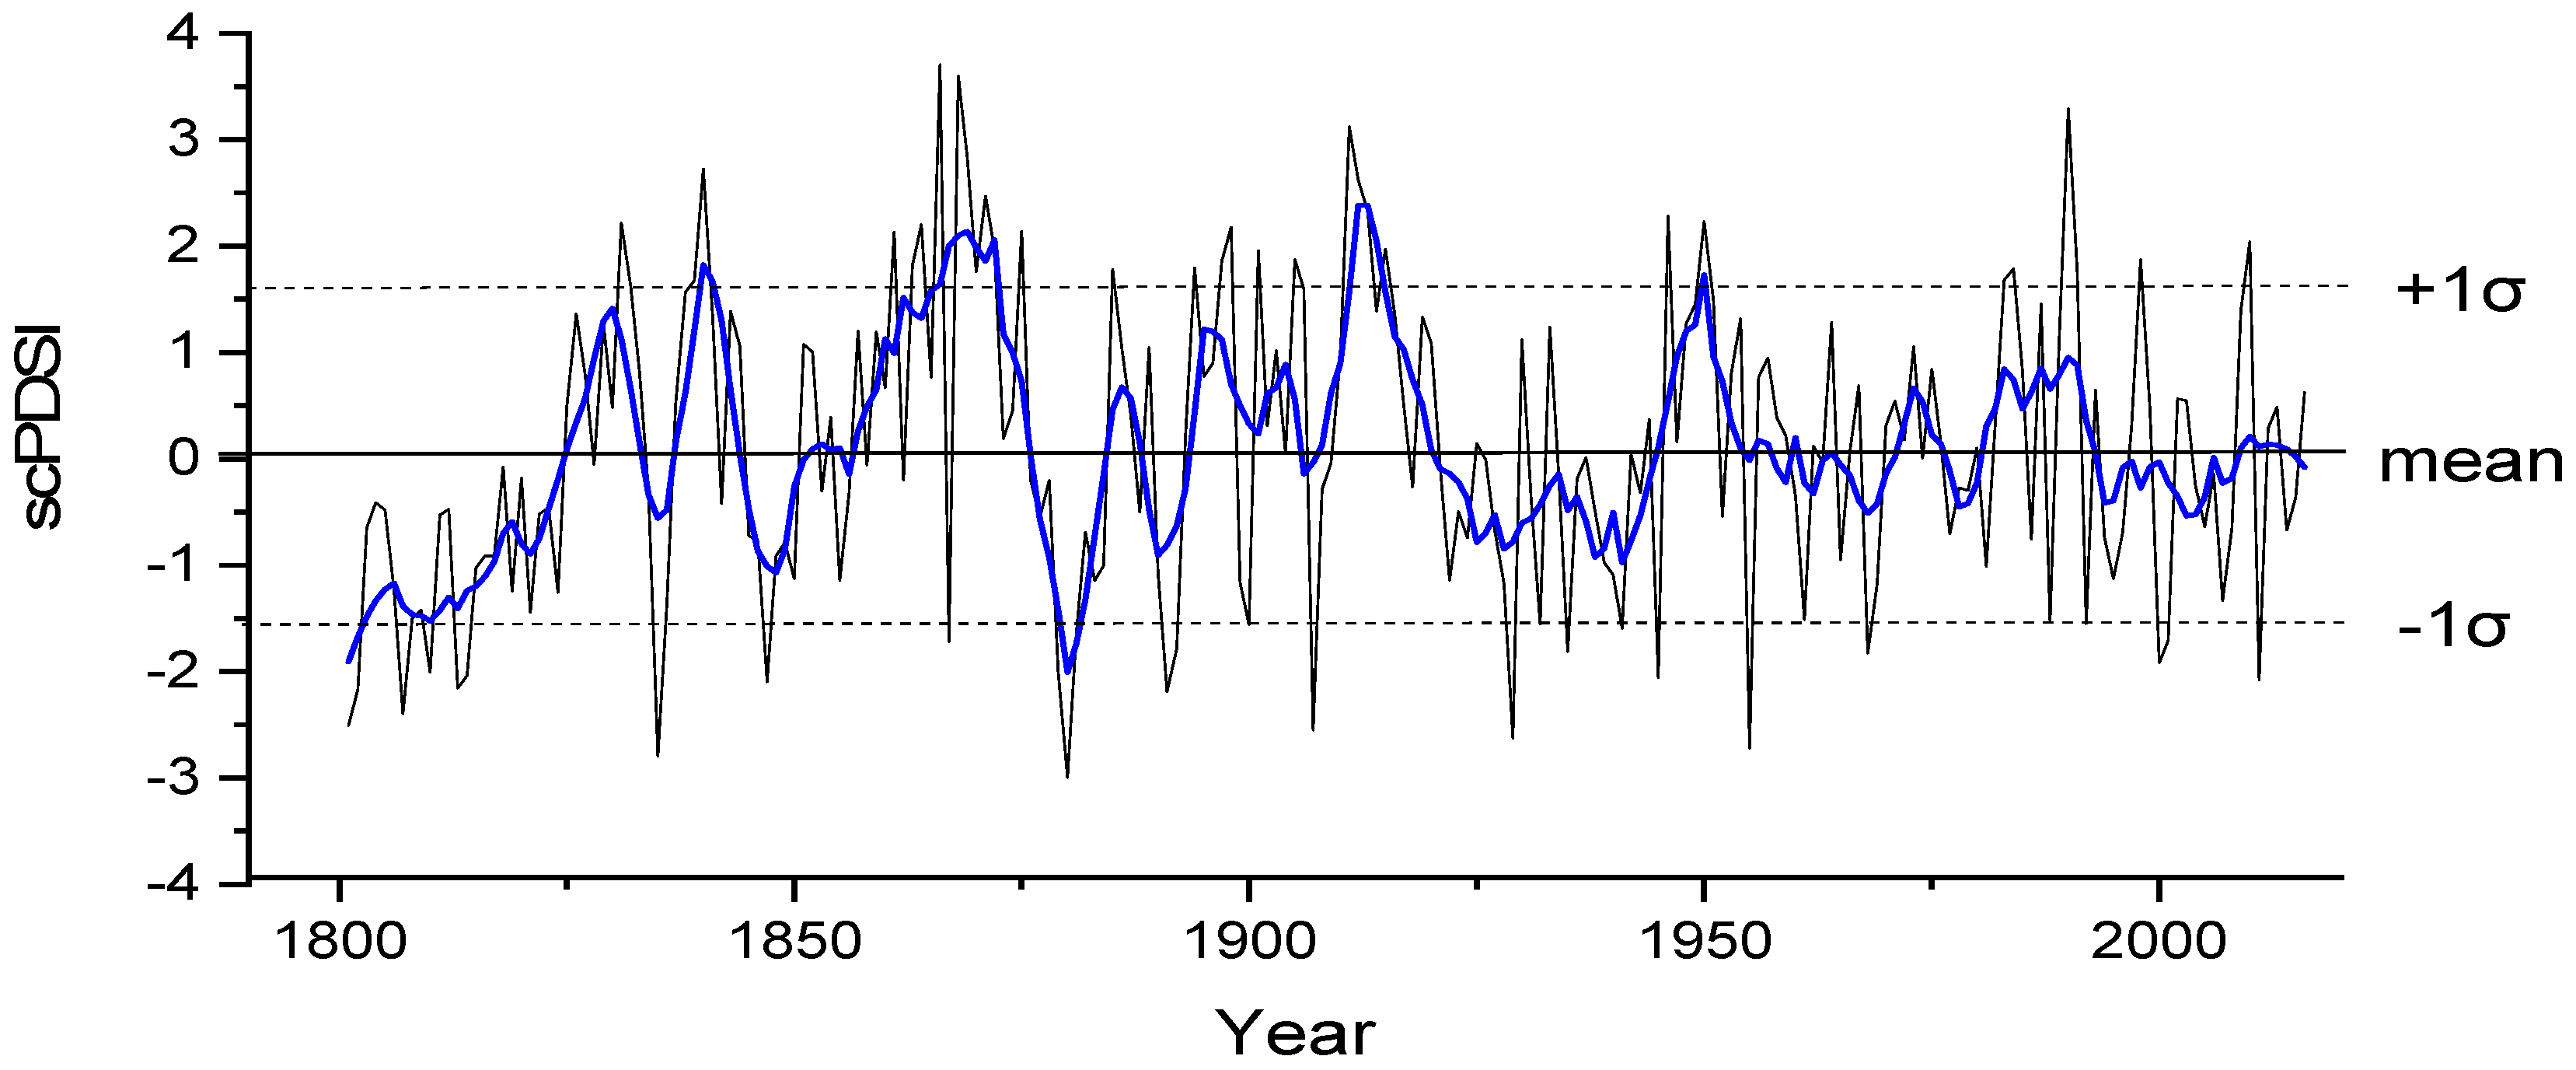
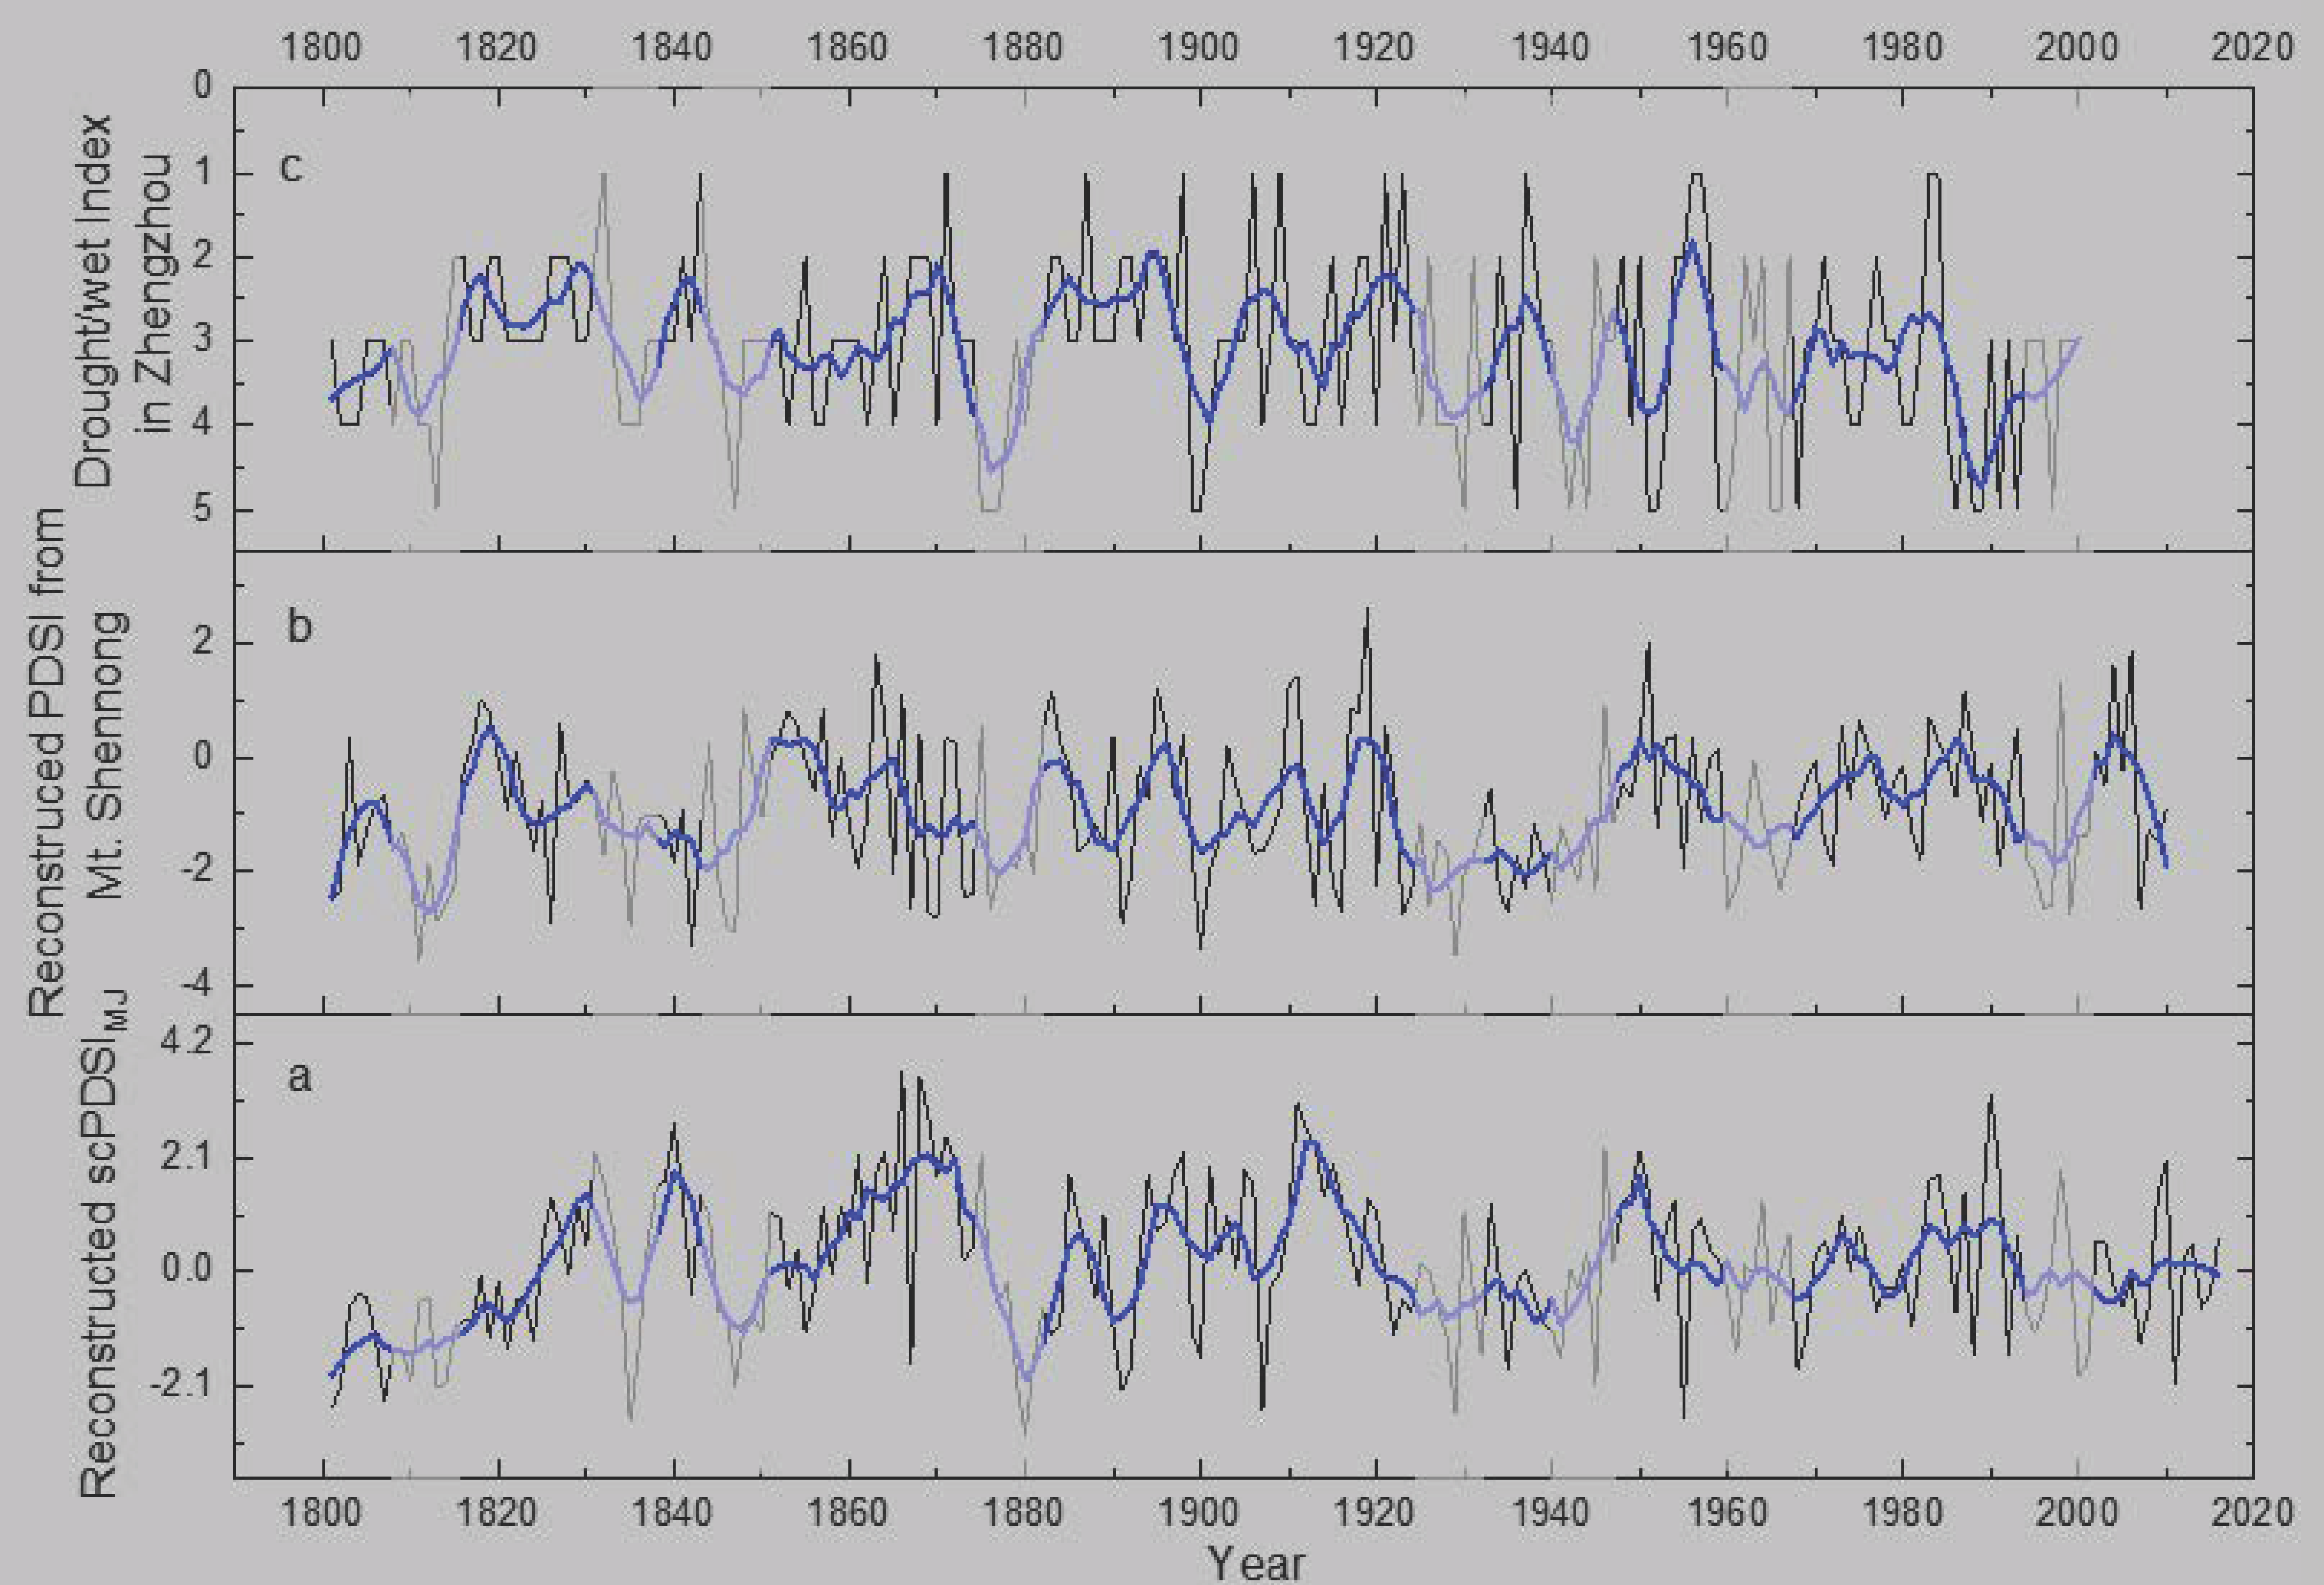
4.2. Drought Variation of the Reconstructed scPDSIMJ
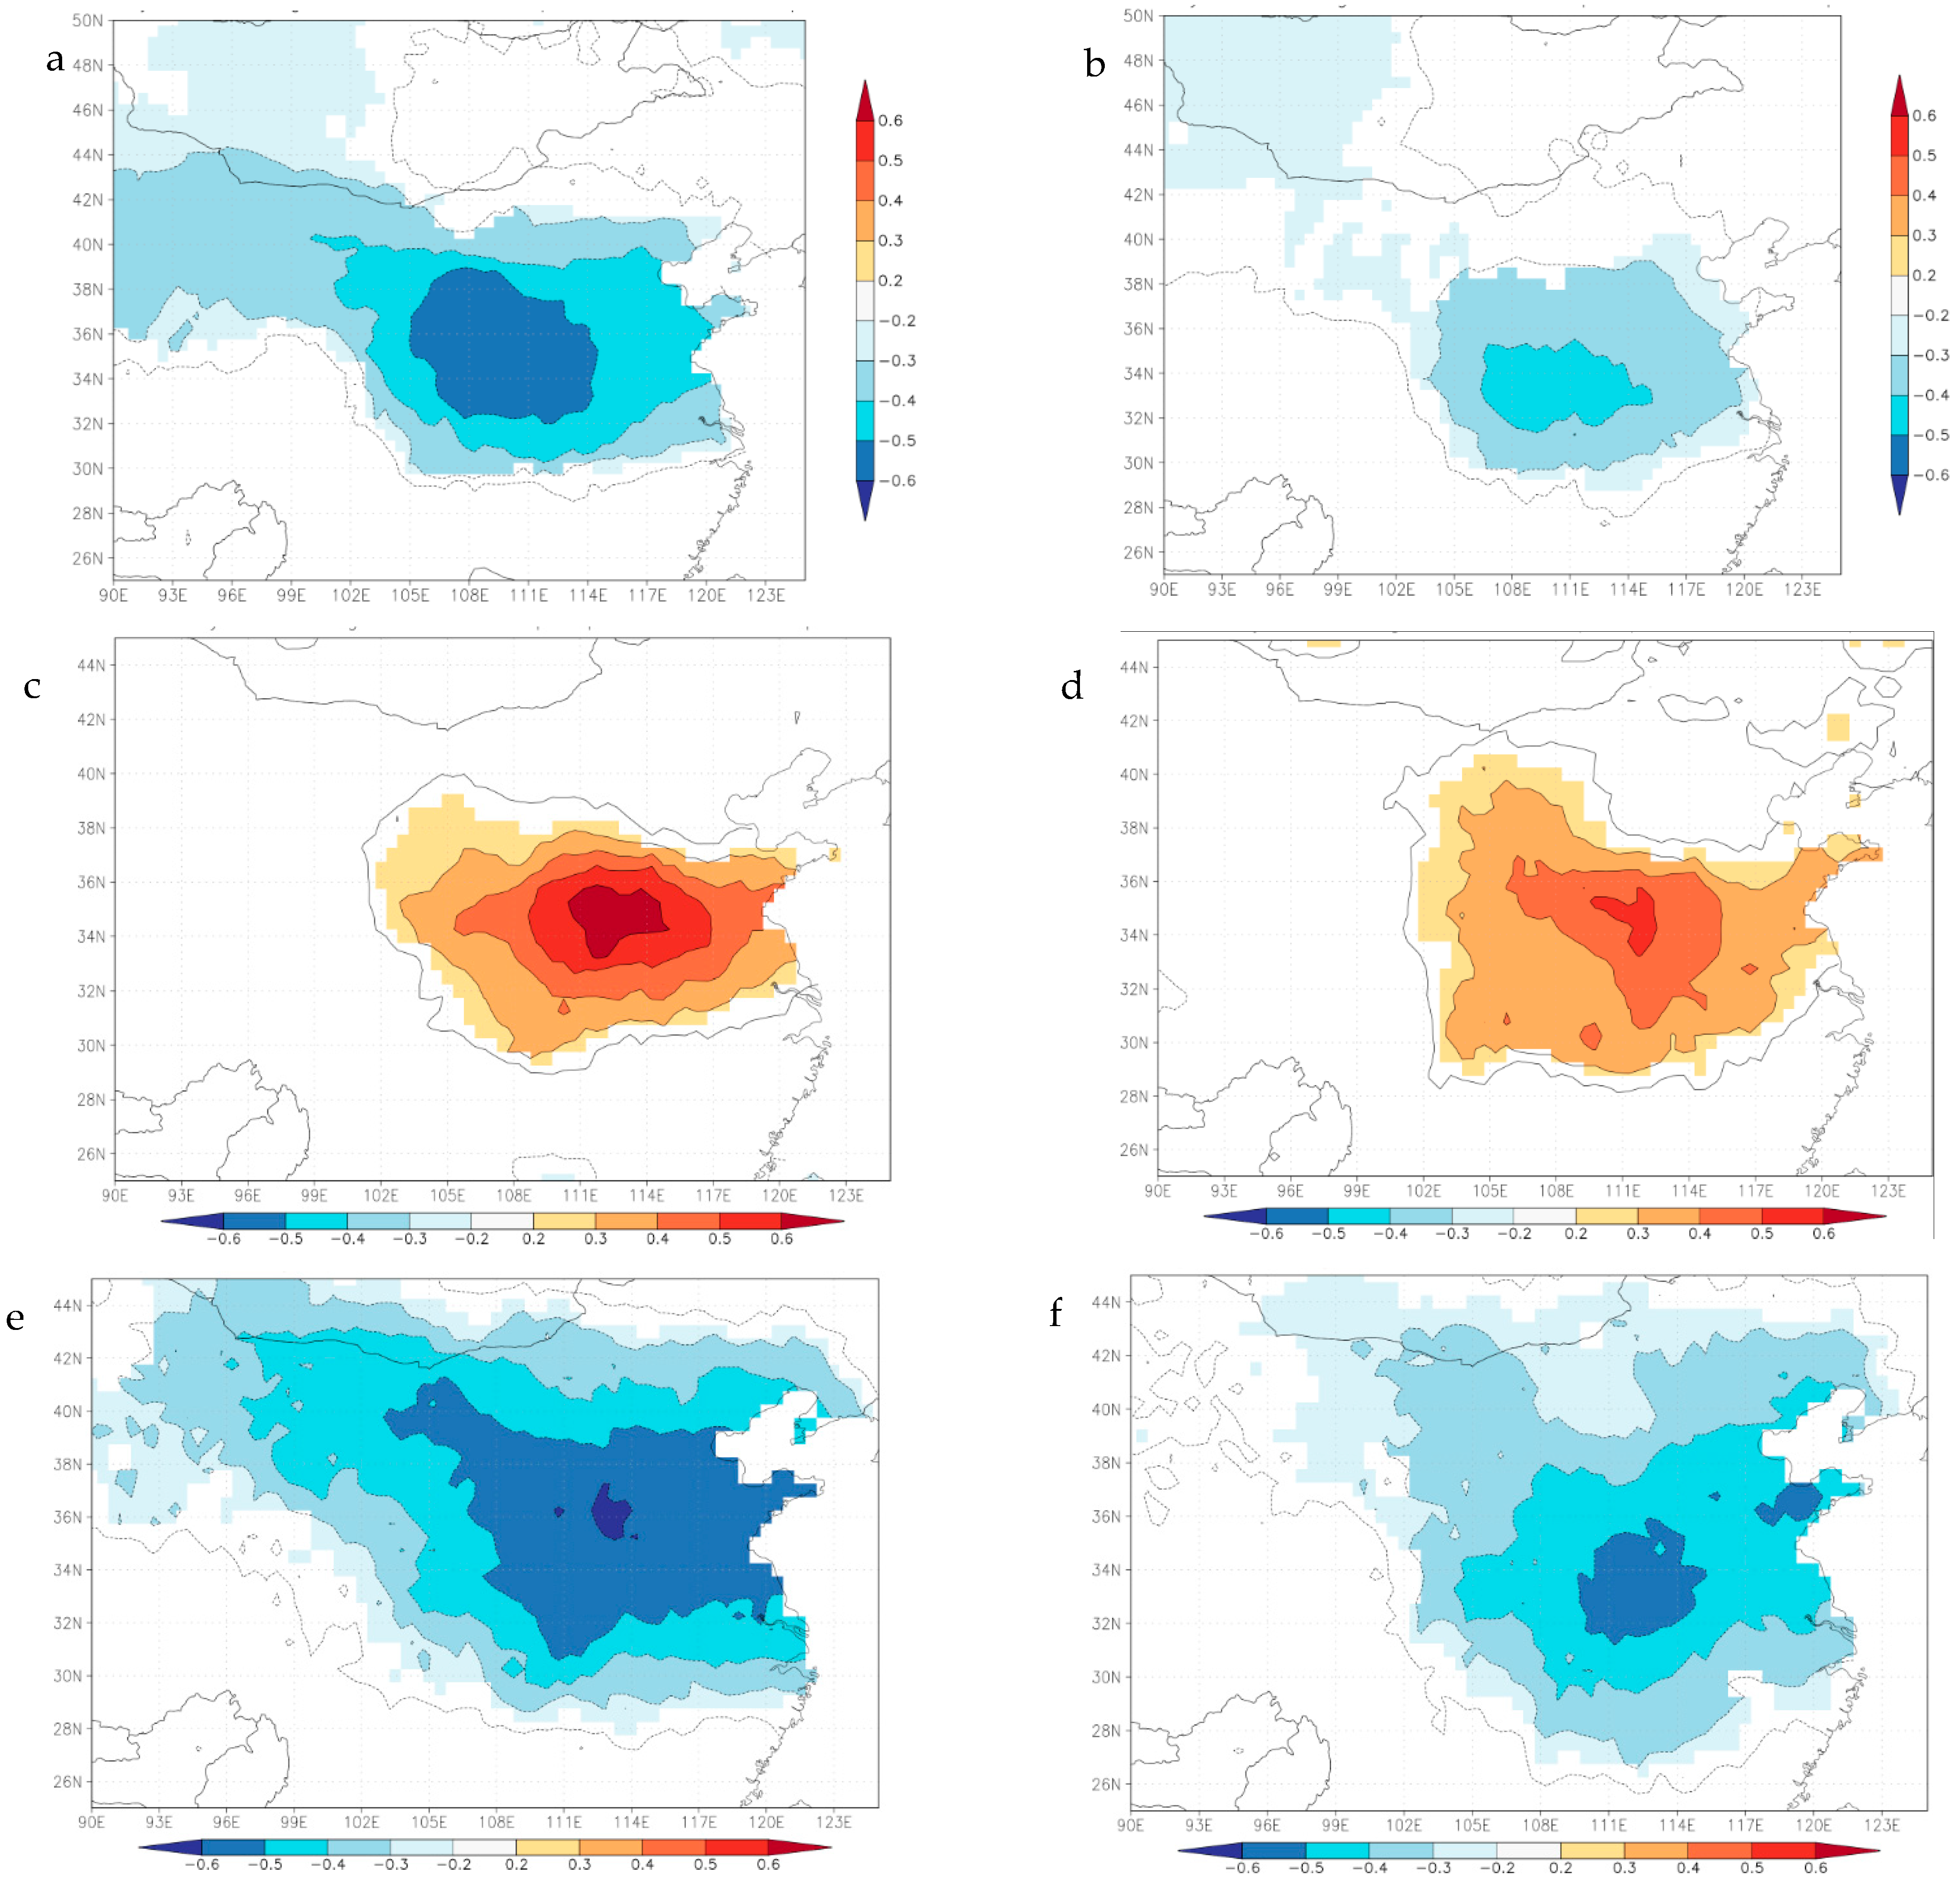
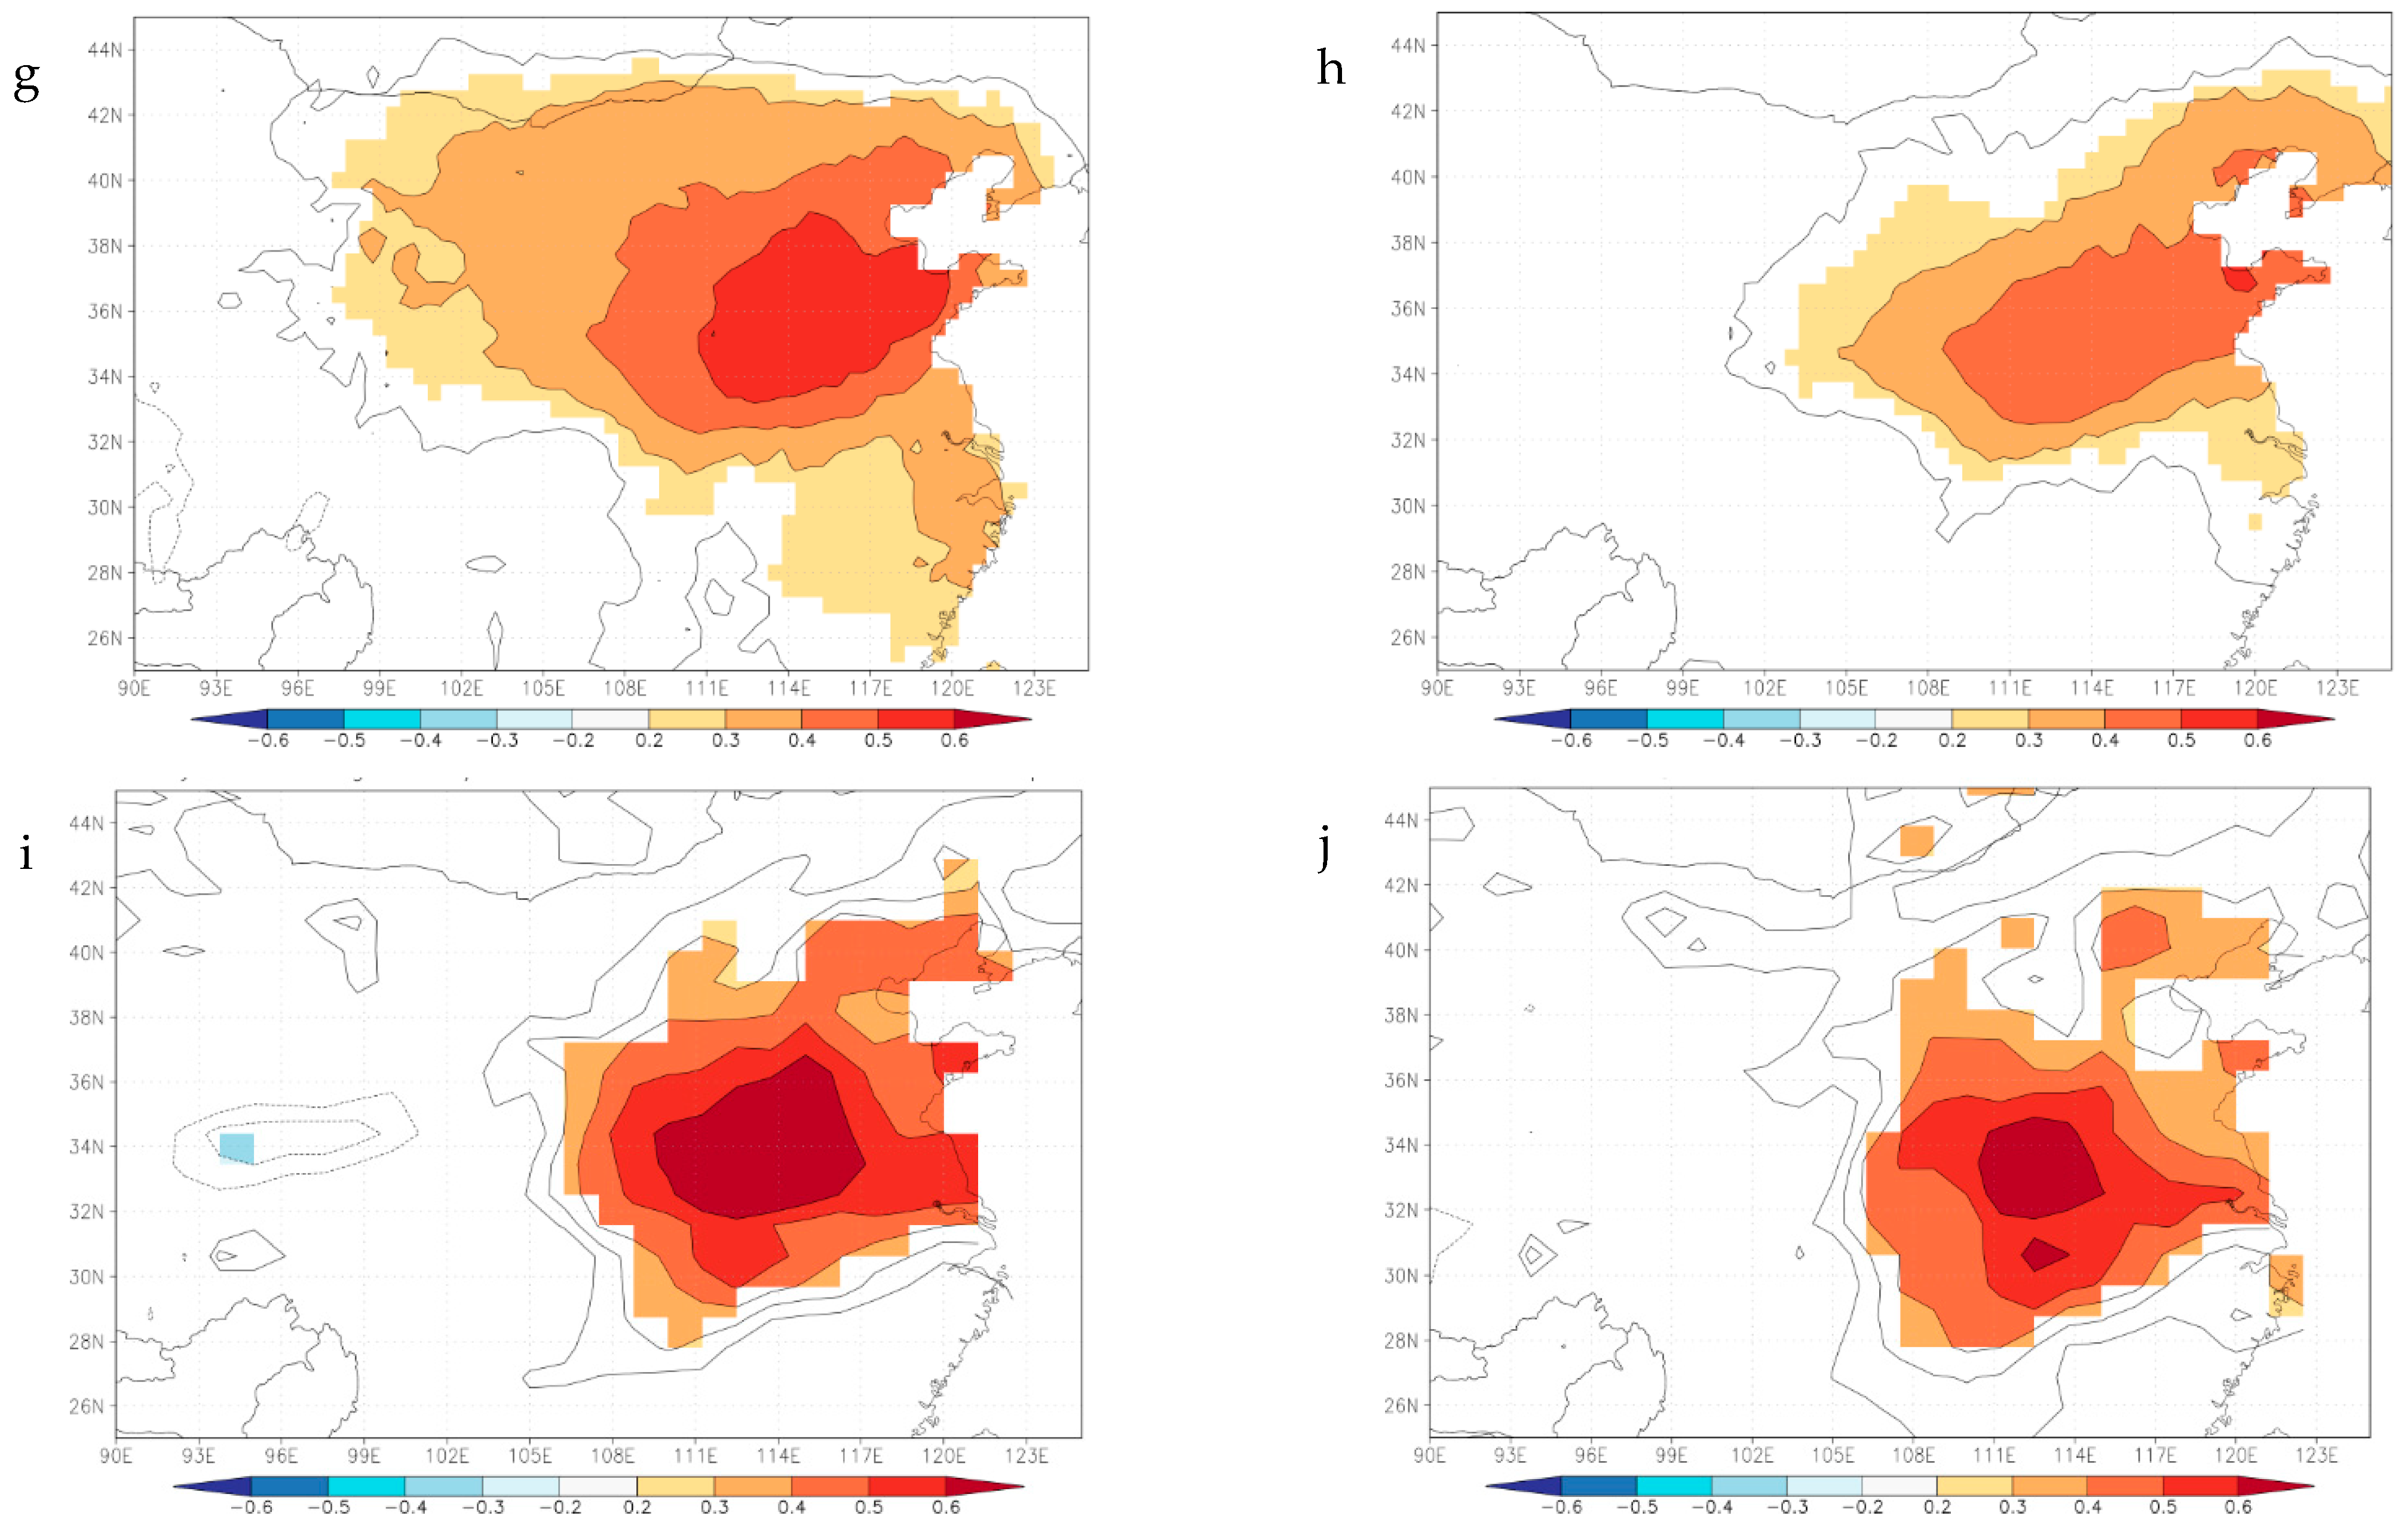
4.3. The Spatial Representations of Reconstructed scPDSIMJ
4.3.1. Spatial Representations
4.3.2. Causes analysis of Drought Variations
4.4. The Global Hydro-Climatic Signals in Reconstructed Mean scPDSIMJ
5. Conclusions
Author Contributions
Funding
Institutional Review Board Statement
Informed Consent Statement
Data Availability Statement
Acknowledgments
Conflicts of Interest
References
- IPCC: Summary for Policymakers. In Climate Change 2021; The Physical Science Basis. Contribution of Working Group I to the Sixth Assessment Report of the Intergovernmental Panel on Climate, Change; Masson-Delmotte, V.; Zhai, P.; Pirani, A.; Connors, S.L.; Péan, C.; Berger, S.; Caud, N.; Chen, Y.; Goldfarb, L.; Gomis, M.I.; et al. (Eds.) Cambridge University Press: Cambridge, UK; New York, NY, USA, 2021. [Google Scholar]
- Fritts, H.C. Tree Rings and Climate; Academic Press: New York, NY, USA, 1976. [Google Scholar]
- Wu, X.D. Tree Ring and Climate Change; China Meteorological Press: Beijing, China, 1990. (In Chinese) [Google Scholar]
- Cook, E.R.; Anchukaitis, K.J.; Buckley, B.M.; D’Arrigo, R.D.; Jacoby, G.C.; Wright, W.E. Asian monsoon failure and mega drought during the last millennium. Science 2010, 328, 486–489. [Google Scholar] [CrossRef] [PubMed] [Green Version]
- Cai, Q.F.; Liu, Y. The June–September maximum mean temperature reconstruction from Masson pine (Pinus massoniana Lamb.) tree rings in Macheng, southeast China since 1879 AD. China Sci. Bull. 2013, 58, 169–177. (In Chinese) [Google Scholar]
- Cai, Q.; Liu, Y.; Duan, B.C.; Sun, C.F. Regional difference of the start time of the recent warming in Eastern China: Prompted by a 165-year temperature record deduced from tree rings in the Dabie Mountains. Clim. Dyn. 2018, 50, 2157–2168. [Google Scholar] [CrossRef]
- Chen, F.; Yuan, Y.J.; Wei, W.S.; Yu, S.L.; Zhang, T.W. Reconstructed temperature for Yong’an, Fujian, Southeast China: Linkages to the Pacific Ocean climate variability. Glob. Planet. Change 2012, 86–87, 11–19. [Google Scholar] [CrossRef]
- Chen, F.; Zhang, R.B.; Wang, H.Q.; Qin, L. Recent climate warming of central China reflected by temperature sensitive tree growth in the eastern Qinling mountains and its linkages to the Pacific and Atlantic Oceans. J. Mt. Sci. 2015, 12, 396–403. [Google Scholar] [CrossRef]
- Chen, F.; Gagen, M.H.; Zhang, H.L.; Chen, Y.P.; Fan, Z.A.; Chen, F.H. Warm season temperature in the Qinling Mountains (north-central China) since 1740 CE recorded by tree-ring maximum latewood density of Shensi fir. Clim. Dyn. 2021, 57, 2653–2667. [Google Scholar] [CrossRef]
- Duan, J.P.; Zhang, Q.B.; Lv, L.X.; Zhang, C. Regional-scale winter-spring temperature variability and chilling damage dynamics over the past two centuries in southeastern china. Clim. Dyn. 2012, 39, 919–928. [Google Scholar] [CrossRef]
- Fang, K.Y.; Cai, B.G.; Liu, X.M.; Lei, G.L.; Jiang, X.Y.; Zhao, Y.; Li, H.C.; Heikki, S. Climate of the late pleistocene and early holocene in coastal south china inferred from submerged wood samples. Quat. Int. 2017, 447, 111–117. [Google Scholar] [CrossRef]
- Peng, J.F.; Liu, Y.Z.; Wang, T. A tree-ring record of 1920’s–1940’s droughts and mechanism analyses in Henan Province. Acta Ecol. Sin. 2014, 34, 3509–3518. (In Chinese) [Google Scholar]
- Peng, J.F.; Peng, K.Y.; Li, J.B. Climate-growth response of Chinese white pine (Pinus armandii) at different age groups in the Baiyunshan National Nature Reserve, central China. Dendrochronologia 2018, 49, 102–109. [Google Scholar] [CrossRef]
- Peng, J.F.; Li, J.B.; Wang, T.; Huo, J.X.; Yang, L. Effect of altitude on climate-growth relationships of chinese white pine (Pinus armandii) in the northern Funiu mountain, central China. Clim. Change 2019, 154, 273–288. [Google Scholar] [CrossRef]
- Peng, J.F.; Li, J.B.; Yang, L.; Li, J.R.; Huo, J.X. A 216-year tree-ring reconstruction of April-July relative humidity from Mt. Shiren, central China. Int. J. Climatol. 2020, 40, 6055–6066. [Google Scholar] [CrossRef]
- Shi, J.F.; Cook, E.R.; Li, J.B.; Lu, H.Y. Unprecedented January-July warming recorded in a 178-year tree-ring width chronology in the Dabie mountains, southeastern China. Palaeogeogr. Palaeoclimatol. Palaeoecol. 2013, 381–382, 92–97. [Google Scholar] [CrossRef] [Green Version]
- Shi, J.F.; Li, J.B.; David, D.; Zheng, J.Y.; Shi, S.Y.; Ge, Q.S.; Harry, F.L.; Zhao, Y.S.; Zhang, J.; Lu, H.Y. Two centuries of April-July temperature change in southeastern China and its influence on grain productivity. Sci. Bull. 2017, 62, 40–45. [Google Scholar] [CrossRef] [Green Version]
- Zhang, Y.; Tian, Q.H.; Guillet, S.; Stoffel, M. 500-yr. precipitation variability in Southern Taihang Mountains, China, and its linkages to ENSO and PDO. Clim. Change 2017, 144, 419–432. [Google Scholar] [CrossRef]
- Zhao, Y.S.; Shi, J.F.; Shi, S.Y.; Ma, X.Q.; Zhang, W.J.; Wang, B.W.; Sun, X.G.; Lu, H.Y.; Bräuning, A. Early summer hydroclimatic signals are captured well by tree-ring earlywood width in the eastern Qinling mountains, central china. Clim. Past 2019, 15, 1113–1131. [Google Scholar] [CrossRef] [Green Version]
- Zheng, Y.H.; Zhang, Y.; Shao, X.M.; Yin, Z.Y.; Jin, Z. Temperature variability inferred from tree-ring widths in the Dabie mountains of subtropical central China. Trees 2012, 26, 1887–1894. [Google Scholar] [CrossRef]
- Zheng, Y.H.; Shao, X.M.; Lu, F.; Li, Y. February-may temperature reconstruction based on tree-ring widths of Abies fargesii from the Shennongjia area in central China. Int. J. Biometeorol. 2016, 60, 1175–1181. [Google Scholar] [CrossRef]
- Tian, Q.H.; Liu, Y.; Cai, Q.F.; Bao, G.; Wang, W.P.; Xue, W.L.; Zhu, W.J.; Song, H.M.; Lei, Y. The Maximum Temperature of May-July Inferred from Tree-ring in Funiu Mountain since 1874 AD. Acta Geogr. Sin. 2009, 64, 879–887. (In Chinese) [Google Scholar]
- Shi, J.F.; Li, J.B.; Cook, E.R.; Zhang, X.Y.; Lu, H.Y. Growth response of Pinus tabulaeformis to climate along an elevation gradient in the eastern Qinling Mountains, central China. Clim. Res. 2012, 53, 157–167. [Google Scholar] [CrossRef] [Green Version]
- Liu, Y.; Zhang, Y.H.; Cai, Q.F.; Song, H.M.; Ma, Y.Y.; Mei, R.C. The tree-ring width based seasonal minimum temperature reconstruction at Shiren Mountains, Henan, China since 1850 AD and its record of 20th century warming. J. Earth Environ. 2015, 6, 393–406. [Google Scholar]
- Liu, Y.; Liu, H.; Song, H.M.; Li, Q.; George, S.B.; Wang, L.; Hu, S.L. A 174-year Asian summer monsoon related relative humidity record from tree-ring δ18O in the Yaoshan region, eastern central China. Sci. Total Environ. 2017, 593–594, 523–534. [Google Scholar] [CrossRef] [PubMed]
- Yang, L.; Li, J.R.; Peng, J.F.; Huo, J.X.; Chen, L. Temperature variation and influence mechanism of Pinus tabulaeformis ring width recorded since 1801 at Yao Mountain, Henan Province. Acta Ecol. Sin. 2012, 41, 79–91. [Google Scholar]
- Shi, J.F.; Lu, H.Y.; Wan, J.D.; Li, S.F.; Nie, H.S. Winter-half year temperature reconstruction of the last century using Pinus armandii Franch tree-ring width chronologies in the eastern Qinling Mountains. Quat. Sci. 2009, 29, 831–836. (In Chinese) [Google Scholar]
- Liu, Y.; Zhang, Y.H.; Song, H.M.; Ma, Y.Y.; Cai, Q.F.; Wang, Y.C. Tree-ring reconstruction of seasonal mean minimum temperature at Mt. Yaoshan, China, since 1873 and its relevance to 20th-century warming. Clim. Past Discuss. 2014, 10, 859–894. [Google Scholar]
- Xu, H.C. Tree Growth Chinese Pine; China Forest Industry Press: Beijing, China, 1993; pp. 125–126. (In Chinese) [Google Scholar]
- Wigley, T.M.L.; Briffa, K.R.; Jones, P.D. On the average value of correlated time series with applications in dendroclimatology and hydrometeorology. J. Appl. Meteorol. Climatol. 1984, 23, 201–213. [Google Scholar] [CrossRef]
- van der Schrier, G.; Barichivich, J.; Briffa, K.R.; Jones, P.D. A scPDSI-based global data set of dry and wet spells for 1901–2009. J. Geophys. Res.-Atmos. 2013, 118, 4025–4048. [Google Scholar] [CrossRef]
- Cook, E.R.; Meko, D.M.; Stahle, D.W.; Cleaveland, M.K. Drought reconstructions for the continental United States. J. Clim. 1999, 12, 1145–1162. [Google Scholar] [CrossRef] [Green Version]
- Torrence, C.; Compo, G.P. A practical guide to wavelet analysis. Bull. Am. Meteorol. Soc. 1998, 79, 61–78. [Google Scholar] [CrossRef] [Green Version]
- Allan, R.J.; Lindesay, J.A.; Parker, D.E. El Nino Southern Oscillation and Climatic Variability; CSIRO: Melbourne, Australia, 1996. [Google Scholar]
- Su, M.F.; Wang, H.J. Relationship and its instability of ENSO-Chinese variations in droughts and wet spells. Sci. China-Earth Sci. 2007, 50, 145–152. (In Chinese) [Google Scholar] [CrossRef]
- d’Orgeville, M.; Hua, B.L.; Sasaki, H. Equatorial deep jets triggered by a large vertical scale variability within the western boundary layer. J. Mar. Res. 2007, 65, 1–25. [Google Scholar] [CrossRef] [Green Version]
- Yang, Q.; Ma, Z.G.; Fan, X.G.; Yang, Z.L.; Xu, Z.F.; Wu, P.L. Decadal modulation of precipitation patterns over eastern China by sea surface temperature anomalies. J. Clim. 2017, 30, 7017–7033. [Google Scholar] [CrossRef]
- CCMDC. The Compilation of China Meteorological Disaster Canon. China Meteorological Disaster Canon; China Meteorological Press: Beijing, China, 2006. (In Chinese) [Google Scholar]
- CMA. Chinese Meteorological Administration. Yearly Charts of Dryness/Wetness in China for the Last 500-Year Period; Cartographic Publishing House: Beijing, China, 1981. (In Chinese) [Google Scholar]
- Ma, Z.G. Relationship between the trend of aridity in North China and the Decadal Oscillation of the Pacific Ocean. China Sci. Bull. 2007, 55, 1199–1206. (In Chinese) [Google Scholar]
- Zheng, Q.Y.; Shen, B.Z.; Gong, Z.Q.; Zhou, J.; Hu, J.G. Relationship between North Pacific Oscillation in May and Drought /Flood in Summer in North China. Plateau Meteorol. 2014, 3, 775–785. [Google Scholar]


| Climate Data Source | Latitude (°N) | Longitude (°E) | Elevation (m a.s.l.) |
|---|---|---|---|
| Songxian | 34.13 | 112.06 | 440.7 |
| Neixiang | 33.15 | 111.88 | 221.4 |
| scPDSI-1 | 33.75 | 111.75 | - |
| scPDSI-2 | 33.75 | 112.25 | - |
| scPDSI-3 | 34.25 | 111.75 | - |
| scPDSI-4 | 34.25 | 112.25 | - |
| Regional scPDSI | 33.5–34.5 | 111.5–112.5 | - |
| Calibration (1963–1991) | Verification (1992–2016) | Calibration (1988–2016) | Verification (1963–1987) | Full Calibration (1963–2016) | |
|---|---|---|---|---|---|
| R | 0.714 ** | 0.696 ** | 0.814 ** | 0.601 ** | 0.710 ** |
| R2 | 0.510 | 0.485 | 0.662 | 0.361 | 0.504 |
| CE | 0.298 | 0.324 | |||
| RE | 0.668 | 0.440 | |||
| ST | 22+/7− ** | 18+/7− * | 22+/7− ** | 19+/6− * | 41+/13− ** |
| F | 28.108 | 21.663 | 52.948 | 12.994 | 52.795 |
| scPDSIMJ (1801–2016, This Study) | RHAJ (1801–2016) [15] | scPDSIMJJ (1868–2005) [19] | Historical Records in Henan Province [38] | |
|---|---|---|---|---|
| Extremely dry period | 1801–1802 | 1801–1802 | Not available | |
| 1807,1810 | 1807–1810 | Drought from spring to summer | ||
| 1813–1814 | 1813–1814 | Drought from spring to summer in 1813 and spring drought in 1814 | ||
| 1821 | Not available | |||
| 1835 | 1835–1836 | Severe drought from spring to summer | ||
| 1847 | 1847 | Drought from spring to summer | ||
| 1867 | 1867 | Drought from spring to summer in Gongyi, Henan | ||
| 1879–1881 | 1879–1881 | 1879 | A mega-drought caused a great famine over Henan and Shaanxi so on provinces in northern China in during 1876–1879 | |
| 1891–1892 | 1891–1892 | Not available | ||
| 1900 | 1900 | 1900 | Severe drought from spring to autumn over Henan and Shanxi | |
| 1907 | 1907 | Drought from spring to summer | ||
| 1923,1926, | Not available | |||
| 1929 | 1929 | 1929 | Severe drought from spring to autumn over Henan, the river and pond dry up | |
| 1932 | 1932 | Drought from summer to autumn over Henan | ||
| 1935 | 1935 | Severe spring drought over Henan | ||
| 1941 | 1941 | Severe drought from spring to autumn in 1941 and 1942 | ||
| 1945 | 1945 | Severe drought and locust disaster over Henan | ||
| 1955 | 1955 | Severe drought from spring to early summer | ||
| 1968 | 1968, | Drought from spring to summer in the most of Henan | ||
| 1988 | 1988 | Severe drought following the drought of 1985–1987 | ||
| 1992, | 1992, | Severe spring drought | ||
| 1994,1995 | Not available | |||
| 2000–2001 | 2000–2001 | 2000 | Severe drought from February to May (the worst one since 1950) | |
| 2007 | Not available | |||
| 2011 | 2011 | Severe drought from January to February since October 2010 (the lowest for the same period since 1951) | ||
| Extremely wet period | 1831 | Spring and summer rains from north to south of the Yellow River | ||
| 1840 | Not available | |||
| 1862–1864 | Not available | |||
| 1866 | Flood in March in Yexian | |||
| 1868–1872 | 1869 | Flood in summer and autumn over Henan in 1869 | ||
| 1875 | Not available | |||
| 1883 | Not available | |||
| 1885 | 1885 | Flood in summer in Lingbao and Shanxian (northwestern Henan) | ||
| 1894 | 1894 | Not available | ||
| 1895 | Not available | |||
| 1898 | 1898 | Severe flood in summer at Yi and Luo river (Henan), Shangnan (Shaanxi) | ||
| 1901 | Flood in Fangcheng (Henan) | |||
| 1905 | 1905 | Severe flood in spring and summer over Henan | ||
| 1906 | Not available | |||
| 1911–1913 | 1910–1912 | Persistent flood in summer and autumn over Henan during 1910- 1913 | ||
| 1915 | Flood in summer and autumn over Henan | |||
| 1933,1934, | Not available | |||
| 1936,1944 | Not available | |||
| 1946 | Persistent rainfall in spring and summer in the most of Henan | |||
| 1948,1949 | Not available | |||
| 1950 | Not available | |||
| 1973,1980, | Not available | |||
| 1983 | 1983 | Rainstorm in April and May in the north Henan in 1983 | ||
| 1984 | 1984 | From June to September, there were 5 large-scale rainstorms over Henan in 1984 | ||
| 1990 | 1990 | Not available | ||
| 1991 | Rainstorm in September in Nanzhao (Henan) | |||
| 1998, | Not available | |||
| 2010 | Low temperature and rain in spring, heavy rain in summer | |||
| The five driest years | 1880 (−2.999) | 1880 (57.82) | 1879 (−3.61) | Ding-Wu disaster, Shanxi and Henan famine, extreme drought |
| 1835 (−2.795) | 1835 (60.05) | 2000 (−2.94) | ||
| 1955 (−2.723) | 1955 (60.24) | 1929 (−2.53) | ||
| 1929 (−2.629) | 1929 (60.50) | 1926 (−2.33) | ||
| 1907 (−2.552) | 1907 (60.71) | 1923 (−2.28) |
Publisher’s Note: MDPI stays neutral with regard to jurisdictional claims in published maps and institutional affiliations. |
© 2022 by the authors. Licensee MDPI, Basel, Switzerland. This article is an open access article distributed under the terms and conditions of the Creative Commons Attribution (CC BY) license (https://creativecommons.org/licenses/by/4.0/).
Share and Cite
Peng, J.; Li, J.; Li, X.; Cui, J.; Peng, M. Climate-Growth Relationships of Chinese Pine (Pinus tabulaeformis Carr.) at Mt. Shiren in Climatic Transition Zone, Central China. Biology 2022, 11, 753. https://doi.org/10.3390/biology11050753
Peng J, Li J, Li X, Cui J, Peng M. Climate-Growth Relationships of Chinese Pine (Pinus tabulaeformis Carr.) at Mt. Shiren in Climatic Transition Zone, Central China. Biology. 2022; 11(5):753. https://doi.org/10.3390/biology11050753
Chicago/Turabian StylePeng, Jianfeng, Jinbao Li, Xuan Li, Jiayue Cui, and Meng Peng. 2022. "Climate-Growth Relationships of Chinese Pine (Pinus tabulaeformis Carr.) at Mt. Shiren in Climatic Transition Zone, Central China" Biology 11, no. 5: 753. https://doi.org/10.3390/biology11050753
APA StylePeng, J., Li, J., Li, X., Cui, J., & Peng, M. (2022). Climate-Growth Relationships of Chinese Pine (Pinus tabulaeformis Carr.) at Mt. Shiren in Climatic Transition Zone, Central China. Biology, 11(5), 753. https://doi.org/10.3390/biology11050753