
Drosophila Wing Integration and Modularity: A Multi-Level Approach to Understand the History of Morphological Structures


Abstract
:Simple Summary
Abstract
1. Introduction
2. Materials and Methods
2.1. Samples and Shape Analyses
2.2. Measurement Error
2.3. Comparative Analysis
2.4. Multi-Levels Approach
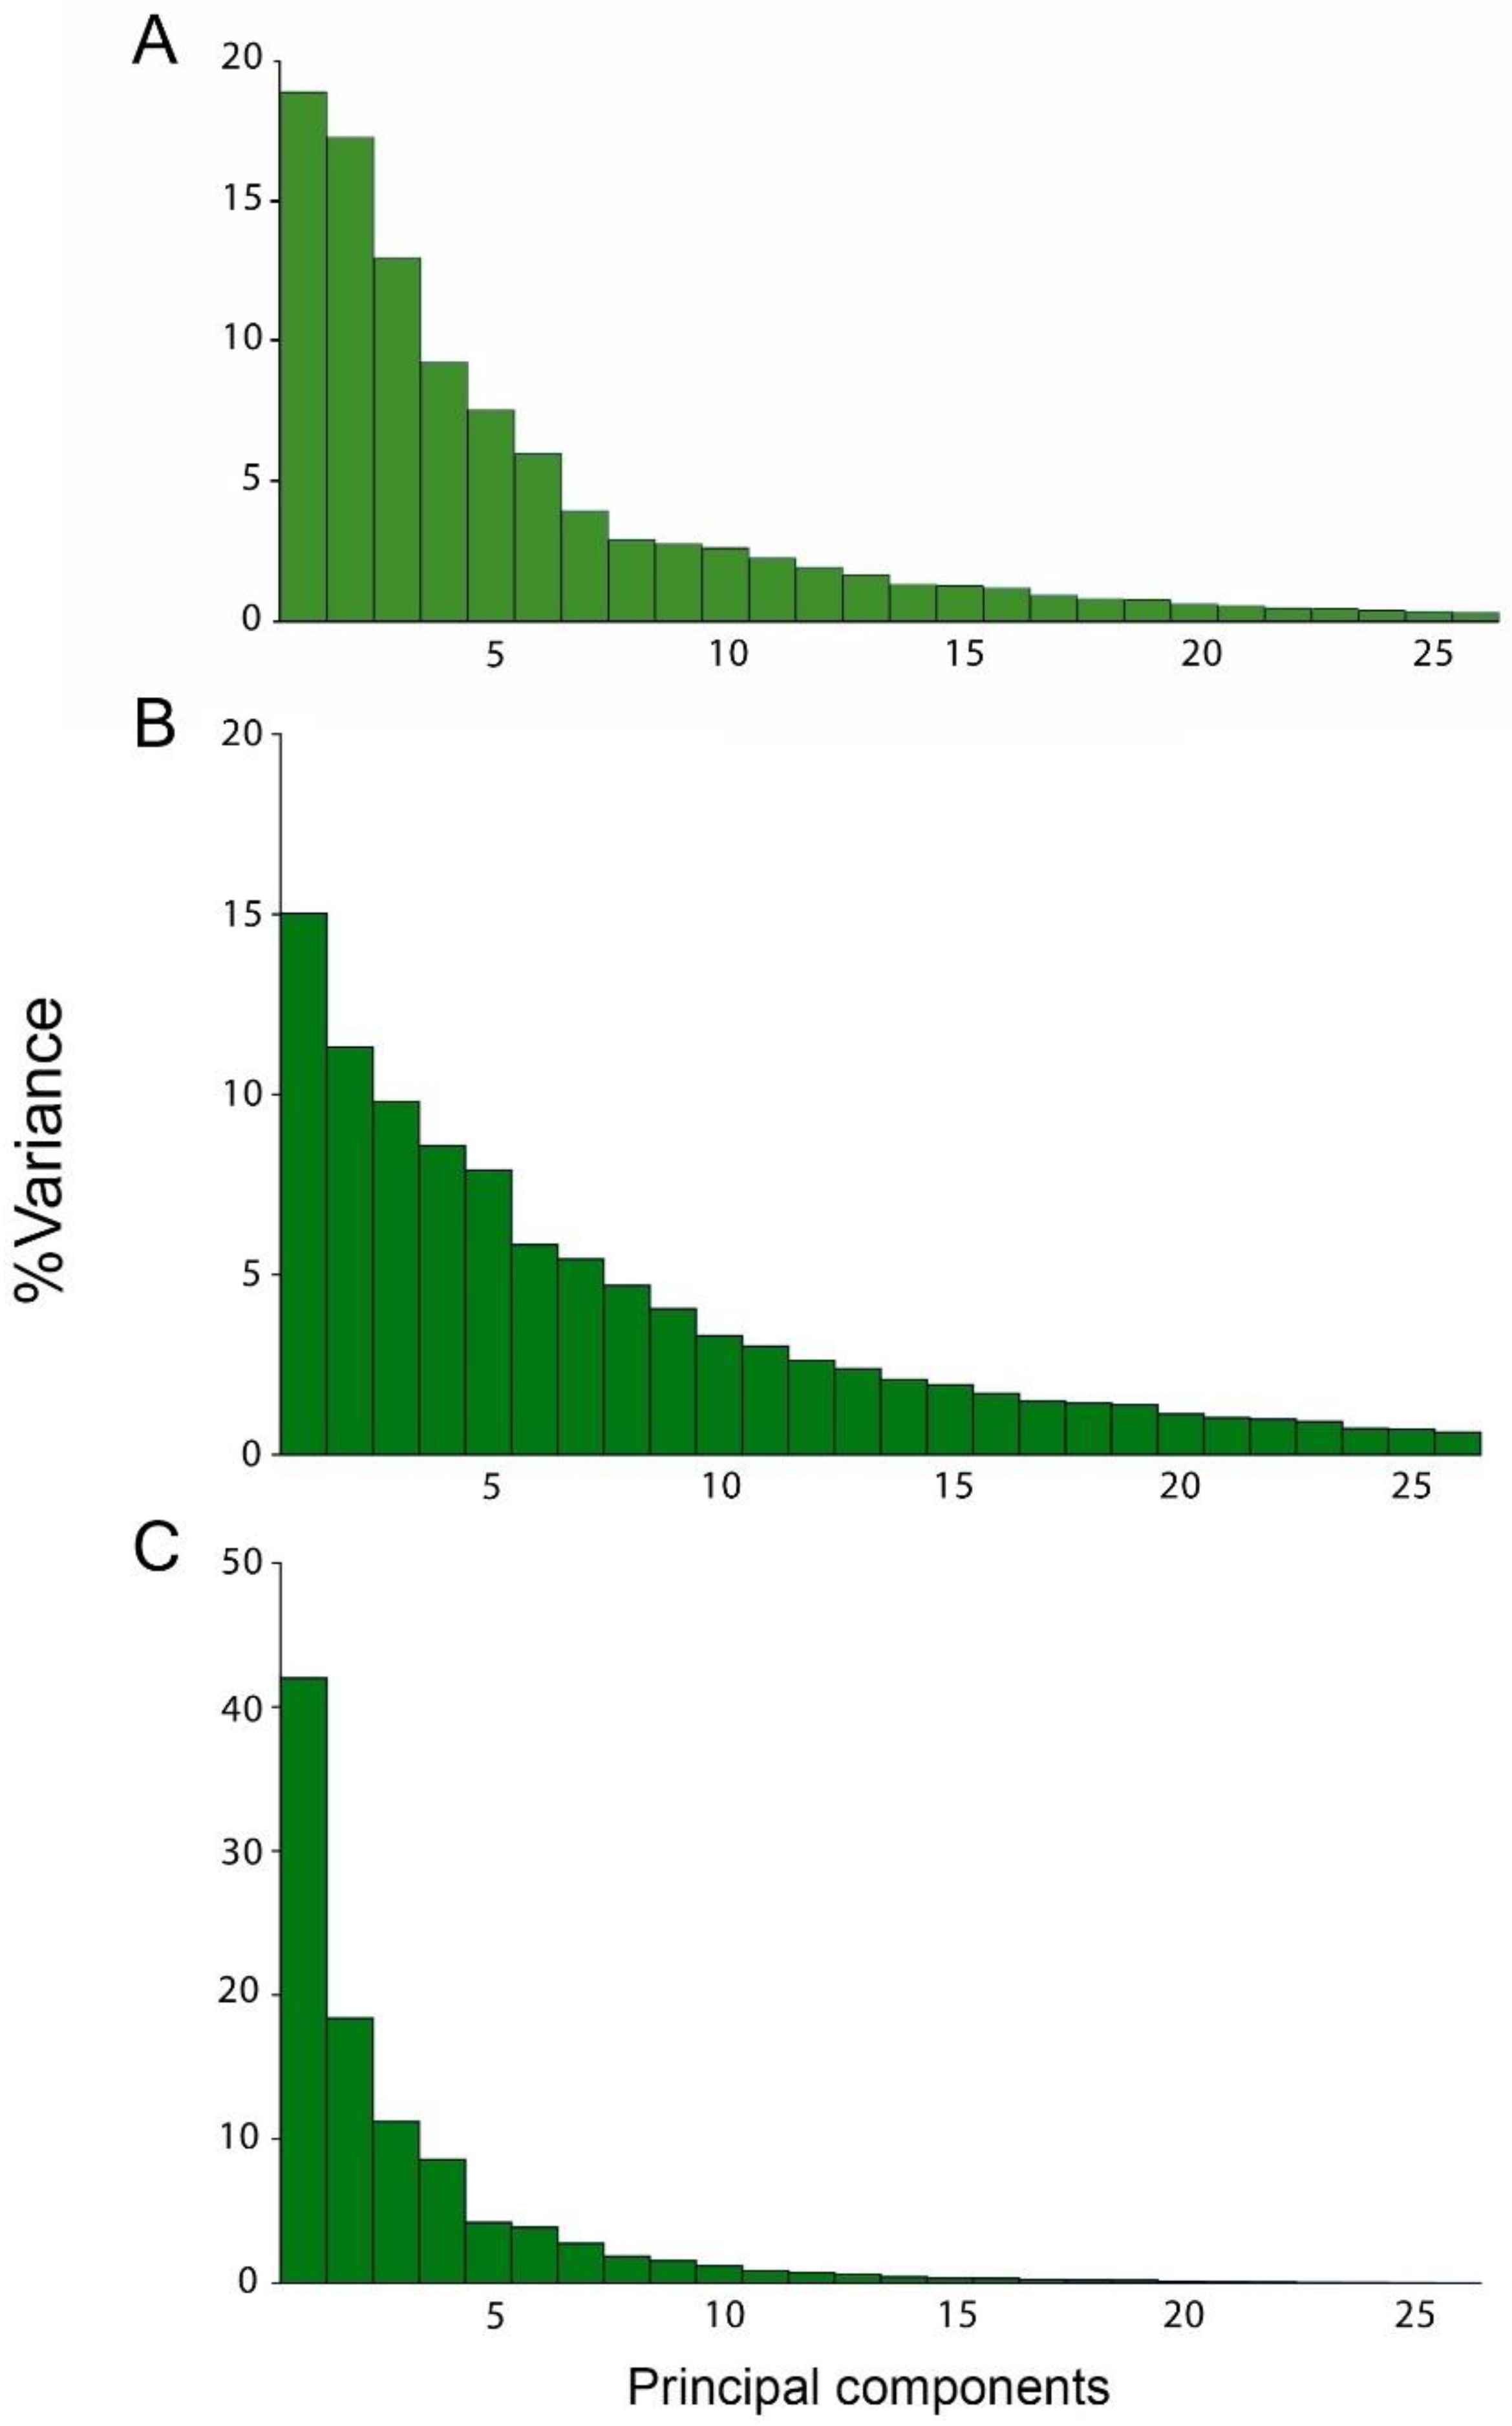
- Static Level: This is basically the level of variation among individuals in a consistent sample, where all individuals belong to the same species and ontogenetic phase [4]. For this level, integration and modularity patterns were studied by examining the variation patterns derived from the pooled within species and sex covariance matrix of wing shape.
- Developmental Level: This level arises from the interactions between developmental processes that generate different traits, and hence produce covariation between them [4]. Covariation arises as result of the processes that generated the morphological structures under study, and it is therefore possible, within certain boundaries, to use morphological covariation to infer how the traits interact developmentally. The study of FA is an effective manner to remove genetic and environmental variation among individuals [3], as the left and right sides of an structure share the same genome and almost the same environmental circumstances, hence the differences between the sides can be assumed to be derived from random fluctuations during the developmental process [3,32,37,38]. Therefore, we used the covariance matrix of fluctuating asymmetry to analyse developmental level integration (i.e., this will allow us to study directly the intrinsic, developmental component of integration and modularity). It is important to keep in mind that the calculation of the FA is provided by the ANOVAs for shape considering individual and side effects, and the interaction between them. The MS related to the individual effect was used as an estimator of individual variation, and the MS related to the interaction (individual x side) as an estimator of FA.
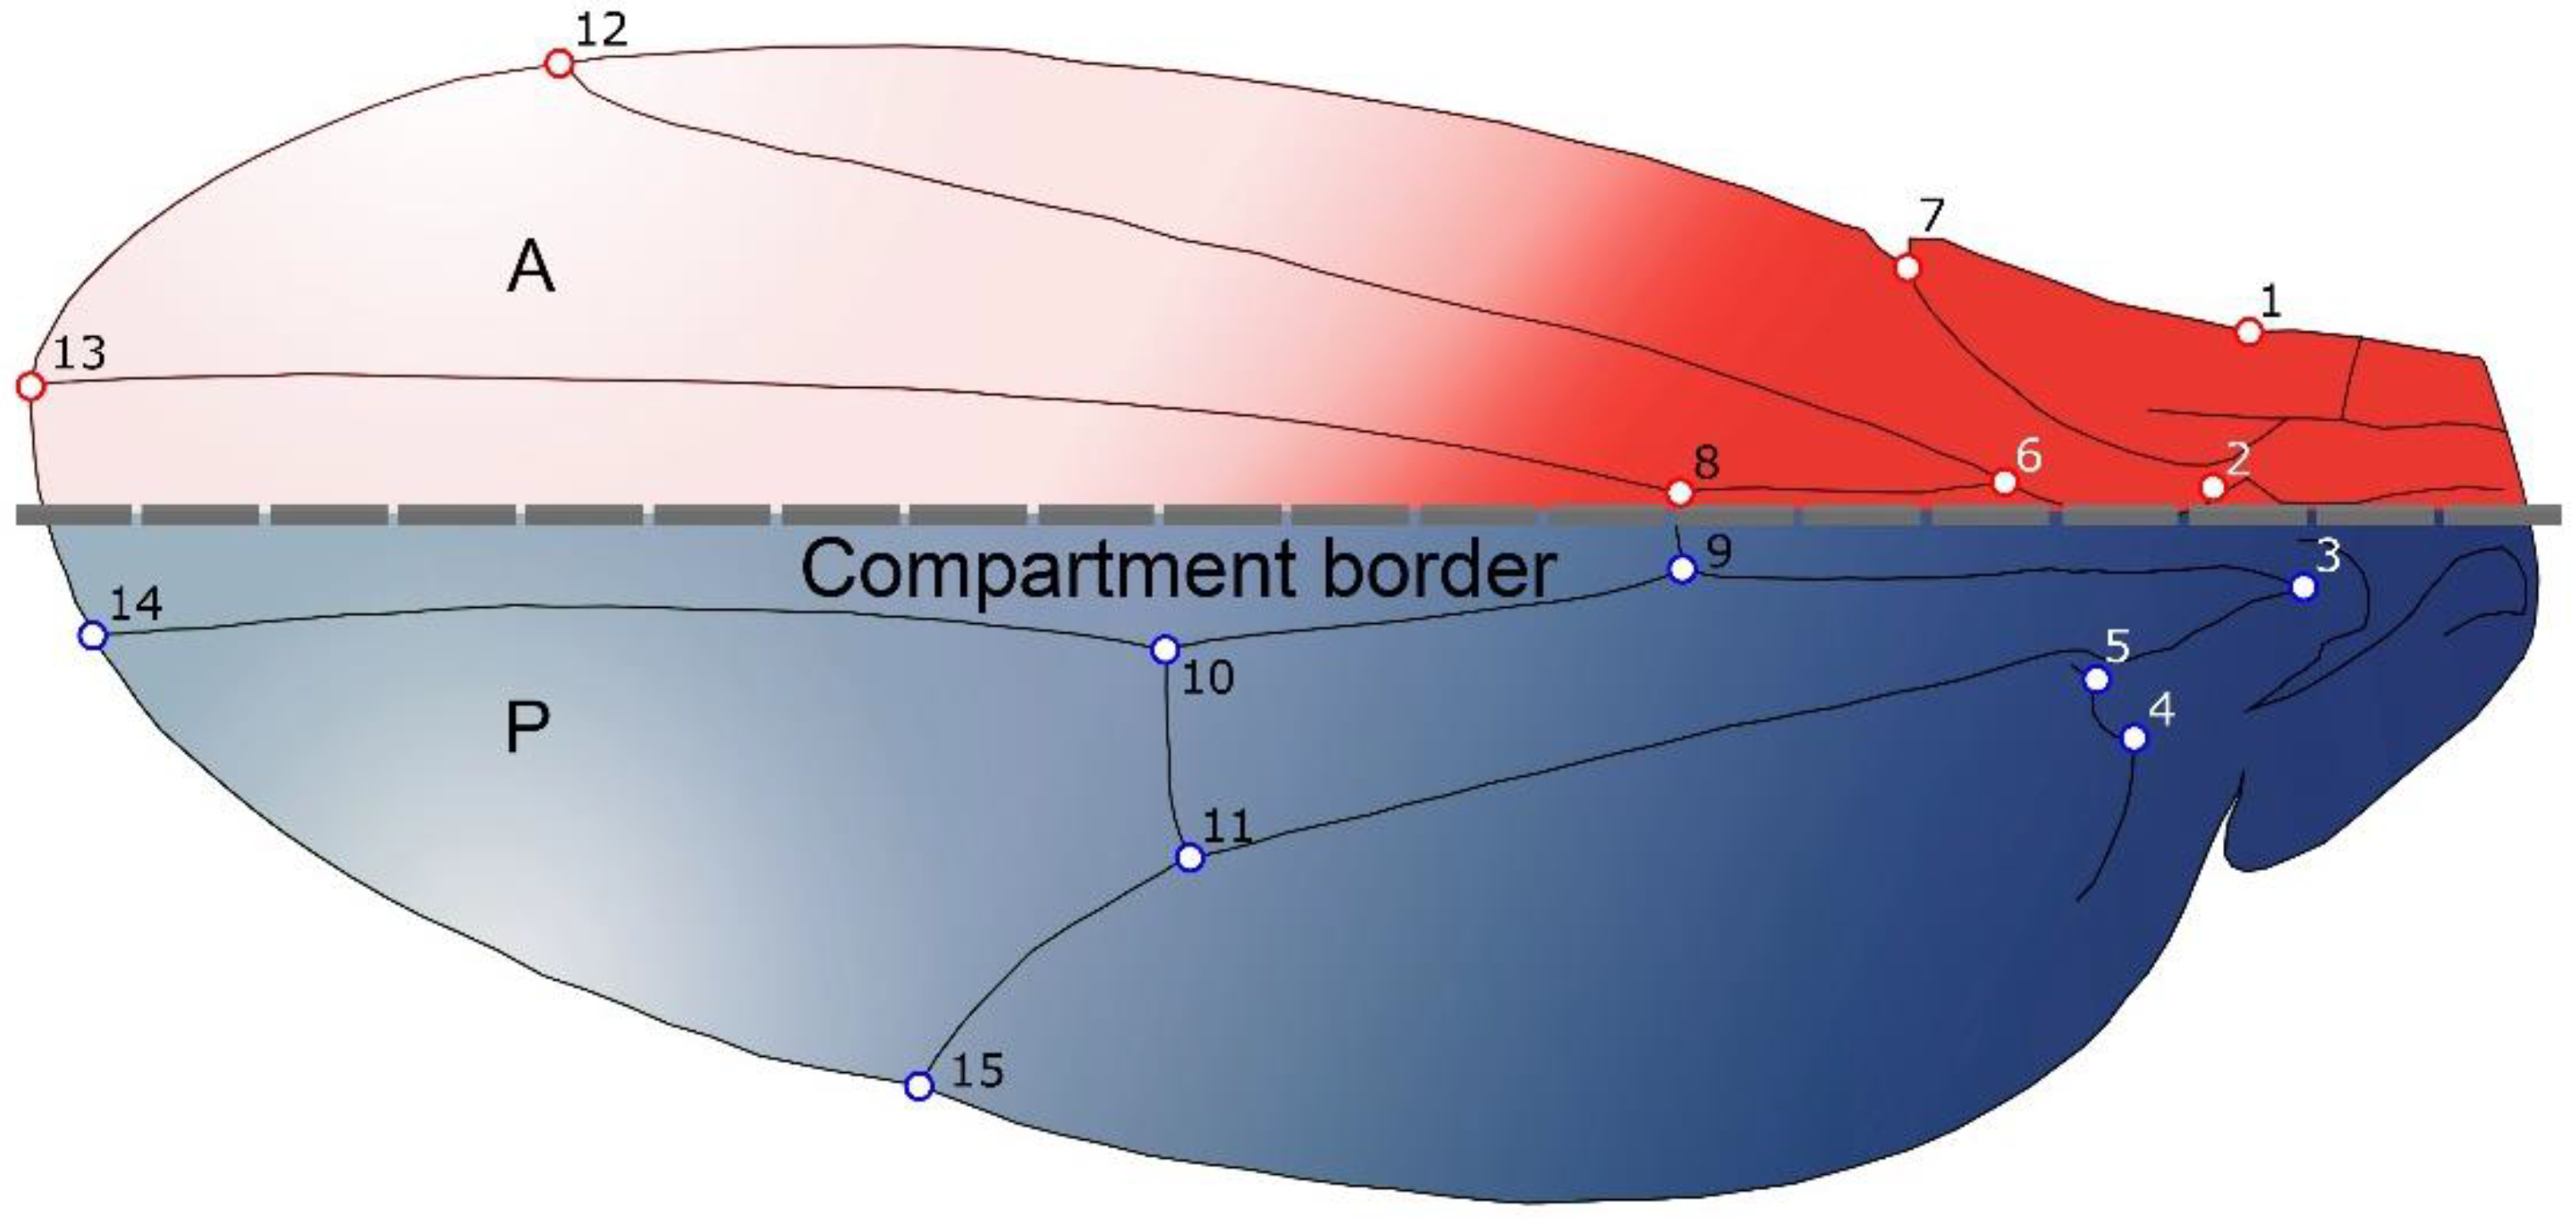
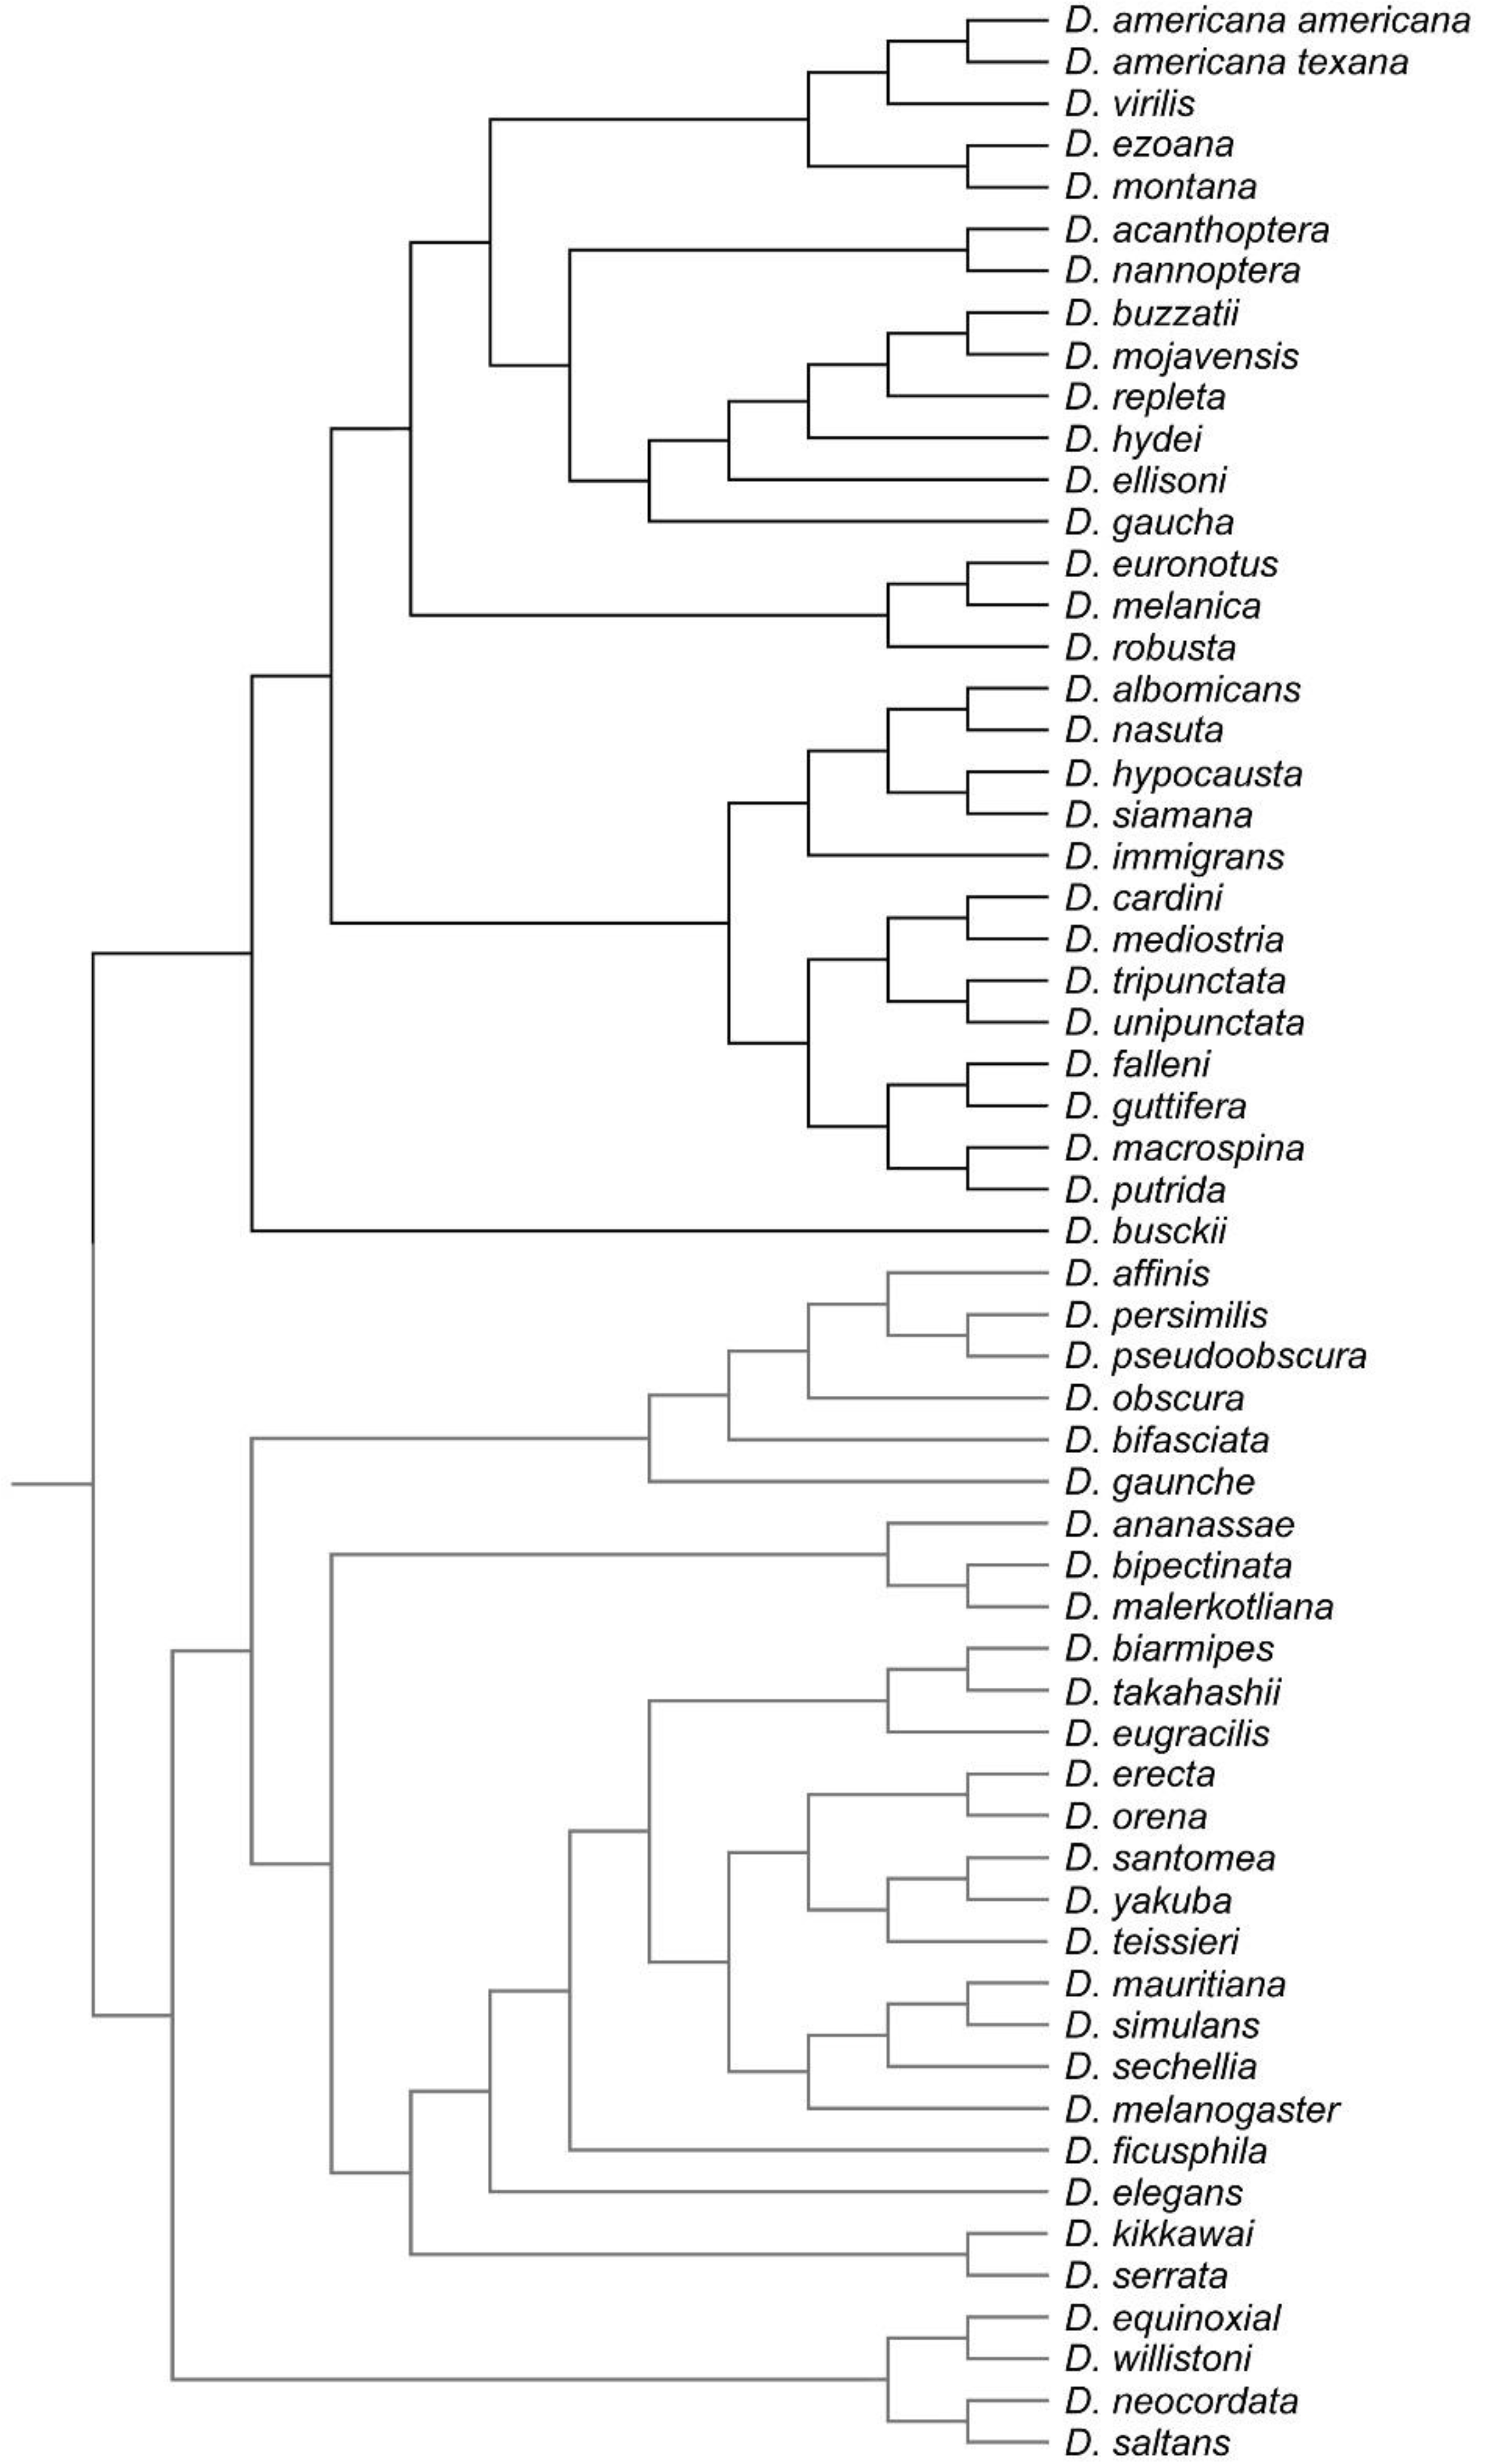
- Evolutionary Level: Covariation among evolutionary changes in different features, arise from several processes including drift, mutation, selection and gene flow [4]. To study evolutionary integration and modularity a comparative approach is required to consider the phylogenetic structure of the data. Consequently, morphological integration and modularity across Drosophila species can be assessed by studying the relations between shape features and the evolutionary changes along the branches of the phylogeny.
2.5. Integration
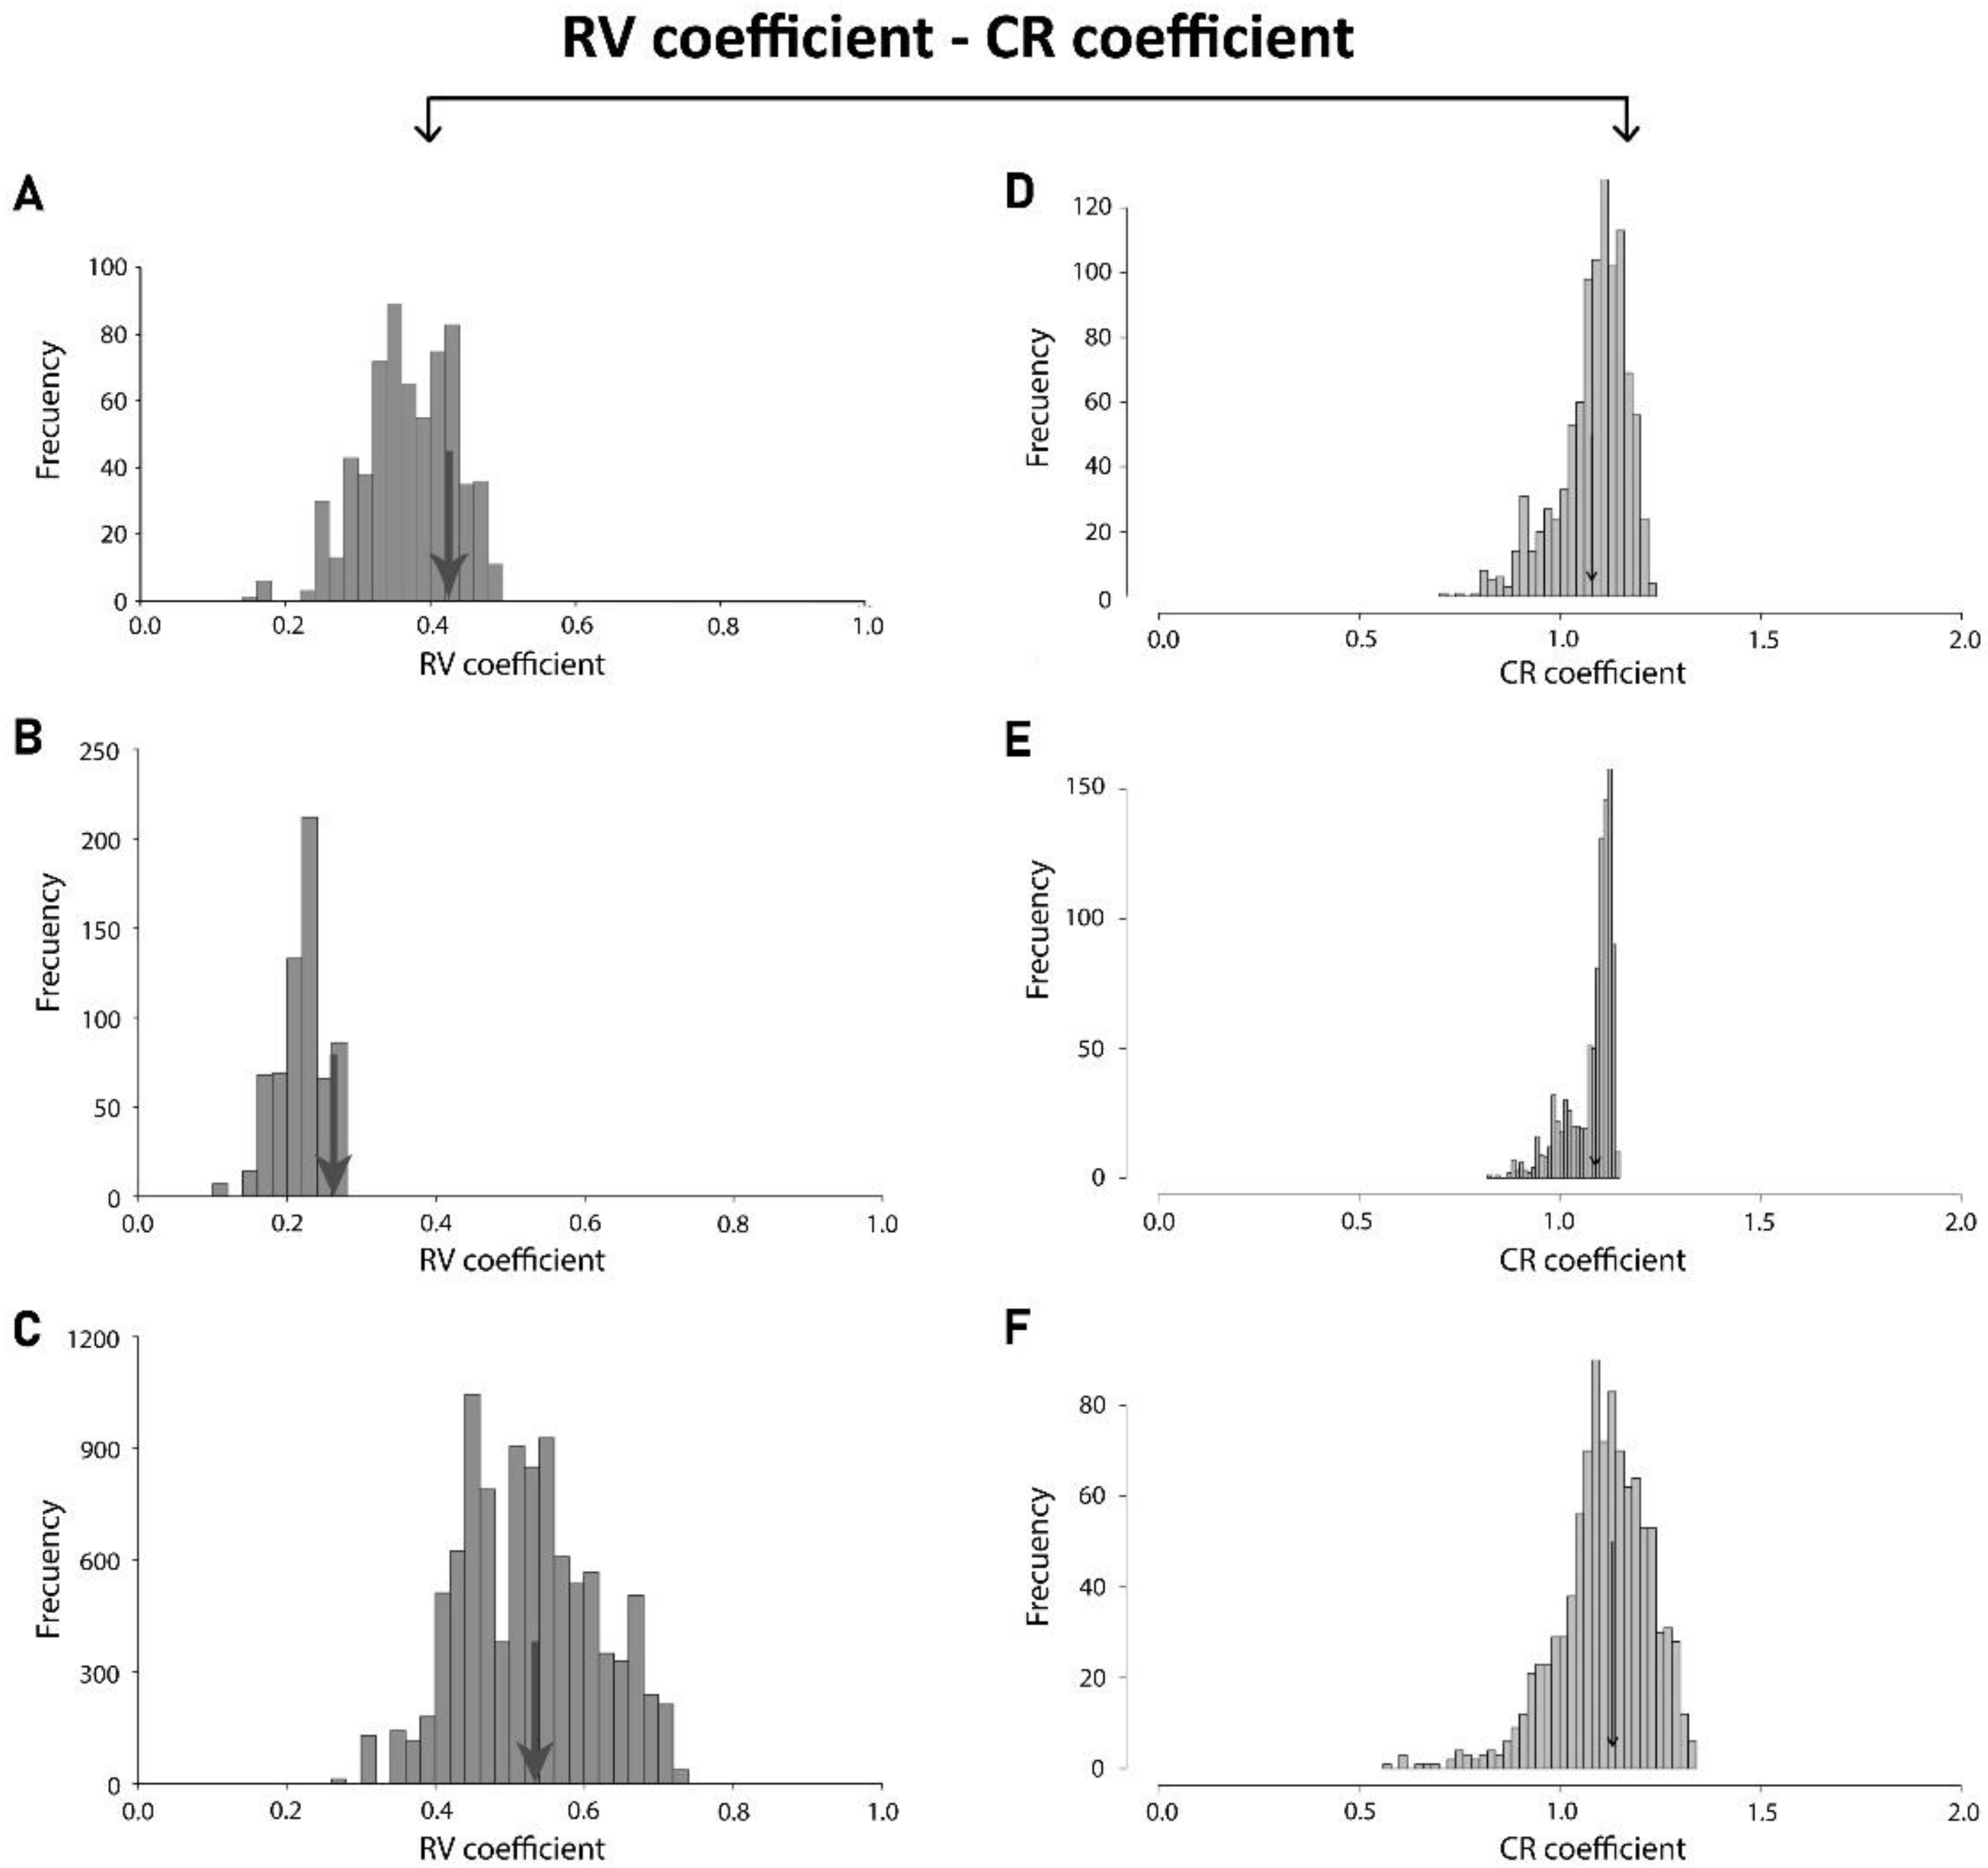
2.6. Modularity
2.7. Allometry
2.8. Comparison within Levels
3. Results
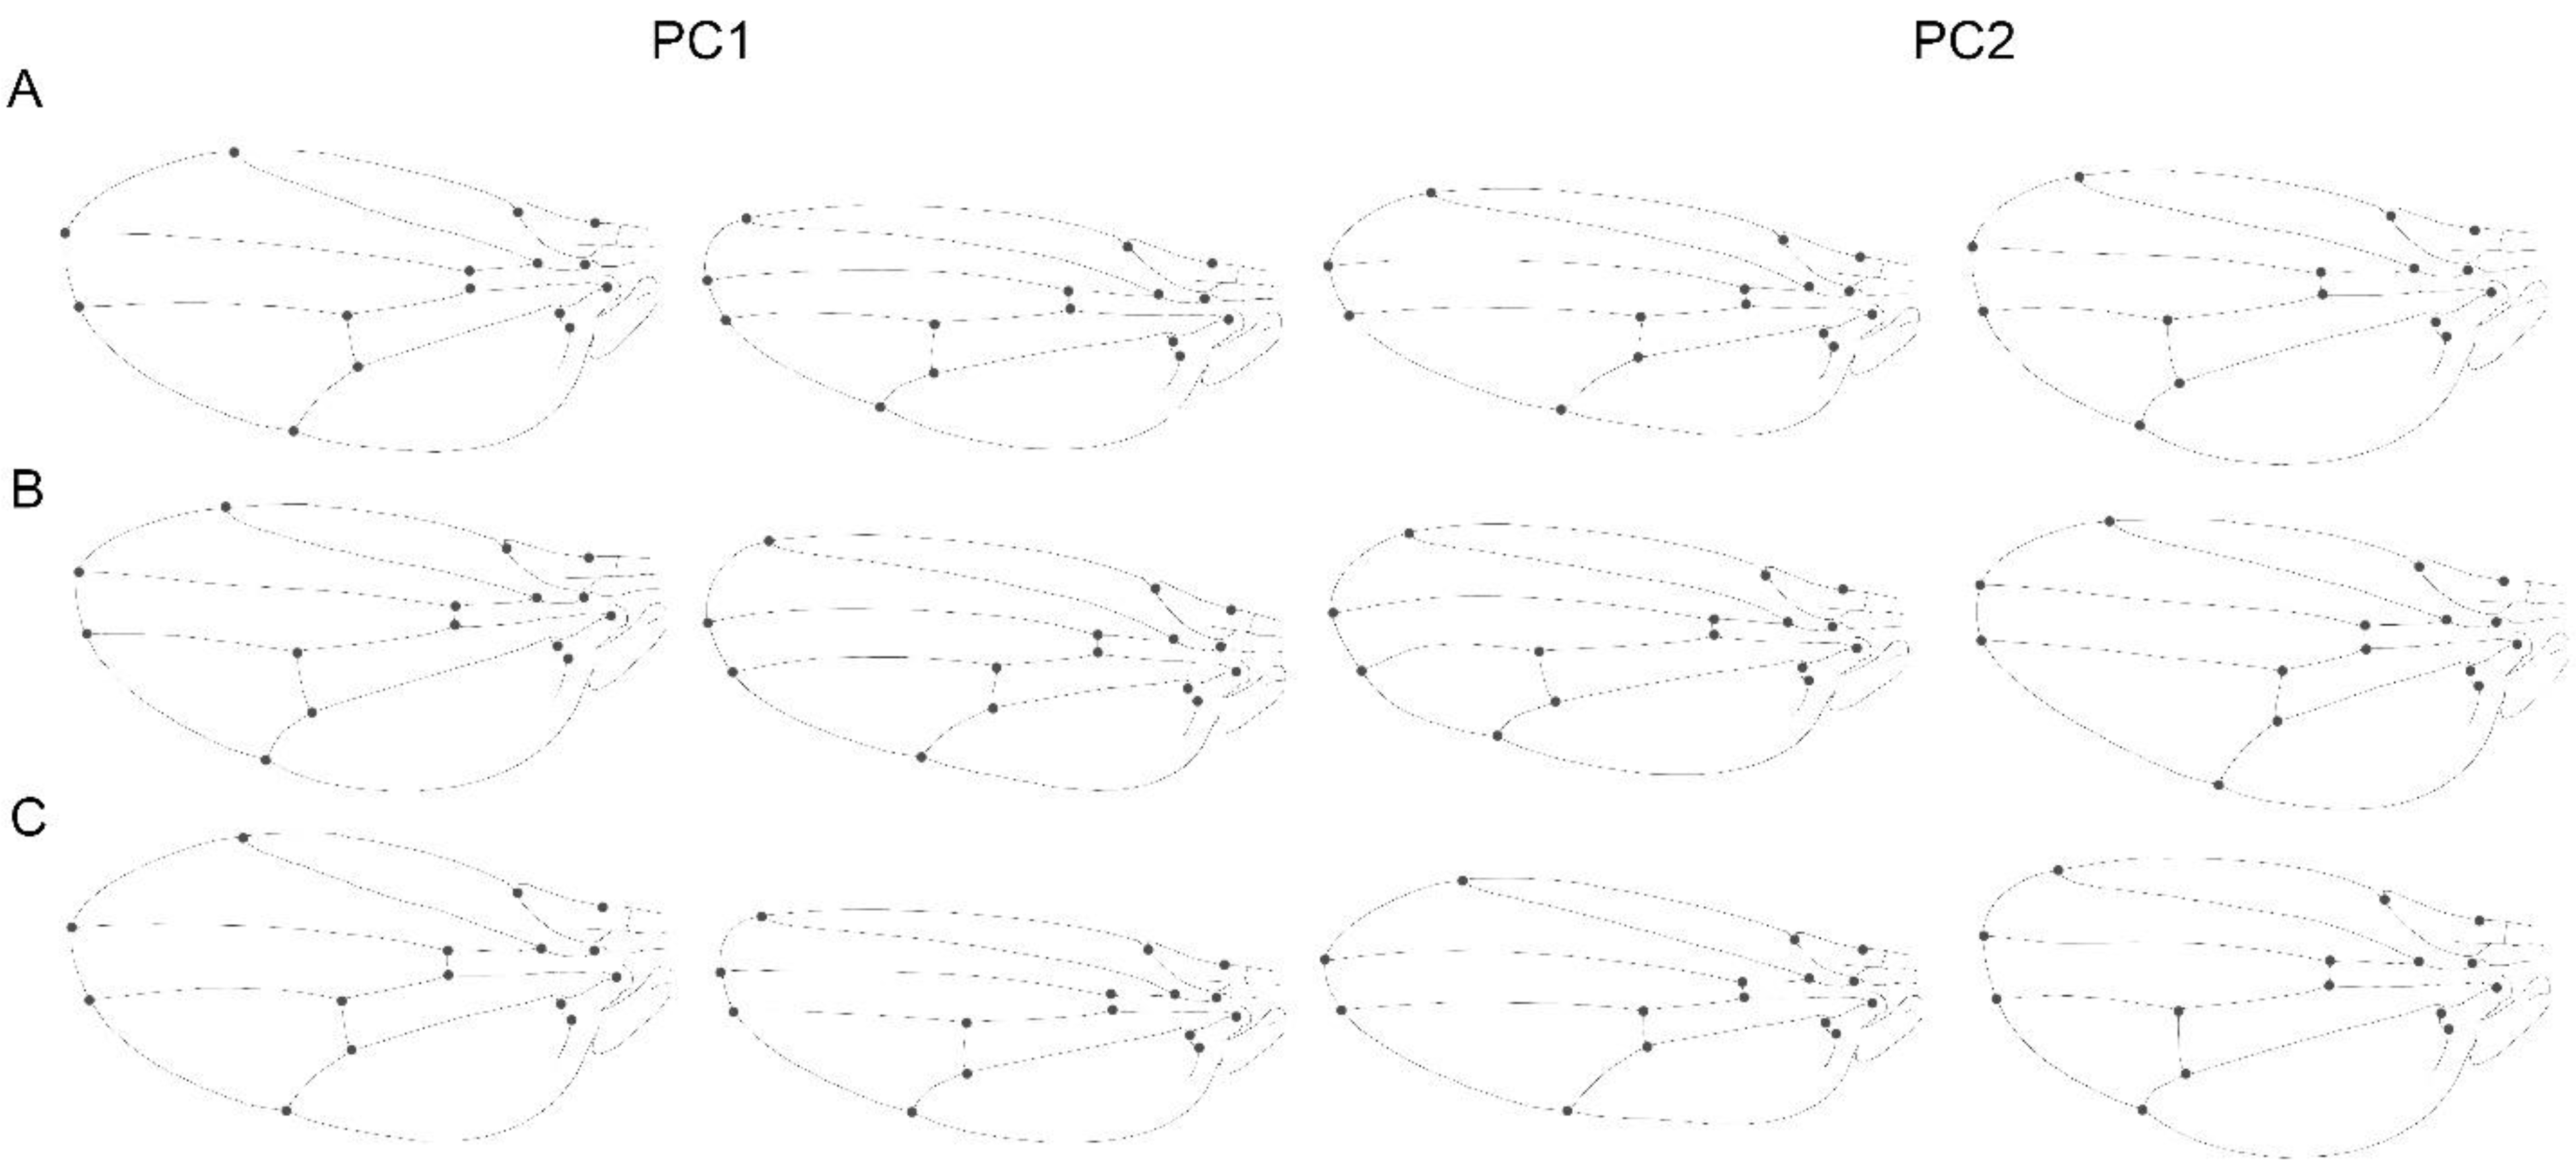
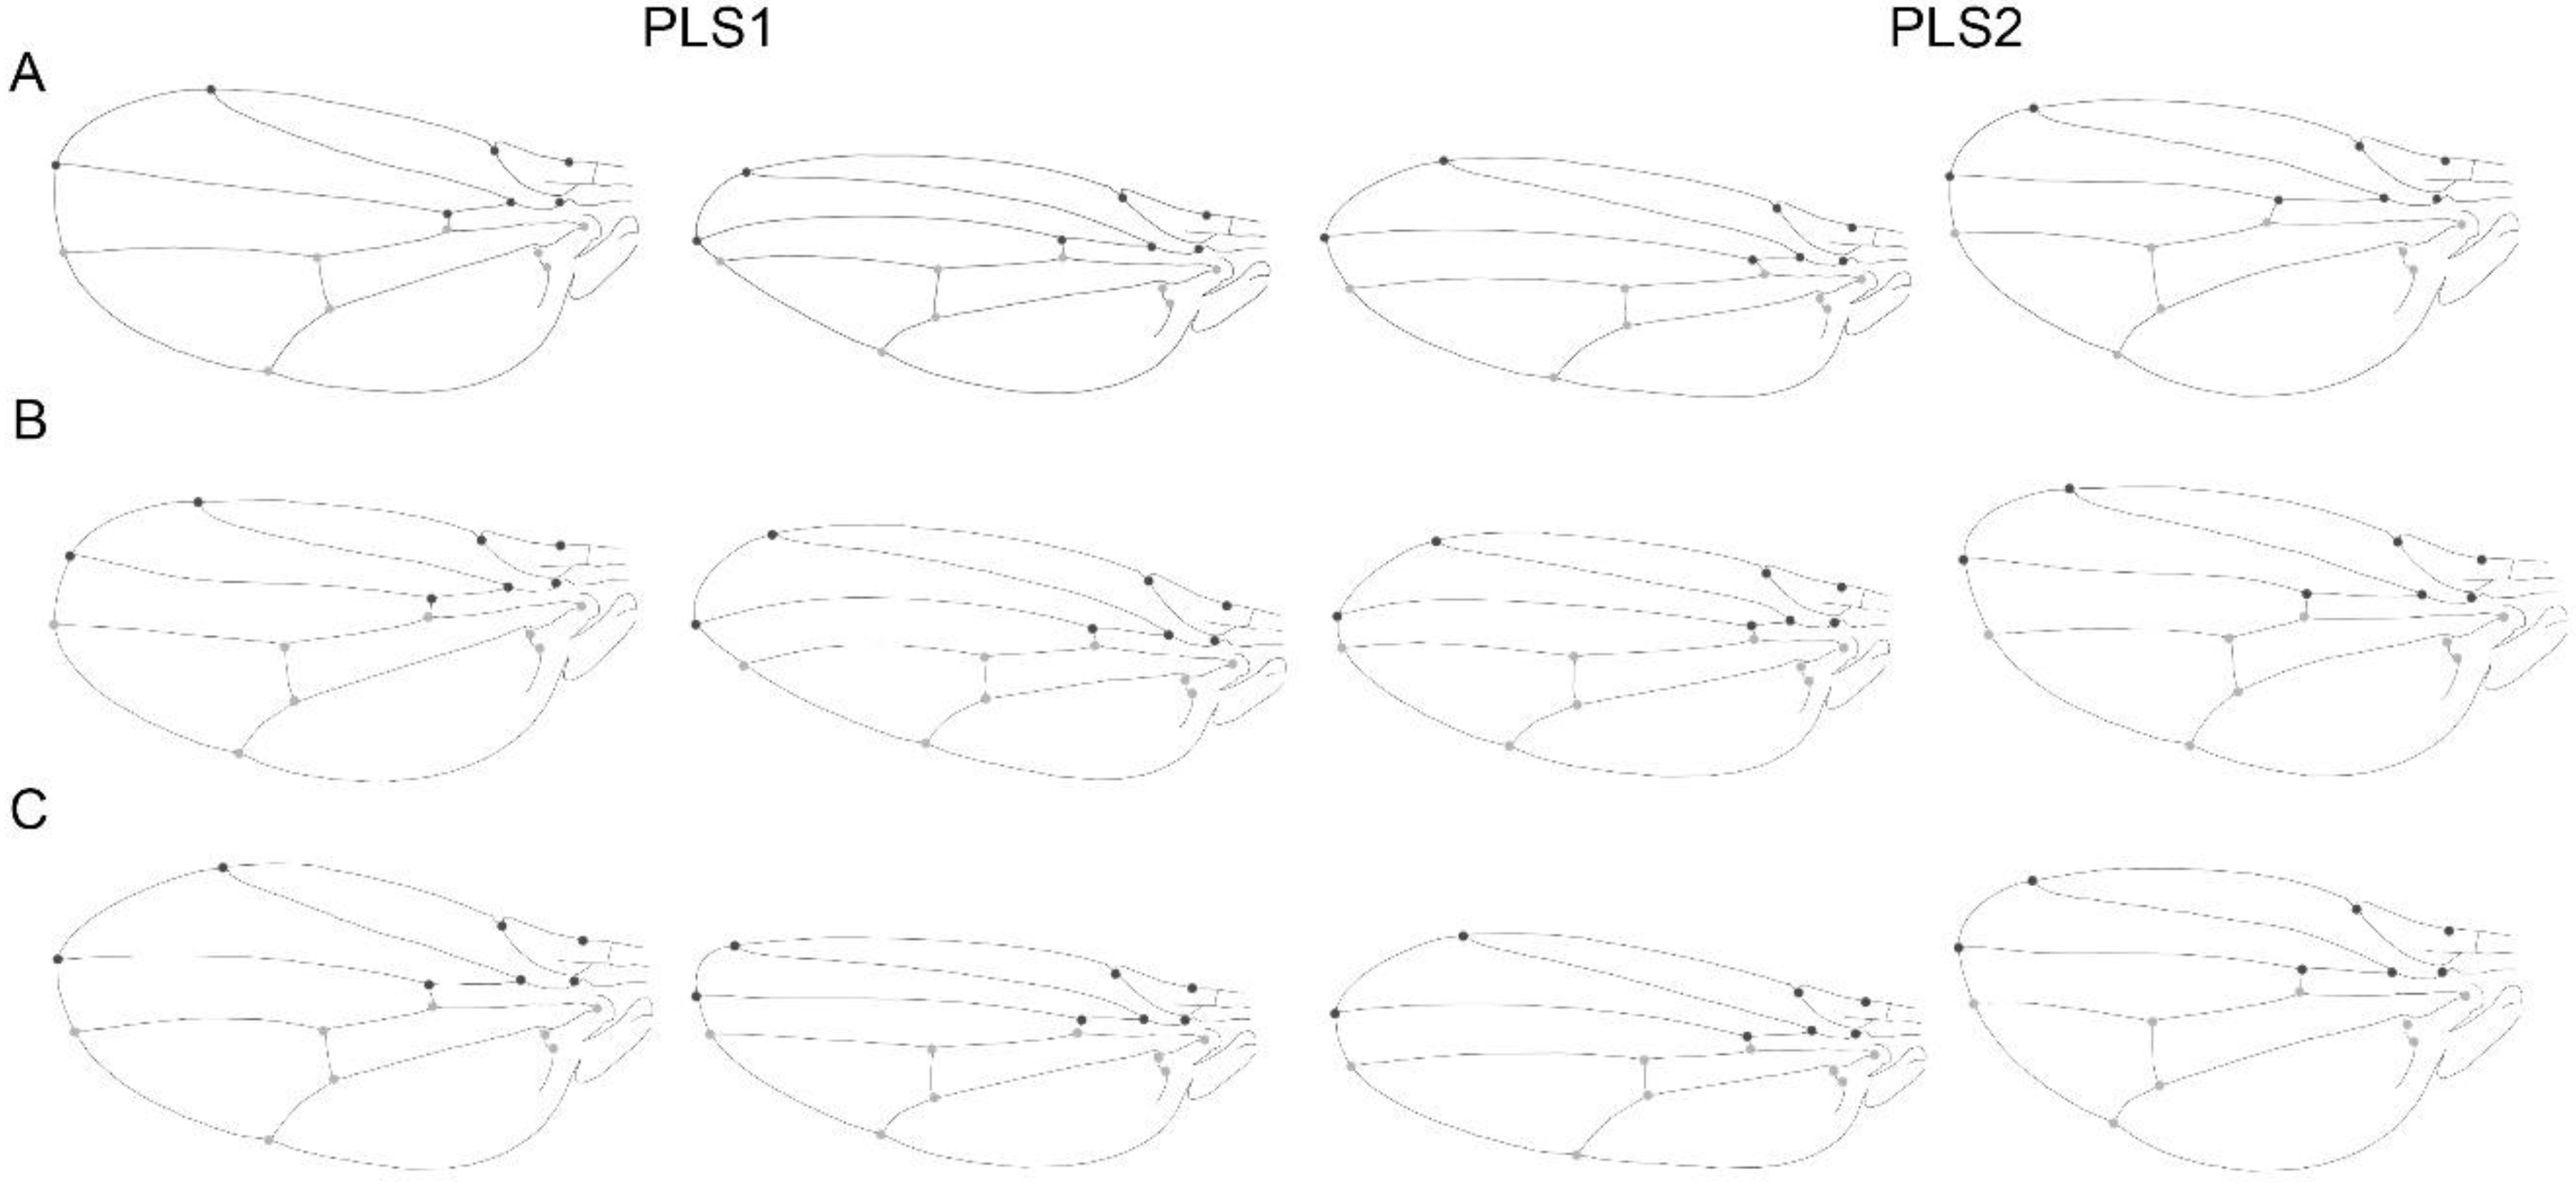
3.1. Static Level
3.2. Developmental Level
3.3. Evolutionary Level
3.4. Comparison within Levels
4. Discussion
Supplementary Materials
Author Contributions
Funding
Institutional Review Board Statement
Informed Consent Statement
Data Availability Statement
Acknowledgments
Conflicts of Interest
References
- Wagner, G.P.; Altenberg, L. Perspective: Complex Adaptations and the Evolution of Evolvability. Evolution 1996, 50, 967–976. [Google Scholar] [CrossRef] [PubMed]
- Hallgrímsson, B.; Jamniczky, H.; Young, N.M.; Rolian, C.; Parsons, T.E.; Boughner, J.C.; Marcucio, R.S. Deciphering the Palimpsest: Studying the Relationship Between Morphological Integration and Phenotypic Covariation. Evol. Biol. 2009, 36, 355–376. [Google Scholar] [CrossRef] [Green Version]
- Klingenberg, C.P. Morphological Integration and Developmental Modularity. Annu. Rev. Ecol. Evol. Syst. 2008, 39, 115–132. [Google Scholar] [CrossRef] [Green Version]
- Klingenberg, C.P. Studying morphological integration and modularity at multiple levels: Concepts and analysis. Philos. Trans. R. Soc. B Biol. Sci. 2014, 369, 20130249. [Google Scholar] [CrossRef] [PubMed]
- Goswami, A.; Smaers, J.; Soligo, C.; Polly, P.D. The macroevolutionary consequences of phenotypic integration: From development to deep time. Philos. Trans. R. Soc. B Biol. Sci. 2014, 369, 20130254. [Google Scholar] [CrossRef] [Green Version]
- Goswami, A. Cranial Modularity Shifts during Mammalian Evolution. Am. Nat. 2006, 168, 270–280. [Google Scholar] [CrossRef]
- Klingenberg, C.; Zaklan, S.D. Morphological integration between developmental compartments in the Drosophila wing. Evolution 2000, 54, 1273–1285. [Google Scholar] [CrossRef]
- Mitteroecker, P.; Bookstein, F. The Conceptual and Statistical Relationship between Modularity and Morphological Integration. Syst. Biol. 2007, 56, 818–836. [Google Scholar] [CrossRef]
- Zelditch, M.L.; Goswami, A. What does modularity mean? Evol. Dev. 2021, 23, 377–403. [Google Scholar] [CrossRef]
- Adams, D.C. Evaluating modularity in morphometric data: Challenges with the RV coefficient and a new test measure. Methods Ecol. Evol. 2016, 7, 565–572. [Google Scholar] [CrossRef] [Green Version]
- Villalobos-Leiva, A.; Benítez, H.A. Morfometría Geométrica y sus Nuevas Aplicaciones en Ecología y Biología Evolutiva. Parte 2. Int. J. Morphol. 2020, 38, 1818–1836. [Google Scholar] [CrossRef]
- Mitteroecker, P.; Bookstein, F. The evolutionary role of modularity and integration in the hominoid cranium. Evolution 2008, 62, 943–958. [Google Scholar] [CrossRef] [PubMed]
- Goswami, A. Morphological integration in the carnivoran skull. Evolution 2006, 60, 169–183. [Google Scholar] [CrossRef] [PubMed]
- Rohlf, F.J.; Marcus, L.F. A revolution in morphometrics. Trends Ecol. Evol. 1993, 8, 129–132. [Google Scholar] [CrossRef]
- Adams, D.C.; Rohlf, F.J.; Slice, D.E. A field comes of age: Geometric morphometrics in the 21st century. Hystrix-Ital. J. Mammal. 2013, 24, 7–14. [Google Scholar] [CrossRef]
- Benítez, H.A.; Püschel, T.A. Modelando la Varianza de la Forma: Morfometría Geométrica Aplicaciones en Biología Evolutiva. Int. J. Morphol. 2014, 32, 998–1008. [Google Scholar] [CrossRef] [Green Version]
- Cheverud, J.M. Relationships among ontogenetic, static, and evolutionary allometry. Am. J. Phys. Anthr. 1982, 59, 139–149. [Google Scholar] [CrossRef]
- Cheverud, J.M. Developmental Integration and the Evolution of Pleiotropy. Am. Zool. 1996, 36, 44–50. [Google Scholar] [CrossRef]
- Marroig, G.; Cheverud, J.M. A comparison of phenotypic variation and covariation patterns and the role of phylogeny, ecology, and ontogeny during cranial evolution of new world monkeys. Evolution 2001, 55, 2576–2600. [Google Scholar] [CrossRef]
- Gonzalez-Jose, R.; Van Der Molen, S.; González-Pérez, E.; Hernández, M. Patterns of phenotypic covariation and correlation in modern humans as viewed from morphological integration. Am. J. Phys. Anthr. 2004, 123, 69–77. [Google Scholar] [CrossRef]
- Drake, A.G.; Klingenberg, C. Large-Scale Diversification of Skull Shape in Domestic Dogs: Disparity and Modularity. Am. Nat. 2010, 175, 289–301. [Google Scholar] [CrossRef] [PubMed] [Green Version]
- Benítez, H.A.; Lemic, D.; Bažok, R.; Bravi, R.; Buketa, M.; Püschel, T. Morphological integration and modularity in Diabrotica virgifera virgifera LeConte (Coleoptera: Chrysomelidae) hind wings. Zool. Anz. J. Comp. Zool. 2014, 253, 461–468. [Google Scholar] [CrossRef]
- Martínez-Abadías, N.; Esparza, M.; Sjøvold, T.; González-José, R.; Santos, M.; Hernández, M.; Klingenberg, C.P. Pervasive genetic integration directs the evolution of human skull shape. Evolution 2012, 66, 1010–1023. [Google Scholar] [CrossRef] [PubMed]
- Klingenberg, C.P.; Marugan-Lobon, J.C. Evolutionary Covariation in Geometric Morphometric Data: Analyzing Integration, Modularity, and Allometry in a Phylogenetic Context. Syst. Biol. 2013, 62, 591–610. [Google Scholar] [CrossRef] [PubMed]
- Cheverud, J.M. Phenotypic, Genetic, and Environmental Morphological Integration in the Cranium. Evolution 1982, 36, 499–516. [Google Scholar] [CrossRef]
- Zeng, Z.B. Long-term correlated response, interpopulation covariation, and interspecific allometry. Evolution 1988, 42, 363–374. [Google Scholar] [CrossRef] [Green Version]
- Houle, D.; Bolstad, G.H.; Van Der Linde, K.; Hansen, T.F. Mutation predicts 40 million years of fly wing evolution. Nature 2017, 548, 447–450. [Google Scholar] [CrossRef]
- Klingenberg, C.P. Morphometric integration and modularity in configurations of landmarks: Tools for evaluating a priori hypotheses. Evol. Dev. 2009, 11, 405–421. [Google Scholar] [CrossRef] [Green Version]
- Gidaszewski, N.A.; Baylac, M.; Klingenberg, C.P. Evolution of sexual dimorphism of wing shape in the Drosophila melanogaster subgroup. BMC Evol. Biol. 2009, 9, 110–111. [Google Scholar] [CrossRef] [Green Version]
- Klingenberg, C.P.; McIntyre, G.S. Geometric Morphometrics of Developmental Instability: Analyzing Patterns of Fluctuating Asymmetry with Procrustes Methods. Evolution 1998, 52, 1363–1375. [Google Scholar] [CrossRef]
- Russo, C.A.M.; Mello, B.; Frazão, A.; Voloch, C.M. Phylogenetic analysis and a time tree for a large drosophilid data set (Diptera: Drosophilidae). Zool. J. Linn. Soc. 2013, 169, 765–775. [Google Scholar] [CrossRef]
- van der Linde, K.; Houle, D.; Spicer, G.S.; Steppan, S.J. A supermatrix-based molecular phylogeny of the family Drosophilidae. Genet. Res. 2010, 92, 25–38. [Google Scholar] [CrossRef] [PubMed] [Green Version]
- Maddison, W.; Maddison, D. Mesquite: A Modular System for Evolutionary Analysis, V. 3.61. 2019. Available online: http://mesquiteproject.org (accessed on 13 April 2015).
- Sidlauskas, B. Continuous and arrested morphological diversification in sister clades of characiform fishes: a phylomorphospace approach. Evolution 2008, 62, 3135–3156. [Google Scholar] [CrossRef] [PubMed]
- Felsenstein, J. Phylogenies and the Comparative Method. Am. Nat. 1985, 125, 1–15. [Google Scholar] [CrossRef]
- Klingenberg, C.P. MorphoJ: An integrated software package for geometric morphometrics. Mol. Ecol. Resour. 2011, 11, 353–357. [Google Scholar] [CrossRef] [PubMed]
- Bookstein, F.L. Morphometric Tools for Landmark Data: Geometry and Biology; Cambridge University Press: Cambridge, UK, 1991. [Google Scholar]
- Rohlf, F.J.; Corti, M. Use of Two-Block Partial Least-Squares to Study Covariation in Shape. Syst. Biol. 2000, 49, 740–753. [Google Scholar] [CrossRef] [Green Version]
- Jolliffe, I.T. Principal Component Analysis, 2nd ed.; Springer: New York, NY, USA, 2002. [Google Scholar]
- Gómez, J.M.; Perfectti, F.; Klingenberg, C.P. The role of pollinator diversity in the evolution of corolla-shape integration in a pollination-generalist plant clade. Philos. Trans. R. Soc. B Biol. Sci. 2014, 369, 20130257. [Google Scholar] [CrossRef] [Green Version]
- Corti, M.; Aguilera, M.; Capanna, E. Size and shape changes in the skull accompanying speciation of South American spiny rats (Rodentia: Proechimys spp.). J. Zool. 2001, 253, 537–547. [Google Scholar] [CrossRef]
- Baken, E.K.; Collyer, M.L.; Kaliontzopoulou, A.; Adams, D.C. Geomorph v4.0 and gmShiny: Enhanced analytics and a new graphical interface for a comprehensive morphometric experience. Methods Ecol. Evol. 2021, 12, 2355–2363. [Google Scholar] [CrossRef]
- Debat, V.; Béagin, M.; Legout, H.; David, J.R. Allometric and nonallometric components of drosophila wing shape respond differently to developmental temperature. Evolution 2003, 57, 2773–2784. [Google Scholar] [CrossRef]
- Monteiro, L.R. Multivariate Regression Models and Geometric Morphometrics: The Search for Causal Factors in the Analysis of Shape. Syst. Biol. 1999, 48, 192–199. [Google Scholar] [CrossRef] [PubMed] [Green Version]
- Figueirido, B.; Serrano-Alarcón, F.; Slater, G.; Palmqvist, P. Shape at the cross-roads: Homoplasy and history in the evolution of the carnivoran skull towards herbivory. J. Evol. Biol. 2010, 23, 2579–2594. [Google Scholar] [CrossRef] [PubMed]
- Gilchrist, A.S.; Azevedo, R.B.R.; Partridge, L.; O’Higgins, P. Adaptation and constraint in the evolution of Drosophila melanogaster wing shape. Evol. Dev. 2000, 2, 114–124. [Google Scholar] [CrossRef] [PubMed]
- Sztepanacz, J.L.; Houle, D. Allometry constrains the evolution of sexual dimorphism in Drosophila across 33 million years of divergence. Evolution 2021, 75, 1117–1131. [Google Scholar] [CrossRef]
- Palsson, A.; Gibson, G. Quantitative developmental genetic analysis reveals that the ancestral dipteran wing vein prepattern is conserved in Drosophila melanogaster. Dev. Genes Evol. 2000, 210, 617–622. [Google Scholar] [CrossRef]
- Breuker, C.J.; Patterson, J.S.; Klingenberg, C.P. A Single Basis for Developmental Buffering of Drosophila Wing Shape. PLoS ONE 2006, 1, e7. [Google Scholar] [CrossRef]
- Houle, D.; Mezey, J.; Galpern, P.; Carter, A. Automated measurement of Drosophila wings. BMC Evol. Biol. 2003, 3, 25. [Google Scholar] [CrossRef] [Green Version]
- Sztepanacz, J.L.; Houle, D. Cross-sex genetic covariances limit the evolvability of wing-shape within and among species of Drosophila. Evolution 2019, 73, 1617–1633. [Google Scholar] [CrossRef]
- Soto, I.M.; Carreira, V.P.; Soto, E.M.; Hasson, E. Wing morphology and fluctuating asymmetry depend on the host plant in cactophilic Drosophila. J. Evol. Biol. 2008, 21, 598–609. [Google Scholar] [CrossRef]
- Klingenberg, C.P.; Gidaszewski, N.A. Testing and Quantifying Phylogenetic Signals and Homoplasy in Morphometric Data. Syst. Biol. 2010, 59, 245–261. [Google Scholar] [CrossRef] [Green Version]
- Hansen, T.F.; Houle, D. Evolvability, stabilizing selection, and the problem of stasis. In Phenotypic Integration: Studying the Ecology and Evolution of Complex Phenotypes; Oxford University Press: Oxford, UK, 2004; pp. 130–150. [Google Scholar]
- Klingenberg, C.P.; Badyaev, A.V.; Sowry, S.M.; Beckwith, N.J. Inferring Developmental Modularity from Morphological Integration: Analysis of Individual Variation and Asymmetry in Bumblebee Wings. Am. Nat. 2001, 157, 11–23. [Google Scholar] [CrossRef] [PubMed]
- Monteiro, L.R.; Bonato, V.; dos Reis, S.F. Evolutionary integration and morphological diversification in complex morphological structures: Mandible shape divergence in spiny rats (Rodentia, Echimyidae). Evol. Dev. 2005, 7, 429–439. [Google Scholar] [CrossRef] [PubMed]
- Bardua, C.; Wilkinson, M.; Gower, D.J.; Sherratt, E.; Goswami, A. Morphological evolution and modularity of the caecilian skull. BMC Evol. Biol. 2019, 19, 30. [Google Scholar] [CrossRef] [PubMed]
- Watanabe, A.; Fabre, A.-C.; Felice, R.N.; Maisano, J.A.; Müller, J.; Herrel, A.; Goswami, A. Ecomorphological diversification in squamates from conserved pattern of cranial integration. Proc. Natl. Acad. Sci. USA 2019, 116, 14688–14697. [Google Scholar] [CrossRef] [Green Version]
- Cavicchi, S.; Giorgi, G.; Natali, V.; Guerra, D. Temperature-related divergence in experimental populations of Drosophila melanogaster. III. Fourier and centroid analysis of wing shape and relationship between shape variation and fitness. J. Evol. Biol. 1991, 4, 141–159. [Google Scholar] [CrossRef]
- Pezzoli, M.C.; Guerra, D.; Giorgi, G.; Garoia, F.; Cavicchi, S. Developmental constraints and wing shape variation in natural populations of Drosophila melanogaster. Heredity 1997, 79, 572–577. [Google Scholar] [CrossRef]
- Thompson, J.N.; Woodruff, R.C. Polygenic analysis of pattern formation: Interdependence among veins in the same compartment of the Drosophila wing. Genetica 1982, 60, 71–76. [Google Scholar] [CrossRef]
- Cavicchi, S.; Pezzoli, C.; Giorgi, G. Correlation between characters as related to developmental pattern in Drosophila. Genetica 1981, 56, 189–195. [Google Scholar] [CrossRef]
- Espinoza-Donoso, S.; Angulo-Bedoya, M.; Lemic, D.; Benítez, H.A. Assessing the influence of allometry on sexual and non-sexual traits: An example in Cicindelidia trifasciata (Coleoptera: Cicindelinae) using geometric morphometrics. Zool. Anz. J. Comp. Zool. 2020, 287, 61–66. [Google Scholar] [CrossRef]
- Lemic, D.; Benítez, H.A.; Bažok, R. Intercontinental effect on sexual shape dimorphism and allometric relationships in the beetle pest Diabrotica virgifera virgifera LeConte (Coleoptera: Chrysomelidae). Zool. Anz. J. Comp. Zool. 2014, 253, 203–206. [Google Scholar] [CrossRef]
- Benítez, H.A.; Bravi, R.; Parra, L.E.; Sanzana, M.-J.; Sepulveda-Zuniga, E. Allometric and non-allometric patterns in sexual dimorphism discrimination of wing shape in Ophion intricatus: Might two male morphotypes coexist? J. Insect Sci. 2013, 13, 143. [Google Scholar] [CrossRef] [PubMed] [Green Version]
- Adams, D.C.; Funk, D.J. Morphometric Inferences on Sibling Species and Sexual Dimorphism in Neochlamisus bebbianae Leaf Beetles: Multivariate Applications of the Thin-Plate Spline. Syst. Biol. 1997, 46, 180–194. [Google Scholar] [CrossRef]
- Hallgrímsson, B.; Katz, D.C.; Aponte, J.D.; Larson, J.R.; Devine, J.; Gonzalez, P.N.; Young, N.M.; Roseman, C.C.; Marcucio, R.S. Integration and the Developmental Genetics of Allometry. Integr. Comp. Biol. 2019, 59, 1369–1381. [Google Scholar] [CrossRef] [PubMed]
- Klingenberg, C.P. Size, shape, and form: Concepts of allometry in geometric morphometrics. Dev. Genes Evol. 2016, 226, 113–137. [Google Scholar] [CrossRef]
- Klingenberg, C.P.; Mebus, K.; Auffray, J.-C. Developmental integration in a complex morphological structure: How distinct are the modules in the mouse mandible? Evol. Dev. 2003, 5, 522–531. [Google Scholar] [CrossRef]
- Young, R.L.; Badyaev, A.V. Evolutionary persistence of phenotypic integration: influence of developmental and functional relationships on complex trait evolution. Evolution 2006, 60, 1291–1299. [Google Scholar] [CrossRef]
- Zelditch, M.L.; Wood, A.R.; Swiderski, D.L. Building Developmental Integration into Functional Systems: Function-Induced Integration of Mandibular Shape. Evol. Biol. 2009, 36, 71–87. [Google Scholar] [CrossRef]
- Jamniczky, H.A.; Hallgrímsson, B. Modularity in the skull and cranial vasculature of laboratory mice: Implications for the evolution of complex phenotypes. Evol. Dev. 2011, 13, 28–37. [Google Scholar] [CrossRef]
- Jojić, V.; Blagojević, J.; Vujošević, M. Two-module organization of the mandible in the yellow-necked mouse: A comparison between two different morphometric approaches. J. Evol. Biol. 2012, 25, 2489–2500. [Google Scholar] [CrossRef] [Green Version]
- Klingenberg, C.P.; Duttke, S.; Whelan, S.; Kim, M. Developmental plasticity, morphological variation and evolvability: A multilevel analysis of morphometric integration in the shape of compound leaves. J. Evol. Biol. 2012, 25, 115–129. [Google Scholar] [CrossRef]
- Sherratt, E.; Gower, D.J.; Klingenberg, C.; Wilkinson, M. Evolution of Cranial Shape in Caecilians (Amphibia: Gymnophiona). Evol. Biol. 2014, 41, 528–545. [Google Scholar] [CrossRef]
- Debat, V.; Alibert, P.; David, P.; Paradis, E.; Auffray, J.-C. Independence between developmental stability and canalization in the skull of the house mouse. Proc. R. Soc. B Boil. Sci. 2000, 267, 423–430. [Google Scholar] [CrossRef] [PubMed] [Green Version]
- Willmore, K.E.; Leamy, L.; Hallgrímsson, B. Effects of developmental and functional interactions on mouse cranial variability through late ontogeny. Evol. Dev. 2006, 8, 550–567. [Google Scholar] [CrossRef]
- Ivanović, A.; Kalezić, M.L. Testing the hypothesis of morphological integration on a skull of a vertebrate with a biphasic life cycle: A case study of the alpine newt. J. Exp. Zool. Part B Mol. Dev. Evol. 2010, 314B, 527–538. [Google Scholar] [CrossRef] [PubMed]
- Jojić, V.; Blagojević, J.; Vujošević, M. B chromosomes and cranial variability in yellow-necked field mice (Apodemus flavicollis). J. Mammal. 2011, 92, 396–406. [Google Scholar] [CrossRef] [Green Version]
- Sanger, T.J.; Mahler, D.L.; Abzhanov, A.; Losos, J.B. Roles for modularity and constraint in the evolution of cranial diversity amonganolislizards. Evolution 2012, 66, 1525–1542. [Google Scholar] [CrossRef]


| Centroid Size | |||||||
|---|---|---|---|---|---|---|---|
| Effect | SS | MS | df | F | p | Pillai tr. | p (param) |
| Individual | 11.478684 | 0.604141 | 19 | 1466.1 | <0.0001 | ||
| Side | 0.001664 | 0.001664 | 1 | 4.04 | 0.0589 | ||
| Ind × Side | 0.007829 | 0.000412 | 19 | 3.07 | 0.0014 | ||
| Error 1 | 0.005366 | 0.000134 | 40 | ||||
| Shape | |||||||
| Effect | |||||||
| Individual | 0.1654094 | 3.35 × 10⁻⁴ | 494 | 52.68 | <0.0001 | ||
| Side | 0.0001051 | 4.04 × 10⁻⁶ | 26 | 0.64 | 0.919 | ||
| Ind × Side | 0.0031397 | 6.36 × 10⁻⁶ | 494 | 9.67 | <0.0001 | 13.14 | <0.0001 |
| Error 1 | 0.0006835 | 6.57 × 10⁻⁷ | 1040 |
| Eigenvalues | % Total Variance | ||||||
|---|---|---|---|---|---|---|---|
| Level of Integation | PC1 | PC2 | PC3 | PC1 | PC2 | PC3 | Cumulative |
| Static | 0.00004798 | 0.00003807 | 0.00002962 | 21.103 | 16.744 | 13.025 | 50.872 |
| Developmental | 0.00002477 | 0.00001866 | 0.00001616 | 15.019 | 11.312 | 9.801 | 36.132 |
| Evolutionary | 0.00023655 | 0.00010357 | 0.00006316 | 41.987 | 18.383 | 11.21 | 71.58 |
| Static (A) | 0.00003817 | 0.00003626 | 0.00002842 | 17.94 | 17.043 | 13.356 | 48.339 |
| Developmental (A) | 0.00002467 | 0.00001808 | 0.00001603 | 15.09 | 11.055 | 9.808 | 35.953 |
| Evolutionary (A) | 0.00020041 | 0.00009249 | 0.00005925 | 39.558 | 18.256 | 11.695 | 69.509 |
| Static Integration | Angular Value |
|---|---|
| PC1-PLS1 | 16.675° |
| PC2-PLS2 | 29.974° |
| PC3-PLS3 | 28.923° |
| Developmental Integration | |
| PC1-PLS1 | 19.868° |
| PC2-PLS2 | 61.799° |
| PC3-PLS3 | 66.981° |
| Evolutionary Integration | |
| PC1-PLS1 | 7.297° |
| PC2-PLS2 | 17.697° |
| PC3-PLS3 | 27.616° |
| Matrix Correlation/p-Value | Developmental Integration | Evolutionary Integration |
|---|---|---|
| Static Integration | 0.95038357 | 0.85631863 |
| Developmental Integration | - | 0.74279388 |
| Matrix Correlation/p-Value | Developmental Integration | Evolutionary Integration |
| Static Integration | <0.0001 | <0.0001 |
| Developmental Integration | - | <0.0001 |
Publisher’s Note: MDPI stays neutral with regard to jurisdictional claims in published maps and institutional affiliations. |
© 2022 by the authors. Licensee MDPI, Basel, Switzerland. This article is an open access article distributed under the terms and conditions of the Creative Commons Attribution (CC BY) license (https://creativecommons.org/licenses/by/4.0/).
Share and Cite
Benítez, H.A.; Püschel, T.A.; Suazo, M.J. Drosophila Wing Integration and Modularity: A Multi-Level Approach to Understand the History of Morphological Structures. Biology 2022, 11, 567. https://doi.org/10.3390/biology11040567
Benítez HA, Püschel TA, Suazo MJ. Drosophila Wing Integration and Modularity: A Multi-Level Approach to Understand the History of Morphological Structures. Biology. 2022; 11(4):567. https://doi.org/10.3390/biology11040567
Chicago/Turabian StyleBenítez, Hugo A., Thomas A. Püschel, and Manuel J. Suazo. 2022. "Drosophila Wing Integration and Modularity: A Multi-Level Approach to Understand the History of Morphological Structures" Biology 11, no. 4: 567. https://doi.org/10.3390/biology11040567
APA StyleBenítez, H. A., Püschel, T. A., & Suazo, M. J. (2022). Drosophila Wing Integration and Modularity: A Multi-Level Approach to Understand the History of Morphological Structures. Biology, 11(4), 567. https://doi.org/10.3390/biology11040567