Article

Toxicity and Starvation Induce Major Trophic Isotope Variation in Daphnia Individuals: A Diet Switch Experiment Using Eight Phytoplankton Species of Differing Nutritional Quality

by
Michelle Helmer
1,*,†,
Desiree Helmer
1,†,
Dominik Martin-Creuzburg
2,
Karl-Otto Rothhaupt
1 and
Elizabeth Yohannes
1
1
Limnological Institute, University of Konstanz, Mainaustrasse 252, 78464 Konstanz, Germany
2
Research Station Bad Saarow, Department of Aquatic Ecology, BTU Cottbus-Senftenberg, Seestrasse 45, 15526 Bad Saarow, Germany
*
Author to whom correspondence should be addressed.
These authors contributed equally to this work and share first authorship.
Biology 2022, 11(12), 1816; https://doi.org/10.3390/biology11121816
Submission received: 6 November 2022 / Revised: 1 December 2022 / Accepted: 10 December 2022 / Published: 14 December 2022
(This article belongs to the Special Issue Applications of Stable Isotope Analysis in Ecology)

Abstract

:

Simple Summary

The estimates of animal diets and trophic structures using stable isotope analyses are highly influenced by the diet–tissue discrimination and tissue turnover rates. However, these factors are often unknown because they must be measured using controlled feeding studies. Furthermore, these parameters may be influenced by the diet quality, quantity, toxic stress, and starvation or fasting, as well as other factors. We measured the effects of toxic stress, starvation, and diet quality on the turnover rate and diet–tissue discrimination in Daphnia individuals. We raised individuals with a common laboratory diet and switched them to eight different dietary sources with varying levels of nutritional quality, while one group experienced starvation. The isotopic values were assessed on a daily basis post-diet change. Overall, we showed that in addition to the nutritional quality, toxic stress and starvation are the main processes that affect the two key parameters of the stable isotope analysis.

Abstract

Stable isotope values can express resource usage by organisms, but their precise interpretation is predicated using a controlled experiment-based validation process. Here, we develop a stable isotope tracking approach towards exploring resource shifts in a key primary consumer species Daphnia magna. We used a diet switch experiment and model fitting to quantify the stable carbon (δ 13C) and nitrogen (δ 15N) isotope turnover rates and discrimination factors for eight dietary sources of the plankton species that differ in their cellular organization (unicellular or filamentous), pigment and nutrient compositions (sterols and polyunsaturated fatty acids), and secondary metabolite production rates. We also conduct a starvation experiment. We evaluate nine tissue turnover models using Akaike’s information criterion and estimate the repetitive trophic discrimination factors. Using the parameter estimates, we calculate the hourly stable isotope turnover rates. We report an exceedingly faster turnover value following dietary switching (72 to 96 h) and a measurable variation in trophic discrimination factors. The results show that toxic stress and the dietary quantity and quality induce trophic isotope variation in Daphnia individuals. This study provides insight into the physiological processes that underpin stable isotope patterns. We explicitly test multiple alternative dietary sources and fasting and discuss the parameters that are fundamental for field- and laboratory-based stable isotope studies.

1. Introduction

Studies on trophic structures and community dynamics are central towards understanding community ecology [1,2]. Trophic structures are based on food web networks linked by feeding interactions, which ultimately define the ecosystem structure [3]. Thus far, much work on the spatial and temporal dynamic nature of trophic structures has been conducted, and it is now well recognized that trophic variation occurs among and within ecosystems across multiple scales [4]. In an aquatic ecosystem, energy is transferred from the primary consumer level to higher levels, and a balance in these transfers is vital to the health and stability of an ecosystem [5]. However, knowledge gaps remain for most baseline primary consumers, such as Daphnia, which cannot be estimated using evolving technological tracking tools for a more comprehensive, ecosystem-based understanding (such as for those in fish). A stable isotope analysis (SIA) is a useful tool that has rapidly expanded in primary consumer aquatic ecosystem studies. Such studies using SIAs rely on the fact that consumers reflect the isotopic composition of the consumed prey item, which varies with prey ecology, geographic location, and habitat conditions [6]. This fundament has allowed investigations on consumer diets, trophic dynamics, and habitat use with SIAs, most often by applying tissue carbon (δ 13C) and nitrogen (δ 15N).
Understanding isotopic turnover rates in consumer tissues requires the quantification of the temporal scale of diet shifts. For instance, following a shift towards an isotopically varying dietary source (e.g., algae), the δ 13C and δ 15N values of primary consumer tissues (e.g., Daphnia) change over a period of time until arriving at a consistent value (steady-state conditions) that mirrors the new dietary isotope value. The rate of change is driven by the physiological processes of tissue synthesis (e.g., growth) and anabolic and catabolic processes (e.g., fatty acid metabolism, detoxification). Briefly, the isotopic compositions of primary consumer tissues reflect those of the diet.
In recent years, dramatic shifts in global and local environmental conditions have been observed. Such shifts are often driven by climate change, with major impacts on alterations in temperature [7], elevated atmospheric CO2 [8,9], and nutrient availability in ecosystems [10]. Additionally, humans have a direct influence on the ecosystem nutrient dynamics through supplementary feeding and fertilizer application [11,12,13]. In the context of lake productivity, such ongoing changes result in changes in the physico- and bio-chemical properties of lakes, hampering the growth of eukaryotic algae, e.g., Chlorella sp. [14,15] and Scenedesmus [16], but favoring cyanobacteria [17,18,19,20,21,22,23,24]. Some species (e.g., of the genus Microcystis) are directly favored by warmer surface water temperatures coupled to eutrophying nutrient inputs [17,24,25,26,27,28], while others (e.g., Planktothrix rubescens) are associated with stronger thermal stability of the water column, which may generate a rapid shift in the quality or quantity of nutrient sources [29,30,31] in the eutrophic zone. On the other hand, filamentous, diazotrophic cyanobacteria of the genus Dolichospermum are among the most ubiquitous bloom-forming cyanobacteria, and their dominance and persistence have increased due to anthropogenic eutrophication and global climate change [32]. As a result, it is expected that herbivorous zooplankters will be increasingly confronted with unicellular, colony-forming, and filamentous cyanobacteria in the future.
Controlled laboratory-based experiments quantifying primary producer and consumer-specific isotopic turnover and discrimination factors may improve the knowledge on stable isotope dynamics and its direct use towards the field study of stable isotope (SI) ecology.
Stable isotope (SI) turnover rates permit measurements of the temporal scale of the diet through proxy demonstrations of the dietary source represented by the tissue SIA composition. Moreover, the turnover rates can be applied as an ‘isotopic clock’ approach (e.g., Madigan, et al. [33]), using isotopic endmembers, such as diet or aquatic water depth and consumer SIA values, to measure the temporal scale of diet shifts, habitat changes, and movements. Nonetheless, the accuracy of these spatial frames and timeframes are maximized with species-specific isotopic turnover rates and discrimination factors, which are best calculated from laboratory experiments. Cladocerans of the genus Daphnia are key species in many lentic habitats that exhibit a variety of adaptive responses to rapid environmental fluctuations [34] and are representative as baseline organisms in freshwater food webs towards understanding the SIA ecology at the herbivore–grazer interface. However, the lack of experimentally derived isotope turnover parameters and discrimination factors for Daphnia limits the interpretation of SIA data for (a) spatial and temporal patterns in baseline food web and higher trophic-level dynamics and (b) temporal scales of movement patterns within lake columns (e.g., pelagic vs. benthic and pelagic vs. littoral).
The aim of the study was to evaluate whole-body isotopic turnover rates and diet–tissue discrimination factors in individual Daphnia magna. The results of the study (1) could be applied to field-collected SIA data for active, baseline trophic-level studies in freshwater systems and (2) could help to improve predictions of the responses of Daphnia isotopic values towards cyanobacterial dynamics that could develop in times of climate change.

2. Materials and Methods

2.1. Phytoplankton Culturing and Preparation

As stock cultures of Daphnia magna we used the green alga Acutodesmus obliquus (SAG 276-3a) as food, which was cultured in Cyano medium [35] in 5 L batch cultures under permanent illumination (24 h light). The food was harvested in the late-exponential growth period.
We considered a range of different phytoplankton species that are known and expected to be potential dietary sources for herbivorous zooplankters. Specifically, we used eight different algae species (Table 1) for the diet switch experiment. The phytoplankton species differed in their cellular organization (unicellular or filamentous), photopigment and biochemical compositions (sterols and polyunsaturated fatty acids (PUFA)), as well as in the production of secondary metabolites and stable isotopic signatures (Table 2). Each phytoplankton species was cultured semicontinuously in modified Woods Hole (WC) medium without vitamins [36] at 20 °C with illumination at 62 × 1015 mol quanta m−2 s−1 and a light/dark cycle of 16:8. The algae were harvested in the late-exponential growth phase. The carbon concentrations of the different food suspensions were estimated from photometric light extinction (480 nm) and carbon extinction equations determined prior to the experiment.
To determine the stable isotopic signature of each phytoplankton species, samples of each food suspension were taken every day and filtered onto pre-annealed GF/F filters (Whatman™, GE Healthcare Life Science, Chicago, IL, USA) over the whole experimental period (four days). Subsequently, the filters were dried at 50 °C and stored in a desiccator until further analysis.

2.2. Diet Switch Experimental Setup

The diet switch experiment was conducted with third-clutch juveniles (born within <12 h) of D. magna clone S5 (originally isolated in Sheffield). The D. magna samples were kept in glass beakers filled with 1.4 L of filtered lake water (0.2 µm pore-sized membrane filter) at 20 °C and with a light/dark cycle of 18:6, with 20 individuals per beaker. Every other day over a period of seven days, the animals were transferred to new beakers containing freshly prepared food (2 mg C L−1 A. obliquus).
After seven days of growth, all Daphnia samples were subject to a simultaneous diet switch. The animals were transferred to glass beakers filled with 200 mL of filtered lake water containing 2 mg C L−1 each of the different algae. Each treatment consisted of six replicates per time point with five Daphnia samples per beaker. The animals were transferred every day to new beakers with freshly prepared food suspensions for the different treatments.
After 0 h, 24 h, 48 h, 72 h, and 96 h, six beakers (replicates) were subsampled from each treatment. The animals were washed three times with demineralized water, transferred into tin cups, dried for 24 h, weighed on an electronic balance, and stored in a desiccator until further analysis.

2.3. Stable Isotope Analysis

The Daphnia samples were dried and 0.3–0.7 mg was weighted in small tin cups to the nearest 0.0001 mg, using a microanalytical balance (Sartorius 4504MP8). The filters of the algae were also dried and packed (1.5–2 mg) into small tin cups.
The stable isotope analyses were conducted in the stable isotope laboratory of the Limnological Institute, University of Konstanz (Konstanz, Germany). The zooplankton and phytoplankton samples were combusted in a Vario Micro-Cube elemental analyzer (Elementar Analysensysteme GmbH, Hanau, Germany) connected to an isotope ratio mass spectrometer (Isoprime Ltd., Cheadle Hulme, UK) for the determination of 13C/12C and 15N/14N. The accuracy of the instrument was assessed by measuring internal standards along with samples. The stable isotope data are reported using the δ-notations (δ 13C and δ 15N) in parts per thousand (‰), where:
δ = 1000 × ( R s a m p l e R s t a n d a r d ) 1
The data were relative to the Peedee Belemnite (PDB) standard for carbon and atmospheric dinitrogen (N2) for nitrogen. Two casein samples were placed between eight unknowns in sequence as a laboratory standard.
Briefly, a total of 111 Daphnia samples (3 replicates of each treatment and time point) and 38 phytoplankton samples (a single replicate of each time point) were used for the stable isotope analysis. The δ 13C and δ 15N analyses were conducted for all samples.

2.4. Time-Based Stable Isotope Turnover Rates

The time-based turnover rates were calculated for the changes in δ 13C and δ 15N as an exponential function of time following the diet switch using the model of Hobson and Clark [56]:
δ t = δ e q + ( δ 0 δ e q ) e λ t
Here:
δ t represents the δ 13C and δ 15N values of D. magna at the experimental time t;
δ e q is the calculated asymptotic equilibrium with the new diet;
δ 0 is the initial isotopic value prior to the diet switch;
λ is the turnover rate (h−1).
For the estimation of the variables in this model, we used the nls function in R with the self-starting asymptotic regression model SSasymp with the following equation:
δ t = δ e q + ( δ 0 δ e q ) e exp ( log λ ) t
The turnover rate expressed in terms of the half-life (T0.5), the time period needed to achieve a 50% turnover of the isotopic composition of δ 13C, was calculated as [56]:
T 50 = ln ( 2 ) λ

2.5. Determination of the Best Model Fit Using AIC

We also calculated Akaike’s information criterion for samples size scores (AIC) to evaluate the relative support for each model and to determine how well the exponential or linear model provided a better fit for the data:
δ t = δ e q λ ( δ 0 δ e q ) t
The model assumptions were checked using nlstools package and check of normal distribution of Residuals using Shapiro Wilks test. The AIC differences (ΔAIC) between the two different models (exponential and linear) were calculated as
Δ A I C = A I C m A I C n
Here:
A I C m is the calculated AIC of a model;
A I C n is the lowest AIC of the competing model.

2.6. Discrimination Factor (DF)

The isotopic differences between animal tissue and their diets during the experiment were estimated by subtracting the animal isotope values from those of their respective diets for two elements (δ 13C and δ 15N):
Δ ( t i s s u e d i e t ) = δ t i s s u e δ d i e t

2.7. Statistical Analysis

All statistical analyses were performed using R (version 3.6.2). The data were checked for the normality (Shapiro–Wilk Test) and homogeneity of variances (Levene test). For comparison of the δ 13C signatures of the diet and the D. magna sample from the last timepoint (M. aeruginosa 72 h, all other dietary treatments at 96 h after diet changed), we used the parametric paired t-test. Due to the non-normal distribution of the pooled data, we used the non-parametric Wilcoxon test.
To compare the difference between the isotopic signatures of D. magna and the diet after 96 h of incubation, depending on normal-distribution, we used the paired t-test and the Wilcoxon test. For the analysis of the differences between the stable isotopic signatures of the respective diets over time, we used a homogeneity of variance ANOVA and a post hoc Tukey test.
A cluster analysis was performed using the R packages factoextra, ggpubr, and cluster. To define the optimal number of clusters, we used the average silhouette method, the elbow method, as well as the gap statistic method [57].

3. Results

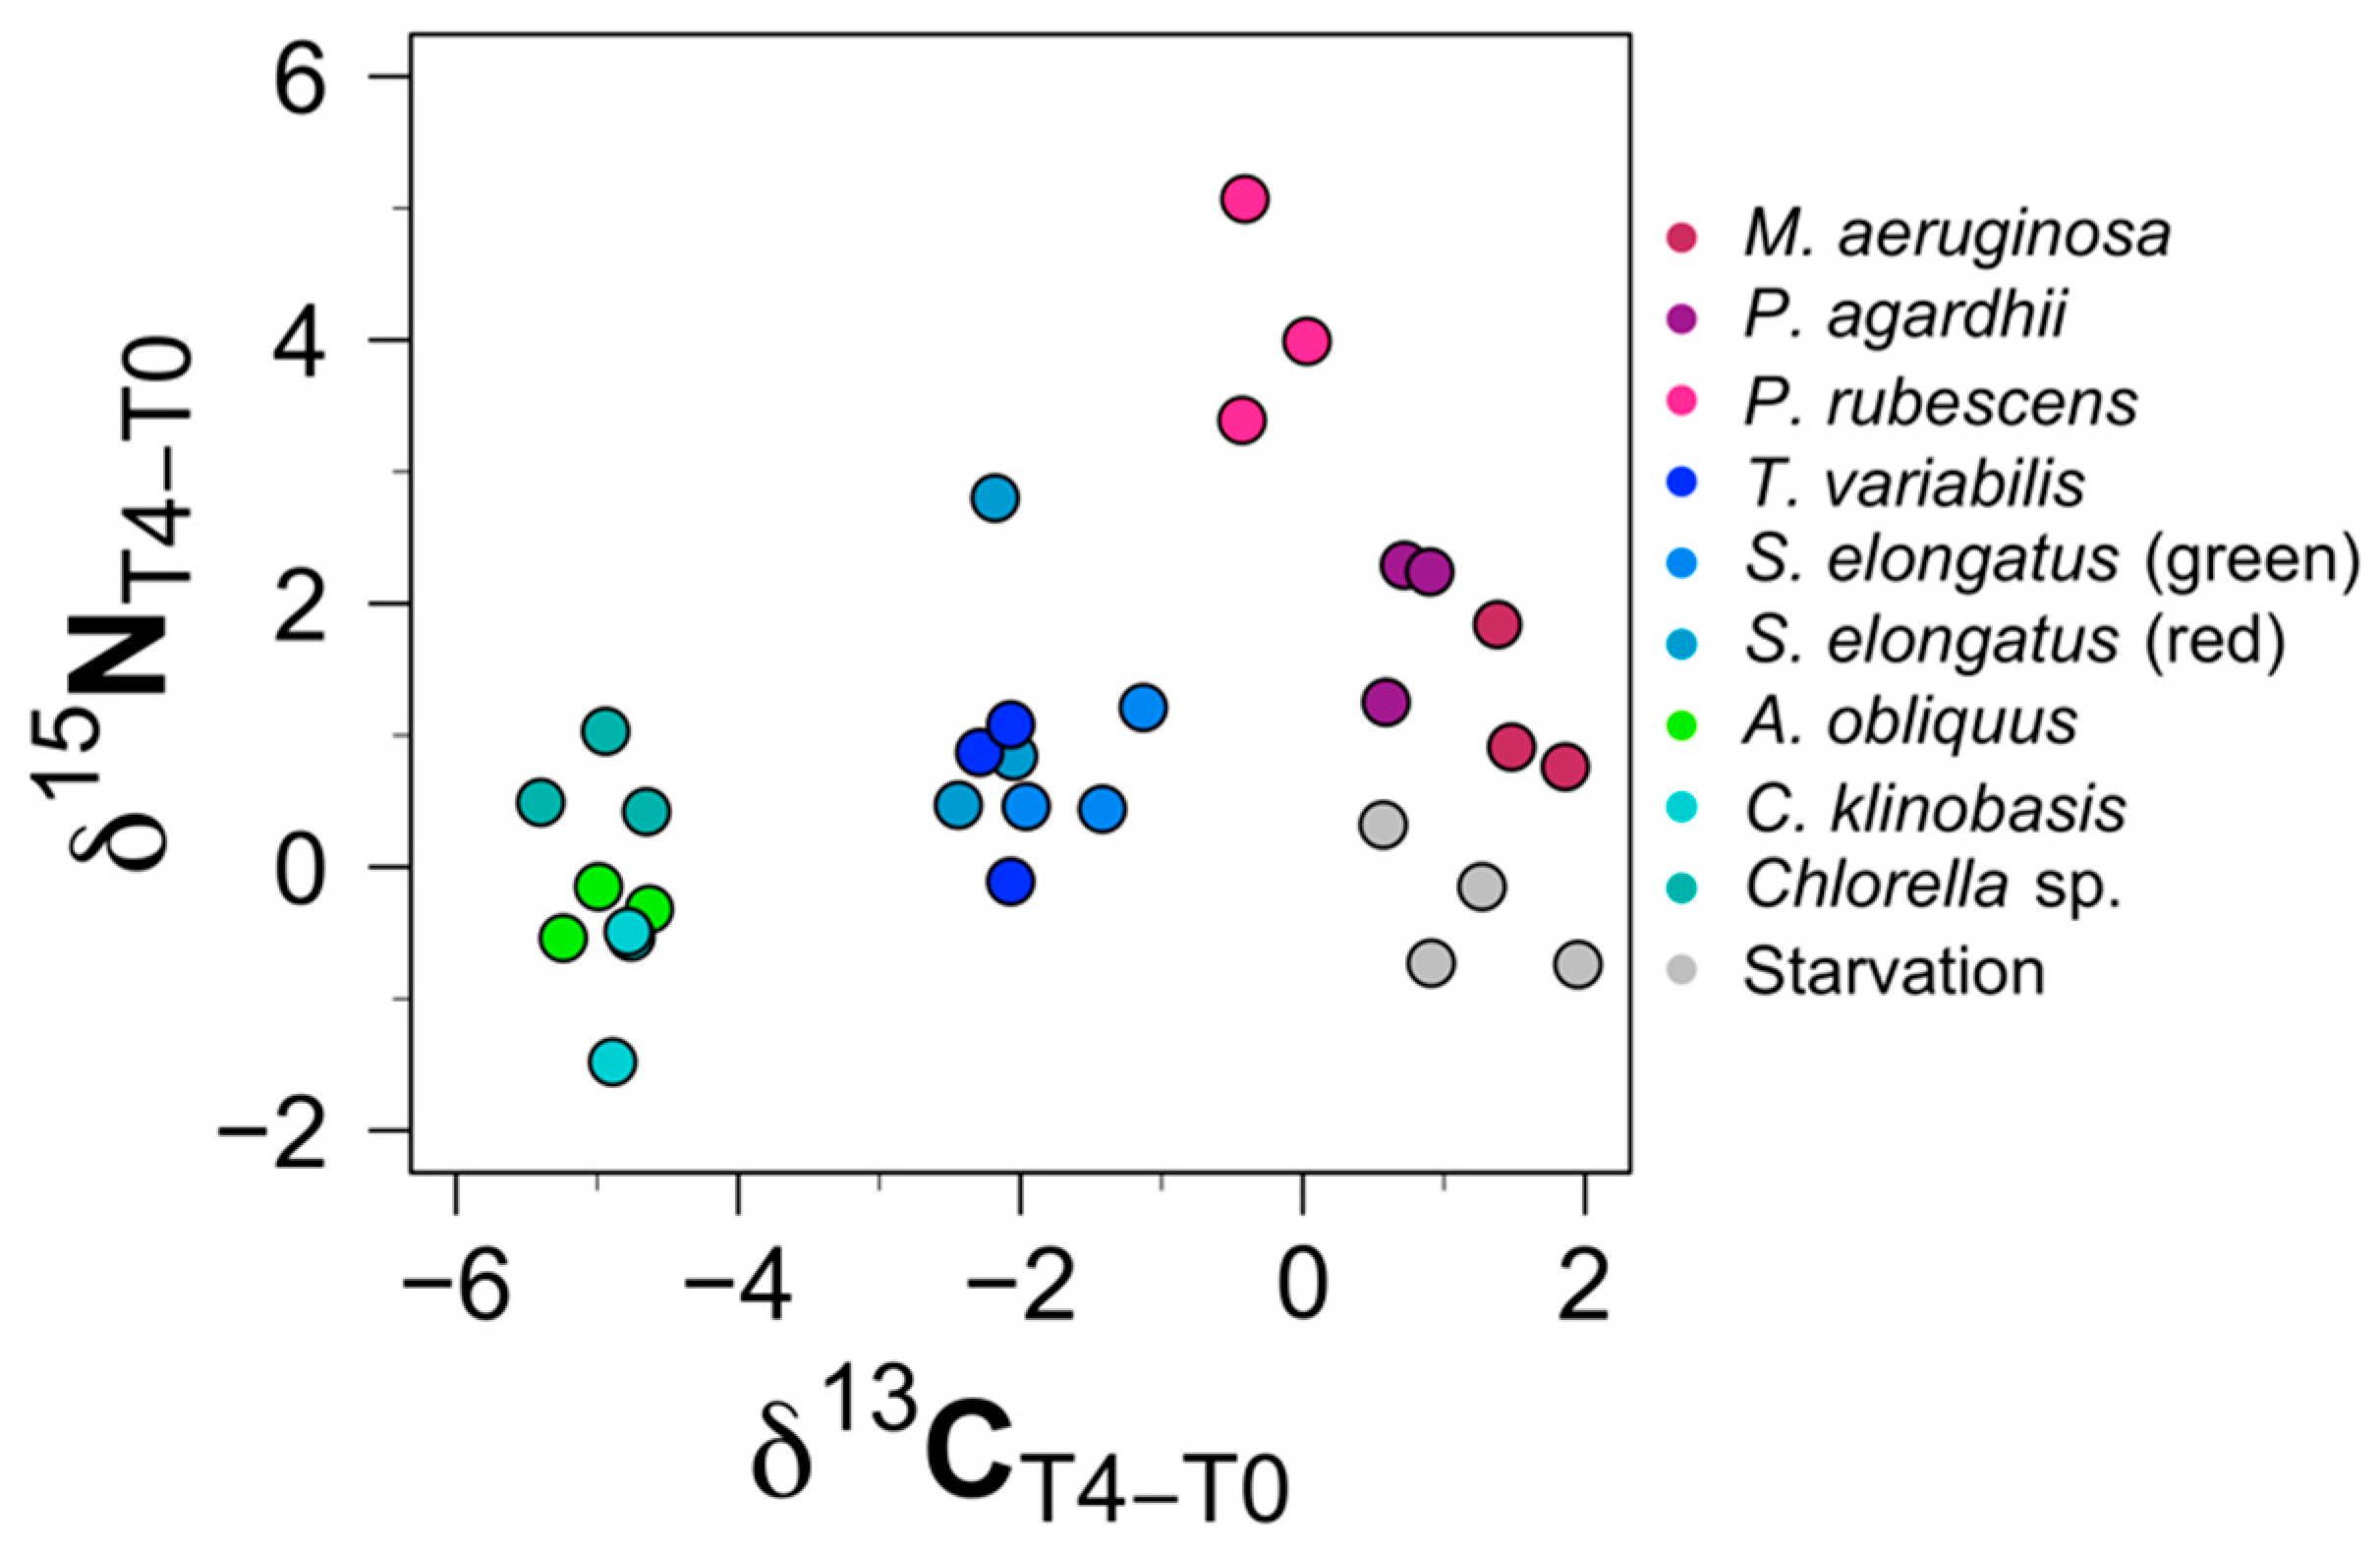
3.1. Isotopic Changes in Daphnia Tissues (δ 13C and δ 15N) after Diet Switch

Due to the increasing mortality rate of the Daphnia samples with the dietary treatment of M. aeruginosa, no animals survived 96 h after the diet switch (Figure 1). Therefore, only data up to 72 h are shown in Figure 1 and were used for the statistical analysis. Compared to this, D. magna with the other dietary treatments had a 100% survival rate.
Figure 2 and Figure 3 exhibit the δ 13C and δ 15N values for D. magna with the different dietary treatments and starvation over a time period of 96 h, respectively. Table S1 shows the SI values for D. magna with the different treatments listed.
In the following, the results for the various algal dietary sources are depicted, and all values are given as means ± SE.

3.1.1. Chlorophytes: C. klinobasis, C. vulgaris, and A. obliquus

D. magna showed an initial rapid change in δ 13C when fed on the chlorophytes C. klinobasis, C. vulgaris, and A. obliquus (Figure 2). The rate of incorporation for algal carbon reached an equilibrium after 72–96 h. While the δ 13C values of D. magna changed rapidly (−4.92‰ ± 0.26), the δ 15N values remained almost constant (−0.17‰ ± 0.74) (Figure 3).

3.1.2. Non-Toxic Cyanobacteria: S. elongatus and T. variabilis

Compared to the green algal carbon values, cyanobacterial carbon represented by S. elongatus (Bo8801 and Bo8809) and T. variabilis was incorporated rather slowly (within 48 h). After 48 h, the Daphnia did not incorporate the cyanobacterial carbon anymore and reached its equilibrium, while the δ 15N values slightly increased (0.9‰ ± 0.82) (Figure 2 and Figure 3).

3.1.3. Toxic Filamentous Cyanobacteria: P. rubescens and P. agardhii

When fed with the filamentous cyanobacteria P. rubescens and P. agardhii, which do not contain sterols or long-chain PUFAs, and in addition produce a number of harmful secondary metabolites (Table 1), the mean (± SE) δ 13C values exhibited a minor shift (P. rubescens: = −0.27‰ ± 0.26; P. agardhii: 0.74‰ ± 0.16), while the δ 15N values increased after 48–72 h rather rapidly (P. rubescens: 5.15‰ ± 0.85; P. agardhii: 1.98‰ ± 0.59) (Figure 2 and Figure 3).

3.1.4. Toxic Unicellular Cyanobacteria and Starvation

The Daphnia samples that were fed on toxic Microcystis aeruginosa increased in δ 13C (1.57‰ ± 0.25‰) as well as in δ 15N (1.17‰ ± 0.59) compared to the initial values (Figure 4).
The starving D. magna samples showed a different SI value compared to all the other dietary treatments. While the δ 13C signature of D. magna increased (1.17‰ ± 0.59) comparable to the SI values of D. magna with the toxic cyanobacterial diet, the δ 15N values decreased (−0.32‰ ± 0.51‰), as did the D. magna signature of the green algal diet compared to their initial treatment. Even 96 h after the dietary switch, D. magna did not reach equilibrium in terms of δ 13C.
Briefly, we note that the highest enrichment for δ 13C after 72 h in the D. magna tissue was for the dietary treatment with M. aeruginosa. The overall δ 13C value of D. magna held with the M. aeruginosa diet treatment was 1.57‰ (±0.25), which was enriched compared to the initial value, while the δ 13C value of the starving D. magna tissue was enriched by 1.17‰ (±0.59) after 96 h. On the other hand, the animals fed with C. vulgaris showed the steepest slope, with a decrease in the δ 13C signature of 5.00‰ (±0.38) compared to their initial signature (Figure 4).
The highest enrichment of δ 15N for the D. magna tissue after 96 h compared to the start signature was found in P. rubescens with 4.15‰ (±0.85), followed by the dietary treatment with P. agardhii with 1.98‰ (±0.59) (Figure 4). The largest decrease in the δ 15N signature of D. magna compared to the initial signature was found in C. klinobasis with −0.83‰ (±0.56), followed by the starvation treatment with a decrease of −0.32‰ (±0.51) (Figure 4).

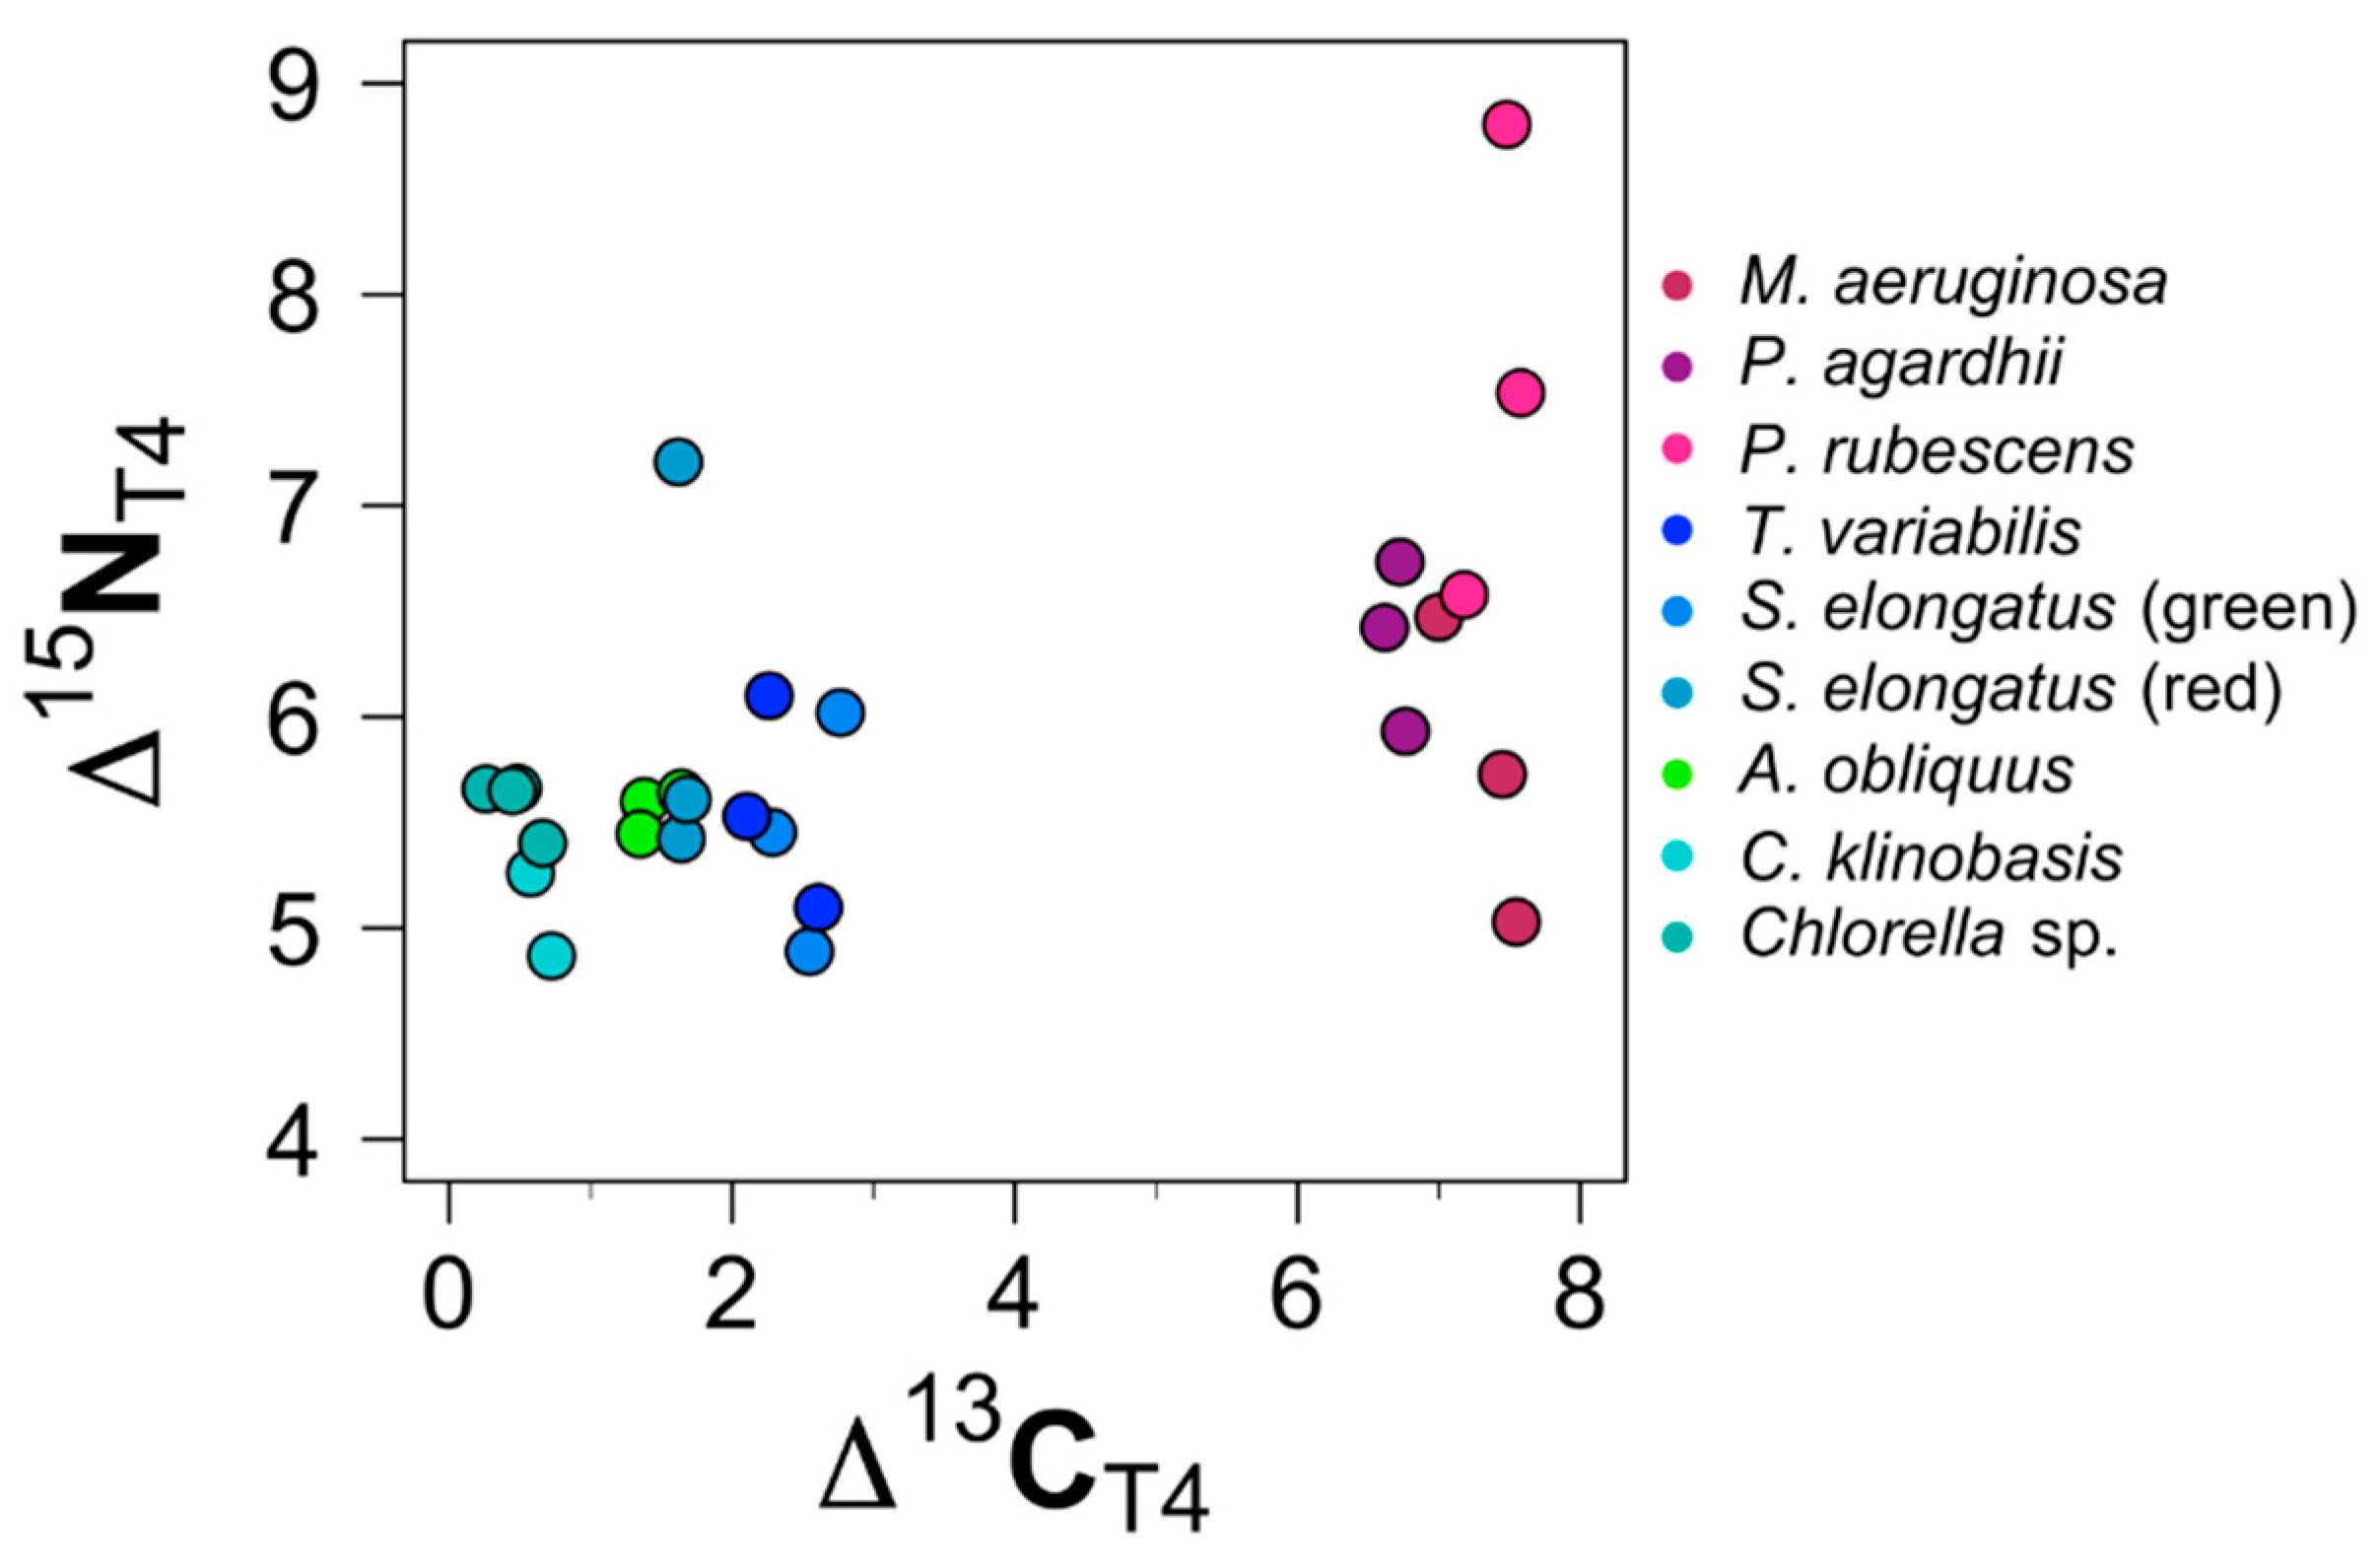
3.2. Trophic Discrimination Factors (TDFs)

The trophic discrimination factors are shown in Figure 5 and listed in Table S1.

3.2.1. TDF: Chlorophytes

The δ 13C value of D. magna individuals fed on chlorophytes was enriched by 0.84‰ (±0.49‰), while the δ 15N value increased by 5.47‰ (±0.26‰).
Specifically, the δ 13C value of D. magna with the C. vulgaris dietary treatment did not show a significant difference from the dietary source (p > 0.05) (Table 3), while the δ 13C signatures of all other D. magna samples differed significantly (p < 0.05) from their diet source (Figure 5).

3.2.2. TDF: Non-Toxic Cyanobacteria

The D. magna samples feeding on cyanobacteria of both strains of S. elongatus and of T. variabilis were 2.17‰ (±0.44‰) enriched in δ 13C and 5.70‰ (±0.68‰) enriched in δ 15N. Their δ 13C values also differed significantly (p < 0.05) from those of their diet. During the 96 h following the dietary switch, the Δ15N values increased by about 0.976‰ from 4.73‰ to 5.70‰, while the Δ13C values decreased by about 1.95‰ from 4.12‰ to 2.17‰.

3.2.3. TDF: Toxic Cyanobacterial

The D. magna samples on the treatments with M. aeruginosa, P. rubescens, and P. agardhii did not incorporate the δ 13C signature of their diet. While the Δ13C values of D. magna samples with the other treatments decreased, the Δ13C value of these D. magna samples increased during the experiment by about 0.53‰ from 6.53‰ to 7.06‰. Additionally, the Δ15N value increased rapidly about 4.36‰ from 2.64‰ to 7.00‰. The highest enrichment compared to the dietary source was found in P. rubescens, with an average increase of 7.64‰ (±1.12), followed by P. agardhii, with an average increase of 6.36‰ (±0.40).

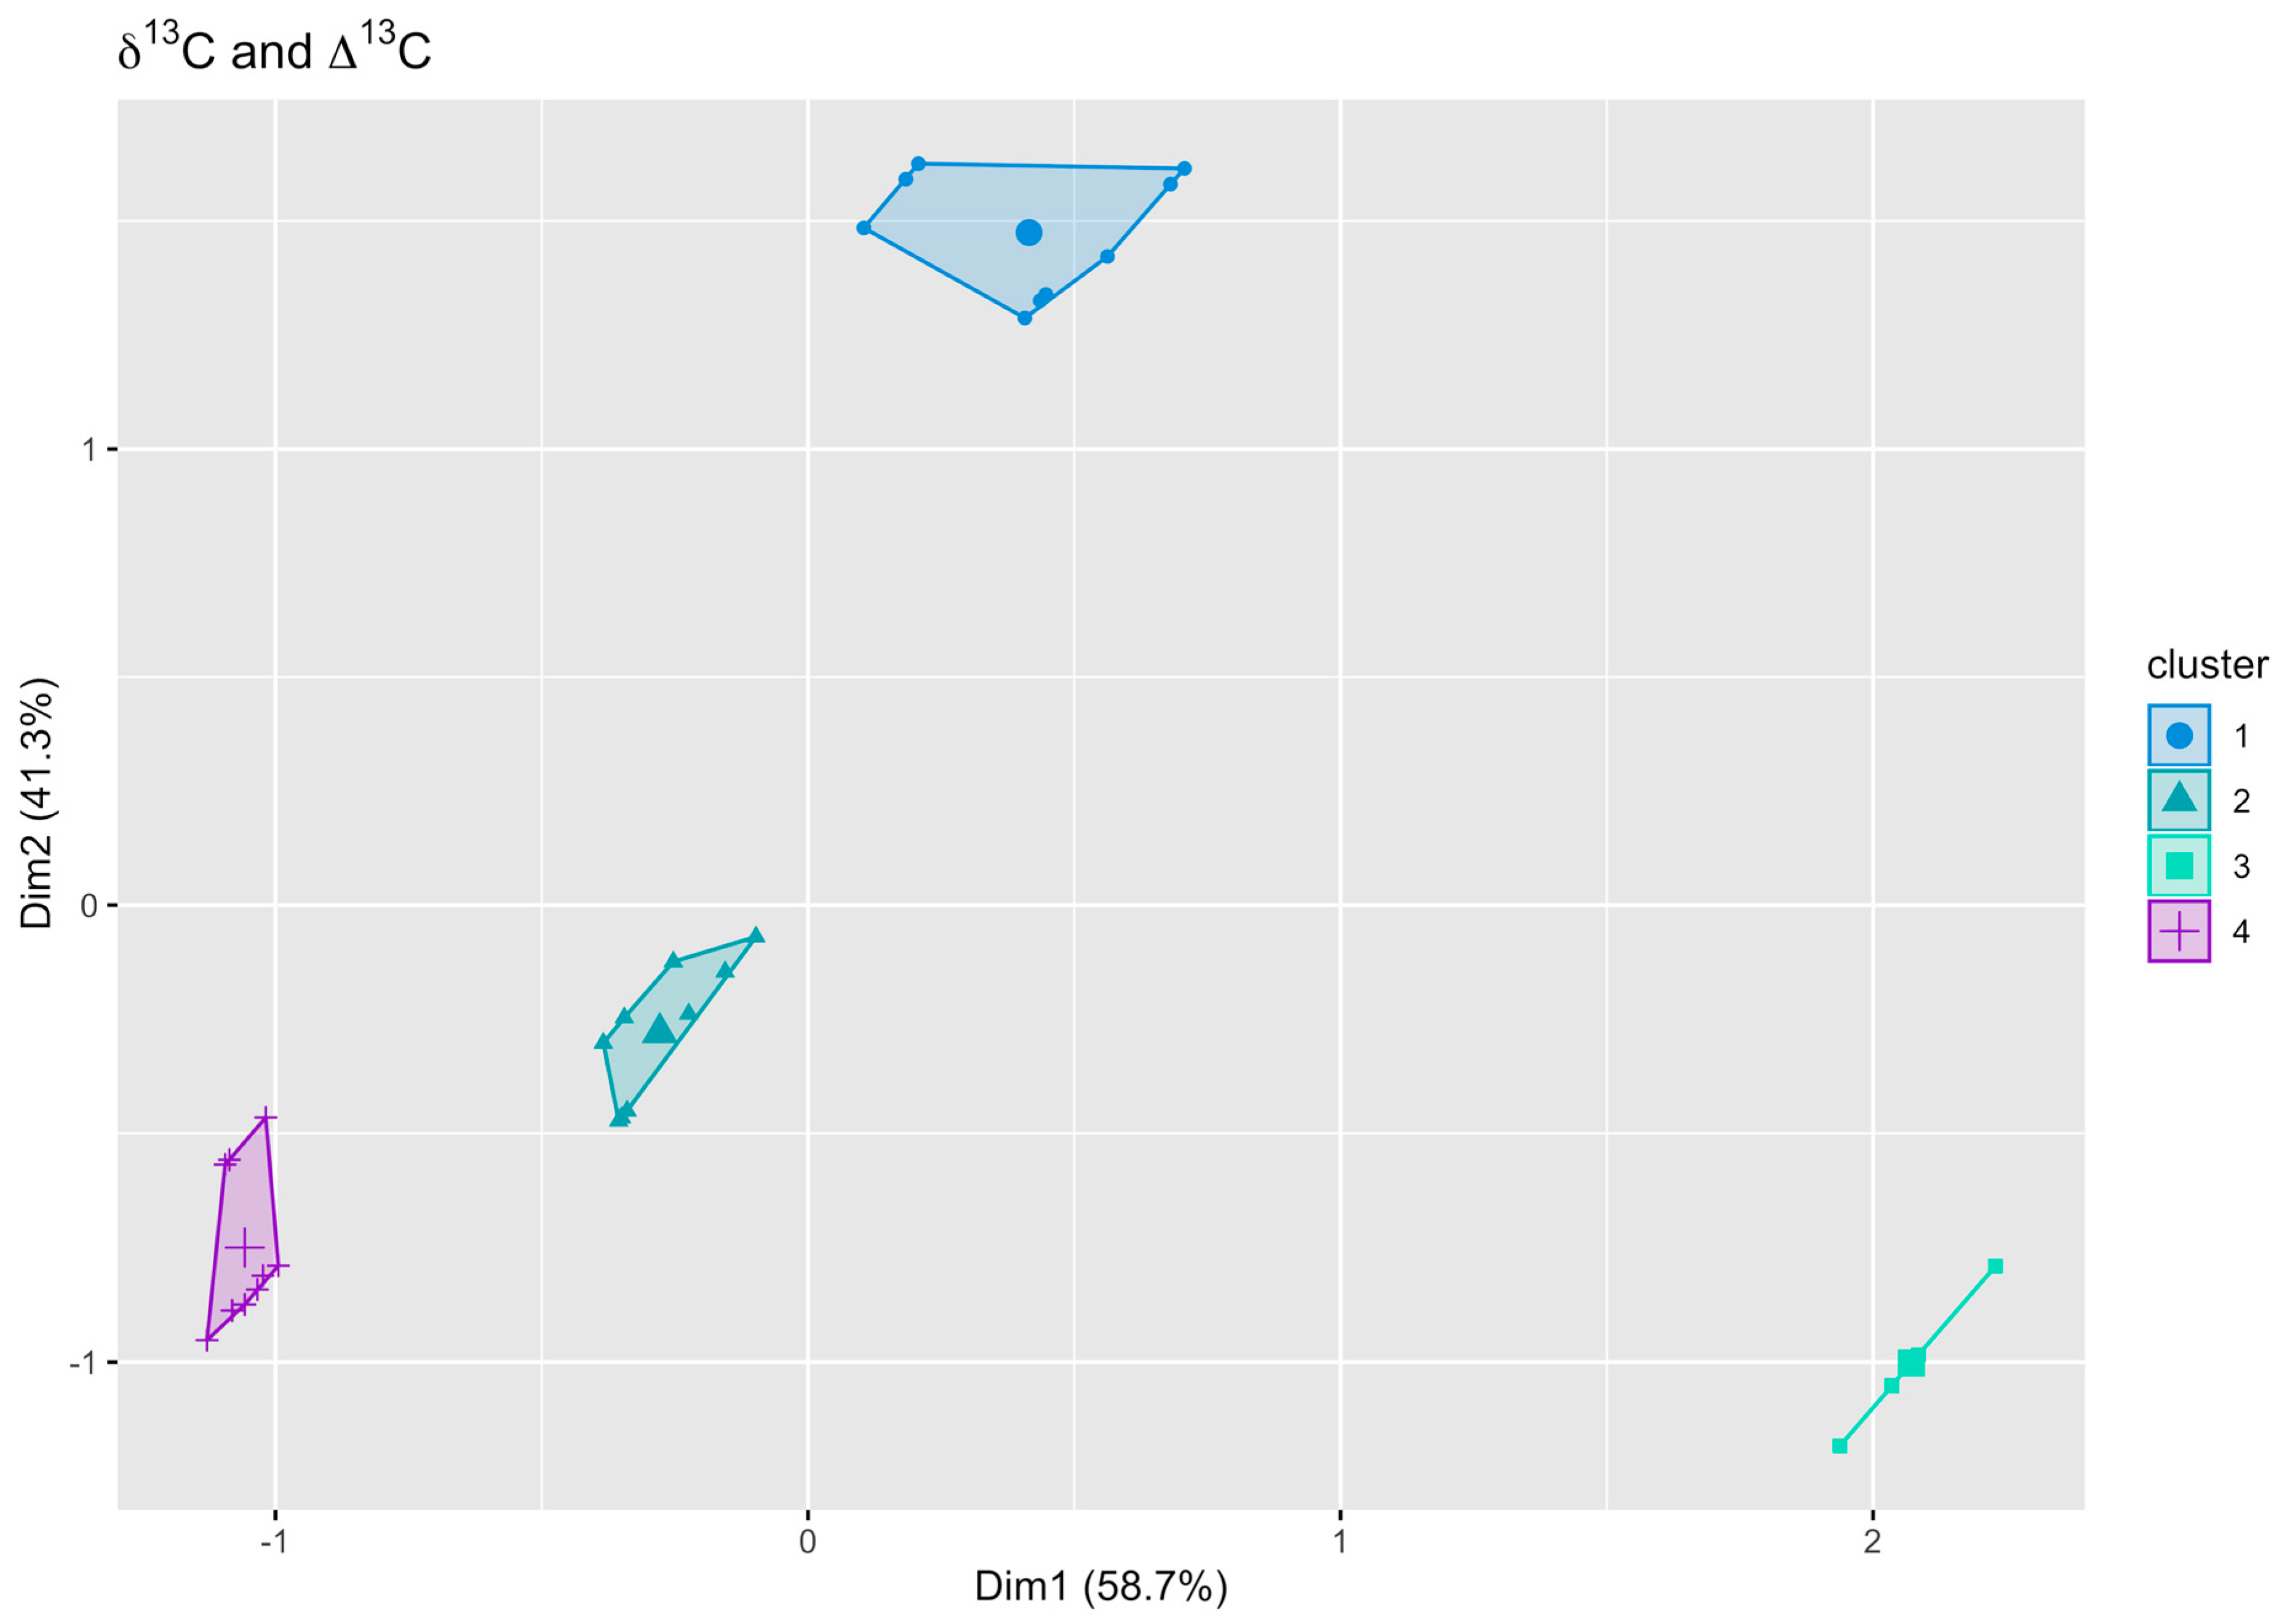
3.3. Cluster Analysis

A cluster analysis based on the δ 13C as well as the Δ13C values of D. magna tissues with the different dietary treatments (Figure 6) identified 4 distinctive groups. Cluster I was formed by the non-toxic dietary treatment with T. variabilis as well as both strains of S. elongatus. Cluster II represents the toxic dietary treatments with P. agardhii, P rubescens, and M. aeruginosa, while cluster III was formed by the chlorophytes A. obliquus, C. klinobasis, and C. vulgaris. Cluster IV was represented by starving D. magna samples. Based on the cluster analysis, the data for the different treatments were pooled for better fitting of the decay models.

3.4. Turnover Rates and Decay Models

The results of the comparison of Akaike’s information criteria (∆AICc) and the calculated parameters of the decay function are shown in Table 4.
The best fit for the δ 13C values of T. variabilis, S. elongatus (green), and S. elongatus (red) (difference in AICc: 14.21), as well as for A. obliquus, C. klinobasis, and Chlorella sp. (difference in AICc: 7.37), correspond to the one-phase exponential decay. Due to the increasing or stagnating δ 13C values of M. aeruginosa, the P. rubescens and P. agardhii turnover rates and decay models could not be calculated.
The calculated carbon turnover rates (T0.5) for D. magna fed on chlorophytes were very similar to each other and differed only slightly (T0.5: 35.52 h ± 1.49). The carbon turnover rates of the cyanobacterial strains S. elongatus and T. variabilis were compared to the chlorophytes, being 7.89 h faster. The average turnover time was 27.63 h, with the fastest turnover being for the red strain of S. elongatus at 23.78 h and the slowest turnover rate being for T. variabilis at 55.69 h.

4. Discussion

The results of these controlled laboratory experiments using eight species of algae fed to Daphnia samples demonstrated that the dietary quantity and quality as well as the toxic stress (presumably through production of harmful secondary metabolites) exert a measurable influence on the fractionation and incorporation rates of the carbon and nitrogen isotope values of the key aquatic consumer Daphnia.

4.1. Starvation

The starving animals in the present study showed enriched δ 13C values (1.17‰ ± 0.59), while the δ 15N values decreased by approximately 0.32‰ (±0.51) over a time period of 96 h. A similar effect of starvation on the δ 13C values had been documented earlier by Webb et al. [58] and Oelbermann and Scheu [59]. However, the decrease in δ 15N was contrary to the result a growing number of studies have shown, whereby nutritional stress (starvation) leads to an enrichment of the δ 15N values in consumer tissues in invertebrates [59,60,61].
In fact, Doi et al., 2017 conducted a meta-analysis of the δ 13C and δ 15N values of consumers post- and pre-starvation and showed a large variation in consumer isotope values (δ 13C range: −1.92 to 2.62‰; δ 15N range: −0.82 to 4.30‰). The analysis also showed both increases and decreases in δ 13C due to starvation, while the δ 15N values of most consumers increased along the length of the starvation period. Our findings also suggest that starvation induces changes in consumer δ 15N values, which are mainly explained by the length of the fasting period. Previously, Adams and Sterner [61] showed that starvation in Daphnia magna leads to δ 15N enrichment. While the available nitrogen decreases, the organisms are forced to recycle existing internal nitrogen reserves, which results in increasing δ 15N values as the lean body mass is lost without the replacement of excreted 14N [62].
There is a wide variety of reports on the effects of starvation on consumer stable isotope values. While some studies report δ 15N enrichments, no alteration [60], or enriched 13C [59] due to starvation, other studies have shown δ 13C enrichment [63] or no effect [64]. Elsewhere, chironomid starvation resulted in no change in δ 15N values but a significant enrichment in δ 13C values, presumably due to the preferential degradation of low-δ 13C components during periods of starvation [63]. In contrast to the other findings, Gorokhova and Hansson [64] could not observe any effect of starvation on the stable isotopic composition of mysids. The process of nutrient recycling and trophic enrichment due to starvation might induce a complex process and very variable isotope values within different species, life stages, and body conditions.

4.2. Chlorophytes

In contrast to starving animals, we observed a rapid change in the isotopic signature in Daphnia tissues feeding on chlorophytes. They reached isotopic equilibrium with their diet after 72–96 h following the diet switch. After 96 h, the D. magna tissue showed a slight enrichment of 0.84‰ in Δ13C and enriched Δ15N values (Δ15N 5.47). Although there was a slight decrease and an increase for the two isotopes, this result was in agreement with previous values obtained from 25 different lakes lying in temperate zones with average fractionation values of δ 13C ca. 0.4‰ (±1.3‰) and δ 15N 3.4‰ (±1‰). Earlier, Minagawa and Wada [65] documented Δ15N enrichment rates for all consumers (zooplankton, fish, and birds) of 1.3 to 5.3 (averaging 3.4‰ ± 1.1‰) with increasing trophic levels.
There were only slightly differences in isotopic fractionation between the different chlorophytes used as dietary sources. While the D. magna tissue fed on Chlorella vulgaris did not differ after 96 h from that of their diet, the isotopic signature of D. magna samples fed on C. klinobasis and A. obliquus still differed significantly from their dietary source after 96 h. Presumably, the biochemical composition of the different chlorophyte species might result in differences in the isotopic composition of Daphnia fed on a specific diet. Indeed, Chlorella species are known for the high variability of their biochemical composition [66]. Studies on the algal species Chlorella vulgaris showed that in addition to phytosterols, which Daphnia can convert to the required or important cholesterol, this alga also contains long-chain polyunsaturated fatty acids (PUFAs) such as ALA, EPA, and DHA [55,67,68,69,70], which are important for Daphnia. Evidently, the availability of sterols influences the somatic growth of Daphnia, while the PUFAs primarily play a crucial role in Daphnia reproduction [71]. Due to the essential nutrients present, Chlorella vulgaris can be considered a suitable food for Daphnia.
In aquatic food webs, the lipid composition of the prey is of great importance for the efficiency of the transfer of energy to higher trophic levels. In addition to the lipid composition, the elemental C/N ratio of the diet plays a decisive role in the isotopic fractionation in Daphnia and especially in the δ 15N enrichment of consumers. Adams and Sterner [61] found an inversely relationship between the δ 15N values of Daphnia and the diet–tissue isotopic fractionation factor with the nitrogen content of the phytoplankton’s diet. In addition to the biochemical composition of the phytoplankton, the variability of the C/N ratio could also cause an altered isotopic fractionation in Daphnia.

4.3. Non-Toxic Cyanobacteria

The traits of the cyanobacteria, such as the absence of long-chain PUFAs [72] and sterols [73], morphological properties (filamentous, pico-sized, colony-forming), and the production of harmful secondary metabolites (cyanotoxins), reduce the fitness of the [42,74] and mean they are a low quality diet for Daphnia. Our data show that the δ 13C isotopic signature of D. magna slowly decreases. After 24 h, the δ 15N values start to increase while the δ 13C values remain at the same level.
The increasing δ 15N levels suggest that the animals are in nutritional stress through starvation or as result of the low dietary quality and quantity [58,62,75,76,77]. Herein, we undertook a microscopic investigation of the guts of multiple individuals of D. magna and found that the individuals had ingested the offered food algae (gut observation). However, we did not measure the gut residence times or clearing rates so we were not able to exclude starvation-like symptoms due to the inefficient uptake of carbon through the thick cell walls or feeding deterrents. Most importantly, S. elongatus lacks sterols and is of poor food quality [42,48,49,71]. T. variabilis produces the C-18 PUFAs (similar to ALA and SDA) [42,48,49] but is deficient in long-chain PUFAs (e.g., C-20). Due to the absence of sterols and long-chain PUFAs, Daphnia individuals are likely to suffer from nutritional stress after 24 h, when the internal nutrient reserves are depleted. As a consequence, it is likely that they recycle their own somatic nitrogen [58,61,62,78], resulting in an increase in δ 15N values.
Previously, it has been suggested that the lack of sterols is the main reason for the low food quality of cyanobacteria for Daphnia and that the lack of C-20 PUFAs in cyanobacteria becomes relevant only when dietary sterol requirements are met by consuming eukaryotic food sources along with the cyanobacteria, potentially resulting in a co-limitation by sterols and C-20 PUFAs [71].
To summarize, the lipid composition of the primary producers can affect the fractionation rate of the consumers in two ways. Firstly, an increased lipid concentration in the primary producers can lead to an increased lipid content in the consumer tissues, depleted δ 13C values, and reductions in Δ13C values. Secondly, a PUFA-rich diet might lead not only towards an increased growth rate but also enhanced resource investment towards reproduction [42,79] and can potentially affect the isotope discrimination factors [80,81,82].

4.4. Toxic Unicellular Cyanobacteria

In contrast to the isotopic signatures of starving animals, D. magna samples fed with M. aeruginosa showed increases in δ 13C (1.57‰ ± 0.25‰) and δ 15N (1.17‰ ± 0.59‰) during exposure to the toxic unicellular cyanobacteria.
In addition to the mechanical interference through colony formation and the lack of essential nutrients, the cyanobacteria can affect the zooplankter fitness through the production of harmful secondary metabolites and therefore can influence their isotopic fractionation. The M. aeruginosa strain PCC 7806 is known to produce a variety of harmful metabolites such as microcystins, cyanopeptolins, and anabaenopeptins [37], which can lead to increasing mortality rates in Daphnia. In our experiment, the mortality rate of D. magna reached 100% after 96 h of exposure to M. aeruginosa. Due to their non-selective filtering process, Daphnia is unable to distinguish food particles in regard to nutritional quality. However, the perception of toxic phytoplankton leads to a complete inhibition of the filtering process [83], and individuals often display arrested feeding, at least for a while. In our study, it is likely that the putative inhibition of food intake induced a starvation-like state in the Daphnia, leading to an enrichment of the δ 15N and δ 13C values. Microcystis may also form aggregates, potentially leading to mechanical interference with the Daphnia filtration process. However, the microscopic investigation of the phytoplankton culture showed no formation of aggregates. Since we cannot rule out that aggregates were formed as a result of the feeding pressure, we examined the guts of D. magna microscopically and observed that the cells were ingested. This implies that the observed shifts in isotopic signatures were due to nutrient deficiencies or toxin production.
In the study by Brzeziński et al. [84], the Daphnia magna individuals became progressively enriched in δ 15N with the increasing concentration of a toxic chemical, while the stable carbon isotopes were not affected. Since all Daphnia individuals from all treatments were fed with food from the same source with the same isotopic signature, this ruled out diet-related effects on the stable isotopes. Compared to their results, the D. magna individuals in our experiment showed enrichment in both δ 15N and δ 13C while exposed to toxic cyanobacteria. The enrichment of stable nitrogen and carbon could occur due to reduced growth [81], alterations of metabolic pathways involving protein synthesis, and carbon turnover [85], as wells as the allocation of energy among detoxification processes [86,87], with an enhanced excretion rate of 14N for detoxification [88] and increased respiration.

4.5. Toxic Filamentous Cyanobacteria

Compared to the M. aeruginosa exposure, the Daphnia individuals fed Planktothrix agardhii and P. rubescens showed lower δ 13C values but stronger δ 15N enrichment, which indicated a starving process in D. magna. After 96 h, the D. magna individuals from the P. rubescens treatment showed the strongest δ 15N enrichment of the whole experiment, with an increase of 5.15‰ (± 0.85‰).
The used strains of P. agardhii as well as P. rubescens are not able to synthesize microcystins. Nevertheless, they produce harmful metabolites, such as anabaenopeptins [44,45,46]. Like microcystins, anabaenopeptins lead to the inhibition of Daphnia individuals’ swimming behavior [89] and alter their physiology [90]. Additionally, Planktothrix individuals can form long trichomes, which potentially interfere mechanically with the filtering process of Daphnia individuals and may reduce their grazing efficiency [91,92,93,94] and increase their metabolic rate [95]. However, Daphnia individuals are able to ingest particles of a wide size range, reaching from particles of less than 1 µm [96] up to mm-sized filamentous algae [97], including trichomes of Planktothrix [98]. Microscopic gut investigations revealed that the D. magna individuals ingested both strains of Planktothrix species. Therefore, mechanical interference and associated starvation due to lack of ingestion can be ruled out. The enriched isotope values indicative of starvation were likely caused by sterol limitations or the inhibitory effects of secondary metabolites. By implication, if the animals cannot express growth due to the lack of an essential nutrient or the inhibition of nutrient assimilation due to harmful metabolites, then the isotope signature ’falsely’ mirrors values that imply the lack of consumption of cyanobacteria. However, the shifts in isotopic signatures are due to nutrient deficiencies or the influence of toxins, despite the cyanobacteria ingestion. Finally, the production of harmful metabolites and the resulting toxic stress combined with the mechanical interference and the lack of sterols and long-chain PUFAs may explain the enrichment in δ 15N in Daphnia individuals fed with P. rubescens and P. agardhii.

5. Conclusions

In summary, in this study we parameterized and formulated stable isotope turnover rates and discrimination factors to estimate the timing of resource shifts of Daphnia individuals. The parameters generated in this paper for eight phytoplankton species and starvation provide a strong base for future stable isotope studies of this key primary consumer species. More generally, through model fitting and information based on the characterization of the phytoplankton species approach, this study provides an overview into the physiological reasoning underpinning stable isotope dynamics. Furthermore, through exploring the strengths and limitations of the different diets and the influence of their potential quality, quantity, and toxic stress on trophic isotope variations in Daphnia individuals, this study illustrates how temporal estimates of resource switching are affected, while the tissue turnover models and discrimination factors might also be influenced. It is evident that advances in stable isotope studies will be most effective when they can be supported by laboratory, theory, and field-based investigations.

Supplementary Materials

The following supporting information can be downloaded at: https://www.mdpi.com/article/10.3390/biology11121816/s1. Table S1: Stable isotopic signatures of the daphnids of the different dietary treatments at the last sampling time [h].

Author Contributions

Conceptualization, D.H.; methodology, D.H. and M.H.; software, M.H.; formal analysis, M.H. and E.Y.; investigation, D.H. and M.H.; resources, E.Y., D.M.-C. and K.-O.R.; data curation, M.H.; writing—original draft preparation, M.H., E.Y. and D.H.; writing—review and editing, D.H., M.H., D.M.-C., K.-O.R. and E.Y.; visualization, M.H.; supervision, D.M.-C. and E.Y.; project administration, D.H. and M.H.; funding acquisition, K.-O.R., D.M.-C. and E.Y. All authors have read and agreed to the published version of the manuscript.

Funding

The work was financially supported by the Ministry of Science, Research, and the Arts of the Federal State Baden-Württemberg, Germany (Water Research Network Project: Challenges of Reservoir Management—Meeting Environmental and Social Requirements) and by the Deutsche Forschungsgemeinschaft (DFG, German Research Foundation, 298726046/GRK2272).

Institutional Review Board Statement

Not applicable.

Informed Consent Statement

Not applicable.

Data Availability Statement

Not applicable.

Acknowledgments

We thank Wolfgang Kornberger for his assistance in the stable isotope analysis.

Conflicts of Interest

The authors declare no conflict of interest. The funders had no role in the design of the study; in the collection, analyses, or interpretation of data; in the writing of the manuscript; or in the decision to publish the results.

References

  1. Leibold, M.A.; Chase, J.M.; Shurin, J.B.; Downing, A.L. Species Turnover and the Regulation of Trophic Structure. Annu. Rev. Ecol. Evol. Syst. 1997, 28, 467–494. [Google Scholar] [CrossRef]
  2. Bell, G. The evolution of trophic structure. Heredity 2007, 99, 494–505. [Google Scholar] [CrossRef] [PubMed]
  3. Scotti, M.; Bondavalli, C.; Bodini, A.; Allesina, S. Using trophic hierarchy to understand food web structure. Oikos 2009, 118, 1695–1702. [Google Scholar] [CrossRef]
  4. Pace, M.L.; Cole, J.J.; Carpenter, S.R.; Kitchell, J.F. Trophic cascades revealed in diverse ecosystems. Trends Ecol. Evol. 1999, 14, 483–488. [Google Scholar] [CrossRef]
  5. Eddy, T.D.; Bernhardt, J.R.; Blanchard, J.L.; Cheung, W.W.; Colléter, M.; Du Pontavice, H.; Fulton, E.A.; Gascuel, D.; Kearney, K.A.; Petrik, C.M. Energy flow through marine ecosystems: Confronting transfer efficiency. Trends Ecol. Evol. 2021, 36, 76–86. [Google Scholar] [CrossRef]
  6. Nielsen, J.M.; Clare, E.L.; Hayden, B.; Brett, M.T.; Kratina, P. Diet tracing in ecology: Method comparison and selection. Methods Ecol. Evol. 2018, 9, 278–291. [Google Scholar] [CrossRef]
  7. Webb, B.W.; Hannah, D.M.; Moore, R.D.; Brown, L.E.; Nobilis, F. Recent advances in stream and river temperature research. Hydrol. Process. 2008, 22, 902–918. [Google Scholar] [CrossRef]
  8. IPCC. Climate change 2021: The physical science basis. In Contribution of Working Group I to the Sixth Assessment Report of the Intergovernmental Panel on Climate Change; Masson-Delmotte, V., Zhai, P., Pirani, A., Connors, S.L., Péan, C., Berger, S., Caud, N., Chen, Y., Goldfarb, L., Gomis, M., et al., Eds.; Cambridge University Press: Cambridge, UK; New York, NY, USA, 2021; p. 2391. [Google Scholar]
  9. IPCC. Summary for Policymakers. In Climate Change 2022: Mitigation of Climate Change. Contribution of Working Group III to the Sixth Assessment Report of the Intergovernmental Panel on Climate Change; Shukla, P.R., Skea, J., Slade, R., Al Khourdajie, A., van Diemen, R., McCollum, D., Pathak, M., Some, S., Vyas, P., Fradera, R., et al., Eds.; Cambridge University Press: Cambridge, UK; New York, NY, USA, 2022. [Google Scholar]
  10. Nazari-Sharabian, M.; Ahmad, S.; Karakouzian, M. Climate change and eutrophication: A short review. Eng. Technol. Appl. Sci. Res. 2018, 8, 3668. [Google Scholar] [CrossRef]
  11. Smith, V.H.; Tilman, G.D.; Nekola, J.C. Eutrophication: Impacts of excess nutrient inputs on freshwater, marine, and terrestrial ecosystems. Environ. Pollut. 1999, 100, 179–196. [Google Scholar] [CrossRef]
  12. Mekonnen, M.M.; Hoekstra, A.Y. Anthropogenic nitrogen loads to freshwater: A high-resolution global study. In Just Enough Nitrogen; Springer: Berlin/Heidelberg, Germany, 2020; pp. 303–317. [Google Scholar]
  13. Anderson, N.J.; Heathcote, A.; Engstrom, D.; contributors, G.d. Anthropogenic alteration of nutrient supply increases the global freshwater carbon sink. Sci. Adv. 2020, 6, eaaw2145. [Google Scholar] [CrossRef]
  14. Yamamoto, Y.; Nakahara, H. The formation and degradation of cyanobacterium Aphanizomenon flos-aquae blooms: The importance of pH, water temperature, and day length. Limnology 2005, 6, 1–6. [Google Scholar] [CrossRef]
  15. Paerl, H.W.; Hall, N.S.; Calandrino, E.S. Controlling harmful cyanobacterial blooms in a world experiencing anthropogenic and climatic-induced change. Sci. Total Environ. 2011, 409, 1739–1745. [Google Scholar] [CrossRef] [PubMed]
  16. Yang, J.; Tang, H.; Zhang, X.; Zhu, X.; Huang, Y.; Yang, Z. High temperature and pH favor Microcystis aeruginosa to outcompete Scenedesmus obliquus. Environ. Sci. Pollut. Res. 2018, 25, 4794–4802. [Google Scholar] [CrossRef]
  17. Huisman, J.; Codd, G.A.; Paerl, H.W.; Ibelings, B.W.; Verspagen, J.M.; Visser, P.M. Cyanobacterial blooms. Nat. Rev. Microbiol. 2018, 16, 471–483. [Google Scholar] [CrossRef] [PubMed]
  18. O’Neil, J.M.; Davis, T.W.; Burford, M.A.; Gobler, C.J. The rise of harmful cyanobacteria blooms: The potential roles of eutrophication and climate change. Harmful Algae 2012, 14, 313–334. [Google Scholar] [CrossRef]
  19. Paerl, H.W.; Paul, V.J. Climate change: Links to global expansion of harmful cyanobacteria. Water Res. 2012, 46, 1349–1363. [Google Scholar] [CrossRef] [PubMed]
  20. Elliott, J.A. Is the future blue-green? A review of the current model predictions of how climate change could affect pelagic freshwater cyanobacteria. Water Res. 2012, 46, 1364–1371. [Google Scholar] [CrossRef] [PubMed] [Green Version]
  21. Burford, M.; Carey, C.; Hamilton, D.; Huisman, J.; Paerl, H.; Wood, S.; Wulff, A. Perspective: Advancing the research agenda for improving understanding of cyanobacteria in a future of global change. Harmful Algae 2020, 91, 101601. [Google Scholar] [CrossRef] [PubMed]
  22. Elliott, J.A. The seasonal sensitivity of cyanobacteria and other phytoplankton to changes in flushing rate and water temperature. Glob. Chang. Biol. 2010, 16, 864–876. [Google Scholar] [CrossRef]
  23. Joehnk, K.D.; Huisman, J.; Sharples, J.; Sommeijer, B.; Visser, P.M.; Stroom, J.M. Summer heatwaves promote blooms of harmful cyanobacteria. Glob. Chang. Biol. 2008, 14, 495–512. [Google Scholar] [CrossRef]
  24. Visser, P.M.; Verspagen, J.M.H.; Sandrini, G.; Stal, L.J.; Matthijs, H.C.P.; Davis, T.W.; Paerl, H.W.; Huisman, J. How rising CO2 and global warming may stimulate harmful cyanobacterial blooms. Harmful Algae 2016, 54, 145–159. [Google Scholar] [CrossRef] [PubMed] [Green Version]
  25. Davis, T.W.; Berry, D.L.; Boyer, G.L.; Gobler, C.J. The effects of temperature and nutrients on the growth and dynamics of toxic and non-toxic strains of Microcystis during cyanobacteria blooms. Harmful Algae 2009, 8, 715–725. [Google Scholar] [CrossRef]
  26. You, J.; Mallery, K.; Hong, J.; Hondzo, M. Temperature effects on growth and buoyancy of Microcystis aeruginosa. J. Plankton Res. 2018, 40, 16–28. [Google Scholar] [CrossRef] [Green Version]
  27. Paerl, H.W.; Huisman, J. Climate change: A catalyst for global expansion of harmful cyanobacterial blooms. Environ. Microbiol. Rep. 2009, 1, 27–37. [Google Scholar] [CrossRef]
  28. Paerl, H.W.; Gardner, W.S.; Havens, K.E.; Joyner, A.R.; McCarthy, M.J.; Newell, S.E.; Qin, B.; Scott, J.T. Mitigating cyanobacterial harmful algal blooms in aquatic ecosystems impacted by climate change and anthropogenic nutrients. Harmful Algae 2016, 54, 213–222. [Google Scholar] [CrossRef] [PubMed] [Green Version]
  29. Jacquet, S.; Briand, J.-F.; Leboulanger, C.; Avois-Jacquet, C.; Oberhaus, L.; Tassin, B.; Vinçon-Leite, B.; Paolini, G.; Druart, J.-C.; Anneville, O. The proliferation of the toxic cyanobacterium Planktothrix rubescens following restoration of the largest natural French lake (Lac du Bourget). Harmful Algae 2005, 4, 651–672. [Google Scholar] [CrossRef] [Green Version]
  30. Dokulil, M.T.; Teubner, K. Deep living Planktothrix rubescens modulated by environmental constraints and climate forcing. In Phytoplankton Responses to Human Impacts at Different Scales; Springer: Berlin/Heidelberg, Germany, 2012; pp. 29–46. [Google Scholar]
  31. Legnani, E.; Copetti, D.; Oggioni, A.; Tartari, G.; Palumbo, M.T.; Morabito, G. Planktothrix rubescens’ seasonal dynamics and vertical distribution in Lake Pusiano (North Italy). J. Limnol. 2005, 64, 61–73. [Google Scholar] [CrossRef]
  32. Li, X.; Dreher, T.W.; Li, R. An overview of diversity, occurrence, genetics and toxin production of bloom-forming Dolichospermum (Anabaena) species. Harmful Algae 2016, 54, 54–68. [Google Scholar] [CrossRef] [Green Version]
  33. Madigan, D.J.; Baumann, Z.; Carlisle, A.B.; Hoen, D.K.; Popp, B.N.; Dewar, H.; Snodgrass, O.E.; Block, B.A.; Fisher, N.S. Reconstructing transoceanic migration patterns of Pacific bluefin tuna using a chemical tracer toolbox. Ecology 2014, 95, 1674–1683. [Google Scholar] [CrossRef]
  34. Miner, B.E.; De Meester, L.; Pfrender, M.E.; Lampert, W.; Hairston, N.G., Jr. Linking genes to communities and ecosystems: Daphnia as an ecogenomic model. Proc. R. Soc. B 2012, 279, 1873–1882. [Google Scholar] [CrossRef]
  35. Jüttner, F.; Leonhardt, J.; MöHren, S. Environmental factors affecting the formation of mesityloxide, dimethylallylic alcohol and other volatile compounds excreted by Anabaena cylindrica. Microbiology 1983, 129, 407–412. [Google Scholar] [CrossRef] [Green Version]
  36. Guillard, R.R.; Lorenzen, C.J. Yellow-green algae with chlorophyllide C 1, 2. J. Phycol. 1972, 8, 10–14. [Google Scholar] [CrossRef]
  37. Tonk, L.; Welker, M.; Huisman, J.; Visser, P.M. Production of cyanopeptolins, anabaenopeptins, and microcystins by the harmful cyanobacteria Anabaena 90 and Microcystis PCC 7806. Harmful Algae 2009, 8, 219–224. [Google Scholar] [CrossRef]
  38. Martin, C.; Oberer, L.; Ino, T.; König, W.A.; Busch, M.; Weckesser, J. Cyanopeptolins, new depsipeptides from the cyanobacterium Microcystis sp. PCC 7806. J. Antibiot. 1993, 46, 1550–1556. [Google Scholar] [CrossRef] [PubMed] [Green Version]
  39. Bister, B.; Keller, S.; Baumann, H.I.; Nicholson, G.; Weist, S.; Jung, G.; Süssmuth, R.D.; Jüttner, F. Cyanopeptolin 963A, a chymotrypsin inhibitor of Microcystis PCC 7806. J. Nat. Prod. 2004, 67, 1755–1757. [Google Scholar] [CrossRef]
  40. Portmann, C.; Blom, J.F.; Gademann, K.; Jüttner, F. Aerucyclamides A and B: Isolation and synthesis of toxic ribosomal heterocyclic peptides from the cyanobacterium Microcystis aeruginosa PCC 7806. J. Nat. Prod. 2008, 71, 1193–1196. [Google Scholar] [CrossRef] [PubMed]
  41. Portmann, C.; Blom, J.F.; Kaiser, M.; Brun, R.; Jüttner, F.; Gademann, K. Isolation of aerucyclamides C and D and structure revision of microcyclamide 7806A: Heterocyclic ribosomal peptides from Microcystis aeruginosa PCC 7806 and their antiparasite evaluation. J. Nat. Prod. 2008, 71, 1891–1896. [Google Scholar] [CrossRef]
  42. Martin-Creuzburg, D.; von Elert, E.; Hoffmann, K.H. Nutritional constraints at the cyanobacteria—Daphnia magna interface: The role of sterols. Limnol. Oceanogr. 2008, 53, 456–468. [Google Scholar] [CrossRef] [Green Version]
  43. Bec, A.; Martin-Creuzburg, D.; von Elert, E. Trophic upgrading of autotrophic picoplankton by the heterotrophic nanoflagellate Paraphysomonas sp. Limnol. Oceanogr. 2006, 51, 1699–1707. [Google Scholar] [CrossRef] [Green Version]
  44. Entfellner, E.; Frei, M.; Christiansen, G.; Deng, L.; Blom, J.; Kurmayer, R. Evolution of anabaenopeptin peptide structural variability in the cyanobacterium Planktothrix. Front. Microbiol. 2017, 8, 219. [Google Scholar] [CrossRef]
  45. Kosol, S.; Schmidt, J.; Kurmayer, R. Variation in peptide net production and growth among strains of the toxic cyanobacterium Planktothrix spp. Eur. J. Phycol. 2009, 44, 49–62. [Google Scholar] [CrossRef] [Green Version]
  46. Kurmayer, R.; Blom, J.F.; Deng, L.; Pernthaler, J. Integrating phylogeny, geographic niche partitioning and secondary metabolite synthesis in bloom-forming Planktothrix. ISME J. 2015, 9, 909–921. [Google Scholar] [CrossRef] [PubMed]
  47. Thiel, T.; Pratte, B.S.; Zhong, J.; Goodwin, L.; Copeland, A.; Lucas, S.; Han, C.; Pitluck, S.; Land, M.L.; Kyrpides, N.C. Complete genome sequence of Anabaena variabilis ATCC 29413. Stand. Genom. Sci. 2014, 9, 562–573. [Google Scholar] [CrossRef] [Green Version]
  48. Basen, T.; Martin-Creuzburg, D.; Rothhaupt, K.-O. Role of essential lipids in determining food quality for the invasive freshwater clam Corbicula fluminea. J. N. Am. Benthol. Soc. 2011, 30, 653–664. [Google Scholar] [CrossRef]
  49. Basen, T.; Gergs, R.; Rothhaupt, K.-O.; Martin-Creuzburg, D. Phytoplankton food quality effects on gammarids: Benthic–pelagic coupling mediated by an invasive freshwater clam. Can. J. Fish. Aquat. 2013, 70, 198–207. [Google Scholar] [CrossRef] [Green Version]
  50. Martin-Creuzburg, D.; von Elert, E. Good food versus bad food: The role of sterols and polyunsaturated fatty acids in determining growth and reproduction of Daphnia magna. Aquat. Ecol. 2009, 43, 943–950. [Google Scholar] [CrossRef] [Green Version]
  51. Martin-Creuzburg, D.; Merkel, P. Sterols of freshwater microalgae: Potential implications for zooplankton nutrition. J. Plankton Res. 2016, 38, 865–877. [Google Scholar] [CrossRef] [Green Version]
  52. Elert, E.V.; Martin-Creuzburg, D.; Le Coz, J.R. Absence of sterols constrains carbon transfer between cyanobacteria and a freshwater herbivore (Daphnia galeata). Proc. R. Soc. B 2003, 270, 1209–1214. [Google Scholar] [CrossRef] [Green Version]
  53. Schlotz, N.; Roulin, A.; Ebert, D.; Martin-Creuzburg, D. Combined effects of dietary polyunsaturated fatty acids and parasite exposure on eicosanoid-related gene expression in an invertebrate model. Comp. Biochem. Physiol. Part A Mol. Integr. Physiol. 2016, 201, 115–123. [Google Scholar] [CrossRef] [Green Version]
  54. Piepho, M.; Martin-Creuzburg, D.; Wacker, A. Simultaneous effects of light intensity and phosphorus supply on the sterol content of phytoplankton. PLoS ONE 2010, 5, e15828. [Google Scholar] [CrossRef]
  55. Amini Khoeyi, Z.; Seyfabadi, J.; Ramezanpour, Z. Effect of light intensity and photoperiod on biomass and fatty acid composition of the microalgae, Chlorella vulgaris. Aquac. Int. 2012, 20, 41–49. [Google Scholar] [CrossRef]
  56. Hobson, K.A.; Clark, R.G. Assessing avian diets using stable isotopes I: Turnover of 13C in tissues. Condor 1992, 94, 181–188. [Google Scholar] [CrossRef] [Green Version]
  57. Tibshirani, R.; Walther, G.; Hastie, T. Estimating the number of clusters in a data set via the gap statistic. J. R. Stat. Soc. B Stat. Methodol. 2001, 63, 411–423. [Google Scholar] [CrossRef]
  58. Webb, S.; Hedges, R.; Simpson, S. Diet quality influences the C-13 and N-15 of locusts and their biochemical components. J. Exp. Biol. 1998, 201, 2903–2911. [Google Scholar] [CrossRef]
  59. Oelbermann, K.; Scheu, S. Stable isotope enrichment (δ 15N and δ 13C) in a generalist predator (Pardosa lugubris, Araneae: Lycosidae): Effects of prey quality. Oecologia 2002, 130, 337–344. [Google Scholar] [CrossRef]
  60. Doi, H.; Akamatsu, F.; González, A.L. Starvation effects on nitrogen and carbon stable isotopes of animals: An insight from meta-analysis of fasting experiments. R. Soc. Open Sci. 2017, 4, 170633. [Google Scholar] [CrossRef] [Green Version]
  61. Adams, T.S.; Sterner, R.W. The effect of dietary nitrogen content on trophic level 15N enrichment. Limnol. Oceanogr. 2000, 45, 601–607. [Google Scholar] [CrossRef]
  62. Hobson, K.A.; Alisauskas, R.T.; Clark, R.G. Stable-nitrogen isotope enrichment in avian tissues due to fasting and nutritional stress: Implications for isotopic analyses of diet. Condor 1993, 95, 388–394. [Google Scholar] [CrossRef]
  63. Doi, H.; Kikuchi, E.; Takagi, S.; Shikano, S. Changes in carbon and nitrogen stable isotopes of chironomid larvae during growth, starvation and metamorphosis. Rapid Commun. Mass Spectrom. 2007, 21, 997–1002. [Google Scholar] [CrossRef]
  64. Gorokhova, E.; Hansson, S. An experimental study on variations in stable carbon and nitrogen isotope fractionation during growth of Mysis mixta and Neomysis integer. Can. J. Fish. Aquat. 1999, 56, 2203–2210. [Google Scholar] [CrossRef]
  65. Minagawa, M.; Wada, E. Stepwise enrichment of 15N along food chains: Further evidence and the relation between δ 15N and animal age. Geochim. Cosmochim. Acta 1984, 48, 1135–1140. [Google Scholar] [CrossRef]
  66. Petkov, G.; Garcia, G. Which are fatty acids of the green alga Chlorella? Biochem. Syst. Ecol. 2007, 35, 281–285. [Google Scholar] [CrossRef]
  67. Rosa, A.P.C.d.; Moraes, L.; Morais, E.G.d.; Costa, J.A.V. Fatty acid biosynthesis from Chlorella in autotrophic and mixotrophic cultivation. Braz. Arch. Biol. Technol. 2020, 63, e20180534. [Google Scholar] [CrossRef]
  68. Raya, I.; Anshar, A.M.; Mayasari, E.; Dwiyana, Z.; Asdar, M. Chorella vulgaris and Spirulina platensis: Concentration of protein, Docosahexaenoic Acid Chorella (DHA), Eicosapentaenoic Acid (EPA) and variation concentration of maltodextrin via microencapsulation method. Int. J. Appl. Chem. 2016, 12, 539–548. [Google Scholar]
  69. Tokuşoglu, Ö.; Üunal, M. Biomass nutrient profiles of three microalgae: Spirulina platensis, Chlorella vulgaris, and Isochrisis galbana. J. Food Sci. 2003, 68, 1144–1148. [Google Scholar] [CrossRef]
  70. Rismani, S.; Shariati, M. Changes of the total lipid and omega-3 fatty acid contents in two microalgae Dunaliella salina and Chlorella vulgaris under salt stress. Braz. Arch. Biol. Technol. 2017, 60, e17160555. [Google Scholar] [CrossRef] [Green Version]
  71. Martin-Creuzburg, D.; Sperfeld, E.; Wacker, A. Colimitation of a freshwater herbivore by sterols and polyunsaturated fatty acids. Proc. R. Soc. B 2009, 276, 1805–1814. [Google Scholar] [CrossRef] [Green Version]
  72. Ahlgren, G.; Gustafsson, I.B.; Boberg, M. Fatty acid content and chemical composition of freshwater microalgae. J. Phycol. 1992, 28, 37–50. [Google Scholar] [CrossRef]
  73. Volkman, J. Sterols in microorganisms. Appl. Microbiol. Biotechnol. 2003, 60, 495–506. [Google Scholar] [CrossRef]
  74. Carmichael, W.W. The toxins of cyanobacteria. Sci. Am. 1994, 270, 78–86. [Google Scholar] [CrossRef]
  75. Boag, B.; Neilson, R.; Scrimgeour, C.M. The effect of starvation on the planarian Arthurdendyus triangulatus (Tricladida: Terricola) as measured by stable isotopes. Biol. Fertil. Soils 2006, 43, 267–270. [Google Scholar] [CrossRef]
  76. Gaye-Siessegger, J.; Focken, U.; Muetzel, S.; Abel, H.; Becker, K. Feeding level and individual metabolic rate affect δ 13C and δ 15N values in carp: Implications for food web studies. Oecologia 2004, 138, 175–183. [Google Scholar] [CrossRef] [PubMed]
  77. Gaye-Siessegger, J.; Focken, U.; Abel, H.; Becker, K. Starvation and low feeding levels result in an enrichment of 13C in lipids and 15N in protein of Nile tilapia Oreochromis niloticus L. J. Fish Biol. 2007, 71, 90–100. [Google Scholar] [CrossRef]
  78. Ambrose, S.H.; DeNiro, M.J. The isotopic ecology of East African mammals. Oecologia 1986, 69, 395–406. [Google Scholar] [CrossRef]
  79. Müller-Navarra, D.C.; Brett, M.T.; Liston, A.M.; Goldman, C.R. A highly unsaturated fatty acid predicts carbon transfer between primary producers and consumers. Nature 2000, 403, 74–77. [Google Scholar] [CrossRef]
  80. Masclaux, H.; Richoux, N.B. Effects of temperature and food quality on isotopic turnover and discrimination in a cladoceran. Aquat. Ecol. 2017, 51, 33–44. [Google Scholar] [CrossRef]
  81. Ek, C.; Karlson, A.M.; Hansson, S.; Garbaras, A.; Gorokhova, E. Stable isotope composition in Daphnia is modulated by growth, temperature, and toxic exposure: Implications for trophic magnification factor assessment. Environ. Sci. Technol. 2015, 49, 6934–6942. [Google Scholar] [CrossRef]
  82. Mohan, J.A.; Smith, S.D.; Connelly, T.L.; Attwood, E.T.; McClelland, J.W.; Herzka, S.Z.; Walther, B.D. Tissue-specific isotope turnover and discrimination factors are affected by diet quality and lipid content in an omnivorous consumer. J. Exp. Mar. Biol. Ecol. 2016, 479, 35–45. [Google Scholar] [CrossRef]
  83. Kurmayer, R.; Jüttner, F. Strategies for the co-existence of zooplankton with the toxic cyanobacterium Planktothrix rubescens in Lake Zurich. J. Plankton Res. 1999, 21, 659–683. [Google Scholar] [CrossRef]
  84. Brzeziński, T.; Czub, M.; Nawała, J.; Gordon, D.; Dziedzic, D.; Dawidziuk, B.; Popiel, S.; Maszczyk, P. The effects of chemical warfare agent Clark I on the life histories and stable isotopes composition of Daphnia magna. Environ. Pollut. 2020, 266, 115142. [Google Scholar] [CrossRef]
  85. Shaw-Allen, P.L.; Romanek, C.S.; Bryan, A.L.; Brant, H.; Jagoe, C.H. Shifts in Relative Tissue δ 15N Values in Snowy Egret Nestlings with Dietary Mercury Exposure: A Marker for Increased Protein Degradation. Environ. Sci. Technol. 2005, 39, 4226–4233. [Google Scholar] [CrossRef] [PubMed]
  86. Baird, D.J.; Barber, I.; Calow, P. Clonal Variation in General Responses of Daphnia magna Straus to Toxic Stress. I. Chronic Life-History Effects. Funct. Ecol. 1990, 4, 399–407. [Google Scholar] [CrossRef]
  87. Arzate-Cárdenas, M.A.; Martínez-Jerónimo, F. Energy reserve modification in different age groups of Daphnia schoedleri (Anomopoda: Daphniidae) exposed to hexavalent chromium. Environ. Toxicol. Pharmacol. 2012, 34, 106–116. [Google Scholar] [CrossRef] [PubMed]
  88. Staaden, S.; Milcu, A.; Rohlfs, M.; Scheu, S. Fungal toxins affect the fitness and stable isotope fractionation of Collembola. Soil Biol. Biochem. 2010, 42, 1766–1773. [Google Scholar] [CrossRef]
  89. Pawlik-Skowrońska, B.; Bownik, A. Cyanobacterial anabaenopeptin-B, microcystins and their mixture cause toxic effects on the behavior of the freshwater crustacean Daphnia magna (Cladocera). Toxicon 2021, 198, 1–11. [Google Scholar] [CrossRef] [PubMed]
  90. Pawlik-Skowrońska, B.; Bownik, A. Synergistic toxicity of some cyanobacterial oligopeptides to physiological activities of Daphnia magna (Crustacea). Toxicon 2022, 206, 74–84. [Google Scholar] [CrossRef]
  91. Padisák, J.; Barbosa, F.; Koschel, R.; Krienitz, L. Deep layer cyanoprokaryota maxima in temperate and tropical lakes. Arch. Hydrobiol. Spec. Issues Adv. Limnol. 2003, 58, 175–199. [Google Scholar]
  92. Kirk, K.L.; Gilbert, J.J. Variation in herbivore response to chemical defenses: Zooplankton foraging on toxic cyanobacteria. Ecology 1992, 73, 2208–2217. [Google Scholar] [CrossRef]
  93. Ger, K.A.; Hansson, L.A.; Lürling, M. Understanding cyanobacteria-zooplankton interactions in a more eutrophic world. Freshw. Biol. 2014, 59, 1783–1798. [Google Scholar] [CrossRef] [Green Version]
  94. Gliwicz, Z.M. Why do cladocerans fail to control algal blooms? In Biomanipulation Tool for Water Management; Springer: Dordrecht, The Netherlands, 1990; pp. 83–97. [Google Scholar]
  95. Porter, K.G.; McDonough, R. The energetic cost of response to blue-green algal filaments by cladocerans 1. Limnol. Oceanogr. 1984, 29, 365–369. [Google Scholar] [CrossRef]
  96. Brendelberger, H. Filter mesh size of cladocerans predicts retention efficiency for bacteria. Limnol. Oceanogr. 1991, 36, 884–894. [Google Scholar] [CrossRef]
  97. Holm, N.P.; Ganf, G.G.; Shapiro, J. Feeding and assimilation rates of Daphnia pulex fed Aphanizomenon flos-aquae. Limnol. Oceanogr. 1983, 28, 677–687. [Google Scholar] [CrossRef]
  98. Schwarzenberger, A.; Kurmayer, R.; Martin-Creuzburg, D. Toward Disentangling the Multiple Nutritional Constraints Imposed by Planktothrix: The Significance of Harmful Secondary Metabolites and Sterol Limitation. Front. Microbiol. 2020, 11, 586120. [Google Scholar] [CrossRef] [PubMed]
Figure 1. Mortality rate (%) for D. magna with the M. aeruginosa dietary treatment over a time period of 96 h following the dietary switch.
Biology 11 01816 g001
Figure 2. Carbon isotopic change in D. magna tissue shown as a function of time (hours) after changes to isotopically distinct captive diet types (or during starvation). The colored lines represent the signatures of the associated diet while the black lines represent the time-based exponential (DI) or linear (AC,J) model fits. The letters represent statistical differences for the δ 13C values of the different timepoints.
Biology 11 01816 g002
Figure 3. Nitrogen isotopic changes in D. magna tissue shown as a function of time (hours) after changes to the isotopically distinct captive diet types (or during starvation). The colored lines represent the signatures of the associated diets while the black lines represent the polynomial trendlines (AF) or linear trendlines (GJ). The letters represent statistical differences for the δ 15N values of the different timepoints.
Biology 11 01816 g003
Figure 4. Changes in isotopic signatures of D. magna tissues over time (96–0 h after diet change) in the different dietary treatments.
Biology 11 01816 g004
Figure 5. Discrimination factor (Δ) values for stable carbon and nitrogen isotopes 96 h (M. aeruginosa 72 h) after the dietary switch.
Biology 11 01816 g005
Figure 6. A cluster analysis (k-means) of the δ 13C and Δ13C values of D. magna fed with different dietary sources after 96 h (for M. aeruginosa after 72 h). Cluster 1 (blue) represents the cyanobacterial diet for T. variabilis and S. elongatus (both strains); cluster 2 (turquoise) represents D. magna fed on M. aeruginosa, P. rubescens, and P. agardhii; cluster 3 is shown in green and is formed by the chlorophytes A. obliquus, C. klinobasis, and C. vulgaris; and cluster 4 (violet) is formed by starving D. magna samples.
Biology 11 01816 g006
Table 1. Phytoplankton species used as dietary sources for Daphnia and their respective origin, toxicity, polyunsaturated fatty acid (PUFA), and sterol provisioning information.
PhytoplanktonOriginToxic
(+) Yes
(−) No
PUFAs
(+) Yes
(−) No
Potentially Relevant PUFAsSterols
(+) Yes
(−) No
Potentially Relevant Phytosterols
Microcystis aeruginosaPCC 7806(+) [37,38,39,40,41]<C 18 (+) [42]
>C 18 (−) [42,43]
ALA [42,43]
SDA [42]
(−) [42](−) [42]
Planktothrix rubescens No 91/1MON (isolated Mondsee 2001, Kurmayer)(+) [41,44,45,46]no info.no info.no info.no info.
Planktothrix agardhii No 829MON (isolated Russland 2008, Kurmayer)(+) [41,44]no info.no info.no info.no info.
Trichormus variabilis P9ATCC 29413(−) [47]<C 18 (+) [42,48]
>C 18 (−) [42,49]
ALA [42,48,49]
SDA [42,49]
(−) [42](−) [42]
Synechococcus elongatus Bo 8801 (green)KON 76 (isolated Lake Constance)no info.(−) [42,48,49] *(−) [42,48,49] *(−) [42,50] *(−) [42,50] *
Synechococcus elongatus Bo 8809 (red)KON 77 (isolated Lake Constance)no info.(−) [42,48,49] *(−) [42,48,49] *(−) [42,50] *(−) [42,50] *
Acutodesmus obliquusSAG 276-3ano info.<C 18 (+) [42,48]
>C 18 (−) [49]
ALA [48]
SDA [48]
(+) [51,52]chondrillasterol [51]
fungisterol [51]
22-dihydrochondrillasterol [51]
Chlamydomonas klinobasisKON 56 (isolated lake constance)no info.>C 18 (−) [53]ALA [53](+) [51,54]ergosterol [51]
7-dehydroporiferasterol [51]
Chlorella vulgarisKON 65 (isolated lake constance)no info.<C 18 (+) [55]
>C 18 (+) [55] *
ALA [55] *
EPA [55] *
DHA [55] *
(+) [51]ergosterol [51] *
fungisterol [51] *
PUFAs = polyunsaturated fatty acids; * = not the same strain; no info. = no information known.
Table 2. Mean (±SE) stable isotope values and C/N ratio of each phytoplankton species used as a dietary source for the diet switch experimental setup.
Dietδ 13Cδ 15NC/N Ratio
A. obliquus (Cyano-Medium)−25.59 ± 0.093.10 ± 0.012.86 ± 0.16
M. aeruginosa−32.28 ± 0.184.65 ± 0.853.43 ± 1.22
P. agardhii−32.80 ± 0.175.26 ± 1.353.10 ± 0.65
P. rubescens−34.35 ± 0.154.99 ± 0.362.74 ± 0.20
T. variabilis−31.44 ± 0.223.43 ± 0.172.50 ± 0.06
S. elongatus (green)−30.53 ± 0.163.83 ± 0.122.75 ± 0.21
S. elongatus (red)−30.40 ± 0.084.32 ± 0.352.56 ± 0.21
A. obliquus−32.99 ± 0.182.80 ± 0.232.19 ± 0.09
C. klinobasis−32.05 ± 0.102.75 ± 0.482.63 ± 0.15
C. vulgaris−32.08 ± 0.043.63 ± 0.122.89 ± 0.21
Table 3. A comparison of the δ 13C values for the diet and D. magna at the end of the experimental timeframe (96 h, and for M. aeruginosa 72 h) (*** = < 0.001; ** = <0.01 & > 0.001; * = < 0.05 and > 0.01).
DiettdfSignificance LevelStatistical TestSignificance Level
M. aeruginosa48.3362***Paired t-test***
P. agardhii−50.8032***
P. rubescens−40.072***
S. elongatus (green)−10.8772**Paired Wilcoxon test**
S. elongatus (red)−20.3852**
T. variabilis−11.7462**
A. obliquus−13.1832**Paired Wilcoxon test**
C. klinobasis−8.85522*
C. vulgaris−3.61042n.s.
Table 4. Parameter estimates and standard errors of the linear and exponential decay function fitted to the δ 13C values of D. magna samples fed on different dietary sources over an experimental time period of 96 h and a comparison with Akaike’s Information criterion corrected for the small sample size (ΔAICc). Here, δ0 it the initial isotopic ratio of the experiment, δeq is the asymptote (plateau) of the isotopic ratio, and λ is the incorporation rate of δ 13C. The models were fitted using a time-based model for each dietary source (n = 3) and for pooled data for the three diets (n = 9), respectively. E = exponential decay model; L = linear decay model.
Time (h)Dietδ0δeqlogλλAICAICHalf-Life δ 13C
96T. variabilis−26.64 ± 0.03−28.89 ± 0.03−3.39 ± 0.050.034−18.28 (E)27.2320.4627.63
96S. elongatus (green)−26.58 ± 0.18−28.92 ± 1.20−4.39 ± 0.870.0130.95 (E)5.8455.69
96S. elongatus (red)−26.63 ± 0.05−29.01 ± 0.07−3.54 ± 0.080.029−13.18 (E)21.2423.78
96A. obliquus−26.70 ± 0.41−32.64 ± 1.26−3.99 ± 0.450.0198.78 (E)4.637.2835.52
96C. klinobasis−26.65 ± 0.22−32.38 ± 0.60−3.91 ± 0.230.0202.67 (E)10.5234.48
96C. vulgaris−26.65 ± 0.33−32.68 ± 0.91−3.92 ± 0.340.0206.60 (E)7.3435.02
72M. aeruginosa −6.05 (L) -
96P. agardhii 11.05 (L)
96P. rubescens 17.74 (L)
Publisher’s Note: MDPI stays neutral with regard to jurisdictional claims in published maps and institutional affiliations.

