Simple Summary
United State (US) military members have increasing obesity rates that threaten human performance optimization. This study focused on a mostly officer population attending graduate school at the US Command and General Staff College and measured obesity, fitness, and self-rated health. Almost 80% of the 136 participants were officers; 18.5–39.7% were obese depending on which measure was used, and obesity rates differed by sex. When using body fat percentage as the standard (since it directly estimates body fat), obesity was underestimated by other measurements including body mass index (a ratio of height to weight), waist circumference, and waist to height ratio. Soldiers who were obese were much more likely to fail the Army fitness test and reported lower self-rated health than non-obese soldiers. Sample obesity rates were higher than previous studies, especially for women soldiers. To optimize human performance among USA military officers, interventions are needed to lower obesity rates and improve self-rated health.
Abstract
Increasing obesity rates among USA military members vary by age, pay grade, and measurement methods and threaten force fitness and readiness. Limited research has directly measured obesity among officers; those enrolled in graduate school at the Command and General Staff College (CGSC) face additional demands and increased obesity risk. This study compared obesity measurements and performance on the Army Physical Fitness test and self-rated health for a sample of mostly CGSC officers. Participants (n = 136, 75.7% male, 79.6% officers) completed body composition measures; BMI, body fat percentage (BF%), waist circumference (WC), and waist-to-height ratio (WHtR) estimated obesity rates and were compared for discordance. Army Physical Fitness Test pass/fail rates and self-reported perceived health were compared with each obesity classification. Obesity prevalence was 18.5–39.7%, differing by sex and measure. BMI, WC, and WHtR underestimated obesity compared to BF% at least 21% of the time. WHtR had the lowest discordance with BF%. Soldiers categorized as obese were significantly more likely to fail the fitness test and report lower self-rated health than non-obese soldiers. Overall, obesity rates among our primarily officer sample were higher than previous studies, particularly for women. Interventions to address obesity are necessary among military officers to optimize human performance.
1. Introduction
Like the United States (US) civilian population [1], obesity has been increasing among active-duty military personnel and National Guard/Reserve members [2,3]. Over 14% of the US Army is now considered obese according to the latest Department of Defense (DoD) Health Related Behaviors Survey (HRBS), which calculated body mass index (BMI) from respondents’ self-reported height and weight [2]. National Guard/Reserve men had higher levels of obesity compared to their active duty counterparts, veterans, and civilians [3]. However, rates of obesity are not uniform across the Army, with both increases in pay grade and age associated with higher rates of overweight and obesity [2]. Limited research has examined directly measured body composition among US Army officers, who face different challenges than enlisted soldiers [4,5].
Obesity poses a threat to national security partly through its association with immunologic dysfunction [6] as well as its negative association with optimal human performance that threaten operational readiness [7]. Each US service branch has unique fitness and weight standards [7], and it is standard practice in the Army and other branches of the military to use BMI as a measure of body composition. Soldiers failing to meet BMI standards are subjected to a tape test that includes neck and waist circumference (WC), as well as hip circumference for women [8]. WC alone is often used to indicate increased obesity-related health risks from central adiposity [9]. Besides its utility for indicating obesity, waist to height ratio (WHtR) has been proposed to better predict cardiometabolic risk (e.g., diabetes, hypertension, and cardiovascular disease) over both BMI and WC [10,11]. Yet, limited research has examined WHtR among US military personnel [12,13]. Finally, as a direct estimate of adiposity, body fat percentage (BF%) is easily measured in the field using bioelectrical impedance analysis (BIA) [14].
Among US Air Force personnel, WC and BMI underestimated obesity in relation to BF% via BIA [15]. In particular, false negative rates for WC and BMI ranged from 35% (WC in men) to 78% (BMI in women) [15]. Among active duty US military personnel, BMI in combination with WC was satisfactory at best in assessing obesity in comparison with BIA [16]. This could be attributed to the fact that BMI and WC evaluate longitudinal and transversal body dimensions as well as body mass relative to body size (kg per each m2 of body size) [17]. It is imperative that researchers consider assessing both anthropometric and body composition metrics to model adiposity in military fitness field studies, as relationships between these measures may vary depending on the study’s population. Further, it is important to examine under-studied populations such as officers in the military to appropriately inform tailored health promotion efforts.
Military officers enrolled in graduate school at the US Command and General Staff College (CGSC) complete a minimum of a 10-month degree program, with a variety of degree options [18]. Due to the accelerated nature of the program, officers are under considerable stress to perform well academically while also balancing personal and family demands [19]. At the time of this study, all officers were required to pass the Army Physical Fitness Test (APFT) prior to and upon completion of the academic program in order to participate and subsequently to graduate [20]. Yet, physical training requirements have varied over time for CGSC students from no official requirements to 5 days per week of group physical training depending on the policies of the Commanding General at Fort Leavenworth (email communication with David B. Batchelor, MS, COL-Retired, 10 July 2021). However, over half of military officers report that work commitments get in the way of exercising [21].
Although it is well-established that both exercise and dietary habits directly influence body composition, body composition alone does not directly predict health. Another useful metric is self-rated health, which is the cognitive interpretation of an individual’s physiological, psychological, and social status [22]. Among healthy US adults, self-rated health has a significant negative linear relationship with measured obesity based on BMI [23]. In previous research with the general US Army population, higher self-rated health was significantly related to lower BMI and higher APFT scores [22].
As part of a cluster-randomized clinical trial (CRCT) that primarily enrolled military officers from CGSC, we directly estimated obesity prevalence with common measurements (i.e., BMI, WC, WHtR, and BF%), and examined APFT scores by obesity status. The aim of this paper was to examine agreement in obesity prevalence for each measure and compare them with both APFT performance and self-rated health to provide a novel picture of the selected population. We hypothesized that anthropometric measures such as BMI, WC, and WHtR would underestimate obesity in comparison to BF%. We also hypothesized that obese participants would have significantly higher fail rates on the APFT and would report lower self-rated health compared to non-obese participants.
2. Materials and Methods
2.1. Study Design and Participants
This study used baseline data from a large five-year CRCT, the Army Training at High Intensity Study (ATHIS), one of the largest ever conducted to assess outcomes of the Army’s training program compared to a high-intensity functional training intervention among Army officers, an often-understudied population [24]. Participants were primarily recruited from the CGSC and Combined Arms Center at Fort Leavenworth, KS (n = 115) due to the installation’s willingness to collaborate with the research team and the fact that the population would remain at the same post over the study period. To meet additional recruitment needs, a smaller number of National Guard and Reserves personnel (n = 21, 23.8% Officers) were also recruited in Manhattan, KS. Inclusion criteria included being active duty US military personnel with no contraindications via the physical activity readiness questionnaire (PAR-Q) [25]; willingness to adhere to study protocols and assessments; and high likelihood of assignment to the same post over the 8 ± 1 month study period. Participants were excluded if they were on temporary or permanent medical profile, had any medical condition or injury preventing exercise participation, had a pacemaker or other implanted/internal electrical medical device, were on administrative leave or assigned to administrative duties, or were pregnant or lactating (women only). Participants were recruited and randomized in clusters due to the class groupings inherent at CGSC (i.e., Staff Groups who spent considerable time together in class) and the study was powered to detect a 1% change in BF%. A total of 30 clusters (or 15/condition), with an average of 5 units (soldiers) per cluster were recruited for a total of 136 participants (103 men, 33 women) enrolled over four years. Given our study sample size, we had greater than 0.8 power to detect a relationship between body composition measures of R2 = 0.063. The study received ethics approval (#7162) from Kansas State University and administrative approval from the US Army CGSC Quality Assurance Office. All study participants provided written informed consent prior to their involvement in the study.
2.2. Measures and Procedures
All body composition assessments (Testing Session 1) were conducted between 0500–0800 and a private assessment area or privacy screen was available, as needed. Eligible participants were emailed a copy of the consent form and pre-assessment instructions that included to drink ample fluids 24 h prior to testing; refrain from alcohol and strenuous exercise 24 h prior to testing; and refrain from consuming food, beverages, caffeine, and tobacco 3 h prior to testing. Immediately before the body composition assessment, they were asked to empty their bladder.
Participants first completed written informed consent and stood for about 5 min for proper body water distribution. After removing their shoes and socks, participant height was measured with a stadiometer to the nearest 0.1 cm. This was followed by weight to the nearest 0.1 kg, fat mass (kg), BF%, and fat free mass (kg) via the Tanita TBF-310 (Tanita, Corp., Tokyo, Japan). This single frequency foot-to-foot BIA sends a 50 Hz current through the legs and estimates the fat-free mass based on the resistance posed along the way. The body fat mass presents the difference between the body mass and fat-free mass [26]. The Tanita 310 has demonstrated strong evidence of concurrent validity for estimated BF% (r = 0.94; p < 0.001) when compared to dual-energy X-ray absorptiometry (DEXA) [27]. Moreover, it was reported to be a valid tool for the assessment of BF% in clinical trials [28,29]. All surfaces were sanitized before and after each participant using disinfectant wipes.
BMI (kg/m2) was calculated from measured weight and height. WC was taken three times to the nearest 0.1 cm using standardized landmarks with a spring-loaded tape measure [30] and was used to calculate WHtR (WC in cm/height in cm) for each participant.
Participants were emailed a link to an online Qualtrics survey (Provo, UT, USA) after completing the session. They were asked to complete the survey within the next two weeks and up to three email reminders were sent to encourage survey completion. The survey was used to collect demographic information (i.e., age, sex, race, ethnicity, and rank) and self-rated health (i.e., Would you say that in general your health is: Excellent, Very good, Good, Fair, or Poor?) for each participant. The self-rated health question was from the Behavioral Risk Factor Surveillance System and has shown high levels of reliability and validity across multiple studies [31].
Fitness assessments (Testing Session 2) were conducted between 0500–0900 at an outdoor rubberized 400 m track. Participants received the same pre-assessment instructions as for Testing Session 1. Participants completed the APFT to the Army standards at the time of the study [32]. Research assistants trained by a retired Army drill sergeant scored each participant on each event. Participants were instructed to warm-up on their own as they would for a typical APFT. They were then read the standardized instructions and given a visual demonstration for the 2 min push-up test, assigned a scorer and then timed for repetitions. After at least 10 min rest, participants were read the instructions and given a visual demonstration for the 2 min sit-up test. They were assigned a scorer and paired where the second participant secured their feet during the 2 min test for repetitions. After at least 10 min rest, participants were read the standardized instructions for the 2-mile run. They lined up on a rubberized running track and the time it took to complete 2 miles was recorded. Alternate aerobic events were not allowed.
2.3. Statistical Analysis
All analyses were conducted with the R 4.0.2 programming language [33]. Visualizations were created with the GGPLOT2 package [34]. For initial data visualization, scatterplots with LOESS curves (an algorithm which uses local weighted regression to fit a smooth curve through points in a scatter plot) were used to show the relationship between the body composition measures stratified by gender. Next, rates of obesity and discordance among measures were created based on recommended cut-off scores. Discordance was defined by the off diagonal of a 2x2 table comparing classification rates (i.e., percent of participants not categorized the same). The strength of the relationship was defined as no relationship (r < 0.25), weak (0.25 < r < 0.5), moderate (0.5 < r < 0.75), and strong (r > 0.75). AFPT total scores were determined with a calculator provided by https://apftscore.com/ (accessed on 8 September 2020); where fail rates (i.e., scoring less than 60 points per event or 180 points total) [32] were calculated. Finally, the relationship between obesity classification (i.e., obese versus not) based on the four body composition measures and measures of fitness and self-rated health were determined using Welch t-tests or chi-square tests, depending on the outcome.
3. Results
3.1. Demographic Characteristics
Complete characteristics of the 136 participants are presented in Table 1. Participant ages ranged from 19 to 47 years, with 87.5% 30 years and older, reflecting the demographics of the CGSC at Fort Leavenworth. Most were White, Non-Hispanic and had a military rank/paygrade of O1–O3 (junior officers; 46.3%) or O4–O10 (senior officers; 33.3%). Overall, 18.5% of the participants were classified as obese (according to BMI; 21.4% male, 9.4% female).

Table 1.
Sample characteristics by sex.
3.2. Obesity Classification Comparisons
3.2.1. Relationships among Body Composition Measures
Figure 1 presents relationships among body composition measures stratified by gender. BMI, WC and WHtR demonstrated strong positive linear relationships. Moderate to strong relationships were found for all pair-wise comparisons, particularly for males. For women, the weakest relationships were found for WtHR and BF% (R2 = 0.50) and WC to BMI (R2 = 0.59) and their Loess curves suggested that the relationships were not linear throughout the distribution of these measures.
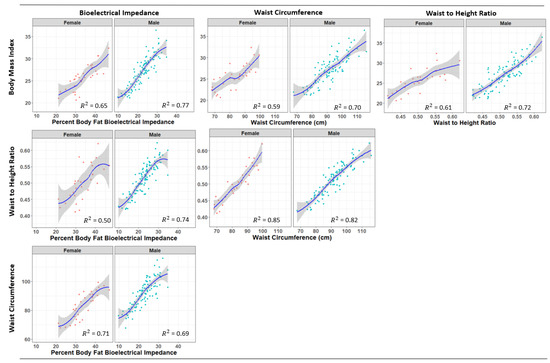
Figure 1.
Loess curves for the relationships among measures of body composition by sex.
3.2.2. Rates of Obesity by Body Composition Measures
Obesity percentages by body composition measure are presented in Table 2. In general, the lowest percentage of participants were classified as obese when they were assessed by BMI. This was followed by WC and WHtR, respectively, while the BF% obtained by BIA revealed the largest percentage of obese participants. These differences were particularly pronounced for women, where obesity rates were the lowest for BMI, followed by WHtR, WC, and BF%. Obesity percentages increased with age for all measures. For instance, based on categorization by WHtR, percent of obesity for those in the 40–49 age category was 4.8 times that of those in the 19–29 age category.
Table 2.
Obesity prevalence evaluated using different measures relative to sex, age, and military rank.
We examined pair-wise rates of discordance (i.e., the total percentage not categorized identically on two measures) among the different body composition measures. Discordance was lowest for WHtR vs. WC (12.6) and highest for BMI and BF% (25.2). Considering obesity as defined by BF%, WHtR showed the lowest discordance (21.0), followed by WC (23.0) and BMI (25.2), respectively.
3.2.3. Obesity Classification and APFT Scores
Mean scores on the APFT by obesity classification method for non-obese and obese participants are presented in Figure 2. Those who were categorized as obese by all four body composition measures had significantly higher APFT fail rates. However, differences by classification were particularly large for BMI (mean difference = 11.1%) and WHtR (mean difference = 10.5%) defined obesity.
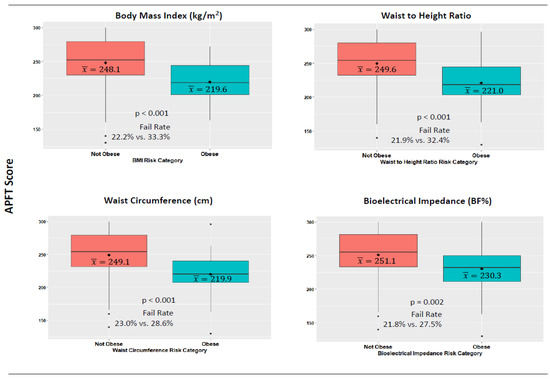
Figure 2.
Body composition risk categories and performance on the army physical fitness test. Note: The diamond within each boxplot denotes the mean value.
3.2.4. Obesity Classification and Self-Rated Health
Figure 3 contains self-rated health by obesity classification. For each body composition measure, participants who were categorized as obese had significantly lower health ratings than those who were not obese. However, the relationship was particularly strong for both WHtR (χ2 = 7.34, p < 0.01) and BF% (χ2 = 15.0, p < 0.01). For BF%, participants categorized as not obese were more likely to rate their health as “Excellent” or “Very Good” (66.6%) compared to those categorized as obese (29.1%).
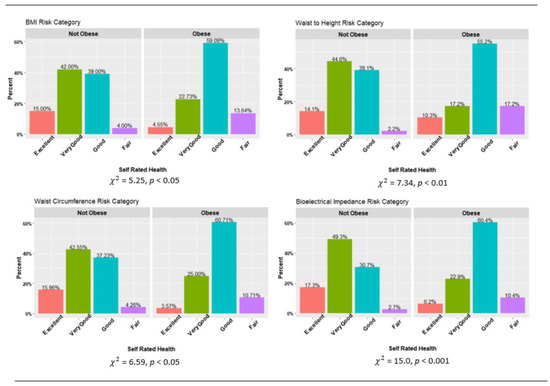
Figure 3.
Body composition risk categories and self-rated health. Note: Chi square analyses based on dichotomizing Self Rated Health as Excellent/Very Good vs. Good/Fair.
4. Discussion
This study is, to our knowledge, the first to examine obesity primarily among US military officers. This study also investigated the utilization of four measures (BMI, WC, WHtR, and BF%) to evaluate obesity prevalence in the field setting and evaluated the discordance rates between the measures. In addition, we investigated the relationships between pass/fail rates on the APFT by obesity classification and differences in self-rated health for obese and non-obese participants to examine relationships with human performance and health. As hypothesized, common measures used by the military such as BMI and WC, as well as the newer measure of WHtR, underestimated obesity when compared to BF% at least 21% of the time. Additionally, as hypothesized, participants who were classified as obese were significantly more likely to fail the APFT than those who were not obese across all obesity measurements, and obese participants had significantly lower self-rated health than those who were not obese.
Over 80% of our sample were mid-career officers. In theory, active-duty military personnel should possess good health and physical performance, and previous research has found obesity rates are significantly lower among officers than enlisted soldiers [21]. However, our results suggest that between 18.5–31.7% of all participants were obese depending on the measure used, with rates as high as 69.7% among subgroups. Except for BMI, obesity rates were higher in female compared to male participants and obesity rates were higher in each consecutively older age category. Our sample’s BMI-derived obesity rate was 5.8% higher than found by Reyes-Guzman et al. [35]. Additionally in our sample, men had 5.5% higher and women 1.4% higher obesity rates than found by Meadows et al. [21]. However, in comparison to the general adult population of the United States [36], our sample had about a 23.9% lower obesity rate overall.
Although the perception might be that BMI would overestimate obesity due to greater muscle mass among military personnel [37], in our sample BMI underestimated obesity similar to previous military research [15]. For WHtR, we found a 1.5% lower obesity rate for male compared to female participants, while the obesity prevalence was 23.1 and 39.6% lower in males than in females when they were classified using WC or BF%, respectively. However, our sample’s estimated obesity rates from BF% were 2.1, 1.6, and 1.7 times higher than those estimated from BMI, WHtR, and WC, respectively. This might be explained by the fact that BMI, WHtR, and WC are measures of anthropometric dimensions (i.e., body volume and body size), while BF% represents the relative quantity of fat tissue (i.e., defining the structure of body volume) [38]. Further, our discordance analysis showed WHtR had the lowest and BMI the highest discordance rate with BF%. Therefore, WHtR may be the anthropometric measure that most accurately estimates obesity in military officers, which is not surprising because it reflects both the size of the body frame and changes in abdominal body fatness.
Given the importance of human performance optimization to the Army, providing data about how the choice of body composition measure impacts decisions about adiposity and military readiness is a crucially important area of research. Decisions about body composition impact military personnel’s’ deployment status, opportunities for promotion, and even retention in the service. In addition, it will be important for researchers to justify their choice of body composition assessment method(s) in studies where it is an outcome—thus, our research has important implications for military health researchers. In a practical sense, anthropometric measurements are more accessible than BIA, as BIA requires power outlets, and multiple machines (that must be calibrated by a trained technician) to ensure all personnel are tested within the designated testing time frame, as well as a setting to protect the BIA devices from extreme temperatures and inclement weather. Quality BIA machines also often have high initial costs as well as incurring maintenance costs. However, if technical and financial issues are managed, BIA provides detailed information on body composition with very high precision compared to “gold standard” methods, even when core assumptions (i.e., dehydration, exercise, water and food consumption, non-voided bladder) of performing BIA measurements are violated [39].
Body size and composition are of importance for military personnel’s physical performance because they must perform tasks as efficiently and as safely as possible. Although our findings supported our hypothesis that obese participants would be more likely to fail the APFT, regardless of which obesity measure was used, previous research using BMI—which the authors regarded as a valid estimate of BF%—only found significant detriments in 2-mile run times for those who did not meet the Army’s body composition program screening standards [40]. Yet, higher BMI was positively associated with additional fitness tests including greater muscular strength, endurance, and power [40]. Other recent research found no relationship between BMI or BF% and APFT performance among Reserve Officers’ Training Corps (ROTC) cadets [41]. This echoed earlier research with ROTC cadets that found total APFT performance was not significantly associated with BMI or BF% [42]. Thus, our findings present novel fitness performance results for our study sample of mostly Army officers and add to our previous findings that greater physical activity levels were also predictive of APFT performance [24].
We also found significant differences in self-rated health for each obesity measure, with the greatest differences occurring when participants were classified by BF%. Participants whose BF% was ≤25% were nearly 2.3 times more likely to self-rate their health as excellent or very good, similar to previous research [22]. This provides evidence of a relationship between having lower adiposity and cognitively perceiving better health.
Study strengths included that our measurements to estimate obesity were measured rather than self-reported. We also completed all study assessments in the morning, matching the same time of day for all participants. However, it is of note that the calculation used by Tanita 310 is not validated in a military population nor is it publicly available for validation, which may pose certain constraints on the obtained estimation of BF%. BIA calculations should be validated in the future for this specific population. While the study sample included a higher percentage of women than the US Army as a whole (24.3% and compared to 14.4%, respectively) [21], additional women participants were needed for statistical comparisons between sexes. We were also unable to compare results by rank due to our sampling strategy. The Army has now instituted a new Army Combat Fitness Test (ACFT) replacing the APFT [41]. Health outcomes were self-rated which provides an important and much needed dimension of military personnel’s health but adding measured indicators of health would also be beneficial. This is of importance for large organizations such as the US Army and warrants further investigation.
5. Conclusions
This study provided novel baseline data from a CRCT among active-duty US military personnel, the majority being Army officers. Obesity rates were estimated and compared using common measures and results showed that BMI, WC, and WHtR underestimated obesity in comparison to BF% estimated via BIA. This suggests that obesity rates among military personnel may be higher than those shown by previous DoD research using self-reported height and weight, particularly among officers [2,21]. As a less-used anthropometric measure in military studies, WHtR had the lowest discordance with BF%. Our results further showed that obese military personnel were more likely to fail the APFT, particularly when classified by BMI and WHtR, reiterating the importance of body composition for human performance optimization. Future research should examine these relationships using the new ACFT. Moreover, obese participants rated their health as fair or good while non-obese participants were more likely to rate their health as very good or excellent, reflecting cognitive awareness of body composition status. Interventions to address obesity are needed, including among officers attending graduate school at CGSC to ensure they remain mission ready.
Author Contributions
Conceptualization, K.M.H., C.K.H. and W.S.C.P.; methodology, K.M.H., C.K.H. and W.S.C.P.; software, K.M.H., C.K.H. and W.S.C.P.; validation, C.K.H. and N.J.; formal analysis, C.K.H., N.J. and F.K.; investigation, B.S.H., C.K.H., W.S.C.P., N.J., S.A.J., J.A.D. and K.M.H.; resources, W.S.C.P. and K.M.H.; data curation, K.M.H., B.S.H. and N.J.; writing—original draft preparation, K.M.H., B.S.H. and C.K.H.; writing—review and editing, B.S.H., C.K.H., F.K., W.S.C.P., N.J., S.A.J., J.A.D. and K.M.H.; visualization, C.K.H. and F.K.; supervision, K.M.H. and W.S.C.P.; project administration, K.M.H.; funding acquisition, K.M.H. and W.S.C.P. All authors have read and agreed to the published version of the manuscript.
Funding
This research was funded by The National Institutes of Health, grant number R01DK099516. The funders had no role in the design of the study; in the collection, analyses, or interpretation of data; in the writing of the manuscript, or in the decision to publish the results.
Institutional Review Board Statement
The study was conducted in accordance with the Declaration of Helsinki, and approved by the Institutional Review Board of Kansas State University protocol code #7162 on 13 May 2014.
Informed Consent Statement
Informed consent was obtained from all subjects involved in the study.
Data Availability Statement
Data are available upon request from the corresponding authors.
Acknowledgments
The authors are grateful for all research staff members who assisted with various aspects of the study.
Conflicts of Interest
The authors declare no conflict of interest.
References
- Ward, Z.J.; Bleich, S.N.; Cradock, A.L.; Barrett, J.L.; Giles, C.M.; Flax, C.; Long, M.W.; Gortmaker, S.L. Projected U.S. State-Level Prevalence of Adult Obesity and Severe Obesity. N. Engl. J. Med. 2019, 381, 2440–2450. [Google Scholar] [CrossRef]
- Meadows, S.; Engel, C.; Collins, R.; Beckman, R.; Breslau, J.; Bloom, E.L.; Dunbar, M.S.; Gilbert, M.L.; Grant, D.; Hawes-Dawson, J.; et al. 2018 Department of Defense Health Related Behaviors Survey (HRBS): Results for the Active Component; RAND Corporation: Santa Monica, CA, USA, 2021. [Google Scholar]
- Hoerster, K.D.; Lehavot, K.; Simpson, T.; McFall, M.; Reiber, G.; Nelson, K.M. Health and Health Behavior Differences: U.S. Military, Veteran, and Civilian Men. Am. J. Prev. Med. 2012, 43, 483–489. [Google Scholar] [CrossRef] [PubMed]
- Trivette, E.T. Obesity and Army Readiness; U.S. Army Command and General Staff College: Fort Leavenworth, KS, USA, 2019. [Google Scholar]
- Shiozawa, B.; Madsen, C.; Banaag, A.; Patel, A.; Koehlmoos, T. Body Mass Index Effect on Health Service Utilization Among Active Duty Male United States Army Soldiers. Mil. Med. 2019, 184, 447–453. [Google Scholar] [CrossRef] [PubMed]
- Voss, J.D.; Pavela, G.; Stanford, F.C. Obesity as a Threat to National Security: The Need for Precision Engagement. Int. J. Obes. 2019, 43, 437–439. [Google Scholar] [CrossRef] [PubMed]
- Gattis, V.M. Obesity: A Threat to National Security? U.S. Army War College: Carlisle Barracks, PA, USA, 2011. [Google Scholar]
- Headquarters Department of the Army. Army Regulation 600-9; The Army Body Composition Program, Headquarters Department of the Army: Washington, DC, USA, 2019. [Google Scholar]
- Janssen, I.; Katzmarzyk, P.T.; Ross, R. Waist Circumference and Not Body Mass Index Explains Obesity-Related Health Risk. Am. J. Clin. Nutr. 2004, 79, 379–384. [Google Scholar] [CrossRef]
- Ashwell, M.; Gunn, P.; Gibson, S. Waist-to-Height Ratio Is a Better Screening Tool than Waist Circumference and BMI for Adult Cardiometabolic Risk Factors: Systematic Review and Meta-Analysis. Obes. Rev. 2012, 13, 275–286. [Google Scholar] [CrossRef]
- Ashwell, M.; Mayhew, L.; Richardson, J.; Rickayzen, B. Waist-to-Height Ratio Is More Predictive of Years of Life Lost than Body Mass Index. PLoS ONE 2014, 9, e103483. [Google Scholar] [CrossRef]
- Bernstein, S.A.; Lo, M.; Davis, W.S. Proposing Using Waist-to-Height Ratio as the Initial Metric for Body Fat Assessment Standards in the U.S. Army. Mil. Med. 2017, 182, 304–309. [Google Scholar] [CrossRef][Green Version]
- Griffith, J.R.; White, E.D.; Fass, R.D.; Lucas, B.M. Comparison of Body Composition Metrics for United States Air Force Airmen. Mil. Med. 2018, 183, E201–E207. [Google Scholar] [CrossRef]
- Macfarlane, D.J. Can Bioelectric Impedance Monitors Be Used to Accurately Estimate Body Fat in Chinese Adults? Asia Pac. J. Clin. Nutr. 2007, 16, 66–73. [Google Scholar] [CrossRef]
- Heinrich, K.M.; Jitnarin, N.; Suminski, R.R.; Berkel, L.V.; Hunter, C.M.; Alvarez, L.; Brundige, A.R.; Peterson, A.L.; Foreyt, J.P.; Haddock, C.K.; et al. Obesity Classification in Military Personnel: A Comparison of Body Fat, Waist Circumference, and Body Mass Index Measurements. Mil. Med. 2008, 173, 67–73. [Google Scholar] [CrossRef] [PubMed]
- Shams-White, M.M.; Chui, K.; Deuster, P.A.; McKeown, N.M.; Must, A. Comparison of Anthropometric Measures in US Military Personnel in the Classification of Overweight and Obesity. Obesity 2020, 28, 362–370. [Google Scholar] [CrossRef] [PubMed]
- Kukic, F.; Koropanovski, N.; Jankovic, R.; Cvorovic, A.; Dawes-J, J.; Lockie-G, R.; Orr, R.M.; Dopsaj, M. Association of Sex-Related Differences in Body Composition to Change of Direction Speed in Police Officers While Carrying Load. Int. J. Morphol. 2020, 38, 731–736. [Google Scholar] [CrossRef]
- U.S. Army CGSC Degree Programs. Available online: https://usacac.army.mil/organizations/cace/cgsc/CGSCDegreePrograms (accessed on 6 July 2021).
- Shea, K.P.; Fishback, S.J. Impact of Cumulative Combat Stress on Learning in an Academic Environment. In New Directions for Adult and Continuing Education; Wiley Online Library: Hoboken, NJ, USA, 2012; pp. 53–63. ISBN 1536-0717. [Google Scholar]
- Lythgoe, T.J. Some Modest Advice for the Command and General Staff Officer’s Course Class of 2020. Available online: http://fieldgradeleader.themilitaryleader.com/cgsc-advice/ (accessed on 10 July 2021).
- Meadows, S.; Engel, C.; Collins, R.; Beckman, R.; Cefalu, M.; Hawes-Dawson, J.; Doyle, M.; Kress, A.M.; Sontag-Padilla, L.; Ramchand, R.; et al. 2015 Department of Defense Health Related Behaviors Survey (HRBS); RAND Corporation: Santa Monica, CA, USA, 2018; ISBN 9780833098313. [Google Scholar]
- Golenbock, S.; Kazman, J.B.; Krauss, S.; Deuster, P.A. General Health Status in Army Personnel: Relations with Health Behaviors and Psychosocial Variables. Qual. Life Res. 2017, 26, 1839–1851. [Google Scholar] [CrossRef]
- Okosun, I.S.; Choi, S.; Matamoros, T.; Dever, G.E.A. Obesity Is Associated with Reduced Self-Rated General Health Status: Evidence from a Representative Sample of White, Black, and Hispanic Americans. Prev. Med. 2001, 32, 429–436. [Google Scholar] [CrossRef]
- Heinrich, K.M.; Streetman, A.E.; Kukić, F.; Fong, C.; Hollerbach, B.S.; Goodman, B.D.; Haddock, C.K.; Poston, W.S.C. Baseline Physical Activity Behaviors and Relationships with Fitness in the Army Training at High Intensity Study. J. Funct. Morphol. Kinesiol. 2022, 7, 27. [Google Scholar] [CrossRef]
- Canadian Society for Exercise Physiology. Par-Q & You; University of Waterloo: Waterloo, ON, Canada, 2002. [Google Scholar]
- Kyle, U.G.; Bosaeus, I.; De Lorenzo, A.D.; Deurenberg, P.; Elia, M.; Gómez, J.M.; Heitmann, B.L.; Kent-Smith, L.; Melchior, J.-C.; Pirlich, M.; et al. Bioelectrical Impedance Analysis—Part I: Review of Principles and Methods. Clin. Nutr. 2004, 23, 1226–1243. [Google Scholar] [CrossRef]
- Rubiano, F.; Nuñez, C.; Heymsfield, S.B. A Comparison of Body Composition Techniques. Ann. N. Y. Acad. Sci. 2000, 904, 335–338. [Google Scholar] [CrossRef]
- Strain, G.W.; Wang, J.; Gagner, M.; Pomp, A.; Inabnet, W.B.; Heymsfield, S.B. Bioimpedance for Severe Obesity: Comparing Research Methods for Total Body Water and Resting Energy Expenditure. Obesity 2008, 16, 1953–1956. [Google Scholar] [CrossRef]
- Beeson, W.L.; Batech, M.; Schultz, E.; Salto, L.; Firek, A.; Deleon, M.; Balcazar, H.; Cordero-Macintyre, Z. Comparison of Body Composition by Bioelectrical Impedance Analysis and Dual-Energy X-Ray Absorptiometry in Hispanic Diabetics. Int. J. Body Compos. Res. 2010, 8, 45–50. [Google Scholar]
- National Institutes of Health; National Heart Lung and Blood Institute; North American Society for the Study of Obesity. The Practical Guide: Identification, Evaluation and Treatment of Overweight and Obesity in Adults; National Institutes of Health: Bethesda, MD, USA, 2000; Volume 4084. [Google Scholar]
- Pierannunzi, C.; Hu, S.S.; Balluz, L. A Systematic Review of Publications Assessing Reliability and Validity of the Behavioral Risk Factor Surveillance System (BRFSS), 2004–2011. BMC Med. Res. Methodol. 2013, 13, 49. [Google Scholar] [CrossRef] [PubMed]
- Headquarters Department of the Army. FM 7–22: Army Physical Fitness Training, C1 ed.; Headquarters Department of the Army: Washington, DC, USA, 2012. [Google Scholar]
- R Core Team. The R Project for Statistical Consulting. Available online: https://www.r-project.org/ (accessed on 31 July 2019).
- Wickham, H. Ggplot2. Available online: https://www.ggplot2.org (accessed on 22 February 2018).
- Reyes-Guzman, C.M.; Bray, R.M.; Forman-Hoffman, V.L.; Williams, J. Overweight and Obesity Trends among Active Duty Military Personnel: A 13-Year Perspective. Am. J. Prev. Med. 2015, 48, 145–153. [Google Scholar] [CrossRef] [PubMed]
- Hales, C.M.; Carroll, M.D.; Fryar, C.D.; Ogden, C.L.; Ph, D. Prevalence of Obesity and Severe Obesity Among Adults. NCHS Data Brief. 2020, 360, 107. [Google Scholar]
- Provencher, M.T.; Chahla, J.; Sanchez, G.; Cinque, M.E.; Kennedy, N.I.; Whalen, J.; Price, M.D.; Moatshe, G.; LaPrade, R.F. Body Mass Index Versus Body Fat Percentage in Prospective National Football League Athletes: Overestimation of Obesity Rate in Athletes at the National Football League Scouting Combine. J. Strength Cond. Res. 2018, 32, 1013–1019. [Google Scholar] [CrossRef]
- Lee, S.Y.; Gallagher, D. Assessment Methods in Human Body Composition. Curr. Opin. Clin. Nutr. Metab. Care 2008, 11, 566–572. [Google Scholar] [CrossRef]
- Randhawa, A.K.; Jamnik, V.; Fung, M.D.T.; Fogel, A.S.; Kuk, J.L. No Differences in the Body Fat after Violating Core Bioelectrical Impedance Measurement Assumptions. BMC Public Health 2021, 21, 495. [Google Scholar] [CrossRef]
- Pierce, J.R.; DeGroot, D.W.; Grier, T.L.; Hauret, K.G.; Nindl, B.C.; East, W.B.; McGurk, M.S.; Jones, B.H. Body Mass Index Predicts Selected Physical Fitness Attributes but Is Not Associated with Performance on Military Relevant Tasks in U.S. Army Soldiers. J. Sci. Med. Sport 2017, 20, S79–S84. [Google Scholar] [CrossRef]
- Roberts, B.M.; Rushing, K.A.; Plaisance, E.P. Sex Differences in Body Composition and Fitness Scores in Military Reserve Officers’ Training Corps Cadets. Mil. Med. 2021, usaa496. [Google Scholar] [CrossRef]
- Steed, C.L.; Krull, B.R.; Morgan, A.L.; Tucker, R.M.; Ludy, M.-J. Relationship between Body Fat and Physical Fitness in Army ROTC Cadets. Mil. Med. 2016, 181, 1007–1012. [Google Scholar] [CrossRef]
Publisher’s Note: MDPI stays neutral with regard to jurisdictional claims in published maps and institutional affiliations. |
© 2022 by the authors. Licensee MDPI, Basel, Switzerland. This article is an open access article distributed under the terms and conditions of the Creative Commons Attribution (CC BY) license (https://creativecommons.org/licenses/by/4.0/).