1. Introduction
From 2007 to 2020, large-scale green tide disasters occurred in the Yellow Sea in China [
1], which severely affected the ecosystem and the lives of coastal residents in the sea area. Green tides are ecological anomaly caused by a sharp increase in green algae’s biomass, and
U. prolifera has always been a species in the outbreak of green tide algae in the Yellow Sea [
2].
U. prolifera (
Ulvales,
Chlorophyta [
1,
3]) has strong resistance to the complex environmental conditions in the sea. It can also resist and adapt to the increasing light intensity in the Yellow Sea from spring to summer during floating and can reproduce rapidly [
4].
U. prolifera reaches the Shandong Peninsula and Qingdao coastal waters in July and becomes the only surviving species.
The required light intensity for algae growth is generally between 33 and 400 μmol·m
−2·s
−1 [
5], and the change of light intensity has different effects on its growth, photosynthesis, and respiration [
6]. For
U. prolifera, 40 μmol·m
−2·s
−1 is the lowest required light intensity for algae growth, and 60–140 μmol·m
−2·s
−1 are the optimal values (the light intensity range in the Yellow Sea area in May and June), with the algae reaching the highest daily growth rate [
5]. With the increased light intensity after July, the growth of other early component species of green tide, including
Ulva linza,
Ulva compressa, and
Ulva flexuosa, is inhibited at 160 μmol·m
−2·s
−1. However, the instantaneous net photosynthetic performance of
U. prolifera increases significantly at 160 μmol·m
−2·s
−1, and the relative growth rate at 280 μmol·m
−2·s
−1 is even higher than that under low light conditions [
7,
8].
U. prolifera can even survive under 200–600 μmol·m
−2·s
−1 [
9], showing that it has strong tolerance to high light intensity, and the mechanism is worth studying.
With the rapid development of high-throughput sequencing techniques, omics technology has become the mainstream for studying organisms’ responses to the environment. Jia et al. obtained many expressed sequence tags of
U. prolifera, marking the parts that may contribute to the rapid growth of algae [
10]. The comparative transcriptome of
U. prolifera,
U. linza,
U. flexuosa, and
U. compressa showed the difference in the construction of transcription factors and metabolic pathways of
U. prolifera, as well as the enrichment of pyruvate kinase and nitrate transporters in these growth-related genes [
11]. However, the current research on the effects of environmental factors on
U. prolifera has focused on the temperature stress. For example, the transcriptome has been used to identify the relevant genes of
U. prolifera involved in the carotenoid biosynthesis pathway at different temperatures [
12] and proteomics has been used to study the changes in the protein expression of
U. prolifera at high temperatures [
13]. The research on the response to light intensity has focused on physiological ecology or individual genes, e.g., the ELIP-like genes in
U. linza may be involved in photoprotection under high light, and low temperature and low osmotic stress. Therefore, there is no comprehensive and systematic understanding of the molecular mechanism of
U. prolifera responding to light intensity.
The previous transcriptomics studies have shown that the above four green tide algae have significant differences in response to different light intensities and provide a reference for establishing the light intensity models. On this basis, the work combined the transcriptome, proteome, metabolome, and lipidome to study the environmental response of U. prolifera under high light intensity, thus revealing the biological mechanism of U. prolifera.
2. Materials and Methods
2.1. Materials
U. prolifera samples were collected from Qingdao waters (120°19′ E, 36°04′ N) in July 2008, and gametophytes’ pure-line progeny were obtained through sterile subculturing in the laboratory. In this experiment, samples of U. prolifera gametophytes were subcultured in VSE medium at 20 °C, a light intensity of 120 μmol·m−2·s−1, and light period/dark period = 12:12 h. After 15 days of cultivation, the algae with healthy growth and similar morphologies were taken. The experiment was divided into the high light intensity treatment (400 μmol·m−2·s−1) and the control group (120 μmol·m−2·s−1), with other conditions unchanged. After the two groups were cultured for 12 h, the algae were taken out immediately. After liquid nitrogen treatment and ultra-low-temperature freeze-drying, omics tests were performed separately. The experiment set up biological replicates, where the transcriptome and proteome had three replicates per group, and the metabolome and lipidome had six per group. Each of the above replicates contained ten fronds.
2.2. Transcriptomics Procedure
In the transcriptome experiment, the total RNA from
U. prolifera samples was accurately quantified after extracting. mRNA capture and fragmentation were performed. After the first strand was synthesized, double-strand cDNA synthesis was performed. Subsequently, the library was amplified with quality testing, and the obtained cDNA library was subjected to high-throughput sequencing on Illumina Hiseq TM (Illumina Inc., San Diego, CA, USA). Then, fast quality control quality evaluation was performed on the original sequencing data, and the quality was cut by Trimmomatic to obtain relatively accurate and valid data [
14]. Finally, gene annotation, RNA-seq sequencing evaluation, gene-structure analysis, expression-level analysis, expression-variation analysis, and gene-enrichment analysis were carried out [
15].
2.3. Quantitative PCR Assay
The total RNA of
U. prolifera was extracted from each group followed by reverse-transcription into cDNA using the Fast-King cDNA first strand synthesis kit (Tiangen, Beijing, China). Then nine genes selected from the transcriptome were applied for qRT-PCR, where 18S rRNA was taken as the internal reference [
12]. The target gene primers were designed using NCBI database online tool “Primer-BLAST” (
Table S1), and Tiangen’s Talent fluorescence quantitative detection kit (SYBR Green) was used for the qPCR experiment, with the formulate as follows: 2 × Talent qPCR PreMix 12.5 μL, positive and negative primers 0.75 μL, cDNA template 1 μL, RNAase-free ddH
2O 10μL. The reaction system was placed in the FTC-2000 PCR instrument, with the program setting as follows: 3 min pre-denaturation at 95 °C, 40 times of recycles including 95 °C for 30 s, 60 °C for 30 s, and 72 °C for 30 s. All samples had four repeats, and gene differential expression was calculated by 2
−ΔΔCT [
16].
2.4. Proteomics Procedure
The samples were ground by liquid nitrogen and precipitated by TCA/acetone, then an appropriate amount of SDT lysate was added, respectively. The samples were bathed in boiling water for 15 min, then treated with ultrasonic treatment and centrifuged at 12,000×
g. After the supernatant was collected, the protein was quantified by the BCA method [
17], and the filtrate was collected by the FASP enzymatic hydrolysis method [
18]. The peptides were desalted by the C18 Cartridge, then lyophilized and redissolved with 40 μL 0.1% formic acid solution. The peptides were quantified (OD
280). High performance liquid chromatography was used to separate each sample using the HPLC liquid phase system easy NLC with nanositre flow rate. After chromatographic separation, Q-Exactive mass spectrometer (Thermo Fisher Scientific, Waltham, MA, USA) was used for mass spectrometry analysis. The mass charge ratio of polypeptides and fragments was collected as follows: after each full scan, 20 fragments were collected (MS2 scan). MS2 activation type was HCD, isolation window was 2 m/z, secondary mass spectral resolution was 17,500 at 200 m/z, normalized collision energy was 30 eV, and underfill was 0.1%.
2.5. Metabolomics Procedure
The sample was quantitatively weighed for liquid nitrogen grinding, dissolved in methanol acetonitrile aqueous solution (v/v, 2:2:1), centrifuged at 14,000× g at 4 °C for 20 min, and then the supernatant was taken. The supernatant was then redissolved in acetonitrile aqueous solution (acetonitrile: water =1:1, v/v) for mass spectrometry. The supernatant was taken for sample analysis after centrifugation at 14,000× g at 4 °C for 15 min. The samples were separated on an Agilent 1290 Infinity LC ultra-performance liquid chromatography (UHPLC) HILIC column. The samples were separated by UHPLC and analyzed by Triple TOF 6600 mass spectrometers (AB SCIEX, Boston, MA, USA). The obtained original data were converted into the MZML format by Proteo Wizard (Palo Alto, CA, USA), and then the XCMS program was used for peak alignment, retention time correction, and peak area extraction. Accurate mass number matching (<25 PPM) and secondary spectral matching were used for metabolite structure identification, and a database built by the laboratory was retrieved. The integrity of the data extracted by XCMS was checked. The metabolites with missing values of more than 50% in the group were removed and did participate in the subsequent analysis. The extreme values were deleted, and the total peak area was normalized for the data to ensure the parallelism of comparison between the samples and metabolites. After being processed, the data were input into the software SIMCA-P 14.1 (Umetrics, Umea, Sweden) for pattern recognition. After the data were preprocessed by pareto-scaling, multi-dimensional statistical analysis was conducted, including unsupervised principal component analysis (PCA), partial least squares discriminant (PLS-DA) and orthogonal partial least-squares discriminant (OPLS-DA) analysis. One-dimensional statistical analysis included student’s t-test and multiple of variation analysis, and volcano maps were drawn by R software (R Foundation for Statistical Computing, Vienna, Austria).
2.6. Lipidomics Procedure
After centrifugation at low temperature and high speed, the upper organic phase was taken, and the ammonia gas was blown dry. Isopropanol solution was added for resolution during mass spectrometry analysis. The samples were centrifuged for 15 min at 14,000× g under 10 °C in the vortex, and the supernatant was taken for sample analysis. The samples were separated by Nexera UHPLC LC-30A ultra performance liquid chromatography (Shimadzu Technologies, Kyoto, Japan). Electrospray ionization (ESI) positive and negative ion modes were used for detection, respectively. The samples were separated by UHPLC and analyzed by mass spectrometry with Q exactive plus mass spectrometer (Thermo Scientific, New York, NY, USA). Peak and lipid identification (secondary identification), peak extraction, peak alignment, and quantification were performed by lipaid search software version 4.1 (Thermo Scientific, New York, NY, USA). In the extracted data, lipid molecules of RSD > 30% were deleted. For the data extracted by lipaid search, lipid molecules with missing values > 50% in the group were deleted, and the total peak area was normalized for the data. SimCA-P 14.1 (Umetics, Umea, Sweden) was used for pattern recognition. After the data were preprocessed by Pareto-scaling, multi-dimensional statistical analysis was conducted, including unsupervised PCA, PLS-DA, and OPLS-DA analysis. One-dimensional statistical analysis included student’s t-test and multiple of variation analysis, and R software drew volcano maps, hierarchical clustering analysis, and correlation analysis.
3. Results
3.1. Basic Data of Transcriptome Analysis
Trimmomatic processed the raw data obtained by high-throughput sequencing to obtain the clean data. The average read length of each sample was more than 142 bp, with the total read length more than 39 Mb, the base amount more than 5.5 Gb, the GC ratio greater than 59%, and the Q30 ratio between 96.29 and 96.48%. It indicated good sequencing quality (
Table S2). Trinity was used to assemble the clean data into transcripts with denovo assembly and remove redundancy. By taking the longest transcript in each transcript cluster as the unigene, 28,362 unigenes were obtained, with an average length of 1406 bp., wherein the longest sequence length was 26,903 bp (
Table S3). After comparison, 1579 unigenes sequences were annotated in the databases of NR, KEGG, Swiss-prot, and KOG, and the numbers of annotated genes were 8502, 1801, 7670, and 5851, respectively (
Figure S1). Compared with the control group, there were 100 genes whose expression quantities were extremely significantly up-regulated (|Log
2Fold Change (FC)| > 2, and
p-value < 0.05), and 167 genes were down-regulated for
U. prolifera under high light intensity.
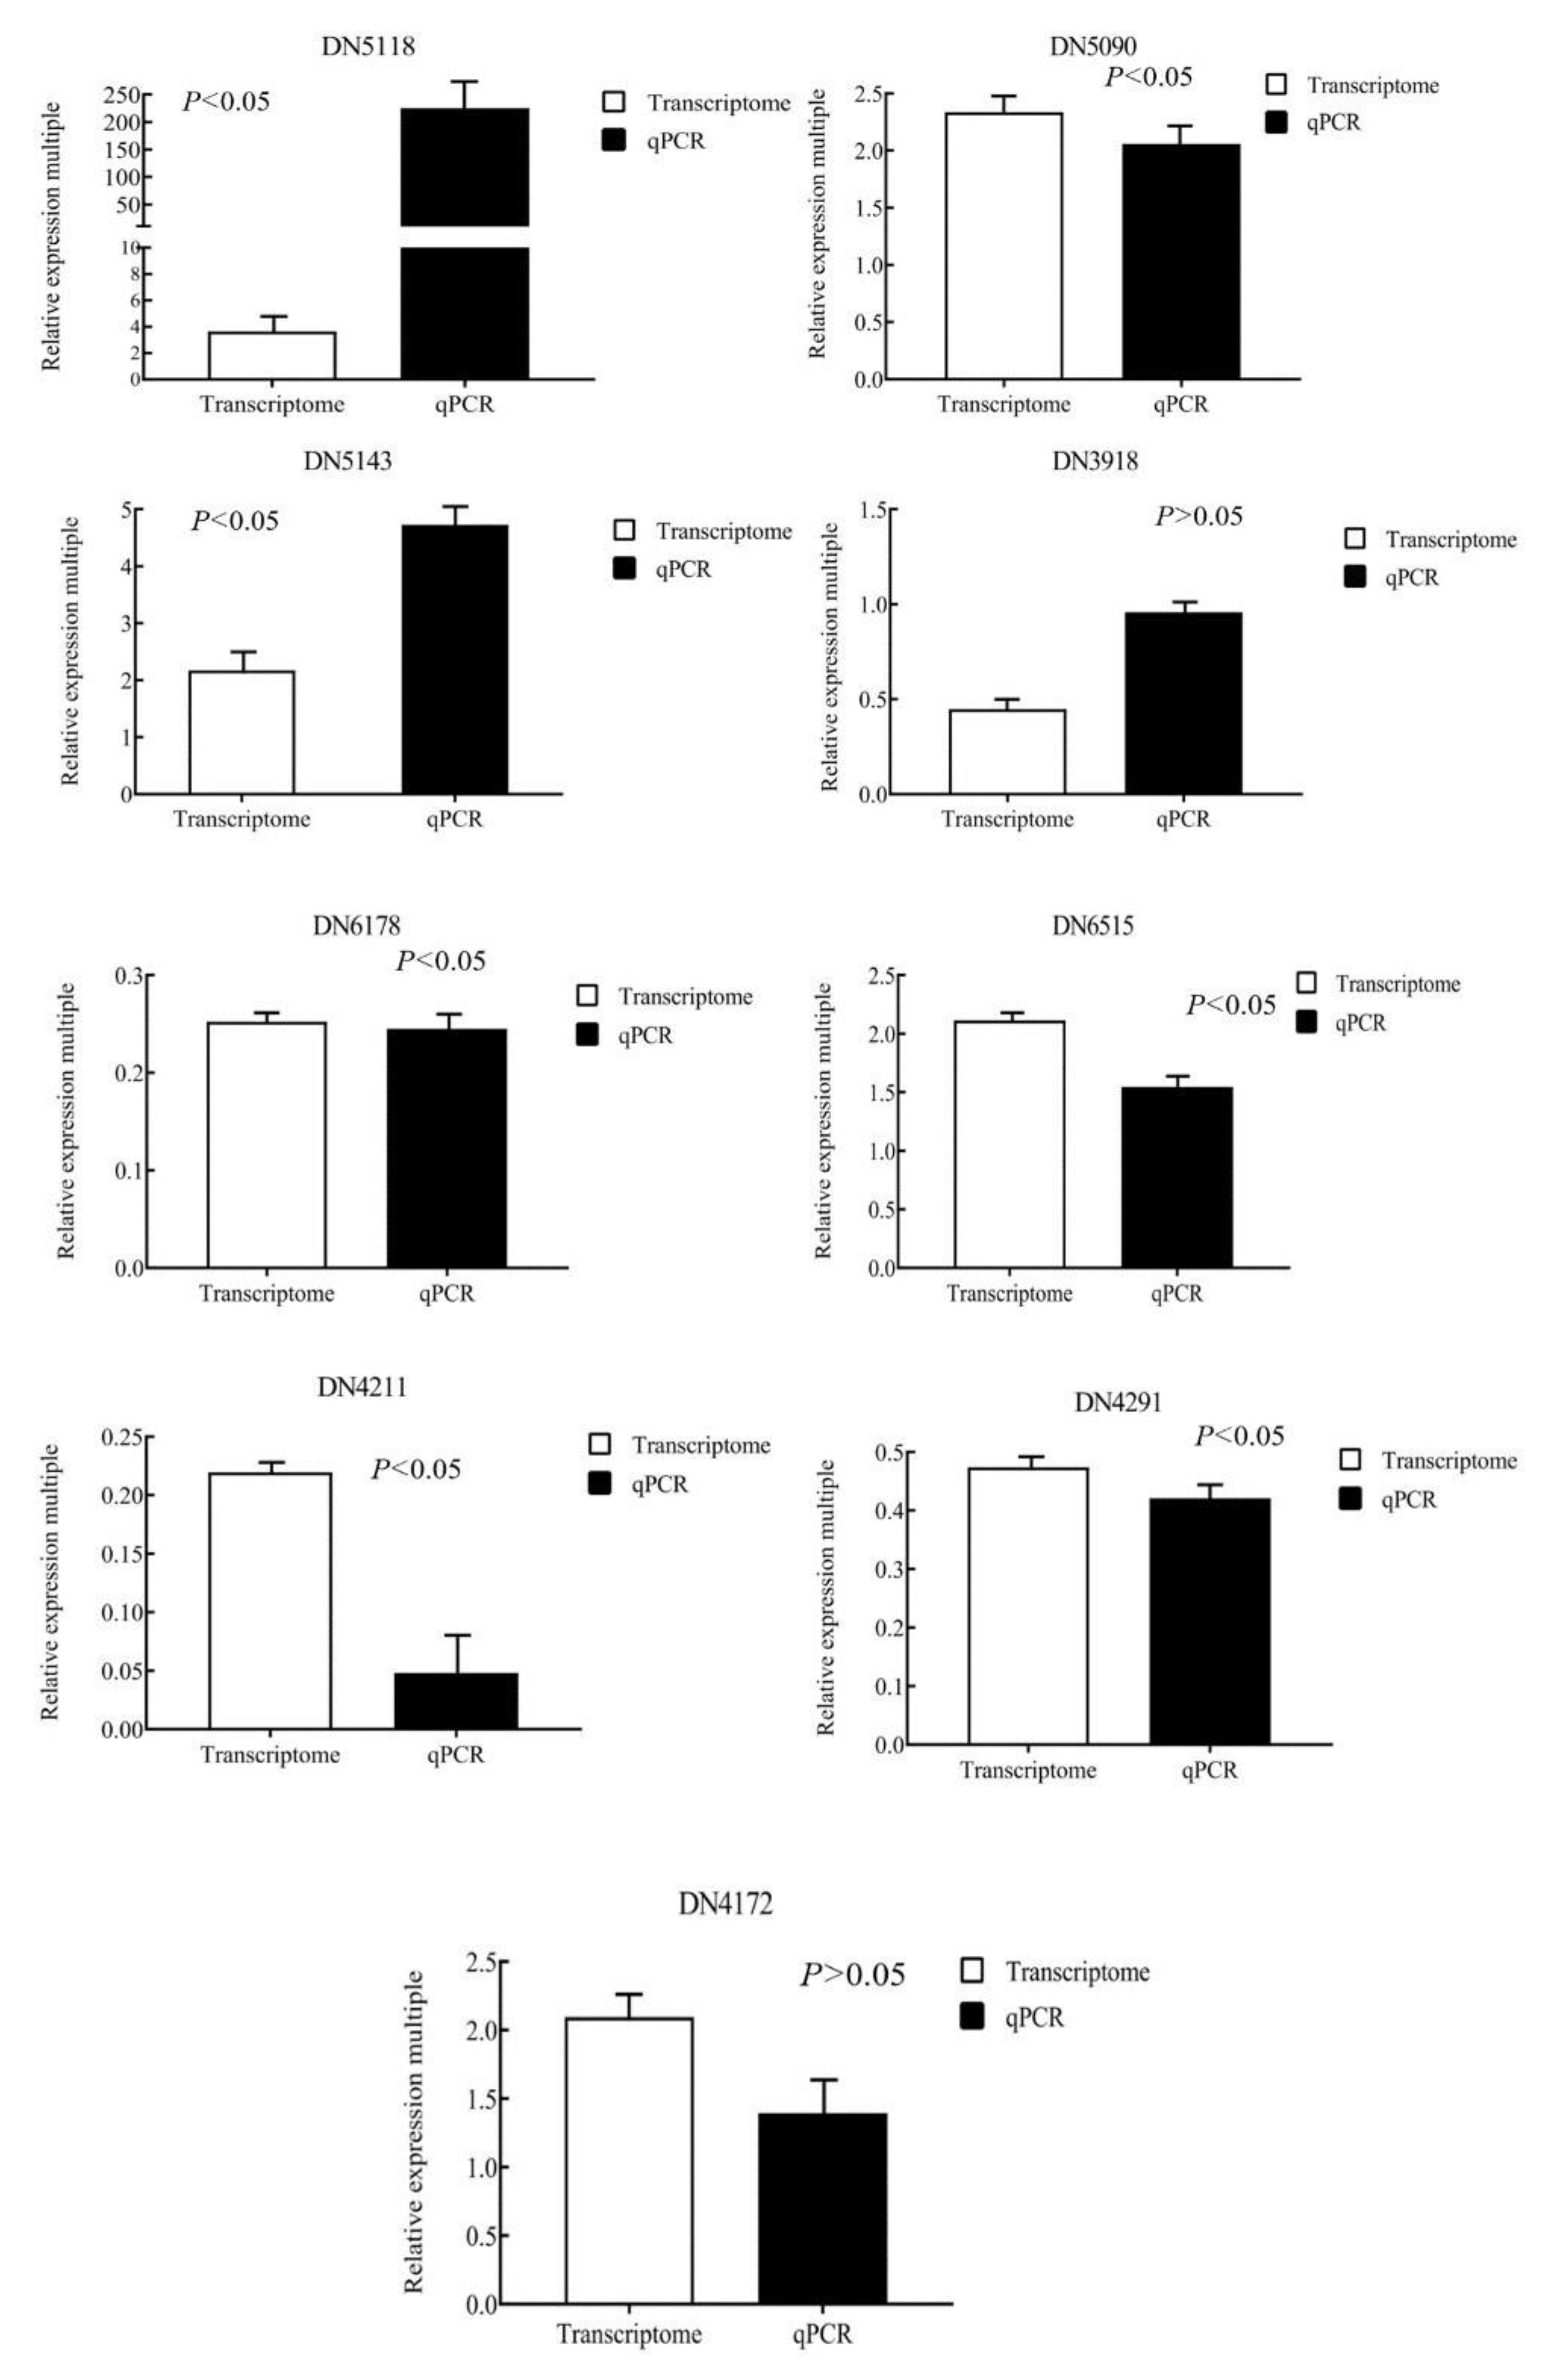
3.2. Target Gene Verification Results
The selected nine genes were verified by real-time fluorescence quantitative PCR, and the data were analyzed. As shown in
Figure 1, under the condition of 12 h high light intensity, the expression trends of nine genes were similar with the transcriptomics results, indicating that the transcriptome data were relatively reliable.
3.3. Basic Data of Proteome Analysis
According to the obtained mass spectrum, the Andromeda engine integrated by Max Quant was used for identification. The filtering was completed with PSM-level FDR ≤ 1%, and filtering was performed with protein-level FDR ≤ 1%. There were 18,100 identified peptide fragments and 2226 identified proteins. The unique peptide fragment is the protein’s characteristic sequence. In this experiment, there were 309 unique peptide segments with a quantity of two (
Figure S2). The obtained proteins were mostly distributed between 10–50 kDa, of which 20–30 kDa had the most distribution (
Figure S3). Max Quant was used for the quantitative analysis of each group with Welch’s
t-test. It showed that the two groups contained 62 different proteins (|FC| ≥ 1.5, and
p < 0.05), of which 21 were up-regulated, and 41 were down-regulated.
3.4. Basic Data of Metabolome Analysis
The chromatographic peak’s response intensity and retention time in the positive and negative ion mode of the QC samples in the metabolome overlapped. SIMCA-P software was used for PCA analysis to demonstrate that the parallel samples of each group were closely clustered together, which showed that the experiment had good repeatability. In the positive ion mode, 3790 ion peaks were obtained; in the negative ion mode, 3606 ion peaks were obtained. PLS-DA measured the strength of influence and interpretation of metabolites’ expression patterns on the classification of samples in each group by calculating variable importance for the projection (VIP). The PLS-DA model’s evaluation parameters R2Y = 0.997 (for positive ions) and 0.971 (for negative ions) after seven interactive verification cycles. OPLS-DA was modified based on PLS-DA to filter out noises unrelated to classified information, which improved the model’s analysis and effectiveness. In this model, R2Y = 1 (for positive ions) and 0.999 (for negative ions). In the above two models, R2Y was close to one, which explained the samples’ metabolic differences in the two groups. On this basis, 29 significantly different metabolites (VIP > 1 and p < 0.05) were identified through statistical analysis and screening, wherein 24 were up-regulated, and 5 were down-regulated.
3.5. Basic Data of Lipidome Analysis
The response intensity and retention time in the UHPLC-Obitrap MS BPC of QC samples in the lipidome showed that the experiment had good repeatability. The PLS-DA and OPLS-DA models’ evaluation parameters R
2Y were equal to 0.968 and 0.993, respectively, which explained the metabolic differences between the samples in the two groups. In this study, 558 lipid molecules were identified with 21 subclasses, mainly involving triglyceride (TG), ceramidesglycerol 1 (CerG1), diacylglycerol (DG), DGDG, diacylglycerol monoacylglycerol (DGMG), MGDG, monogalactosyl monoacylglycerol (MGMG), phosphatidylglycerol (PG), and sulfoquinovosyl diacylglycerol (SQDG) (
Figure S4). There were five significantly different metabolites (VIP > 1, and
p < 0.05), among which one was up-regulated, and four were down-regulated (
Table S4).
Lipid group results showed 76 DGDG expressions, with OPLS-DA model VIP > 1 as the standard. In the high light experimental group, 13 DGDG were differentially expressed, and 7 were up-regulated. Among them, DGDG ((16:4/18:4) + HCOO) was up-regulated extremely significantly (p <0.01, and FC = 3), and the obtained DGDG had the longest carbon chain and the lowest saturation. The work detected a total of 53 MGDG (the direct precursor of DGDG biosynthesis), where 11 differential expressions were down-regulated, including the products (MGDG (16:4/18:4) + HCOO) corresponding to the above-mentioned DGDG. Among them, the difference of MGDG ((16:0/16:4) + HCOO) was extremely significant (p = 0.013, and FC = 0.69), and the product was supposed to be a reaction intermediate. The work detected twenty monogalactosyl monoacylglycerols (MGMGs), of which seven were differentially expressed, and five were down-regulated. MGMG ((16:1) + HCOO, FC = 0.60) and MGMG ((16:2) + HCOO, FC = 0.72) had extremely significant difference (p < 0.05), with intermediate saturation. Correlation analysis showed that these two MGMGs were closely positively correlated with the expression of MGDG and had a strong negative correlation with DGDG. Besides, 42 DAGs, 16 PGs, 6PAs, and 6 fatty acids (including palmitic acid and cis-9-octadecenoyl-CoA) were detected in the lipid group, but no differential expression was found. Six PIs and seven PEs detected were not different, indicating that the above intermediate products did not participate in the endoplasmic reticulum reaction.
3.6. Photosynthesis of U. prolifera in the Conditions of High Light Stress
Through multi-omics joint analysis, it was found that some important genes related to the process of photosynthesis in
U. prolifera changed significantly after 12 h of high light intensity (
Table 1). Transcriptomics data showed that genes that promote chlorophyll and carotenoid synthesis were up-regulated, e.g., glutamate-1-semialdehyde 2,1-aminomutase, ABC transporter C family member 3, and photosystem II CP43 reaction center protein. On the other hand, the expression of pheophytinase decreased. The genes involved in promoting the synthesis of photosystem I and electron transport were up-regulated, e.g., photosystem I P700 chlorophyll apoprotein A1, cytochrome b6-f complex subunit 4, and ATP synthase subunit. Meanwhile, the PSII complex-related gene expression was down-regulated, e.g., photosystem II protein D2 (psbD) and aldedh domain-containing protein. The gene expression associated with the dark reaction process in photosynthesis, e.g., carbonic anhydrase was down-regulated. The expression of genes associated with phosphoenolpyruvate synthesis was up-regulated and metabolism was down-regulated, e.g., pyruvate, phosphate dikinase, phosphoenolpyruvate/phosphate translocator 1 and phosphoenolpyruvate carboxylase 1.
Proteomics data showed that the expression of proteins related to the biosynthesis of chlorophyll was up-regulated, e.g., uroporphyrinogen, heat shock protein 90-5, chloroplastic, and ABC transporter C family member 2 and the expression of C3 pathway-related proteins was inhibited, e.g., pyridoxal 5’-phosphate synthase subunit PDX1.
The combined metabolome and lipidome data showed that the content of photosynthetic membrane involved in photosynthesis increased, e.g., DGDG. However, MGDG as an intermediate for DGDG production decreased, indicating that 12-h high light stress promoted the synthesis of the photosynthetic membranes of U. prolifera. In summary, 12 h of intense high light stress promoted the synthesis of chlorophyll and carotenoid, PSI, and electron transport subunit, and complemented ATP deficiency by coupling with cyclic electron transport. Meanwhile, it weakened PSII synthesis and acyclic photophosphorylation, reduced NADPH generation, and inhibited carbohydrate synthesis in a dark reaction. Meanwhile, a shift from the C3 to the C4 pathway started by the promotion of phosphoenolpyruvate synthesis, while inhibiting phosphoenolpyruvate transport and consumption. Furthermore, high light induced a large amount of DGDG synthesis on the photosynthetic membrane while consuming the substrate MGDG. Those might be supplemented by MGMG. It was suggested that the 12 h time point was the turning point of U. prolifera tolerant to high light.
3.7. Energy Metabolism of U. prolifera in Conditions of High Light Stress
Through multi-omics joint analysis, it was found that after 12 h of intense light stress, some important genes related to energy metabolism in
U.prolifera changed significantly (
Table 2). Transcriptomics data indicated that the expression of genes related to energy metabolism was down-regulated, such as adenylate kinase 5, acyl-CoA-binding domain-containing protein 5, and pyruvate dehydrogenase E1 component subunit α-1. The expression of genes related to redox activity was also down-regulated, e.g., protein tas, cytochrome P450 4e3, and amino oxidase domain-containing. On the other hand, the transcriptome showed that the expression of genes that are involved in glycolysis was up-regulated, e.g., endoglucanase E-4 and endoglucanase 1 and both enzymes catalyzing the endohydrolysis of 1, 4-β-glucosidic linkages in cellulose, lichenin, and cereal β-D-glucans. Meanwhile, the gene expression of 4-α-glucanotransferase DPE2, which catalyzes starch to sucrose, was also up-regulated.
The proteome showed that the expression of proteins related to energy metabolism was up-regulated, e.g., R-mandelonitrile lyase-like, NADH: ubiquinone oxidoreductase 30 kDa.
The metabolome showed that the content of metabolites related to TCA increased, e.g., L-malic acid, L-asparagine, and cyclohexylamine. Meanwhile, that of diethanolamine and ribitolalso increased. However, the content of sucrose decreased.
As a whole, it was found that after short-term high light stress, sucrose content and glycolysis gradually increased, while the TCA cycle gradually weakened, including the reduction in acetyl-CoA production and transport and reduction in proton production, respiratory terminal oxidase production, GTPase synthesis, and ATP production. Thus, the overall trend of energy metabolism was down-regulated which might make U. prolifera dormant.
3.8. Transcription and Translation of U. prolifera in Conditions of High Light Stress
Through multi-omics joint analysis, it was found that some important genes related to the process of protein synthesis and expression in
Ulva changed significantly after 12 h of high light intensity (
Table 3). Transcriptomics data showed that genes that activate DNA were down-regulated, e.g., DOT1 domain-containing protein, ATP-dependent DNA helicase DDM1, and RuvB-like 2; as well as those in RNA transcription, e.g., AP2-like ethylene-responsive transcription factor AIL5, transcriptional activator Myb, ESF1 homolog, and transcription initiation factor TFIID subunit 5. However, genes involved in exosome-mediated RNA decay were up-regulated, e.g., tetratricopeptide repeat protein SKI3. Furthermore, genes related to protein synthesis and degradation were down-regulated, e.g., ribosome biogenesis protein BRX1 homolog, tRNA pseudouridine synthase A, and general transcription factor 3C polypeptide 5. However, Carboxypeptidase inhibitor SmCI involved in the inhibition of pancreatic carboxypeptidase was up-regulated. Nucleotide synthesis was inhibited, e.g., 5’-nucleotidase, pseudouridine-5’-phosphate glycosidase, and cytosolic purine 5’-nucleotidase.
Proteomics data showed that the expression of proteins related to protein synthesis was down-regulated, e.g., pre-mRNA-splicing factor ATP-dependent RNA helicase DEAH3, eukaryotic translation initiation factor 5A-2, and DNA-binding helix-turn helix protein. The combined metabolome data showed that the content of some amino acid increased, e.g., L-glutamate, L-methionine, and L-glutamate.
In summary, after 12 h of intense light stress, the expression of protein synthesis-related genes showed an overall trend of down-regulation in Ulva algae, including DNA activation, RNA transcription, protein synthesis, and degradation. Meanwhile, it also inhibited nucleotide production. This showed that 12 h of high light stress is the turning point of U. prolifera tolerant to the condition of high light stress.
3.9. Signal Transduction, Ion Transport, and Cytoskeleton Synthesis of U. prolifera in Conditions of High Light Stress
According to omics data, some important genes related to signal transduction and growth altered significantly after 12 h of high light stress (
Table 4). Transcriptomics data indicated that the expression of genes related to signal transduction were down-regulated, e.g., adenylate cyclase and protein RRC1. Moreover, ABC transporter G family member 31 that suppresses radicle extension and subsequent embryonic growth was up-regulated, while GPCR-type G protein 2 that is required for seedling growth and fertility was down-regulated. On the other side, the expression of genes related to ion transport was also down-regulated, e.g., potassium/sodium hyperpolarization-activated cyclic nucleotide-gated channel 2, sodium/calcium exchanger 3, and sodium- and chloride-dependent GABA transporter 2. Many genes on cytoskeleton synthesis were down-regulated, e.g., kinesin-like protein KIN-4A, tubulin glycylase 3A, and protein tilB homolog, while several of them were up-regulated, e.g., tubulin polyglutamylase TTLL4, dynein assembly factor 5, and flagellar associated protein.
Proteomics data showed that the expression of proteins involved in signal transduction was down-regulated, e.g., inositol, and calcium-dependent protein kinase 22. The expression of related proteins mediating mitochondrial protein transport was down-regulated, e.g., mitochondrial import inner membrane translocase subunit Tim9. However, UPF0187 protein At3g61320 which participates in the formation of anion channels was up-regulated, as was the transmembrane transport proteins, e.g., vesicle-fusing ATPase and ATP-energized ABC transporter.
Metabolomics data showed that a few metabolites involved in signal transduction were up-regulated, such as L-glutamate, adenosine, and succinate, while isoleucyl-glutamate was down-regulated.
In summary, after 12 h of high light stress, U. prolifera showed a decrease in signal transduction generation, inhibition of growth-related gene expression, weakened ion transport and microfibril and microtubule synthesis, and overall inhibition of cilium synthesis. Therefore, cytoskeleton synthesis was generally inhibited, and cell growth was limited.
3.10. Cell Division, Gametogenesis, and Apoptosis of U. prolifera in Conditions of High Light Stress
According to multiple omics analysis, it was found that after 12 h of high light stress on
U. prolifera, some important genes in the process of cell division, gametogenesis, and apoptosis in
U. prolifera had significant changes (
Table 5). Transcriptomics data indicated that the expression of many genes involved in cell division was down-regulated, e.g., DNA mismatch repair protein MSH4, DNA replication licensing factor MCM5, single mybhistone 3, and heat shock-like 85 kDa, and some genes promoting the cell division were up-regulated, e.g., histone acetyltransferase MCC1, protein chromatin remodeling 24, and serine/threonine-protein kinase mos.
Transcriptomics data indicated that the expression of genes involved in gametogenesis were down-regulated, e.g., thioredoxin domain-containing protein 3 homolog, 26 S proteasome non-ATPase regulatory subunit 12 homolog, and cilia- and flagella-associated protein 91, while C-factor which is necessary for spore differentiation was up-regulated. Moreover, some genes are expressed to inhibit apoptosis, e.g., serine/threonine-protein kinase, dnaJ homolog subfamily A member 1, and WD repeat-containing protein 35. However, some genes are expressed to promote apoptosis, e.g., metacaspase-1.
Proteomics data showed that the expression of proteins that promote cell division was down-regulated, e.g., SNF1-related protein kinase regulatory subunit gamma and R-mandelonitrile lyase, while dnaJ protein homolog 2 which plays a continuous role in plant development was up-regulated.
According to the omics data above, it was found that after 12 h of high light, the gene expression related to cell division and gametogenesis showed an overall downward trend in U. prolifera. At the same time, the expression of apoptosis-related genes changed, which means the reproductive development of U. prolifera was inhibited by high light stress conditions. It was speculated that 12 h of high light intensity is the turning point of U. prolfera cell division and reproduction.
3.11. Resistance of U. prolifera in Conditions of High Light Stress
According to multiple omics analysis, it was found that after 12 h of high light stress on
U. prolifera, some important genes related to resistance in
U. prolifera had significant changes (
Table 6). The transcriptome showed that many genes were expressed to increase resistance to stress. Some were involved in disease, e.g., disease resistance protein RGA4, disease resistance protein TAO1, and TMV resistance protein N; some were involved in extradition, e.g., Broad substrate specificity ATP-binding cassette transporter ABCG2 and neurotrypsin. Others were related to salt tolerance, e.g., mannitol dehydrogenase; DNA damage tolerance, e.g., disease resistance protein RPP5. However, a few genes were expressed to decrease resistance. They were related to cellular defense responses, e.g., DEAD-box ATP-dependent RNA helicase 50, 17.6 kDa class I heat shock protein 3, and activator of 90 kDa heat shock protein ATPase homolog 1; or DNA damage repair, e.g., deoxy ribodipyrimidine photo-lyase; or photoprotection, e.g., carotene biosynthesis-related protein CBR (other specific categories are shown in
Table 6).
Proteomics data showed that the expression of proteins involved in antioxidant response was down-regulated, e.g., glutathione S-transferase, ascorbate peroxidase, and peroxidase, as was glutamate-cysteine ligase which is involved in detoxification. However, 10 kDa chaperonin which promotes the refolding and proper assembly of unfolded polypeptides generated under stress conditions was up-regulated.
According to the metabolome data, most of the metabolites on anti-stress were up-regulated, including γ-L-glutamyl-L-glutamic acid, L-glutamate, and D-proline. However, there were also metabolites that were down-regulated, e.g., galactinol, L-pyroglutamic acid, and L-glutamine.
According to omics data above, it was found that after 12 h of high light stress, some aspects of resistance were enhanced, including disease, extrudation, salt tolerance, DNA damage tolerance, stress adaptation, lipoxygenases activity, riboflavin, degradation, calcium depend kinase activity, salicylic acid synthesis, and cell recognition and adhesion; others were down-regulated, including cellular defense responses, DNA damage repair, photoprotection, antioxidant and innate immunity. It seemed that in various ways, U. prolifera employ mechanisms to cope with light stress conditions.
3.12. Cell Membrane Synthesis and Repair of U. prolifera in Conditions of High Light Stress
According to the omics data, some important genes related to cell membrane synthesis and repair altered significantly after 12 h of high light stress (
Table 7). Transcriptomics data indicated that the expression of genes related to cell membrane, cytoderm, and plasmodesmata synthesis was up-regulated, while lipid alienation was down-regulated, e.g., Enoyl-[acyl-carrier-protein] reductase [NADH], sterol sensor 5-transmembrane proteinand UDP-glucuronate 4-epimerase 1. Moreover, genes associated with tRNA synthesis were up-regulated, e.g., tRNA 2’-phosphotransferase and ribonuclease Z, mitochondrial.
Proteomics data showed that the expression of proteins involved in lipid biosynthesis was up-regulated, e.g., CDP-diacylglycerol-serine O-phosphatidyl transferase 2 and adipocyte plasma membrane-associated protein.
The combined metabolome and lipidome data showed that the content of certain metabolites increased during the process of fatty acid biosynthesis, e.g., cis-9-palmitoleic acid, myristic acid, and palmitic acid. There were also decreased ones, e.g., 4,7,10,13,16,19-docosahexaenoic acid in metabolome, and MGDG (16:0/16:4) + HCOO and MGMG (16:1) + HCOO in lipidome.
In summary, after 12 h of intense light stress, genes were expressed to promote the formation of the cell membrane, cytoderm, and plasmodesmata, and reduce lipid dissimilation metabolism. Moreover, synthesis of tRNA was also promoted, which might be related to promotion cell repair.


