Simple Summary
We describe microbial taxa associated with the gastrointestinal and reproductive tracts of married Pakistani couples. We highlight differences in microbial composition and diversity that are associated with fertile and infertile couples and provide a baseline for future in-depth studies to target the association of the human microbiome with infertility.
Abstract
The human microbiota is recognized as a vital “virtual” organ of the human body that influences human health, metabolism, and physiology. While the microbiomes of the gut, oral cavity, and skin have been extensively studied in the literature, relatively little work has been done on characterizing the microbiota of the human reproductive tract organs, and specifically on investigating its association to fertility. Here, we implemented a 16S ribosomal RNA (rRNA) amplicon sequencing approach to sequence and characterize the gut and genital tract microbiomes from several married Pakistani couples. The recruited individuals included 31 fertile and 35 infertile individuals, with ages ranging from 19–45 years. We identified several fluctuations in the diversity and composition of the gut and genital microbiota among fertile and infertile samples. For example, measures of α-diversity varied significantly between the genital samples donated by fertile and infertile men and there was overall greater between-sample variability in genital samples regardless of gender. In terms of taxonomic composition, Actinobacteria, Bacteroidetes, and Firmicutes fluctuated significantly between the gut microbiomes of fertile and infertile samples. Finally, biomarker analyses identified features (genera and molecular functions and pathways) that differed significantly between the fertile and infertile samples and in the past have been associated with bacterial vaginosis. However, we emphasize that 16S amplicon data alone has no bearing on individual health and is merely representative of microbial taxonomic differences that could also arise due to multiple other factors. Our findings, however, represent the first effort to characterize the microbiome associated with fertile and infertile couples in Pakistan and will hopefully pave the way for more comprehensive and broad-scale investigations in the future.
1. Introduction
Infertility is typically characterized by a failure to conceive after regular intercourse for twelve or more months [1]. In women older than 35, the timeline to conceive is shortened to six months to improve the odds of successful infertility treatment [2]. Approximately 10–15% of the reproductive-aged couples worldwide may suffer from some kind of infertility during their lifespan [3]. According to various estimates, 20–30% males [4] and ~37% females may experience infertility at some timepoint worldwide [5]. According to the U.S. Centers for Disease Control and Prevention statistics, ~8.8% of married women may not become pregnant within 12 months of trying in the U.S. [6]. The rate of infertility is presumably higher in the developing countries; for instance, infertility prevalence in Pakistan could be as high as 22% for primary infertility accounting for 4% of the total infertility cases [7] suggesting that several married couples in Pakistan may be struggling with infertility [8]. The prevalence of secondary infertility is also presumably higher in Pakistan [9].
Infertility can be caused by genetic, emotional, social, physical (e.g., injury to reproductive organs), and biological/natural factors [10]. Some of the primary factors include declining reproductive age of marital partners and ovulation defects in women and spermatogenic failure and physical injuries in men, among others [11]. In men, infertility can be diagnosed by routine semen analysis, which evaluates sperm morphology, motility, and quantity per ejaculate [12]. For women, several physical and emotional factors may contribute to infertility. These include obstructions in the reproductive tract, endometriosis, polycystic ovarian syndrome (PCOS), pelvic inflammatory disease, hyperprolactinemia, hypothyroidism, and T-shaped uterus [13]. Fortunately, many advanced treatments for infertility are now available worldwide and also in Pakistan. These include ovulation drugs to induce ovulation, intrauterine insemination for artificial insemination (IUI), and in vitro fertilization (IVF), among others, to support embryo fertilization outside the women’s body [14,15]. These treatments can have a legitimate chance of success but their high costs, and social stigma associated with seeking infertility diagnosis and treatment in societies such as Pakistan, may discourage or prevent many infertile couples to seek treatment [16].
In recent years, advancements in bioinformatics and (meta)-genomics have targeted the sequencing and description of microorganisms associated with the human body and have confirmed their beneficial roles in host health [17]. Numerous studies have reported the association of dysbiosis or imbalance in the normal human microbiota composition with the initiation and progression of major human diseases such as diabetes, inflammatory bowel disease, cancer, neuropsychiatric diseases, and cardiac metabolic disorders [18]. However, relatively fewer studies have documented the association of microbiome dysbiosis to infertility [19] It is well known that pathogens such as Neisseria gonorrhoeae and Chlamydia trachomatis can be sexually transmitted and may lead to infertility [20]. These pathogens can cause pelvic inflammatory disease and fallopian tube infection and damage in women [21,22]. Similarly, bacterial vaginosis (BV) is characterized or caused by a change from Lactobacilli dominated microbial community to a community dominated by anaerobic bacteria in the vaginal microbiome [23]. BV can lead to an increase in reactive oxygen species (ROS) production, which can cause lipid peroxidation in spermatozoa [24]. A recent study reported a higher Lactobacillus count in semen samples from healthy individuals than prostatitis patients [25]. Another study reported similar results showing a higher number of Lactobacillus species in the semen of normozoospermic individuals than those with spermatic abnormalities [26]. While Lactobacillus concentration has been correlated with normal seminal parameters in healthy individuals [27], Pseudomonas and Prevotella were related to male infertility in terms of low-quality semen parameters [28]. Moreover, some studies have linked the success of IVF and Intra-cytoplasmic sperm injection (ICSI) with a higher relative abundance of Lactobacillus in the vaginal microbiome [29]. Taken together, these studies suggest the role of differential microbiota composition and abundance in fertility outcomes. On similar lines, PCOS and endometriosis have been linked to an altered gut microbiome between control and women diagnosed with PCOS and endometriosis [30,31,32,33]. Specifically, female rhesus monkeys with endometriosis showed decreased levels of Lactobacilli and an increase in the concentration of Gram-negative bacteria [34]. However, the mechanisms through which the vaginal and gut microbiota might impact the progression of infertility remain relatively less clear [35].
Infertility may also lead to social problems, especially in developing countries. Infertility may occur due to either male- or female-related factors and sometimes involve both partners [36]. However, historically, and especially in developing countries such as Pakistan, infertility is typically considered a women-specific condition [37]. Pakistani men are traditionally more protective of their masculinity (and ego) and they may even resist infertility diagnosis and treatment [38]. In such societies, infertile couples may face several challenges such as martial conflicts (e.g., fear of separation), treatment-related concerns, sexual dysfunction, personal anxieties (e.g., desire to become parents), and psychosocial and emotional problems resulting from social and family pressures (e.g., depression) [39]. In this study, we, therefore, characterized the gut and reproductive tract microbiome composition/diversity through 16S rRNA sequencing in several married Pakistani couples recruited from various major cities in the country. We observed several fluctuations in the diversity and composition of the gut and genital microbiome in both male and female samples, which we report below, and hope that these findings will provide a baseline for future more specific studies on this topic.
2. Materials and Methods
2.1. Participant Identification and Screening
Through contacts with local clinics and universities, we initially identified 45 married couples for study enrollment. These couples were divided into 22 fertile and 23 infertile couples, where one or both partners could either be fertile or infertile. Out of these 45 couples, 66 individuals including 32 females (14 fertile, 18 infertile) and 34 males (17 fertile and 17 infertile) who met the study enrollment criteria (read below) were recruited for the study. Initially, all couples actively trying for pregnancy for more than one year with no conception were categorized as infertile. Next, all participants completed an extensive online questionnaire to self-report and identify any medical condition which could lead to infertility such as prior diagnosis with PCOS or endometriosis in women and abnormal semen parameters in men. All couples with kids who had no difficulty in conceiving after the first year of marriage were considered fertile and hence categorized as controls. Out of the 23 infertile couples, 7 had fertility problems involving both partners (30%), 10 involved only male factor infertility (43%), 3 involved female factor infertility (13%), while no apparent cause or reason of infertility could be established in the remaining 3 couples (13%). In cases where one of the partners was unavailable for sampling, only one partner was sampled. The study exclusion criteria included either the use of antibiotics or travel abroad in the last three months, women on menopause, and participants suffering from inflammatory bowel disease [40]. Both male (mean age 33.97 ± 6.14) and female (mean age 28.25 ± 5.47) participants belonged to the reproductive age (i.e., 19–45) years. All participants provided written informed consent to participate in the study. This study was approved by the Ethics Review Board of COMSATS University Islamabad (CUI) (protocol number: CUI/Bio/ERB/03-19/23 approved on 25 March 2019).
2.2. Sample Collection
Each recruited study participant was instructed to provide two biological samples: (i) fecal sample, which was treated as the proxy for the gut microbiome, and (ii) the genital sample. Samples were self-collected by the study participants following the uBiome protocol for sampling (as also described in our previous study [40]). Participants were briefed about sampling instructions both in writing and in their native language. Specifically, participants were instructed to use a sterile swab soaked in PCR water, provided in the uBiome sampling kit, and then asked to swirl the swab around the genitals for at least one minute. After sampling, swabs were mixed in the DNA lysis and stabilization buffer, provided with the uBiome kits. For fecal samples, sterile wipes and swabs were provided in the uBiome kit. Participants were instructed to wash their hands prior to sampling and to collect the first bowel movement early in the morning while fasting. A small amount of feces from the wipe was then transferred to the sterile swab, which was mixed in the stabilization buffer for one minute, similar to the genital sampling protocol. Samples were stored at room temperature at CUI prior to shipping to uBiome, USA, for subsequent steps.
2.3. 16S Ribosomal RNA (rRNA) Gene Sequencing, DNA Extraction, and PCR Amplification
DNA extraction, PCR amplification, and sequencing were performed by the uBiome laboratory in California. In brief, samples were lysed via mechanical bead beating [41]. DNA extraction followed the protocol of [42]. The V4 region of the 16S ribosomal RNA (rRNA) gene was amplified using universal forward and reverse primers. Illumina barcodes and sequence tags were added to primers for multiplexing. PCR products were selected based on size following the protocol in Minalla et al. (2001) [43]. Multiplexed 150 bp paired-end data was generated for 16S amplicons using the NextSeq 500 platform.
2.4. Quality-Control
Quality-controlled reads provided by uBiome were analyzed locally using QIIME2 [44]. A quick check on quality indicated that reverse reads were, on average, of lower quality than the forward reads. We, therefore, performed bioinformatics analysis only on the forward reads. Pre-processed forward reads were imported into QIIME2 using the ‘import’ plugin and were capped to 125 bp. Additional chimera removal, denoising, and Amplicon Sequence Variants (ASVs) were produced by the DADA2 plugin in QIIME2. Alignment of representative sequences was performed using MAFFT [45], which was subsequently used to generate the unrooted and rooted phylogenetic trees of representative sequences using FastTree [46]. Taxonomic classification was performed using SILVA 128 database [47].
2.5. Evaluation of within and between Sample Diversity
Samples were rarefied to a depth of 5000 prior to diversity analysis. Rarefaction removed one genital sample with a very low read count (see below). Standard phylogenetic and non-phylogenetic α-diversity indicators such as the observed number of ASV’s per sample [48], Faith’s phylogenetic diversity (PD) [49], Shannon’s diversity index [50], and Pielou’s evenness were used to evaluate within-sample diversity [51]. Similarly, standard β-diversity indicators such as the Bray–Curtis dissimilarity [52], Jaccard Distance [53], weighted UniFrac [54] and unweighted UniFrac [55] were calculated on all samples. The α-group significance was evaluated by the non-parametric Kruskal–Wallis (KW) test. The β-group significance was evaluated using PERMANOVA with 999 permutations. Principal coordinate analysis (PCoA) was visualized using Emperor [56] to evaluate sample dissimilarity at key metadata variables.
2.6. Biomarker Discovery
The linear discriminant analysis (LDA) effect size (LEfSe) [57] method from the Galaxy online server (https://huttenhower.sph.harvard.edu/galaxy/) (accessed on 15 December 2019) was used to identify features that were differentially abundant in classes (fertile and infertile) and subclasses (male and female). The LDA threshold was relaxed from 2.0 (default) to 3.0 for these comparisons.
2.7. Metagenome Function Prediction
The functional metagenome of samples was predicted by the PICRUST2 plugin [58] for QIIME2. The three predicted metagenomes were the (i) EC metagenome representing the abundance of features classified by enzyme commission numbers [59], (ii) KO metagenome indicating KEGG orthologs abundance [60], and (iii) the MetaCyc pathways abundance [61]. For all three functional annotations, standard non-phylogenetic α and β diversity indicators were calculated on all samples. Significantly abundant bacterial taxa among fertile and infertile subjects for both body sites and genders were detected by the LEfSe method from Galaxy online server, as above.
3. Results
We sequenced the 16S rRNA (V4 region) for a total of 107 samples donated by 66 selected participants. For some individuals, both gut and genital samples were available and for the rest, only one body site was sequenced. In total, 107 samples included 48 gut and 59 genital samples. The mean number of detected features was 94,067 per sample, ranging from 977 to 524,730. The second smallest sample had 7236 features. Therefore, we rarefied the feature table to a sampling depth of 5000 features per sample and removed one genital sample with the smallest count. Subsequent analysis was therefore done on 106 retained samples (48 gut and 58 genital), each with 5000 features.
3.1. Microbial Taxonomic Composition of Body Sites in Fertile and Infertile Samples
First, we evaluated the phylum-level taxonomic composition in the genital and gut samples for fertile and infertile men and women (Figure 1). For this analysis, we partitioned the rarefied feature table into the gut and genital samples and transformed raw abundance counts into relative abundance values. A total of 26 phyla (including one unassigned) were detected in the genital samples and 18 phyla (one unassigned) were detected in gut samples. Some of these phyla were detected in a very small number of samples. In both gut and genital samples, five major phyla dominated the microbial communities. These included Firmicutes, Actinobacteria, Bacteroidetes, Proteobacteria, and Actinobacteria. The rest were pooled into the ‘others’ category (Figure 1). The gut samples were dominated by Firmicutes and Bacteroidetes (Figure 1 and Table 1). The ratio or imbalance between these two key phyla has previously been linked to obesity [62]. Though, some authors have questioned the claim [63]. In our gut samples, Firmicutes dominated Bacteroidetes (mean relative abundance ranging from 53–63% vs. 11–23%, Table 1), which could indicate a tendency towards weight gain [40]. Firmicutes were significantly more abundant in fertile men vs. infertile men (63.32% vs. 53.45%, p = 0.03, two-tailed Mann–Whitney test) while Bacteroidetes were significantly more abundant in fertile women vs. infertile women (23.01% vs. 13.64%, p = 0.025, two-tailed Mann–Whitney test). In turn, Actinobacteria were significantly more abundant in infertile women vs. fertile women (12.12% vs. 7.36%, p = 0.036, two-tailed Mann–Whitney test). Since the gut microbiome is strongly influenced by diet and we did not have a sufficiently larger sample size, we caution the readers to interpret these numerical differences with caution.
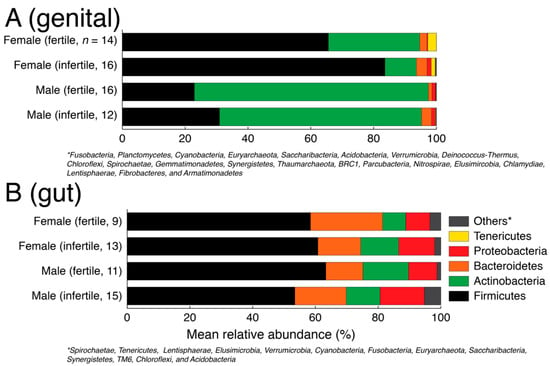
Figure 1.
Phylum level taxonomic composition of genital (A) and gut (B) samples stratified by gender and fertility status.

Table 1.
Mean relative abundance (%) of top five most abundant phyla in each of the eight unique possible combinations of fertility status, body site, and gender.
In turn, there was a relatively greater numerical imbalance in the taxonomic composition between genders and fertility status in the genital samples (Figure 1) but no statistically supported differences (Table 1). For example, Firmicutes were numerically over-represented in infertile women vs. fertile women (83.57% vs. 65.58% mean relative abundance) and Actinobacteria were numerically under-represented in infertile women vs. fertile women (10% vs. 29% mean relative abundance) but the distribution differences were statistically insignificant (p > 0.05, two-tailed Mann–Whitney test) possibly indicating greater individual-to-individual variability. Similarly, Proteobacteria were numerically over-represented in infertile women vs. fertile women (1.32% vs. 0.27%), which has previously been linked with BV [64] and preterm birth [65] but again the differences were statistically insignificant (p = 0.95, two-tailed Mann–Whitney test). This is likely because of the many factors behind infertility and a smaller sample size for each specific factor analyzed in this study.
To zoom into these differences, we next identified the top five (5) most abundant genera in each unique combination of the body site, gender, and fertility status (Table 2). In infertile women, the genital microbiome revealed a relative increase in the populations of Lactobacillus, Atopobium, and Prevotella (Table 2). Lactobacillus, in general, is associated with a healthy pregnancy and is considered a beneficial microorganism in the women reproductive tract [66]. Therefore, our observation of a higher relative increase in Lactobacillus abundance in infertile women merits further investigation. However, relative increases in the abundances of Atopobium and Prevotella in the vaginal microbiome of infertile women were also reported in a recent study to characterize the vaginal microbiome in women experiencing secondary infertility [19]. The authors concluded that a combination effect caused by higher abundances of these genera, among others, was probably a contributing factor in infertility [19]. The gut microbiome also revealed fluctuations in key genera populations between fertile and infertile men and women. A notable appearance was of Succinivibrio population in infertile men (8.23% of total community), which are potentially sugar-metabolizing bacteria [67] and were previously detected in higher amounts in Pakistani men [40]. In turn, Succinivibrio was not amongst the top five genera in the gut microbiome of fertile men (Table 2).
Table 2.
Mean relative abundance of the top five most abundant genera in each of the eight unique possible combinations of fertility status, body site, and gender.
Taken together, various fluctuations in the relative abundances of key microbial taxa were observed between fertile and infertile individuals for both body sites, along with evidence of significant heterogeneity among individuals. However, given the small sampling sizes and the individual-level heterogeneity, these differences should be interpreted with caution.
3.2. Significantly Different within-Sample Diversity in the Genital Microbiome of Fertile and Infertile Men
The α-diversity of the retained samples was evaluated by four standard measures: (i) the observed ASVs (the number of unique or distinct ASVs in a sample) [48], (ii) Shannon’s diversity index (considers both ASV abundance and evenness in samples) [50], Faith’s PD, which evaluates diversity based on phylogenetic trees [49], and (iv) Pielou’s evenness, which measures the relative evenness of ASVs in samples [51]. Gut samples, on average, indicated higher within-sample diversity compared to genital samples, while genital samples again indicated greater variability (Figure 2). When partitioned by gender and fertility status, only Faith’s PD was significantly different in the genital samples donated by fertile and infertile males (Figure 2). This result is further evident in Table 3, which lists the p- and Q-values (FDR adjusted) for each comparison, based on the non-parametric pairwise KW test. In general, p- and Q-values were consistently lower for male genital sample comparisons based on Faith’s PD and Pielou’s evenness. Another marginally significant result was differences in the Shannon’s diversity index for fertile and infertile gut samples donated by sampled women (Table 3). The violin plot distributions in Figure 2 confirm that Shannon’s diversity values for gut samples were relatively more widespread among fertile women than infertile women.
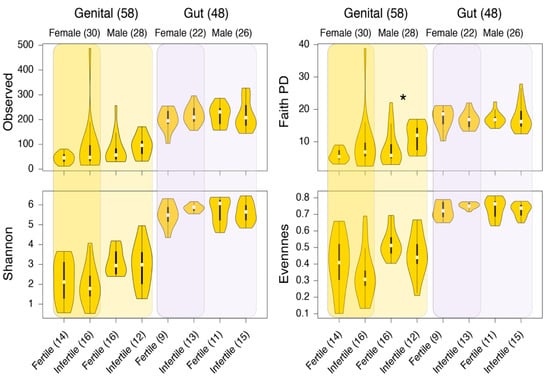
Figure 2.
Comparisons of alpha-diversity distributions between the genital and gut samples. Plots are stratified by gender and fertility status. Numbers in parenthesis indicate the total number of samples in that group. * p < 0.05, KW test.
Table 3.
Alpha-diversity differences in the studied groups. These differences were based on the non-parametric pairwise KW test. p- and Q-values < 0.1 are in bold (relaxed thresholds to detect more differences).
3.3. No Visible Structure but Significant between Sample Diversity Differences among Fertile and Infertile Genital Samples
In terms of β-diversity, no visible structure was evident between fertile and infertile samples for any of the four studied measures (Figure 3). These measures included the non-phylogenetic indicators of β-diversity such as the Bray–Curtis and Jaccard and the phylogenetic measures of weighted and unweighted UniFrac. Bray–Curtis quantifies compositional dissimilarity between two different samples [52] while Jaccard measures how dissimilar the two groups are [53]. In turn, the weighed [54] and unweighted UniFrac [55] are derived from phylogenetic trees and calculate phylogenetic distances between pairs of samples. Regardless of the choice of β-diversity indicator, samples clustered by body site rather than by fertility status, which was expected (Figure 3).
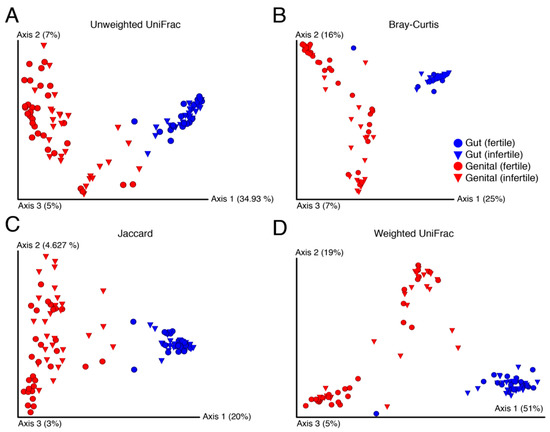
Figure 3.
Principal coordinates highlight dissimilarity between samples evaluated by standard beta-diversity indicators ((A–D), Unweighted UniFrac, Bray-Curtis, Jaccard, and Weighted UniFrace, respectively). Numbers in parentheses indicate percentage variability (%) explained by each axis.
In general, gut samples had lower between sample variability than genital samples, which were widespread on the three principal coordinates (Figure 3). This indicated that gut samples from an individual to another were relatively more similar in diversity and independent of the fertility status and gender. In turn, genital samples indicated massive variability from an individual to another but apparently no visible structure by fertility. This likely occurred because of the many varied causes of infertility that may influence each individual differently. Surprisingly, however, fertile genital samples were also equally widespread on the axes. We, therefore, evaluated the significance of β-diversity differences between samples using the PERMAONVA test with 999 permutations. Interestingly, genital β-diversity between fertile and infertile groups was significantly different for both men and women under the relaxed thresholds (Table 4). In comparison, there were no significant differences in gut β-diversity between fertile and infertile men and women, except for the weighted UniFrac measure calculated for females (Table 4).
Table 4.
Differences in the beta-diversity among samples, as evaluated by pairwise PERMONVA with 999 permutations. (<0.1 are in bold).
3.4. Biomarker Discovery
Next, we identified key microbial families and genera that were differentially abundant in the genital and gut samples. Differential abundance was evaluated across class (fertility/infertility) and sub-class (female/male) separately for both body sites using LEfSe [57]. For genital samples, members of family Lachnospiraceae were significantly more abundant in infertile samples relative to fertile samples (Figure 4A). Lachnospiraceae sp. have previously been linked to BV [68]. In turn, the fertile group had significantly higher abundances of family Aerococcaceae and genus Tessaracoccus. Aerococcaceae are a family of Gram-positive lactic acid bacteria and its high relative abundance was detected in women having a high risk of human papillomavirus infection [69]. In turn, Tessaracoccus are Gram-positive bacteria that belong to family Propionibacteriaceae. In a recent study, Tessaracoccus were detected in the vaginal swab of healthy women [70]. It is usually detected in the gut of children suffering from Kwashiorkor (a severe form of malnutrition) [71]. In gut samples, members of phylum Proteobacteria, genus Ruminococcaceae UCG 002, and Ruminiclostridium 5 were significantly more abundant in infertile samples, while genera Coprococcus 3, Bilophila, Ruminococcus gauvreauii group, and Lachnospira were significantly overrepresented in fertile samples groups (Figure 4B). Proteobacteria are Gram-negative bacteria that include a notable and wide range of pathogenic genera, for example, Escherichia, Vibrio, and Helicobacter, among several others [72]. The higher abundance of Proteobacteria is generally a marker of dysbiosis in the gut microbiota and potentially a predictor for metabolic diseases [73]. In turn, family Ruminococcaceae UCG 002 belongs to Ruminococcaceae. This genus is usually enriched in the urine of bladder cancer patients [74]. Ruminiclostridium 5 is a member of family Ruminococcaceae. It is significantly more abundant in carbohydrate-utilizing digesta-associated bacterial communities [75]. Coprococcus 3 is a member of family Lachnospiraceae. It is significantly abundant in the gut microbiota of healthy individuals [76]. It is also observed that gout patients have a low relative abundance of genus Coprococcus 3 [77]. Genus Bilophila is an anaerobic, gram-negative Proteobacteria. In human gut microbiota, its significant depletion is detected following insulin intake [78]. Its decreased relative abundance is also observed in autistic individuals [79]. Ruminococcus gauvreauii group is an anaerobic Gram-positive bacterium, first isolated from a human fecal specimen and produce acetic acid as a result of fermentation of glucose [80]. Finally, genus Lachnospira belongs to family Lachnospiraceae and its low relative abundance is detected in alcoholic individuals [81]. Its decreased abundance can also enhance the risk of developing asthma in children [82]. Although, we lack clarification on how these abundances may be associated with infertility.
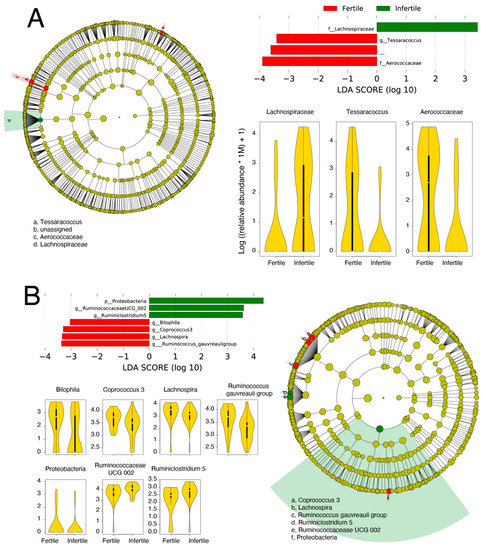
Figure 4.
Biomarker discovery in the genital (A) and gut (B) samples. Microbial taxa differentially abundant between fertile and infertile genital and gut samples are named along with their LDA scores, cladograms, and relative abundance distributions.
3.5. Metagenome Profiling of Genital and Gut Samples
To visualize the functional repertoire of microbial communities in our studied groups, we predicted the functional metagenome of our samples using PICRUSt2 [58]. We performed functional annotations using KEGG [60], EC [59], and MetaCyc Pathways [61] on the rarefied tables generated previously. The output feature tables were subsequently rarefied to the lowest count for each of the three functions and tested for significant differences using the KW test. Both gut and genital samples were partitioned by gender and fertility status. For the EC metagenome, Pielou’s evenness differed significantly in the genital microbiome of fertile and infertile men (Table 5). Similarly, the gut microbiome differed significantly between fertile and infertile women based on EC annotations (Table 5). Similar results were obtained largely for KEGG (Table 6) and pathway annotations (Table 7). In terms of between sample metagenome variability and beta-diversity, statistically significant differences were detected in different combinations (Table 8, Table 9 and Table 10). To resolve these findings, we performed biomarker discovery on all three annotations and two body sites (Table 11). In total, 14 enzymes including 4 transferases and 3 oxidoreductases, which are known to affect steroid production [83], and 1 KEGG ortholog (Glycerol-3-phosphate dehydrogenase), which is required for sperm motility [84] differed significantly between the fertile and infertile genital samples.
Table 5.
Differences in the alpha-diversity of EC metagenome between samples. (<0.1 in bold).
Table 6.
Differences in the alpha-diversity of KO metagenome between samples. (<0.1 are in bold).
Table 7.
Differences in the alpha-diversity of MetaCyc pathways between samples. (<0.1 are in bold).
Table 8.
Differences in the beta-diversity of EC metagenome between samples. (PERMANOVA, <0.1 are in bold).
Table 9.
Differences in the beta-diversity of KO metagenome between samples. (PERMANOVA, <0.1 are in bold).
Table 10.
Differences in the beta-diversity of MetaCyc pathways between samples. (PERMANOVA, <0.1 are in bold).
Table 11.
Differentially abundant metagenome features in gut and genital samples.
4. Discussion
Infertility affects millions of men and women worldwide [3]. It is often associated with stigma and social pressure, especially in developing countries such as Pakistan, where men typically free themselves from any responsibility. While technological advancements such as the wide acceptance of IVF, IUI, and ICSI are now commonly employed across the world to treat infertility, seeking such treatment options in Pakistan may not be as accessible or straightforward.
There are numerous reasons behind the low acceptance of infertility as a treatable disease in Pakistan. First, treatments such as IVF are considered expensive and uncertain. This is largely a consequence of limited awareness as there are several IVF clinics now operating in Pakistan with costs ranging from USD 2500 to USD 4000, which are a fraction of the total IVF-associated costs in developed countries such as the US and in Europe (can be up to USD 40,000 or more) [85]. Whereas IUI may only cost around USD 300–500 per round in Pakistan and is available across most local fertility clinics. These clinics are therefore the choice for several Expat Pakistani couples struggling with infertility and finances [86]. Second, infertility is commonly advertised as a ‘women-only’ problem both in popular Pakistani media and among family circles [87]. Consequently, men even deny diagnosis and women solely suffer the emotional toll of infertility, sometimes leading to separation and divorce. This is unfortunate as our survey shows that 43% of the infertile couples had male-factor infertility. Through this manuscript, we, therefore, wish to emphasize that infertility can affect both men and women and there is no stigma in receiving diagnosis and treatment, especially when they are accessible at a low cost compared to similar options in the most developed countries.
In the recent past, several studies have explored alternative associations that may explain fluctuations in human health and behavior. These include studying the microbial taxonomic composition and phylogenetic diversity associated with the digestive tract to explain various metabolic and physiological diseases [88]. Work has also expanded to the sequencing of the microbiome of the reproductive tract to hopefully understand how microorganisms may contribute towards the reproductive health of the individual [89]. In this study, we, therefore, identified several Pakistani couples struggling with infertility and sequenced their microbiomes from the digestive and reproductive tracts. For comparison, we also sequenced the same microbiomes from fertile controls. To our knowledge, this is the first study of its kind to explore both between and body site microbiome variability among fertile and infertile couples in Pakistan.
Our investigations revealed some strong and some weak statistical differences in the taxonomic structure and diversity of microbial communities associated with the fertile and infertile samples. For example, Actinobacteria and Proteobacteria indicated high fluctuations between fertile and infertile communities sampled from the genitals. Proteobacteria were also relatively more abundant in infertile men who donated stool samples. Proteobacteria is a large phylum of bacteria that includes many notable human pathogens. They are usually a minor part of the gut microbial communities, and a high abundance of Proteobacteria in the gut of infertile males indicates gut microbiota dysbiosis, as it is a marker of microbial imbalance in the gut and a potential microbial signature in many disorders [90]. Similarly, the relative abundance of Prevotella increased in the genital samples from infertile male and female participants (Table 2). An increase in Prevotella has been linked with the failure of assisted reproductive technologies (ART), including IVF and ICSI, resulting in hindrance in conception [65]. Similarly, we also observed a shift in the vaginal microbiome to a community that is associated with BV. The biomarker analyses also revealed similar patterns. For example, the genital samples of infertile persons were enriched with Lachnospiraceae (Figure 4) that is strongly linked with BV [91].
Our study has some limitations that need to be addressed in the follow-up studies. The gut microbiome of individuals can vary because of numerous dietary and social habits. For example, a shift from a meat-based to a plant-based diet can alter microbial community composition [92]. Thus, fluctuations in the gut microbiome may neither be the cause nor effect of infertility. Similarly, the level of social stress and the metabolic health of individuals also needs to be properly investigated. Several conditions such as allergies [93], viral and bacterial infections [94], and the past history of vaccination [95] and immunization [96] can also impact the gut microbiome structure and taxonomic diversity. These factors can be tested via thorough medical examinations but in our work have been taken at face value via participant self-reported data. Similarly, infertility can be caused by various reasons such as PCOS, physical injuries, emotional stress, among others [97]. In our work, we pooled all contributing factors under one umbrella. This kind of analysis, therefore, lacks resolution but provides a “bird’s eye” view of the differences in the microbial communities between fertile and infertile samples, which may be due to one or several underlying factors. Further, we relaxed the p- and Q- thresholds to 0.1 to be able to detect finer differences among groups and subjects. Nevertheless, and to the best of our knowledge, the present work is the first effort to link the microbiome to infertility across Pakistan. We included individuals from diverse ethnicities in the present work and sampled two body sites, where possible. The analysis identified some key biomarker microbial taxa that are significantly and differentially populated between fertile and infertile samples. Their pathology and microbiology need to be better investigated. Similarly, the overall diversity analysis points to structural changes in microbial communities across fertile and infertile samples that also need to be better investigated.
Author Contributions
Conceptualization and designed the study, A.N. and S.T.A.S.; methodology and experimental work, A.M., S.A., M.A.S., F.G., M.u.R.K. and A.N.; formal analysis and interpretation of results, A.N., M.u.R.K., S.J. and S.S.A.Z.; writing—review and editing, A.M., F.G., S.J. and A.N. All authors have read and agreed to the published version of the manuscript.
Funding
This research was funded by the uBiome Academic Grant Program to AN. Funders provided sampling kits, DNA sequencing, and bioinformatics services. The travelling and sampling cost was funded by a grant from the Higher Education commission Pakistan under NRPU grant number 3729 to STAS.
Institutional Review Board Statement
This study was reviewed and approved by the COMSATS Ethics Review Board.
Informed Consent Statement
Informed consent was obtained from all subjects involved in the study.
Data Availability Statement
The data presented in this study are available on request from the authors and after appropriate IRB approvals.
Acknowledgments
We thank the anonymous donors who donated biological samples for this study. We are grateful former employees of uBiome for providing uBiome sequencing and bioinformatics services.
Conflicts of Interest
The authors declare no conflict of interest. The funders had no role in the design of the study; in the collection, analyses, or interpretation of data; in the writing of the manuscript, or in the decision to publish the results.
References
- Zegers-Hochschild, F.; Adamson, G.D.; Dyer, S.; Racowsky, C.; de Mouzon, J.; Sokol, R.; Rienzi, L.; Sunde, A.; Schmidt, L.; Cooke, I.D.; et al. The International Glossary on Infertility and Fertility Care, 2017. Hum. Reprod. 2017, 32, 1786–1801. [Google Scholar] [CrossRef] [PubMed] [Green Version]
- Practice Committee of the American Society for Reproductive Medicine. Definitions of infertility and recurrent pregnancy loss: A committee opinion. Fertil. Steril. 2020, 113, 533–535. [Google Scholar] [CrossRef] [PubMed]
- Inhorn, M.C.; Patrizio, P. Infertility around the globe: New thinking on gender, reproductive technologies and global movements in the 21st century. Hum. Reprod. Updat. 2015, 21, 411–426. [Google Scholar] [CrossRef] [Green Version]
- Vander Borght, M.; Wyns, C. Fertility and infertility: Definition and epidemiology. Clin. Biochem. 2018, 62, 2–10. [Google Scholar] [CrossRef] [PubMed]
- Direkvand-Moghadam, A.; Sayehmiri, K.; Delpisheh, A. The global trend of infertility: An original review and meta-analysis. Int. J. Epidemiol. Res. 2014, 1, 35–43. [Google Scholar]
- Infertility Statistics CDC. 2020. Available online: https://www.cdc.gov/nchs/fastats/infertility.htm (accessed on 3 January 2020).
- Ahmed, H.M.; Khan, M.; Yasmin, F.; Jawaid, H.; Khalid, H.; Shigri, A.; Nawaz, F.; Hasan, C.A. Awareness Regarding Causes of Infertility Among Out-patients at a Tertiary Care Hospital in Karachi, Pakistan. Cureus 2020, 12, e7685. [Google Scholar] [CrossRef] [Green Version]
- Shaheen, R.; Subhan, F.; Sultan, S.; Subhan, K.; Tahir, F. Prevalence of Infertility in a Cross Section of Pakistani Population. Pak. J. Zool. 2010, 42, 389–393. [Google Scholar]
- Sami, N.; Ali, T.S.; Wasim, S.; Saleem, S. Risk Factors for Secondary Infertility among Women in Karachi, Pakistan. PLoS ONE 2012, 7, e35828. [Google Scholar] [CrossRef] [Green Version]
- Deyhoul, N.; Mohamaddoost, T.; Hosseini, M. Infertility-Related Risk Factors: A Systematic Review. Int. J. Women’s Health Reprod. Sci. 2017, 5, 24–29. [Google Scholar] [CrossRef] [Green Version]
- Babakhanzadeh, E.; Nazari, M.; Ghasemifar, S.; Khodadadian, A. Some of the Factors Involved in Male Infertility: A Prospective Review. Int. J. Gen. Med. 2020, 13, 29–41. [Google Scholar] [CrossRef] [Green Version]
- Miller, D.; Vukina, J. Recent advances in clinical diagnosis and treatment of male factor infertility. Postgrad. Med. 2020, 132, 28–34. [Google Scholar] [CrossRef] [PubMed]
- Shanmugham, D.; Sahitya, N.D.; Natarajan, S.; Saravanany, D.K. Role of diagnostic hystero-laparoscopy in the evaluation of female infertility. Int. J. Reprod. Contracept. Obstet. Gynecol. 2019, 8, 3156–3161. [Google Scholar] [CrossRef]
- Khan, M.; Zafar, S.; Syed, S. Successful intravaginal culture of human embryos for the first time in Pakistan—An experience at the Sindh Institute of Reproductive Medicine, Karachi. J. Pak. Med. Assoc. 2013, 63, 630–632. [Google Scholar]
- Rehman, R.; Irfan, T.; Jawed, S.; Hussain, M.; Ali, R. Embryo quality in intracytoplasmic sperm injection: A quasi experimental design in Pakistan. J. Pak. Med. Assoc. 2018, 68, 1451–1455. [Google Scholar] [PubMed]
- Bhamani, S.S.; Zahid, N.; Zahid, W.; Farooq, S.; Sachwani, S.; Chapman, M.; Asad, N. Association of depression and resilience with fertility quality of life among patients presenting to the infertility centre for treatment in Karachi, Pakistan. BMC Public Health 2020, 20, 1607. [Google Scholar] [CrossRef] [PubMed]
- D’Argenio, V.; Salvatore, F. The role of the gut microbiome in the healthy adult status. Clin. Chim. Acta 2015, 451, 97–102. [Google Scholar] [CrossRef] [Green Version]
- Cani, P.D. Human gut microbiome: Hopes, threats and promises. Gut 2018, 67, 1716–1725. [Google Scholar] [CrossRef]
- Zhao, C.; Wei, Z.; Yang, J.; Zhang, J.; Yu, C.; Yang, A.; Zhang, M.; Zhang, L.; Wang, Y.; Mu, X.; et al. Characterization of the Vaginal Microbiome in Women with Infertility and Its Potential Correlation with Hormone Stimulation during In Vitro Fertilization Surgery. Msystems 2020, 5, 00450-20. [Google Scholar] [CrossRef]
- Sirota, I.; Zarek, S.M.; Segars, J.H. Potential influence of the microbiome on infertility and assisted reproductive technology. In Seminars in Reproductive Medicine; Thieme Medical Publishers: New York, NY, USA, 2014; Volume 32, pp. 35–42. [Google Scholar]
- Stevens, J.S.; Criss, A.K. Pathogenesis of Neisseria gonorrhoeae in the female reproductive tract: Neutrophilic host response, sustained infection, and clinical sequelae. Curr. Opin. Hematol. 2018, 25, 13–21. [Google Scholar] [CrossRef]
- Woodhall, S.C.; Gorwitz, R.J.; Migchelsen, S.J.; Gottlieb, S.L.; Horner, P.J.; Geisler, W.M.; Winstanley, C.; Hufnagel, K.; Waterboer, T.; Martin, D.L.; et al. Advancing the public health applications of Chlamydia trachomatis serology. Lancet Infect. Dis. 2018, 18, e399–e407. [Google Scholar] [CrossRef]
- Lewis, F.M.T.; Bernstein, K.T.; Aral, S.O. Vaginal Microbiome and Its Relationship to Behavior, Sexual Health, and Sexually Transmitted Diseases. Obstet. Gynecol. 2017, 129, 643–654. [Google Scholar] [CrossRef]
- Yurchuk, T.O.; Pavlovich, O.V.; Gapon, G.O.; Pugovkin, A.Y.; Petrushko, M.P. Lipid peroxidation and DNA fragmentation in fresh and cryopreserved spermatozoa of men at different spermatogenesis state. Ukr. Biochem. J. 2021, 93, 24–29. [Google Scholar] [CrossRef]
- Mändar, R.; Punab, M.; Korrovits, P.; Türk, S.; Ausmees, K.; Lapp, E.; Preem, J.-K.; Oopkaup, K.; Salumets, A.; Truu, J. Seminal microbiome in men with and without prostatitis. Int. J. Urol. 2017, 24, 211–216. [Google Scholar] [CrossRef] [PubMed] [Green Version]
- Baud, D.; Pattaroni, C.; Vulliemoz, N.; Castella, V.; Marsland, B.J.; Stojanov, M. Sperm Microbiota and Its Impact on Semen Parameters. Front. Microbiol. 2019, 10, 234. [Google Scholar] [CrossRef] [Green Version]
- Farahani, L.; Tharakan, T.; Yap, T.; Ramsay, J.W.; Jayasena, C.; Minhas, S. The semen microbiome and its impact on sperm function and male fertility: A systematic review and meta-analysis. Andrology 2021, 9, 115–144. [Google Scholar] [CrossRef] [PubMed]
- Weng, S.-L.; Chiu, C.-M.; Lin, F.-M.; Huang, W.-C.; Liang, C.; Yang, T.; Yang, T.-L.; Liu, C.-Y.; Wu, W.-Y.; Chang, Y.-A.; et al. Bacterial Communities in Semen from Men of Infertile Couples: Metagenomic Sequencing Reveals Relationships of Seminal Microbiota to Semen Quality. PLoS ONE 2014, 9, e110152. [Google Scholar] [CrossRef] [Green Version]
- Koedooder, R.; Singer, M.; Schoenmakers, S.; Savelkoul, P.H.M.; Morré, S.A.; De Jonge, J.D.; Poort, L.; Cuypers, W.J.S.S.; Beckers, N.G.M.; Broekmans, F.J.M.; et al. The vaginal microbiome as a predictor for outcome of in vitro fertilization with or without intracytoplasmic sperm injection: A prospective study. Hum. Reprod. 2019, 34, 1042–1054. [Google Scholar] [CrossRef]
- Salliss, M.E.; Farland, L.V.; Mahnert, N.D.; Herbst-Kralovetz, M.M. The role of gut and genital microbiota and the estrobolome in endometriosis, infertility and chronic pelvic pain. Hum. Reprod. Updat. 2021. [Google Scholar] [CrossRef]
- Ser, H.-L.; Wong, J.Y.J.; Letchumanan, V.; Law, J.W.-F.; Tan, L.T.-H.; Lee, L.-H. IDDF2021-ABS-0132 Moving beyond the gastrointestinal tract: The involvement of gut microbiome in endometriosis. Basic Gastron. 2021, 70, A46–A47. [Google Scholar]
- Lüll, K.; Arffman, R.K.; Sola-Leyva, A.; Molina, N.M.; Aasmets, O.; Herzig, K.-H.; Plaza-Díaz, J.; Franks, S.; Morin-Papunen, L.; Tapanainen, J.S.; et al. The Gut Microbiome in Polycystic Ovary Syndrome and Its Association with Metabolic Traits. J. Clin. Endocrinol. Metab. 2021, 106, 858–871. [Google Scholar] [CrossRef]
- He, Y.; Jin, X.; Wang, H.; Dai, H.; Lu, X.; Zhao, J.; Zhang, H.; Chen, W.; Wang, G. The emerging role of the gut microbiome in polycystic ovary syndrome. F&S Rev. 2021, 2, 214–226. [Google Scholar] [CrossRef]
- Bailey, M.T.; Coe, C.L. Endometriosis is associated with an altered profile of intestinal microflora in female rhesus monkeys. Hum. Reprod. 2002, 17, 1704–1708. [Google Scholar] [CrossRef] [PubMed] [Green Version]
- Giampaolino, P.; Foreste, V.; Di Filippo, C.; Gallo, A.; Mercorio, A.; Serafino, P.; Improda, F.; Verrazzo, P.; Zara, G.; Buonfantino, C.; et al. Microbiome and PCOS: State-Of-Art and Future Aspects. Int. J. Mol. Sci. 2021, 22, 2048. [Google Scholar] [CrossRef] [PubMed]
- Garolla, A.; Pizzol, D.; Carosso, A.R.; Borini, A.; Ubaldi, F.M.; Calogero, A.E.; Ferlin, A.; Lanzone, A.; Tomei, F.; Engl, B.; et al. Practical Clinical and Diagnostic Pathway for the Investigation of the Infertile Couple. Front. Endocrinol. 2021, 11, 1032. [Google Scholar] [CrossRef] [PubMed]
- Begum, B.N.; Hasan, S. Psychological problems among women with infertility problem: A comparative study. J. Pak. Med. Assoc. 2014, 64, 1287–1291. [Google Scholar] [PubMed]
- Arya, S.T.; Dibb, B. The experience of infertility treatment: The male perspective. Hum. Fertil. 2016, 19, 242–248. [Google Scholar] [CrossRef]
- Naz, B.; Batool, S.S. Infertility Related Issues and Challenges: Perspectives of Patients, Spouses, and Infertility Experts. Pak. J. Soc. Clin. Psychol. 2017, 15, 3–11. [Google Scholar]
- Batool, M.; Ali, S.B.; Jaan, A.; Khalid, K.; Ali, S.A.; Kamal, K.; Raja, A.A.; Gul, F.; Nasir, A. Initial Sequencing and Characterization of the Gastrointestinal and Oral Microbiota in Urban Pakistani Adults. Front. Cell. Infect. Microbiol. 2020, 10, 409. [Google Scholar] [CrossRef]
- Hummel, W.; Kula, M.-R. Simple method for small-scale disruption of bacteria and yeasts. J. Microbiol. Methods 1989, 9, 201–209. [Google Scholar] [CrossRef]
- Cady, N.C.; Stelick, S.; Batt, C.A. Nucleic acid purification using microfabricated silicon structures. Biosens. Bioelectron. 2003, 19, 59–66. [Google Scholar] [CrossRef]
- Minalla, A.R.; Dubrow, R.S.; Bousse, L.J. Feasibility of high-resolution oligonucleotide separation on a microchip. In Microfluidics and BioMEMS; SPIE: Bellingham, WA, USA, 2001; Volume 4560, pp. 90–97. [Google Scholar]
- Bolyen, E.; Rideout, J.R.; Dillon, M.R.; Bokulich, N.A.; Abnet, C.C.; Al-Ghalith, G.A.; Alexander, H.; Alm, E.J.; Arumugam, M.; Asnicar, F.; et al. Reproducible, interactive, scalable and extensible microbiome data science using QIIME 2. Nat. Biotechnol. 2019, 37, 852–857. [Google Scholar] [CrossRef] [PubMed]
- Katoh, K.; Kuma, K.I.; Toh, H.; Miyata, T. MAFFT version 5: Improvement in accuracy of multiple sequence alignment. Nucleic Acids Res. 2005, 33, 511–518. [Google Scholar] [CrossRef] [PubMed]
- Price, M.N.; Dehal, P.S.; Arkin, A.P. FastTree 2—Approximately Maximum-Likelihood Trees for Large Alignments. PLoS ONE 2010, 5, e9490. [Google Scholar] [CrossRef]
- Quast, C.; Pruesse, E.; Yilmaz, P.; Gerken, J.; Schweer, T.; Yarza, P.; Peplies, J.; Glöckner, F.O. The SILVA ribosomal RNA gene database project: Improved data processing and web-based tools. Nucleic Acids Res. 2013, 41, D590–D596. [Google Scholar] [CrossRef]
- DeSantis, T.Z.; Hugenholtz, P.; Larsen, N.; Rojas, M.; Brodie, E.L.; Keller, K.; Huber, T.; Dalevi, D.; Hu, P.; Andersen, G.L. Greengenes, a Chimera-Checked 16S rRNA Gene Database and Workbench Compatible with ARB. Appl. Environ. Microbiol. 2006, 72, 5069–5072. [Google Scholar] [CrossRef] [Green Version]
- Faith, D.P. Conservation evaluation and phylogenetic diversity. Biol. Conserv. 1992, 61, 1–10. [Google Scholar] [CrossRef]
- Shannon, C.E.; Weaver, W. A Mathematical Model of Communication; University of Illinois Press: Urbana, IL, USA, 1949; p. 11. [Google Scholar]
- Pielou, E.C. The measurement of diversity in different types of biological collections. J. Theor. Biol. 1966, 13, 131–144. [Google Scholar] [CrossRef]
- Sorensen, T.A. A method of establishing groups of equal amplitude in plant sociology based on similarity of species content and its application to analyses of the vegetation on Danish commons. Biol. Skr. 1948, 5, 4. [Google Scholar]
- Jaccard, P. Nouvelles recherches sur la distribution florale. Bull. De La Société Vaud. Des Sci. Nat. 1908, 44, 223–270. [Google Scholar] [CrossRef]
- Lozupone, C.A.; Hamady, M.; Kelley, S.T.; Knight, R. Quantitative and Qualitative β Diversity Measures Lead to Different Insights into Factors That Structure Microbial Communities. Appl. Environ. Microbiol. 2007, 73, 1576–1585. [Google Scholar] [CrossRef] [Green Version]
- Lozupone, C.; Knight, R. UniFrac: A New Phylogenetic Method for Comparing Microbial Communities. Appl. Environ. Microbiol. 2006, 71, 8228–8235. [Google Scholar] [CrossRef] [PubMed] [Green Version]
- Vázquez-Baeza, Y.; Pirrung, M.; Gonzalez, A.; Knight, R. EMPeror: A tool for visualizing high-throughput microbial community data. Gigascience 2013, 2, 2047-217X-2-16. [Google Scholar] [CrossRef] [Green Version]
- Segata, N.; Izard, J.; Waldron, L.; Gevers, D.; Miropolsky, L.; Garrett, W.S.; Huttenhower, C. Metagenomic biomarker discovery and explanation. Genome Biol. 2011, 12, R60. [Google Scholar] [CrossRef] [Green Version]
- Douglas, G.M.; Maffei, V.J.; Zaneveld, J.; Yurgel, S.N.; Brown, J.R.; Taylor, C.M.; Huttenhower, C.; Langille, M.G.I. PIC-RUSt2: An improved and customizable approach for metagenome inference. BioRxiv 2020, 672295. [Google Scholar] [CrossRef] [Green Version]
- Kotera, M.; Okuno, Y.; Hattori, M.; Goto, A.S.; Kanehisa, M. Computational Assignment of the EC Numbers for Genomic-Scale Analysis of Enzymatic Reactions. J. Am. Chem. Soc. 2004, 126, 16487–16498. [Google Scholar] [CrossRef]
- Kanehisa, M.; Furumichi, M.; Tanabe, M.; Sato, Y.; Morishima, K. KEGG: New perspectives on genomes, pathways, diseases and drugs. Nucleic Acids Res. 2017, 45, D353–D361. [Google Scholar] [CrossRef] [Green Version]
- Caspi, R.; Billington, R.; Fulcher, C.A.; Keseler, I.M.; Kothari, A.; Krummenacker, M.; Latendresse, M.; Midford, P.E.; Ong, Q.; Ong, W.K.; et al. The MetaCyc database of metabolic pathways and enzymes. Nucleic Acids Res. 2018, 46, D633–D639. [Google Scholar] [CrossRef] [Green Version]
- Crovesy, L.; Masterson, D.; Rosado, E.L. Profile of the gut microbiota of adults with obesity: A systematic review. Eur. J. Clin. Nutr. 2020, 74, 1251–1262. [Google Scholar] [CrossRef] [PubMed]
- Magne, F.; Gotteland, M.; Gauthier, L.; Zazueta, A.; Pesoa, S.; Navarrete, P.; Balamurugan, R. The Firmicutes/Bacteroidetes Ratio: A Relevant Marker of Gut Dysbiosis in Obese Patients? Nutrients 2020, 12, 1474. [Google Scholar] [CrossRef] [PubMed]
- Okoli, A.C.; Agbakoba, N.R.; Ezeanya, C.C.; Oguejiofor, C.B.; Anukam, K.C. Comparative abundance and functional biomarkers of the vaginal and gut microbiome of Nigerian women with bacterial vaginosis: A study with 16S rRNA metagenomics. J. Med. Lab. Sci. 2019, 29, 1–26. [Google Scholar]
- Li, X.-T.; Hu, R.; Yu, J.; Peng, T.; Lu, J. Analysis of the microbiome based on 16S rRNA gene signature in women with preterm versus term birth. Reprod. Dev. Med. 2021, 5, 81–89. [Google Scholar] [CrossRef]
- Jakobsson, T.; Forsum, U. Lactobacillus iners: A Marker of Changes in the Vaginal Flora? J. Clin. Microbiol. 2007, 45, 3145. [Google Scholar] [CrossRef] [Green Version]
- O’Herrin, S.M.; Kenealy, W.R. Glucose and carbon dioxide metabolism by Succinivibrio dextrinosolvens. Appl. Environ. Microbiol. 1993, 59, 748–755. [Google Scholar] [CrossRef] [PubMed] [Green Version]
- Hummelen, R.; Fernandes, A.D.; Macklaim, J.M.; Dickson, R.J.; Changalucha, J.; Gloor, G.B.; Reid, G. Deep Sequencing of the Vaginal Microbiota of Women with HIV. PLoS ONE 2010, 5, e12078. [Google Scholar] [CrossRef] [Green Version]
- Onywera, H.; Williamson, A.-L.; Mbulawa, Z.Z.; Coetzee, D.; Meiring, T.L. The cervical microbiota in reproductive-age South African women with and without human papillomavirus infection. Papillomavirus Res. 2019, 7, 154–163. [Google Scholar] [CrossRef]
- Fall, N.; Lo, C.; Fournier, P.-E.; Sokhna, C.; Raoult, D.; Fenollar, F.; Lagier, J.-C. Arcanobacterium ihumii sp. nov., Varibaculum vaginae sp. nov. and Tessaracoccus timonensis sp. nov., isolated from vaginal swabs from healthy Senegalese women. New Microbes New Infect. 2019, 31, 100585. [Google Scholar] [CrossRef] [PubMed]
- Seck, E.; Traore, S.; Khelaifia, S.; Beye, M.; Michelle, C.; Couderc, C.; Brah, S.; Fournier, P.-E.; Raoult, D.; Dubourg, G. Tessaracoccus massiliensis sp. nov., a new bacterial species isolated from the human gut. New Microbes New Infect. 2016, 13, 3–12. [Google Scholar] [CrossRef] [PubMed] [Green Version]
- Rizzatti, G.; Lopetuso, L.R.; Gibiino, G.; Binda, C.; Gasbarrini, A. Proteobacteria: A Common Factor in Human Diseases. BioMed Res. Int. 2017, 2017, 9351507. [Google Scholar] [CrossRef] [Green Version]
- Shin, N.-R.; Whon, T.W.; Bae, J.-W. Proteobacteria: Microbial signature of dysbiosis in gut microbiota. Trends Biotechnol. 2015, 33, 496–503. [Google Scholar] [CrossRef]
- Popović, V.B.; Šitum, M.; Chow, C.-E.T.; Chan, L.S.; Roje, B.; Terzić, J. The urinary microbiome associated with bladder cancer. Sci. Rep. 2018, 8, 12157. [Google Scholar] [CrossRef] [Green Version]
- Song, Y.; Malmuthuge, N.; Steele, M.A.; Guan, L.L. Shift of hindgut microbiota and microbial short chain fatty acids profiles in dairy calves from birth to pre-weaning. FEMS Microbiol. Ecol. 2017, 94, fix179. [Google Scholar] [CrossRef]
- Mancabelli, L.; Milani, C.; Lugli, G.A.; Turroni, F.; Mangifesta, M.; Viappiani, A.; Ticinesi, A.; Nouvenne, A.; Meschi, T.; Van Sinderen, D.; et al. Unveiling the gut microbiota composition and functionality associated with constipation through metagenomic analyses. Sci. Rep. 2017, 7, 9879. [Google Scholar] [CrossRef] [Green Version]
- Shao, T.; Shao, L.; Li, H.; Xie, Z.; He, Z.; Wen, C. Combined Signature of the Fecal Microbiome and Metabolome in Patients with Gout. Front. Microbiol. 2017, 8, 268. [Google Scholar] [CrossRef] [PubMed] [Green Version]
- Vandeputte, D.; Falony, G.; Vieira-Silva, S.; Wang, J.; Sailer, M.; Theis, S.; Verbeke, K.; Raes, J. Prebiotic inulin-type fructans induce specific changes in the human gut microbiota. Gut 2017, 66, 1968–1974. [Google Scholar] [CrossRef] [PubMed]
- Strati, F.; Cavalieri, D.; Albanese, D.; De Felice, C.; Donati, C.; Hayek, J.; Jousson, O.; Leoncini, S.; Renzi, D.; Calabrò, A.; et al. New evidences on the altered gut microbiota in autism spectrum disorders. Microbiome 2017, 5, 24. [Google Scholar] [CrossRef] [Green Version]
- Domingo, M.-C.; Huletsky, A.; Boissinot, M.; Bernard, K.A.; Picard, F.J.; Bergeron, M.G. Ruminococcus gauvreauii sp. nov., a glycopeptide-resistant species isolated from a human faecal specimen. Int. J. Syst. Evol. Microbiol. 2008, 58, 1393–1397. [Google Scholar] [CrossRef]
- Engen, P.A.; Green, S.J.; Voigt, R.M.; Forsyth, C.B.; Keshavarzian, A. The gastrointestinal microbiome: Alcohol effects on the composition of intestinal microbiota. Alcohol Res. Curr. Rev. 2015, 37, 223. [Google Scholar]
- Stokholm, J.; Blaser, M.J.; Thorsen, J.; Rasmussen, M.A.; Waage, J.; Vinding, R.K.; Schoos, A.-M.M.; Kunøe, A.; Fink, N.R.; Chawes, B.; et al. Maturation of the gut microbiome and risk of asthma in childhood. Nat. Commun. 2018, 9, 141. [Google Scholar] [CrossRef]
- Habte, M.L.; Beyene, E.A. Biological Application and Disease of Oxidoreductase Enzymes. In Oxidoreductase; IntechOpen: London, UK, 2021. [Google Scholar]
- Miki, K.; Qu, W.; Goulding, E.H.; Willis, W.D.; Bunch, D.; Strader, L.F.; Perreault, S.D.; Eddy, E.M.; O’Brien, D.A. Glyceraldehyde 3-phosphate dehydrogenase-S, a sperm-specific glycolytic enzyme, is required for sperm motility and male fertility. Proc. Natl. Acad. Sci. USA 2004, 101, 16501–16506. [Google Scholar] [CrossRef] [Green Version]
- Chiware, T.M.; Vermeulen, N.; Blondeel, K.; Farquharson, R.; Kiarie, J.; Lundin, K.; Matsaseng, T.C.; Ombelet, W.; Toskin, I. IVF and other ART in low- and middle-income countries: A systematic landscape analysis. Hum. Reprod. Updat. 2021, 27, 213–228. [Google Scholar] [CrossRef]
- Husain, W.; Imran, M. Infertility as seen by the infertile couples from a collectivistic culture. J. Community Psychol. 2021, 49, 354–360. [Google Scholar] [CrossRef]
- Ullah, A.; Ashraf, H.; Tariq, M.; Aziz, S.Z.; Zubair, S.; Sikandar, K.U.R.; Ali, N.; Shakoor, A.; Nisar, M. Battling the Invisible Infertility Agony: A Case Study of Infertile Women in Khyber Pakhtunkhwa-Pakistan. J. Ethn. Cult. Stud. 2021, 8, 89–105. [Google Scholar] [CrossRef]
- Bouter, K.E.; van Raalte, D.H.; Groen, A.K.; Nieuwdorp, M. Role of the Gut Microbiome in the Pathogenesis of Obesity and Obesity-Related Metabolic Dysfunction. Gastroenterology 2017, 152, 1671–1678. [Google Scholar] [CrossRef] [PubMed]
- White, B.A.; Creedon, D.J.; Nelson, K.E.; Wilson, B.A. The vaginal microbiome in health and disease. Trends Endocrinol. Metab. 2011, 22, 389–393. [Google Scholar] [CrossRef] [PubMed] [Green Version]
- Rinninella, E.; Raoul, P.; Cintoni, M.; Franceschi, F.; Miggiano, G.A.D.; Gasbarrini, A.; Mele, M.C. What Is the Healthy Gut Microbiota Composition? A Changing Ecosystem across Age, Environment, Diet, and Diseases. Microorganisms 2019, 7, 14. [Google Scholar] [CrossRef] [PubMed] [Green Version]
- Holm, J.B.; France, M.T.; Ma, B.; McComb, E.; Robinson, C.K.; Mehta, A.; Tallon, L.J.; Brotman, R.M.; Ravel, J. Comparative Metagenome-Assembled Genome Analysis of “Candidatus Lachnocurva vaginae”, Formerly Known as Bacterial Vaginosis-Associated Bacterium−1 (BVAB1). Front. Cell. Infect. Microbiol. 2020, 10, 117. [Google Scholar] [CrossRef] [Green Version]
- David, L.A.; Maurice, C.F.; Carmody, R.N.; Gootenberg, D.B.; Button, J.E.; Wolfe, B.E.; Ling, A.V.; Devlin, A.S.; Varma, Y.; Fischbach, M.A.; et al. Diet rapidly and reproducibly alters the human gut microbiome. Nature 2014, 505, 559–563. [Google Scholar] [CrossRef] [Green Version]
- Savage, J.H.; Lee-Sarwar, K.A.; Sordillo, J.; Bunyavanich, S.; Zhou, Y.; O’Connor, G.; Sandel, M.; Bacharier, L.B.; Zeiger, R.; Sodergren, E.; et al. A prospective microbiome-wide association study of food sensitization and food allergy in early childhood. Allergy 2018, 73, 145–152. [Google Scholar] [CrossRef]
- Harper, A.; Vijayakumar, V.; Ouwehand, A.C.; ter Haar, J.; Obis, D.; Espadaler, J.; Binda, S.; Desiraju, S.; Day, R. Viral Infections, the Microbiome, and Probiotics. Front. Cell. Infect. Microbiol. 2021, 10, 596166. [Google Scholar] [CrossRef]
- Huda, M.N.; Lewis, Z.; Kalanetra, K.M.; Rashid, M.; Ahmad, S.M.; Raqib, R.; Qadri, F.; Underwood, M.A.; Mills, D.A.; Stephensen, C.B. Stool Microbiota and Vaccine Responses of Infants. Pediatrics 2014, 134, e362–e372. [Google Scholar] [CrossRef] [Green Version]
- Hagan, T.; Cortese, M.; Rouphael, N.; Boudreau, C.; Linde, C.; Maddur, M.S.; Das, J.; Wang, H.; Guthmiller, J.; Zheng, N.-Y.; et al. Antibiotics-Driven Gut Microbiome Perturbation Alters Immunity to Vaccines in Humans. Cell 2019, 178, 1313–1328.e13. [Google Scholar] [CrossRef] [PubMed]
- Palomba, S.; Daolio, J.; Romeo, S.; Battaglia, F.A.; Marci, R.; La Sala, G.B. Lifestyle and fertility: The influence of stress and quality of life on female fertility. Reprod. Biol. Endocrinol. 2018, 16, 113. [Google Scholar] [CrossRef] [PubMed] [Green Version]
Publisher’s Note: MDPI stays neutral with regard to jurisdictional claims in published maps and institutional affiliations. |
© 2021 by the authors. Licensee MDPI, Basel, Switzerland. This article is an open access article distributed under the terms and conditions of the Creative Commons Attribution (CC BY) license (https://creativecommons.org/licenses/by/4.0/).