Diet-Induced Obesity Promotes the Upregulation of Fas Expression on T-cells
Abstract
Simple Summary
Abstract
1. Introduction
2. Materials and Methods
2.1. Animal Handling
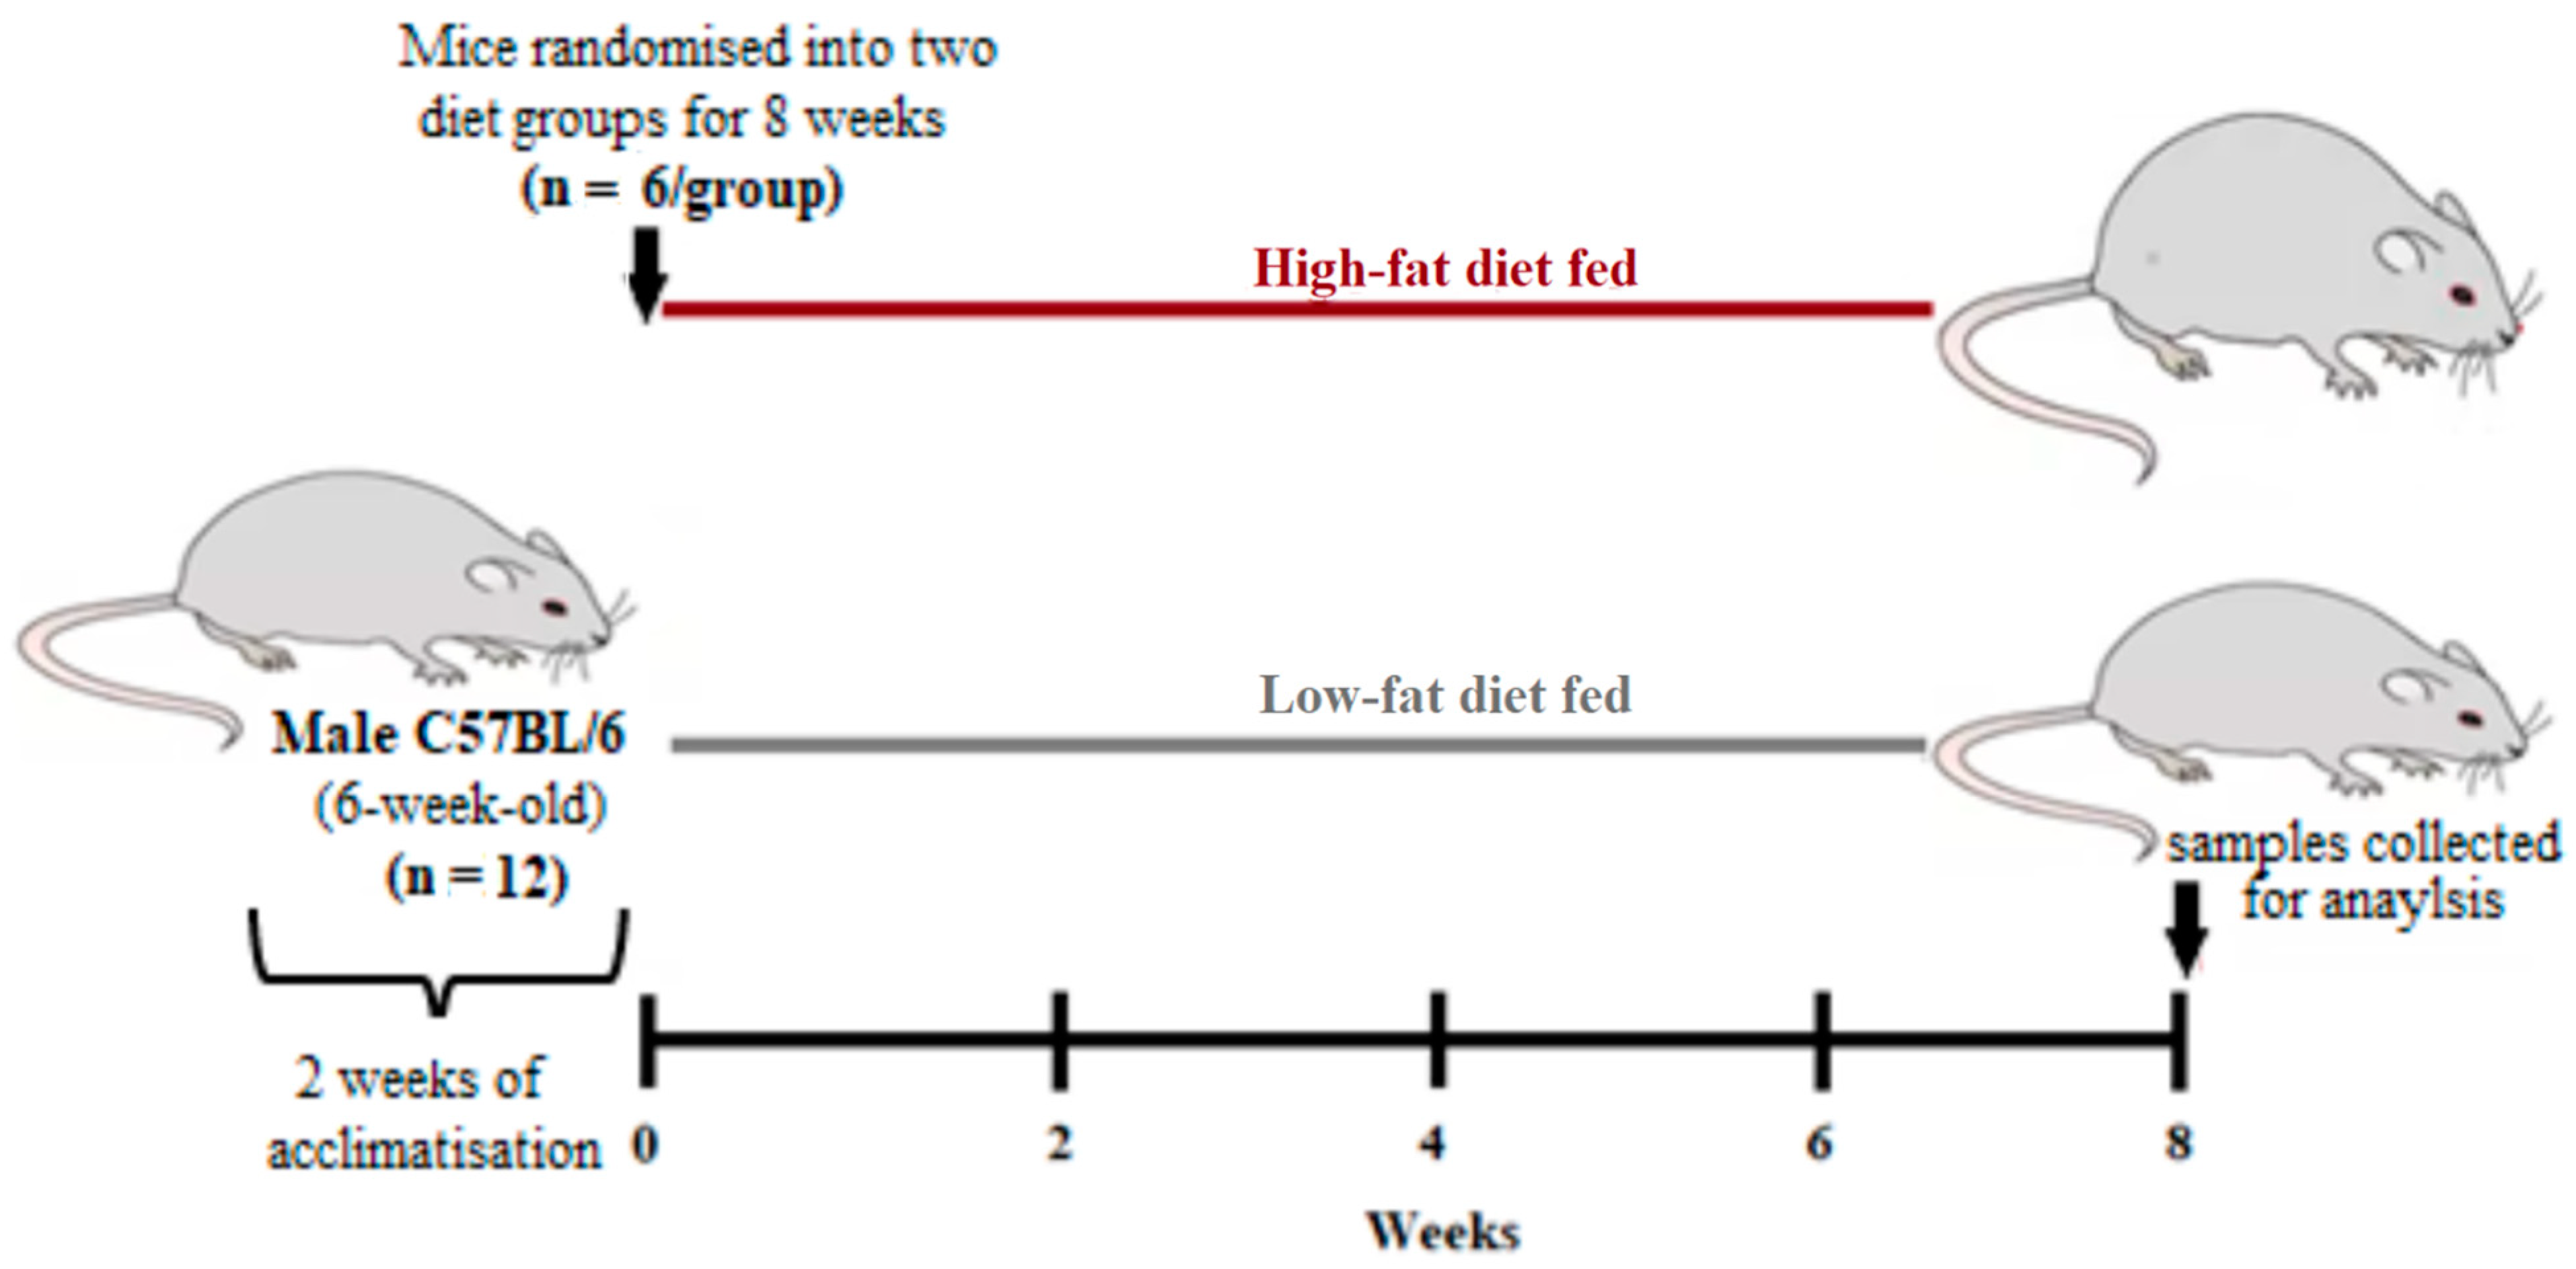
2.2. Study Design
2.3. Measurements of Metabolic Profiles and Hematological Parameters
2.4. Measurements of FAS and PD-1 Levels on T-cells
2.5. Statistical Analysis
3. Results
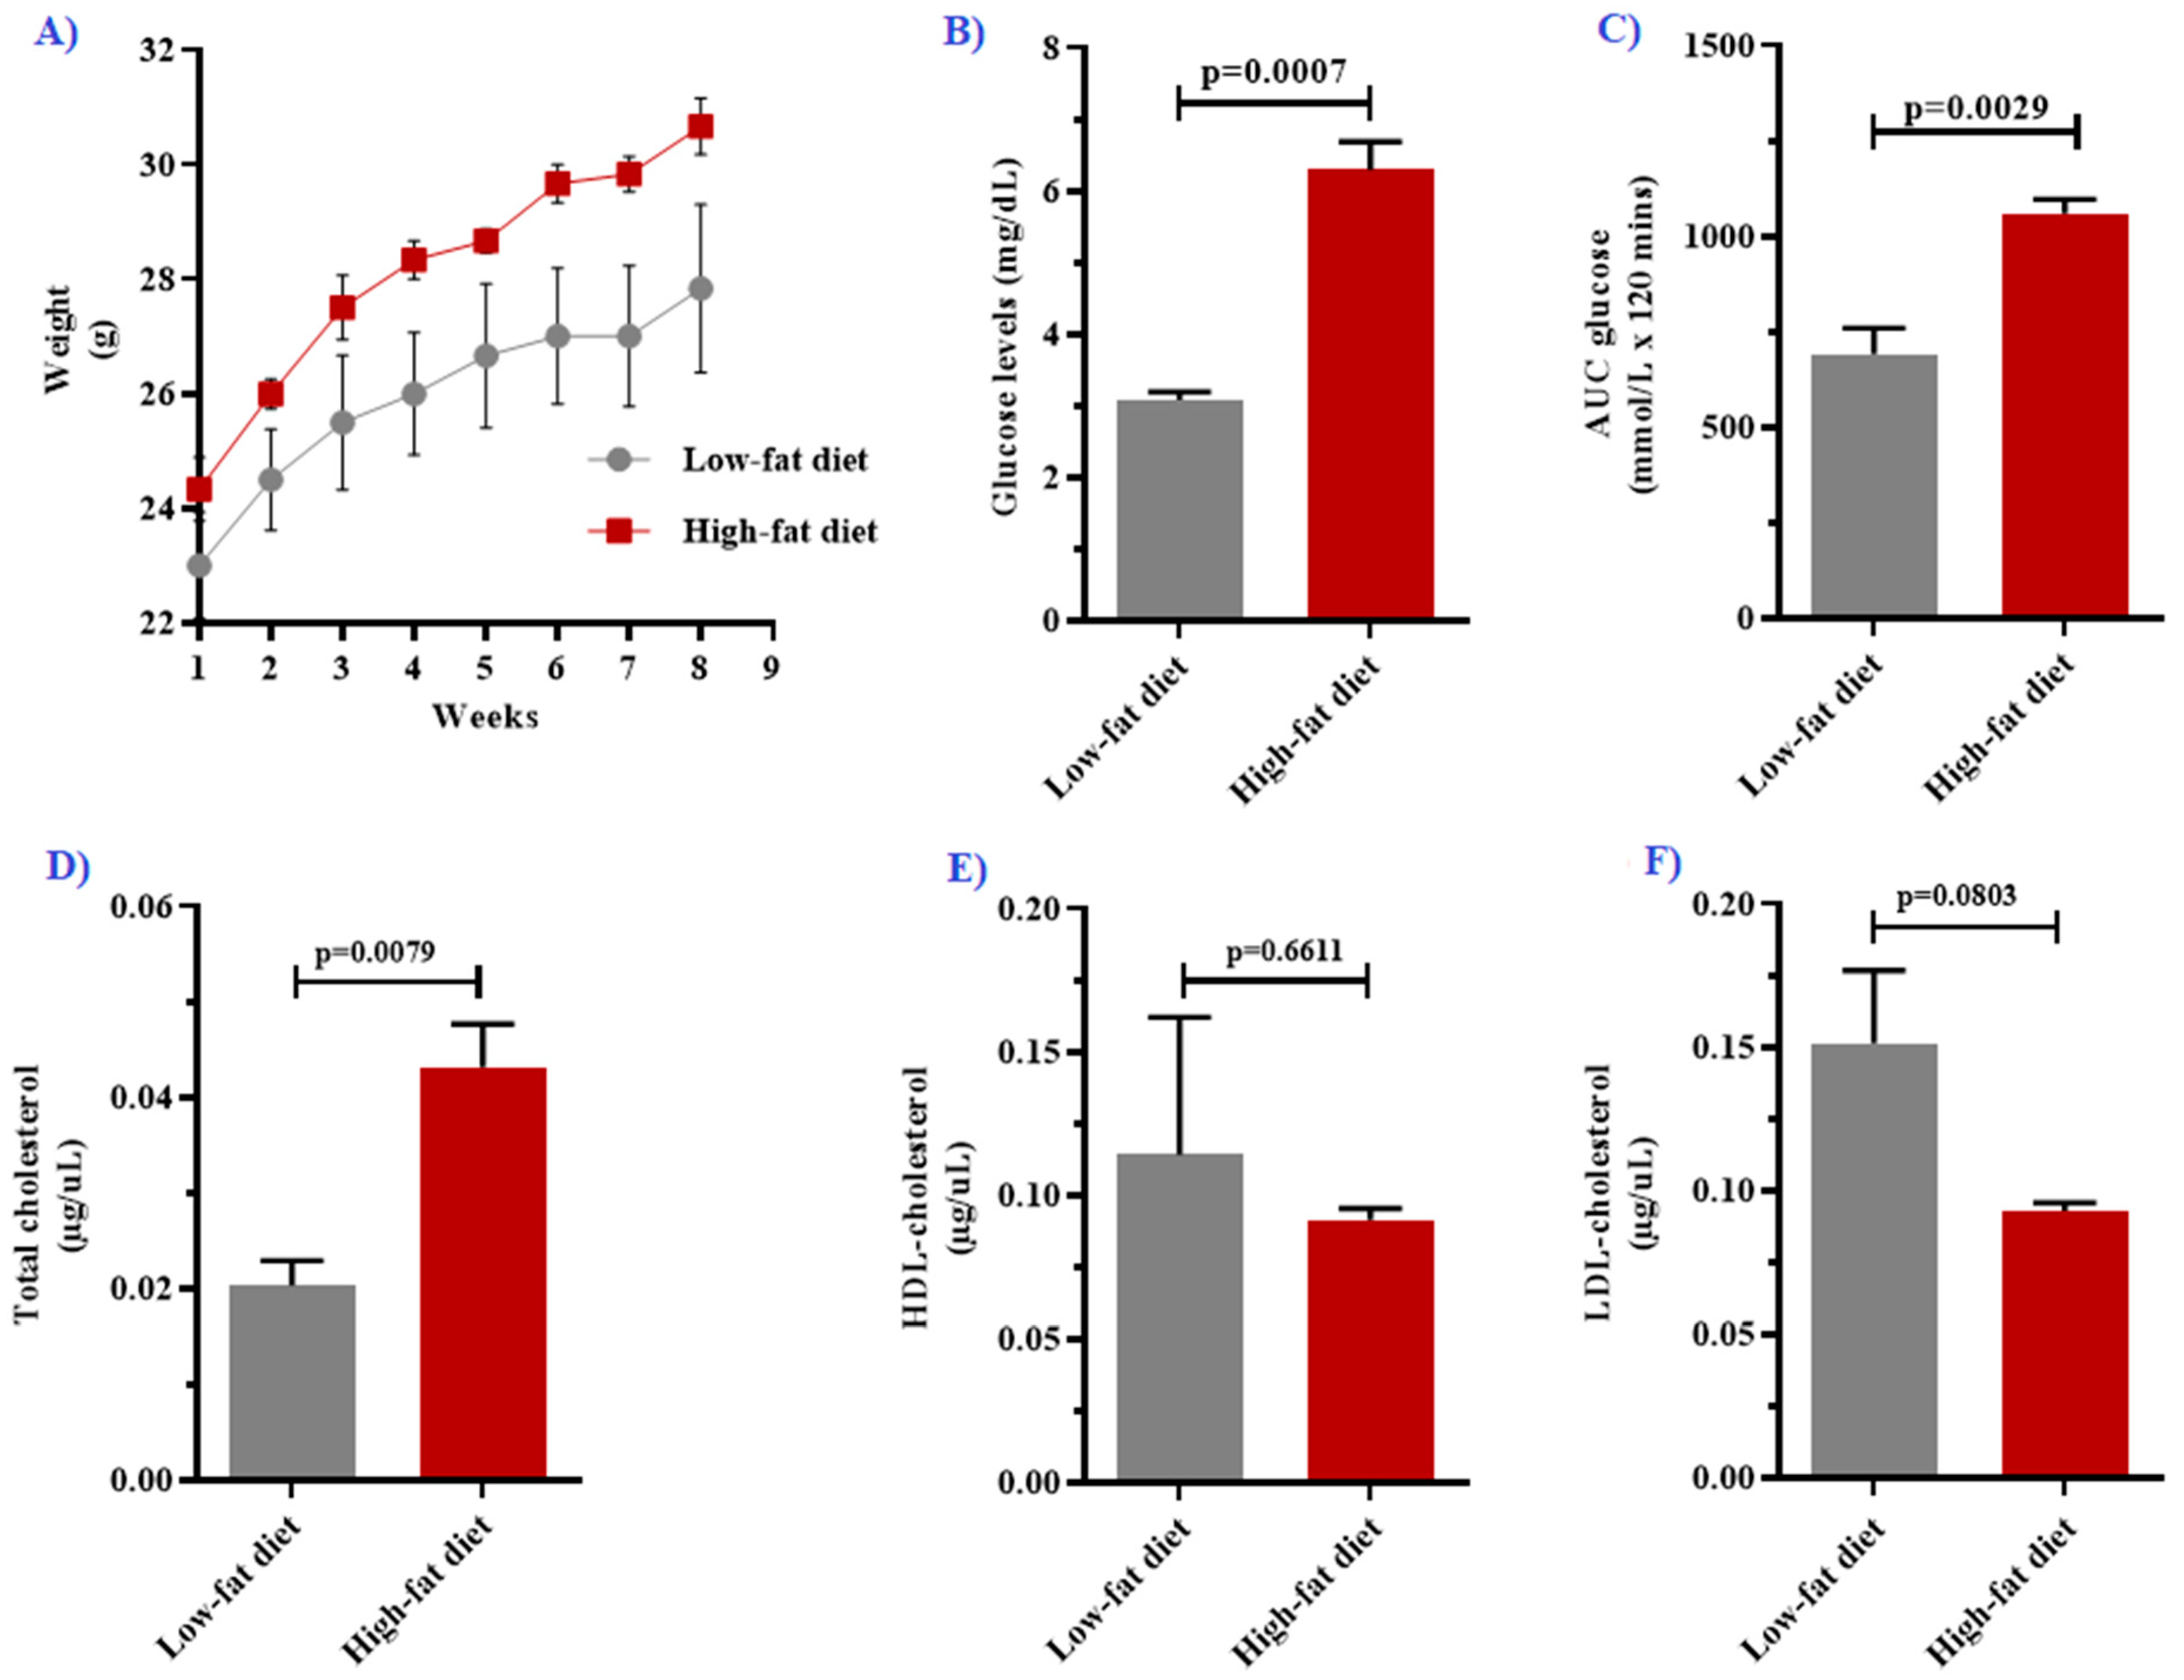
3.1. High-Fat Diet Feeding Impaired Metabolic Function in Mice
3.2. Hematological Changes Following High-Fat Diet Feeding
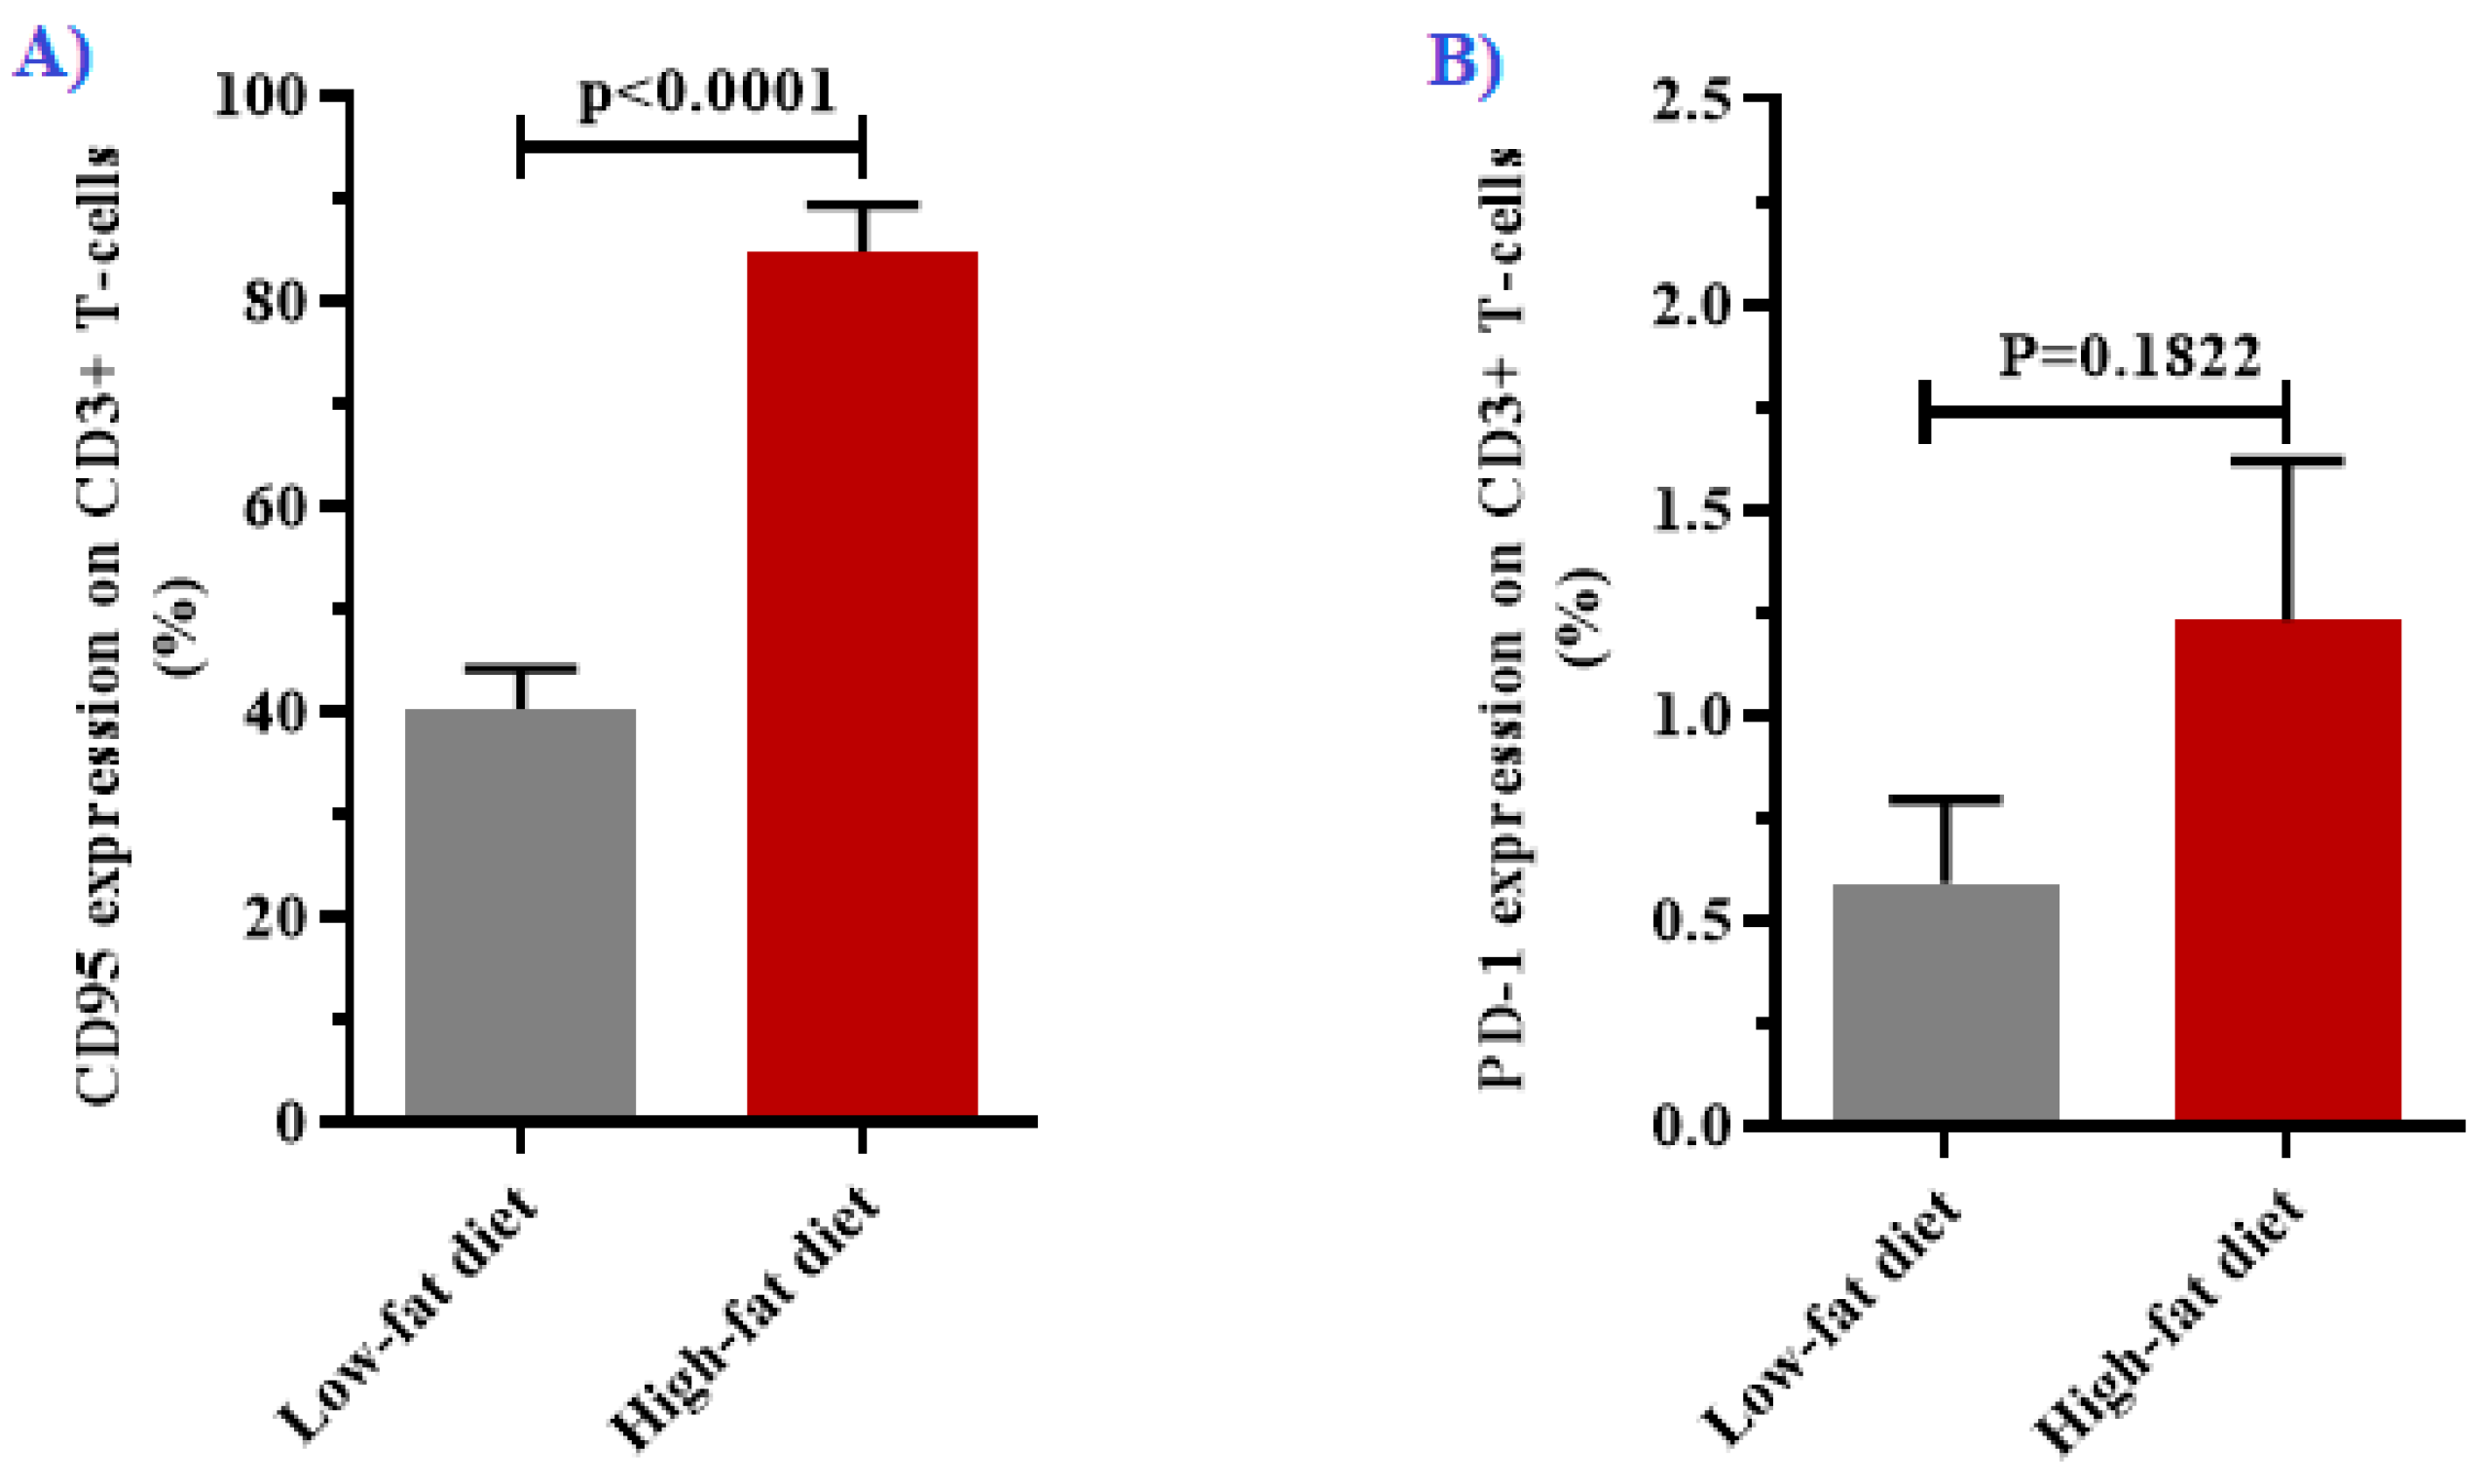
3.3. Expression of CD95 and PD-1 in T-cells
3.4. Associations between Fas-Mediated T-cell Dysfunction and Metabolic Disorders
4. Discussion
5. Conclusions
Author Contributions
Funding
Institutional Review Board Statement
Informed Consent Statement
Data Availability Statement
Conflicts of Interest
References
- Blüher, M. Obesity: Global epidemiology and pathogenesis. Nat. Rev. Endocrinol. 2019, 15, 288–298. [Google Scholar] [CrossRef] [PubMed]
- Bays, H.E.; Toth, P.P.; Kris-Etherton, P.M.; Abate, N.; Aronne, L.J.; Brown, W.V.; Gonzalez-Campoy, J.M.; Jones, S.R.; Kumar, R.; La Forge, R.; et al. Obesity, adiposity, and dyslipidemia: A consensus statement from the National Lipid Association. J. Clin. Lipidol. 2013, 7, 304–383. [Google Scholar] [CrossRef]
- Vekic, J.; Zeljkovic, A.; Stefanovic, A.; Jelic-ivanovic, Z.; Spasojevic-kalimanovska, V. Obesity and dyslipidemia. Metab. Clin. Exp. 2019, 92, 71–81. [Google Scholar] [CrossRef]
- Saltiel, A.R.; Olefsky, J.M. Inflammatory mechanisms linking obesity and metabolic disease. J. Clin. Investig. 2017, 127, 1–4. [Google Scholar] [CrossRef] [PubMed]
- Andersen, C.J.; Murphy, K.E.; Fernandez, M.L. Impact of Obesity and Metabolic Syndrome on Immunity. Adv. Nutr. 2016, 7, 66–75. [Google Scholar] [CrossRef] [PubMed]
- Yamauchi, T.; Kamon, J.; Minokoshi, Y.; Ito, Y.; Waki, H.; Uchida, S.; Yamashita, S.; Noda, M.; Kita, S.; Ueki, K.; et al. Adiponectin stimulates glucose utilization and fatty-acid oxidation by activating AMP-activated protein kinase. Nat. Med. 2002, 8, 1288–1295. [Google Scholar] [CrossRef] [PubMed]
- Nyambuya, T.M.; Dludla, P.V.; Mxinwa, V.; Nkambule, B.B. Obesity-induced inflammation and insulin resistance: A mini-review on T-cells. Metab. Open 2019, 3, 100015. [Google Scholar] [CrossRef] [PubMed]
- Wunderlich, C.M.; Hövelmeyer, N.; Wunderlich, F.T. Mechanisms of chronic JAK-STAT3-SOCS3 signaling in obesity. JAKSTAT 2013, 2, e238781–e2387817. [Google Scholar] [CrossRef] [PubMed]
- Francisco, V.; Pino, J.; Campos-Cabaleiro, V.; Ruiz-Fernández, C.; Mera, A.; Gonzalez-Gay, M.A.; Gómez, R.; Gualillo, O. Obesity, Fat Mass and Immune System: Role for Leptin. Front. Physiol. 2018, 9, 640. [Google Scholar] [CrossRef] [PubMed]
- Mashili, F.; Chibalin, A.V.; Krook, A.; Zierath, J.R. Constitutive STAT3 Phosphorylation Contributes to Skeletal Muscle Insulin Resistance in Type 2 Diabetes. Diabetes 2013, 62, 457–465. [Google Scholar] [CrossRef] [PubMed]
- Jorgensen, S.B.; O’Neill, H.M.; Sylow, L.; Honeyman, J.; Hewitt, K.A.; Palanivel, R.; Fullerton, M.D.; Öberg, L.; Balendran, A.; Galic, S.; et al. Deletion of Skeletal Muscle SOCS3 Prevents Insulin Resistance in Obesity. Diabetes 2013, 62, 56–64. [Google Scholar] [CrossRef] [PubMed]
- Wang, Q.; Wu, H. T Cells in Adipose Tissue: Critical Players in Immunometabolism. Front. Immunol. 2018, 9, 9–11. [Google Scholar] [CrossRef]
- O’Rourke, R.W.; Kay, T.; Scholz, M.H.; Diggs, B.; Jobe, B.A.; Lewinsohn, D.M.; Bakke, A.C. Alterations in T-Cell Subset Frequency in Peripheral Blood in Obesity. Obes. Surg. 2005, 15, 1463–1468. [Google Scholar] [CrossRef] [PubMed]
- Aguilar, E.G.; Murphy, W.J. Obesity induced T cell dysfunction and implications for cancer immunotherapy. Curr. Opin. Immunol. 2018, 51, 181–186. [Google Scholar] [CrossRef]
- Paulsen, M.; Janssen, O. Pro- and anti-apoptotic CD95 signaling in T cells. Cell Commun. Signal. 2011, 9, 7. [Google Scholar] [CrossRef]
- Puliaeva, I.; Puliaev, R.; Shustov, A.; Haas, M.; Via, C.S. Fas expression on antigen-specific T cells has costimulatory, helper and downregulatory functions in vivo for cytotoxic T cell responses but not for T cell-dependent B cell responses. J. Immunol. 2008, 181, 5912–5929. [Google Scholar] [CrossRef]
- Maksimow, M.; Soderstrom, T.S.; Jalkanen, S.; Eriksson, J.E.; Hanninen, A. Fas costimulation of naive CD4 T cells is controlled by NF-kB signaling and caspase activity. J. Leukoc. Biol. 2006, 79, 369–377. [Google Scholar] [CrossRef] [PubMed]
- Nyambuya, T.; Davison, G.M.; Hon, G.; Kengne, A.; Erasmus, R.; Matsha, T. T-cell Activation and Dysfunction in Hyperglycaemia. Med. Technol. S. Afr. 2018, 32, 24–27. [Google Scholar]
- Bennett, F.; Luxenberg, D.; Ling, V.; Wang, I.-M.; Marquette, K.; Lowe, D.; Khan, N.; Veldman, G.; Jacobs, K.A.; Valge-Archer, V.E.; et al. Program Death-1 Engagement Upon TCR Activation Has Distinct Effects on Costimulation and Cytokine-Driven Proliferation: Attenuation of ICOS, IL-4, and IL-21, But Not CD28, IL-7, and IL-15 Responses. J. Immunol. 2003, 170, 711–718. [Google Scholar] [CrossRef] [PubMed]
- Lee, J.; Ahn, E.; Kissick, H.T.; Ahmed, R. Reinvigorating Exhausted T Cells by Blockade of the PD-1 Pathway. For. Immunopathol. Dis. Therap. 2015, 6, 7–17. [Google Scholar] [CrossRef] [PubMed]
- Butte, M.J.; Keir, M.E.; Phamduy, T.B.; Sharpe, A.H.; Freeman, G.J. Programmed Death-1 Ligand 1 Interacts Specifically with the B7-1 Costimulatory Molecule to Inhibit T Cell Responses. Immunity 2007, 27, 111–122. [Google Scholar] [CrossRef] [PubMed]
- Wang, Z.; Aguilar, E.G.; Luna, J.I.; Dunai, C.; Khuat, L.T.; Le, C.T.; Mirsoian, A.; Minnar, C.M.; Stoffel, K.M.; Sturgill, I.R.; et al. Paradoxical effects of obesity on T cell function during tumor progression and PD-1 checkpoint blockade. Nat. Med. 2019, 25, 141–151. [Google Scholar] [CrossRef]
- Fujisawa, R.; Haseda, F.; Tsutsumi, C.; Hiromine, Y.; Noso, S.; Kawabata, Y.; Mitsui, S.; Terasaki, J.; Ikegami, H.; Imagawa, A.; et al. Low programmed cell death-1 (PD-1) expression in peripheral CD4+ T cells in Japanese patients with autoimmune type 1 diabetes. Clin. Exp. Immunol. 2015, 180, 452–457. [Google Scholar] [CrossRef] [PubMed]
- Sun, P.; Jin, Q.; Nie, S.; Jia, S.; Li, Y.; Li, X.; Guo, F. Unlike PD-L1, PD-1 is downregulated on partial immune cells in type 2 diabetes. J. Diabetes Res. 2019, 2019, 1–8. [Google Scholar] [CrossRef] [PubMed]
- Andrikopoulos, S.; Blair, A.R.; Deluca, N.; Fam, B.C.; Proietto, J. Evaluating the glucose tolerance test in mice. Am. J. Physiol. Metab. 2008, 295, E1323–E1332. [Google Scholar] [CrossRef] [PubMed]
- Wueest, S.; Rapold, R.A.; Schumann, D.M.; Rytka, J.M.; Schildknecht, A.; Nov, O.; Chervonsky, A.V.; Rudich, A.; Schoenle, E.J.; Donath, M.Y.; et al. Deletion of Fas in adipocytes relieves adipose tissue inflammation and hepatic manifestations of obesity in mice. J. Clin. Investig. 2010, 120, 191–202. [Google Scholar] [CrossRef] [PubMed]
- Podrini, C.; Project, S.M.G.; Cambridge, E.L.; Lelliott, C.J.; Carragher, D.M.; Estabel, J.; Gerdin, A.-K.; Karp, N.A.; Scudamore, C.L.; Ramirez-Solis, R.; et al. High-fat feeding rapidly induces obesity and lipid derangements in C57BL/6N mice. Mamm. Genome 2013, 24, 240–251. [Google Scholar] [CrossRef]
- Lang, P.; Hasselwander, S.; Li, H.; Xia, N. Effects of different diets used in diet-induced obesity models on insulin resistance and vascular dysfunction in C57BL/6 mice. Sci. Rep. 2019, 9, 1–14. [Google Scholar] [CrossRef]
- Della Vedova, M.C.; Muñoz, M.D.; Santillan, L.D.; Plateo-Pignatari, M.G.; Germanó, M.J.; Tosi, M.E.R.; Garcia, S.; Gomez, N.N.; Fornes, M.W.; Mejiba, S.E.G.; et al. A Mouse Model of Diet-Induced Obesity Resembling Most Features of Human Metabolic Syndrome. Nutr. Metab. Insights 2016, 9, 93–102. [Google Scholar] [CrossRef]
- Lukács, A.; Horváth, E.; Máté, Z.; Szabó, A.; Virág, K.; Papp, M.; Sándor, J.; Ádány, R.; Paulik, E. Abdominal obesity increases metabolic risk factors in non-obese adults: A Hungarian cross-sectional study. BMC Public Health 2019, 19, 1–8. [Google Scholar] [CrossRef]
- Sait, S.; Alqassas, M.; Othman, S.; Sb, S.; Alqalayta, L.; Alqusair, S.; Qari, M. Obesity correlates with neutrophilia. Hamatol. Transfus. Intern. J. 2016, 3, 159–162. [Google Scholar] [CrossRef]
- Dixon, J.B.; O’Brien, P.E. Obesity and the White Blood Cell Count: Changes with Sustained Weight Loss. Obes. Surg. 2006, 16, 251–257. [Google Scholar] [CrossRef]
- Kim, D.-J.; Noh, J.-H.; Lee, B.-W.; Choi, Y.-H.; Chung, J.-H.; Min, Y.-K.; Lee, M.-S.; Lee, M.-K.; Kim, K.-W. The Associations of Total and Differential White Blood Cell Counts with Obesity, Hypertension, Dyslipidemia and Glucose Intolerance in a Korean Population. J. Korean Med. Sci. 2008, 23, 193–198. [Google Scholar] [CrossRef] [PubMed]
- Nakanishi, N.; Sato, M.; Shirai, K.; Nakajima, K.; Murakami, S.; Takatorige, T.; Suzuki, K.; Tatara, K. Associations between White Blood Cell Count and Features of the Metabolic Syndrome in Japanese Male Office Workers. Ind. Health 2002, 40, 273–277. [Google Scholar] [CrossRef] [PubMed]
- Peter, M.E.; Budd, R.C.; Desbarats, J.; Hedrick, S.M.; Hueber, A.-O.; Newell, M.K.; Owen, L.B.; Pope, R.M.; Tschopp, J.; Wajant, H.; et al. The CD95 Receptor: Apoptosis Revisited. Cell 2007, 129, 447–450. [Google Scholar] [CrossRef] [PubMed]
- Blüher, M.; Klöting, N.; Wueest, S.; Schoenle, E.J.; Schön, M.R.; Dietrich, A.; Fasshauer, M.; Stumvoll, M.; Konrad, D. Fas and FasL Expression in Human Adipose Tissue Is Related to Obesity, Insulin Resistance, and Type 2 Diabetes. J. Clin. Endocrinol. Metab. 2014, 99, E36–E44. [Google Scholar] [CrossRef] [PubMed]
- Item, F.; Wueest, S.; Lemos, V.; Stein, S.; Lucchini, F.C.; Denzler, R.; Fisser, M.C.; Challa, T.D.; Pirinen, E.; Kim, Y.; et al. Fas cell surface death receptor controls hepatic lipid metabolism by regulating mitochondrial function. Nat. Commun. 2017, 8, 1–10. [Google Scholar] [CrossRef] [PubMed]
- Wueest, S.; Mueller, R.; Blüher, M.; Item, F.; Chin, A.S.H.; Wiedemann, M.S.F.; Takizawa, H.; Kovtonyuk, L.; Chervonsky, A.V.; Schoenle, E.J.; et al. Fas (CD95) expression in myeloid cells promotes obesity-induced muscle insulin resistance. EMBO Mol. Med. 2014, 6, 43–56. [Google Scholar] [CrossRef] [PubMed]
- Aschkenazi, S.; Straszewski, S.; Verwer, K.M.A.; Foellmer, H.; Rutherford, T.; Mor, G. Differential Regulation and Function of the Fas/Fas Ligand System in Human Trophoblast Cells. Biol. Reprod. 2002, 66, 1853–1861. [Google Scholar] [CrossRef]
- Canter, R.J.; Aguilar, E.; Wang, Z.; Le, C.; Khuat, L.; Dunai, C.; Rebhun, R.; Tarantal, A.; Blazar, B.R.; Monjazeb, A.; et al. Obesity results in higher PD-1-mediated T-cell suppression but greater T-cell effector functions following blockade. J. Clin. Oncol. 2018, 36, 65. [Google Scholar] [CrossRef]
- Jia, Y.; Zhao, Y.; Li, C.; Shao, R. The Expression of Programmed Death-1 on CD4+ and CD8+ T Lymphocytes in Patients with Type 2 Diabetes and Severe Sepsis. PLoS ONE 2016, 11, e0159383. [Google Scholar] [CrossRef] [PubMed]
- Petrelli, A.; Mijnheer, G.; Van Konijnenburg, D.P.H.; Van Der Wal, M.M.; Giovannone, B.; Mocholi, E.; Vazirpanah, N.; Broen, J.C.; Hijnen, D.; Oldenburg, B.; et al. PD-1+CD8+ T cells are clonally expanding effectors in human chronic inflammation. J. Clin. Investig. 2018, 128, 4669–4681. [Google Scholar] [CrossRef] [PubMed]
- Tao, J.; Li, L.; Wang, Y.; Fu, R.; Wang, H.; Shao, Z. Increased TIM3+CD8+T cells in Myelodysplastic Syndrome patients displayed less perforin and granzyme B secretion and higher CD95 expression. Leuk. Res. 2016, 51, 49–55. [Google Scholar] [CrossRef] [PubMed]
- Song, L.-J.; Wang, X.; Wang, X.-P.; Li, D.; Ding, F.; Liu, H.-X.; Yu, X.; Li, X.-F.; Shu, Q. Increased Tim-3 expression on peripheral T lymphocyte subsets and association with higher disease activity in systemic lupus erythematosus. Diagn. Pathol. 2015, 10, 71. [Google Scholar] [CrossRef]
- Li, N.; Ma, T.; Han, J.; Zhou, J.; Wang, J.; Zhang, J.; Zheng, S. Increased apoptosis induction in CD4+CD25+ Foxp3+ T cells contributes to enhanced disease activity in patients with rheumatoid arthritis through IL-10 regulation. Eur. Rev. Med. Pharmacol. Sci. 2014, 18, 78–85. [Google Scholar] [PubMed]


| Parameter | Low-Fat Diet (n = 6) | High-Fat Diet (n = 6) | p-Value |
|---|---|---|---|
| Body weight (g) * | 1.38 ± 0.12 | 1.47 ± 0.01 | <0.0001 |
| Fasting glucose (mg/dL) | 3.08 ± 0.11 | 6.30 ± 0.39 | 0.0007 |
| Area under the curve (mmol/L × 120 min) | 692.70 ± 67.82 | 1062 ± 35.22 | 0.0029 |
| Lipid profiles | |||
| Total cholesterol (µg/uL) | 0.020 [0.014–0.023] | 0.043 [0.039–0.048] | 0.0079 |
| HDL cholesterol (µg/uL) | 0.114 ± 0.048 | 0.091 ± 0.004 | 0.6611 |
| LDL cholesterol (µg/uL) | 0.152 ± 0.025 | 0.093 ± 0.003 | 0.0803 |
| White cell indices | |||
| White cell count (103/µL) | 4.42 ± 0.47 | 9.26 ± 1.13 | 0.0096 |
| Neutrophils (103/µL) | 0.34 ± 0.09 | 1.01 ± 0.24 | 0.0022 |
| Lymphocytes (103/µL) | 3.98 ± 0.95 | 7.99 ± 2.36 | 0.0155 |
| Monocytes (103/µL) | 0.08 ± 0.02 | 0.23 ± 0.07 | 0.0015 |
| Red cell indices | |||
| Red cell count (106/µL) | 7.03 ± 0.27 | 6.52 ± 0.44 | 0.3575 |
| Hemoglobin (g/dL) | 27.13 ± 0.94 | 26.13 ± 1.03 | 0.4933 |
| Hematocrit (%) | 30.24 ± 1.29 | 27.44 ± 2.01 | 0.2809 |
| Mean cell volume (FL) | 43.00 [43.00–43.50] | 42.00 [41.00–43.00] | 0.119 |
| Platelet indices | |||
| Platelet count | 572.00 ± 124.60 | 888.60 ± 73.80 | 0.068 |
| Mean platelet volume (FL) | 5.47 ± 0.23 | 5.42 ± 0.13 | 0.8553 |
| T-cell markers | |||
| % expression of Fas in CD3+ T-cells | 40.23 ± 3.92 | 84.88 ± 4.49 | <0.0001 |
| % expression of PD-1 in CD3+ T-cells | 0.59 ± 0.20 | 1.23 ± 0.39 | 0.1822 |
| Parameter | Beta | Standard Error | 95% Confidence Interval | t-Value | p-Value |
|---|---|---|---|---|---|
| Intercept | −1951 | 107 | −3310 to −591.20 | 18.23 | 0.0349 |
| Body weight | 1432 | 74.33 | 487.8 to 2377 | 19.27 | 0.0330 |
| Fasting plasma glucose | −4.21 | 0.48 | −10.29 to 1.87 | 8.80 | 0.0720 |
| Total cholesterol | −489.20 | 53.06 | −1163 to 185 | 9.22 | 0.0688 |
| Lymphocyte count | −2.59 | 0.39 | −7.51 to 2.34 | 6.67 | 0.0947 |
Publisher’s Note: MDPI stays neutral with regard to jurisdictional claims in published maps and institutional affiliations. |
© 2021 by the authors. Licensee MDPI, Basel, Switzerland. This article is an open access article distributed under the terms and conditions of the Creative Commons Attribution (CC BY) license (http://creativecommons.org/licenses/by/4.0/).
Share and Cite
Nyambuya, T.M.; Dludla, P.V.; Nkambule, B.B. Diet-Induced Obesity Promotes the Upregulation of Fas Expression on T-cells. Biology 2021, 10, 217. https://doi.org/10.3390/biology10030217
Nyambuya TM, Dludla PV, Nkambule BB. Diet-Induced Obesity Promotes the Upregulation of Fas Expression on T-cells. Biology. 2021; 10(3):217. https://doi.org/10.3390/biology10030217
Chicago/Turabian StyleNyambuya, Tawanda Maurice, Phiwayinkosi Vusi Dludla, and Bongani Brian Nkambule. 2021. "Diet-Induced Obesity Promotes the Upregulation of Fas Expression on T-cells" Biology 10, no. 3: 217. https://doi.org/10.3390/biology10030217
APA StyleNyambuya, T. M., Dludla, P. V., & Nkambule, B. B. (2021). Diet-Induced Obesity Promotes the Upregulation of Fas Expression on T-cells. Biology, 10(3), 217. https://doi.org/10.3390/biology10030217


