Article

Diet-Induced Obesity Promotes the Upregulation of Fas Expression on T-cells

by
Tawanda Maurice Nyambuya
1,2,*,
Phiwayinkosi Vusi Dludla
3,4 and
Bongani Brian Nkambule
1,*
1
School of Laboratory Medicine and Medical Sciences (SLMMS), College of Health Sciences, University of KwaZulu-Natal, Durban 4013, South Africa
2
Department of Health Sciences, Faculty of Health and Applied Sciences, Namibia University of Science and Technology, Windhoek 10005, Namibia
3
Biomedical Research and Innovation Platform, South African Medical Research Council, Tygerberg 7505, South Africa
4
Department of Life and Environmental Sciences, Polytechnic University of Marche, 60131 Ancona, Italy
*
Authors to whom correspondence should be addressed.
Biology 2021, 10(3), 217; https://doi.org/10.3390/biology10030217
Submission received: 17 February 2021 / Revised: 2 March 2021 / Accepted: 5 March 2021 / Published: 12 March 2021
(This article belongs to the Section Immunology)

Abstract

:

Simple Summary

Obesity is associated with the development of metabolic disorders and alterations in immune responses. Notably, obesity-induced inflammation promotes the chronic activation of T-cells, which may result in the aberrant expression of their regulatory markers. Programmed cell death -1 (PD-1) and Fas (CD95) are some of the important modulators of T-cell function. Although it is apparent that their expression is dysregulated in obesity, it remains unclear whether the eventual T-cell dysfunction is due to the upregulation or downregulation of these markers. Therefore, this study aimed to assess the expression of PD-1 and Fas in T-cells in metabolic disorders.

Abstract

This study was conducted to assess the expression of Fas (CD95) and programmed cell death-1 (PD-1) on circulating T-cells in obesity using a diet-induced obesity mouse model. Furthermore, we aimed to determine if there are any associations between metabolic disorders and the expression of T-cell regulatory markers. A total of 12 male C57BL/6 mice were randomized into either a high-fat diet (HFD) or low-fat diet (LFD) group for 8 weeks (n = 6/group). Changes in body weights were monitored on a weekly basis. The lipid, glucose, and hematological profiles, as well as Fas and PD1 expression on the T-cell immunophenotype, were measured after 8 weeks of feeding. The HFD-fed group had a higher percentage weight gain (29.17%) in comparison with the LFD-fed group (21.74%) after the 8-week period. In addition, the HFD group had increased fasting glucose and glucose excursion following a 2-h postprandial period. The levels of total cholesterol were elevated in the HFD group when compared with the LFD group (p < 0.05). Notably, the absolute white cell count (p = 0.0096), neutrophil count (p = 0.0022, lymphocytes (p = 0.0155), and monocyte count (p = 0.0015) were elevated in the HFD group when compared with the LFD-fed group. However, the platelets (0.0680), red cell counts (0.3575), and their indices (p > 0.05) were comparable between the two groups. Interestingly, HFD feeding was associated with elevated expression of Fas on T-cells (p < 0.0001), which positively correlated with body weights (r = 0.93, p = 0.0333). No associations were found between Fas expression and dyslipidemia or fasting blood glucose levels (p > 0.05). The multivariant regression analysis showed that the association between the levels of Fas on T-cells and body weights (coefficient: −1.00, t-value: 19.27, p = 0.0330) was independent of fasting blood glucose, total cholesterol, and lymphocyte count. Lastly, the expression of PD-1 on T-cells was comparable between the two diet groups (p = 0.1822). In all, immune activation, dyslipidemia, and poor glucose control in the early stages of obesity may drive the pathogenesis of metabolic T-cell disorders. Importantly, T-cell dysfunction in obesity is partially mediated by an upregulation of Fas which is independent of dyslipidemia and hyperglycemia.

1. Introduction

The prevalence of obesity has rapidly increased over the years [1], with more than two-thirds of individuals with obesity at high risk of developing metabolic syndrome and cardiovascular disease (CVD) [2,3]. Obesity is strongly associated with metabolic dysfunction and chronic T-cell activation [4,5]. For instance, obesity impairs insulin signaling and promotes the secretion of cytokines and adipokines that dysregulate the transduction of the Janus kinase (JAK)/signal transducer activator of transcription (STAT) pathway, an important modulator of insulin function and T-cell responses [6,7]. Furthermore, the exacerbated levels of interleukin (IL)-6 and leptin in obesity result in the downstream activation of STAT3 signaling [8,9], which is closely associated with insulin resistance [10]. The manifestation of the latter has been attributed to the blockage of insulin signaling transduction induced by an upregulation of suppressor of cytokine signaling 3 expression in obesity [11]. We previously described the involvement of T-cells in obesity-induced immune activation, insulin resistance, and impaired glucose control [7]. In fact, the former is strongly associated with T-cell dysfunction [12], mediated by increased expression of regulatory markers such as Fas (CD95) and programmed cell death-1 (PD-1) [13,14].
The binding of the Fas ligand (FasL) to its counter-receptor results in the downstream activation of caspase 8 and activation-induced cell death [15]. However, alternative research has also reported anti-apoptotic signaling modulated by the Fas-FasL axis [16]. In particular, Fas signaling provides co-stimulatory transductions during T-cell activation [17]. Thus, its aberrant expression may modulate alterations in the regulatory mechanisms of T-cell responses as previously reported [16]. An upregulation of Fas expression on CD8+ T-cells is directly associated with an increase in body mass index (BMI) in individuals with obesity [13]. However, others observed a downregulation of Fas expression on CD4+ T-cells in obese individuals with poor glucose control [18]. Despite these reported inconsistencies, it is apparent that there is a close relationship between metabolic disorders and aberrant Fas expression on T-cells. However, there is no clear understanding on whether the T-cell dysfunction mediated by Fas in metabolic disorders is driven by poor glucose control, obesity, or dyslipidemia.
Likewise, and apart from its well characterized negative inhibitory effect, PD-1 is also essential in the co-stimulatory signaling that promotes T-cell activation upon binding to its ligand (PD-L1 and PD-L2) [19]. Chronic T-cell activation can induce T-cell exhaustion, which is characterized by an upregulation of PD-1 [20]. The activation of the PD-1–PD-L axis results in transduction of a negative co-stimulatory signal that inhibits T-cell activation [21]. Notably, the upregulation of PD-1 is congruent with the loss of T-cell effector function in a mouse model of diet-induced obesity (DIO) [22]. In contrast, the expression of PD-1 on T-cells in individuals with poor glucose control was not associated with any glucose profiles [18,23], with others even reported its downregulation in individuals with Type 2 diabetes mellitus [24].
Therefore, using a mouse model of DIO, we aimed to assess whether T-cell dysfunction in metabolic disorders is mediated by aberrant expression of Fas and PD-1. Moreover, we aimed to determine if there are any associations between poor glucose control or dyslipidemia and the expression of the T-cell regulators.

2. Materials and Methods

2.1. Animal Handling

Male C57BL/6 mice were purchased and housed in a cage at the Biomedical Research Unit at University of KwaZulu-Natal (UKZN) in a controlled environment. The animals were exposed to a controlled 12-h light/dark cycle at a temperature range of 23–25 °C and a relative humidity of approximately 50%. The mice received standard laboratory food and water ad libitum. All animal procedures were carried out in accordance with the UKZN Animal Research Ethics Committee (AREC) protocol (AREC/086/016).

2.2. Study Design

In this DIO model, a total of twelve 6-week-old male C57BL/6 mice were randomly allocated into 2 diet groups (n = 6/group). These comprised of a low-fat diet (LFD, 10% energy from fat, Research Diets #D12450J) and a high-fat diet (HFD, 60% energy from fat, Research Diets #D12492). The animals were allowed a 2-week acclimatization period and their body weights were measured on a weekly basis for 8 weeks (Figure 1). Hematological parameters and glucose and lipid profiles were measured after 8 weeks of HFD or LFD feeding.

2.3. Measurements of Metabolic Profiles and Hematological Parameters

Glucose plasma concentrations were performed using the OneTouch select glucometer (Life Scan Inc., Milpitas, CA, USA) and the 2-h oral postprandial glucose test was performed as previously described [25]. In order to determine the lipid profiles, total cholesterol, high-density lipoprotein (HDL) cholesterol and low-density lipoprotein (LDL) cholesterol were measured using a mouse-specific enzyme-linked immunosorbent assay kit (Abcam, Cambridge, MA, USA), according to the manufacturer’s instructions. All hematological parameters were measured using a Beckman Coulter AcT5 Diff (Beckman Coulter, Miami, FL, USA).

2.4. Measurements of FAS and PD-1 Levels on T-cells

The IMag™ Mouse T Lymphocyte Enrichment Set-DM (BD Biosciences, San Jose, CA, USA) was used as per the manufacturer’s instructions to isolate T lymphocytes from whole blood. In order to determine T-cell dysfunction in this DIO model, we enumerated the levels of Fas and PD1 expression in CD3+ T-cells. Briefly, isolated T lymphocytes were stained using the following monoclonal antibodies (mAbs) to assess the expression of Fas and PD-1 in T-cells. Anti-mouse CD3-FITC (clone 17A2) and CD95-APC (clone J43) mAbs were obtained from BioLegends, San Diego, CA, USA, whilst PD-1-BV421 (clone J43) mAb was acquired from Beckton Dickinson (BD Biosciences, San Jose, CA, USA). Flow cytometry analysis was performed using a BD FASCanto II (BD Biosciences, San Jose, CA, USA), and data were analyzed using FlowJo version 10.6.2 analysis software (BD Biosciences, San Jose, CA, USA).

2.5. Statistical Analysis

The Kolmogorov–Smirnov test with Dallal–Wilkinson–Lilliefor p-values was performed to test for normality. An unpaired Student’s t-test was performed for parametric data; and data are reported as means ± standard error. Non-parametric data were log-transformed to meet the assumptions of normality prior to statistical analysis. The Mann–Whitney U-test was used for non-parametric data, and the results are reported as the median interquartile range (IQR). Correlations were performed using the Pearson’s coefficient. A p-value of < 0.05 was considered as statistically significant. All statistical analyses were performed using GraphPad Prism version 6 software (GraphPad Software Inc., San Diego, CA, USA).

3. Results

3.1. High-Fat Diet Feeding Impaired Metabolic Function in Mice

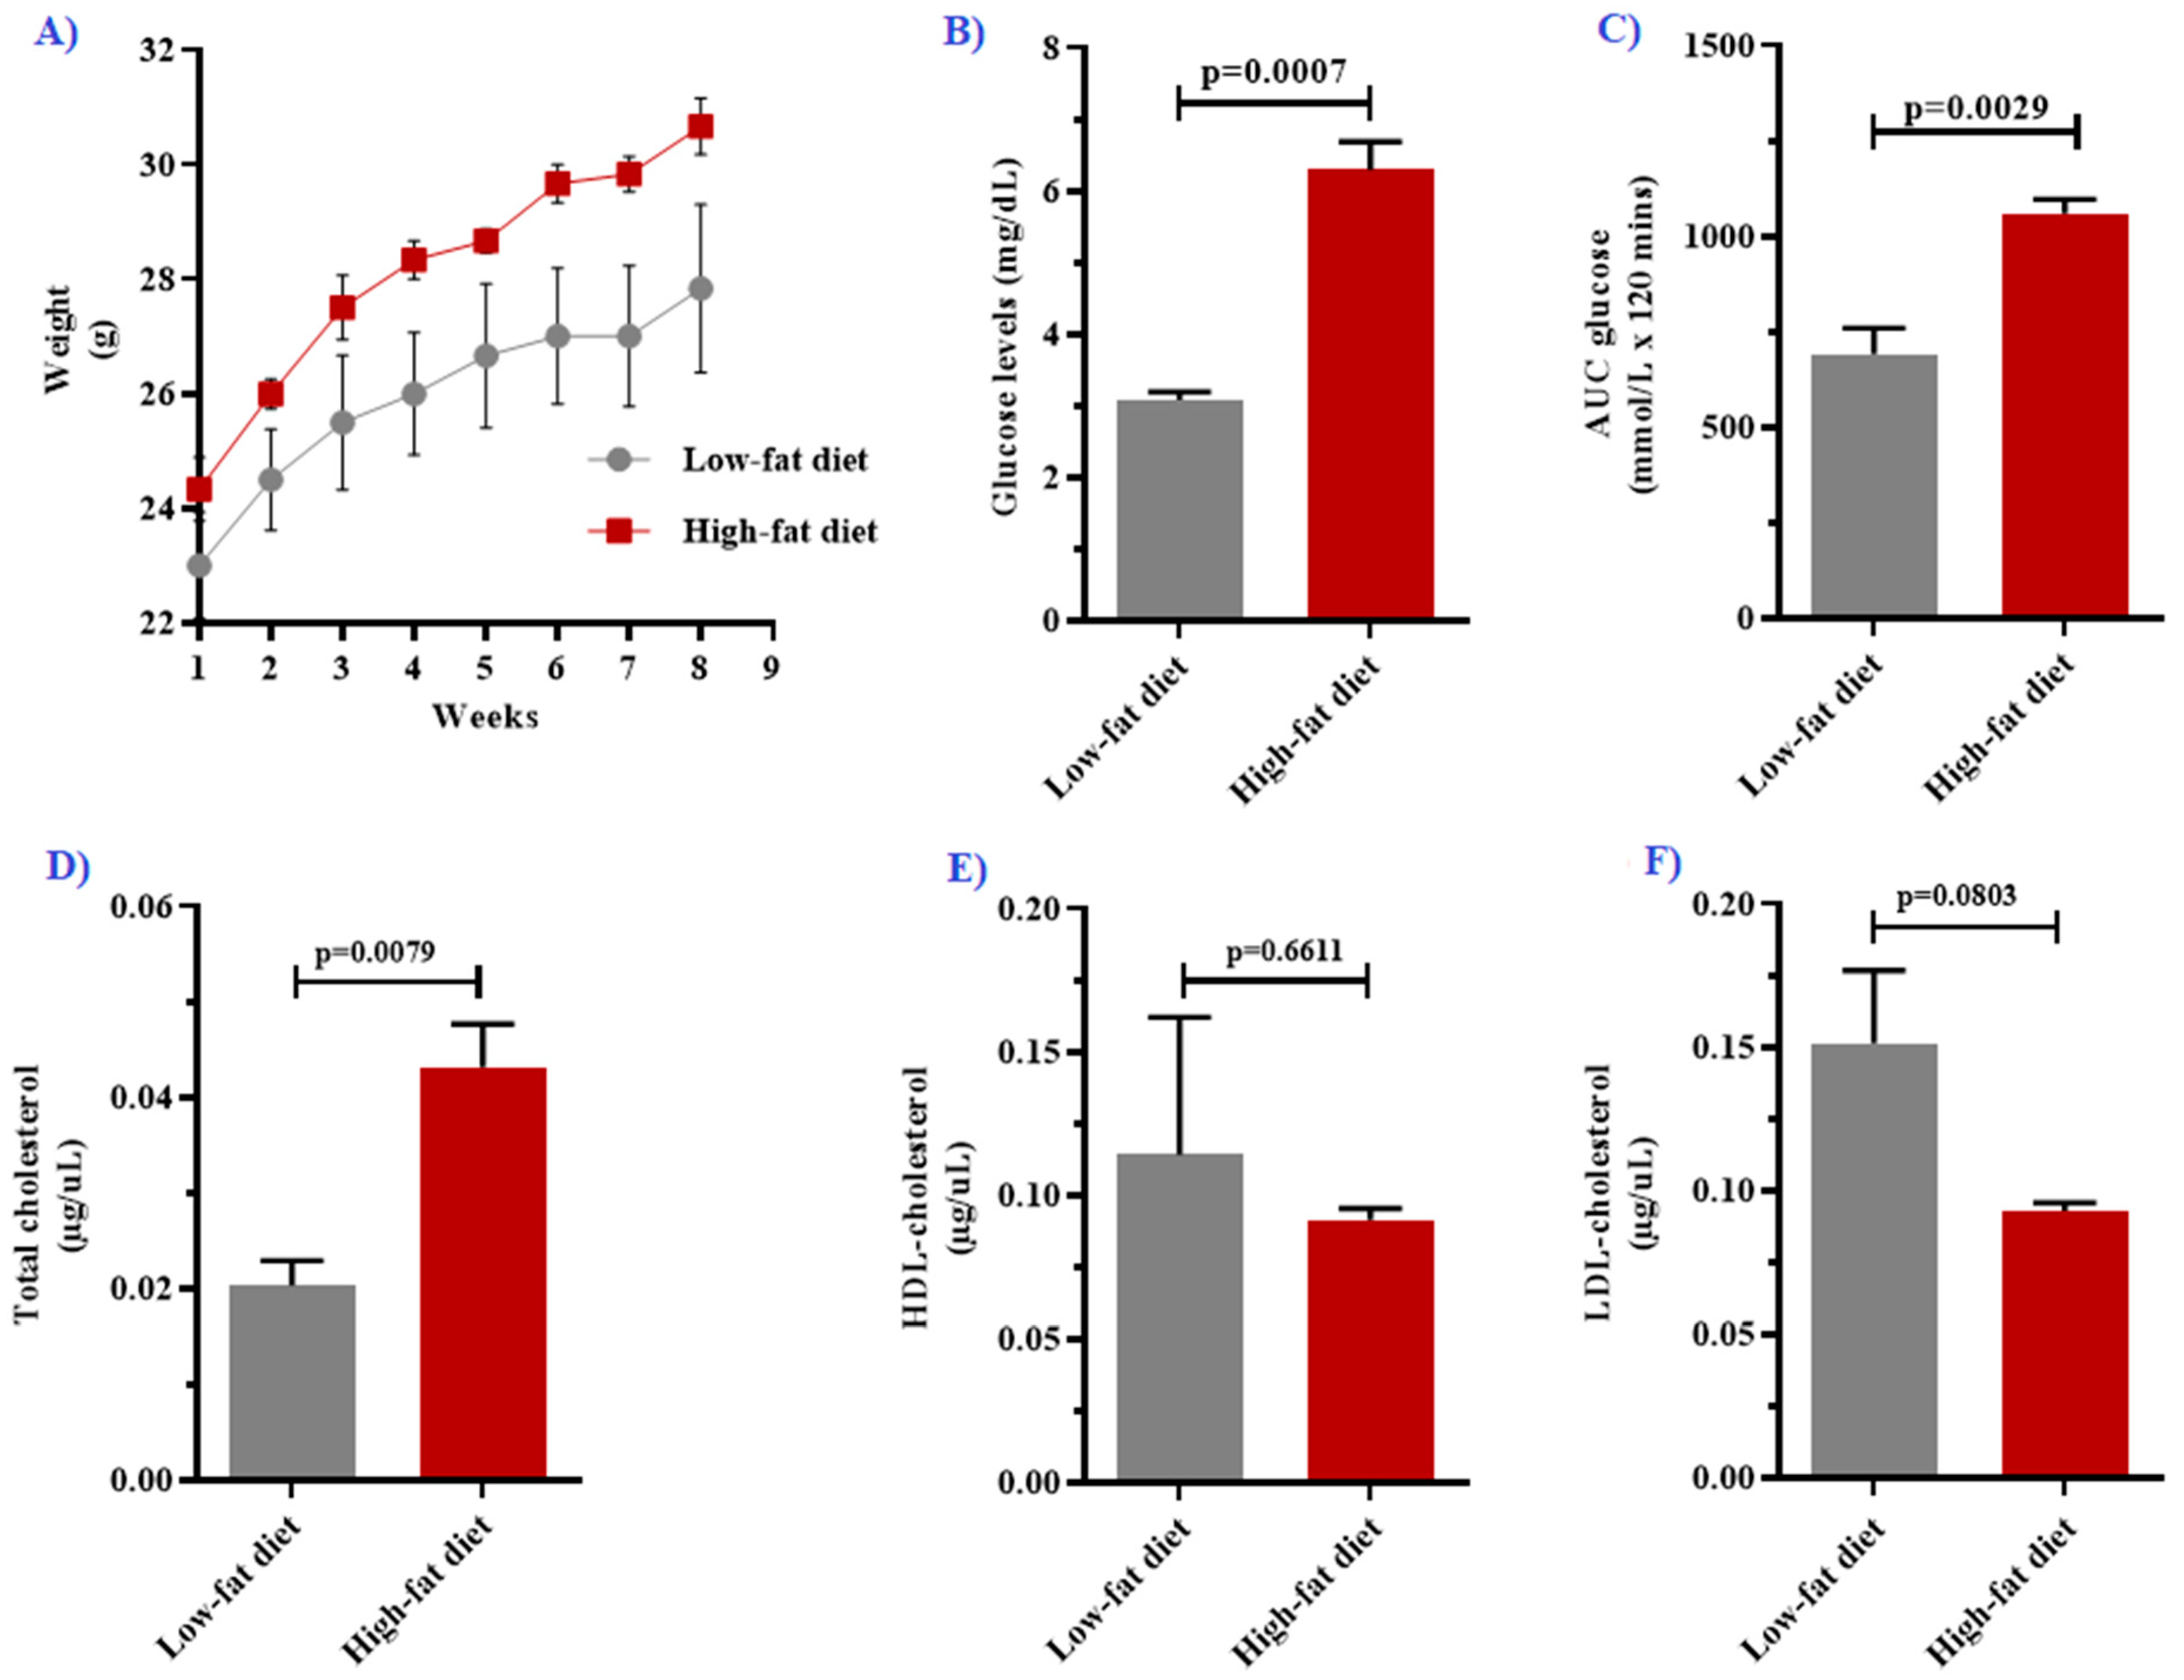
In order to induce obesity, the mice were fed a HFD for a period of 8 weeks (Figure 2A). As expected, the HFD-fed group had an increased percentage weight gain (29.17%) in comparison with the LFD-fed group (21.74%). Furthermore, the HFD-fed group had significantly elevated levels of fasting blood glucose (p = 0.007) after the 8-week HFD feeding period (Figure 2B). Moreover, the HFD-fed group had a larger postprandial area under the curve (AUC) when compared with the LFD-fed group (p = 0.0029) (Figure 2C). In order to assess dyslipidemia in our DIO model, the lipid profiles were measured, and the total cholesterol levels were significantly increased in the HFD-fed group when compared with the LFD-fed group (p = 0.0079) (Figure 2D). However, HDL cholesterol and LDL cholesterol were comparable between the two diet groups (p > 0.05) (Figure 2E,F, Table 1).

3.2. Hematological Changes Following High-Fat Diet Feeding

HFD feeding significantly increased absolute white cell count (WCC) (p = 0.0096), neutrophil count (p = 0.0022, lymphocytes (p = 0.0155), and monocyte count (p = 0.0015) in comparison with the LFD-fed group (Table 1). However, the platelet (0.0680) and red cell counts (0.3575), as well as their indices (p > 0.05), were comparable following 8 weeks of HFD or LFD feeding (Table 1).

3.3. Expression of CD95 and PD-1 in T-cells

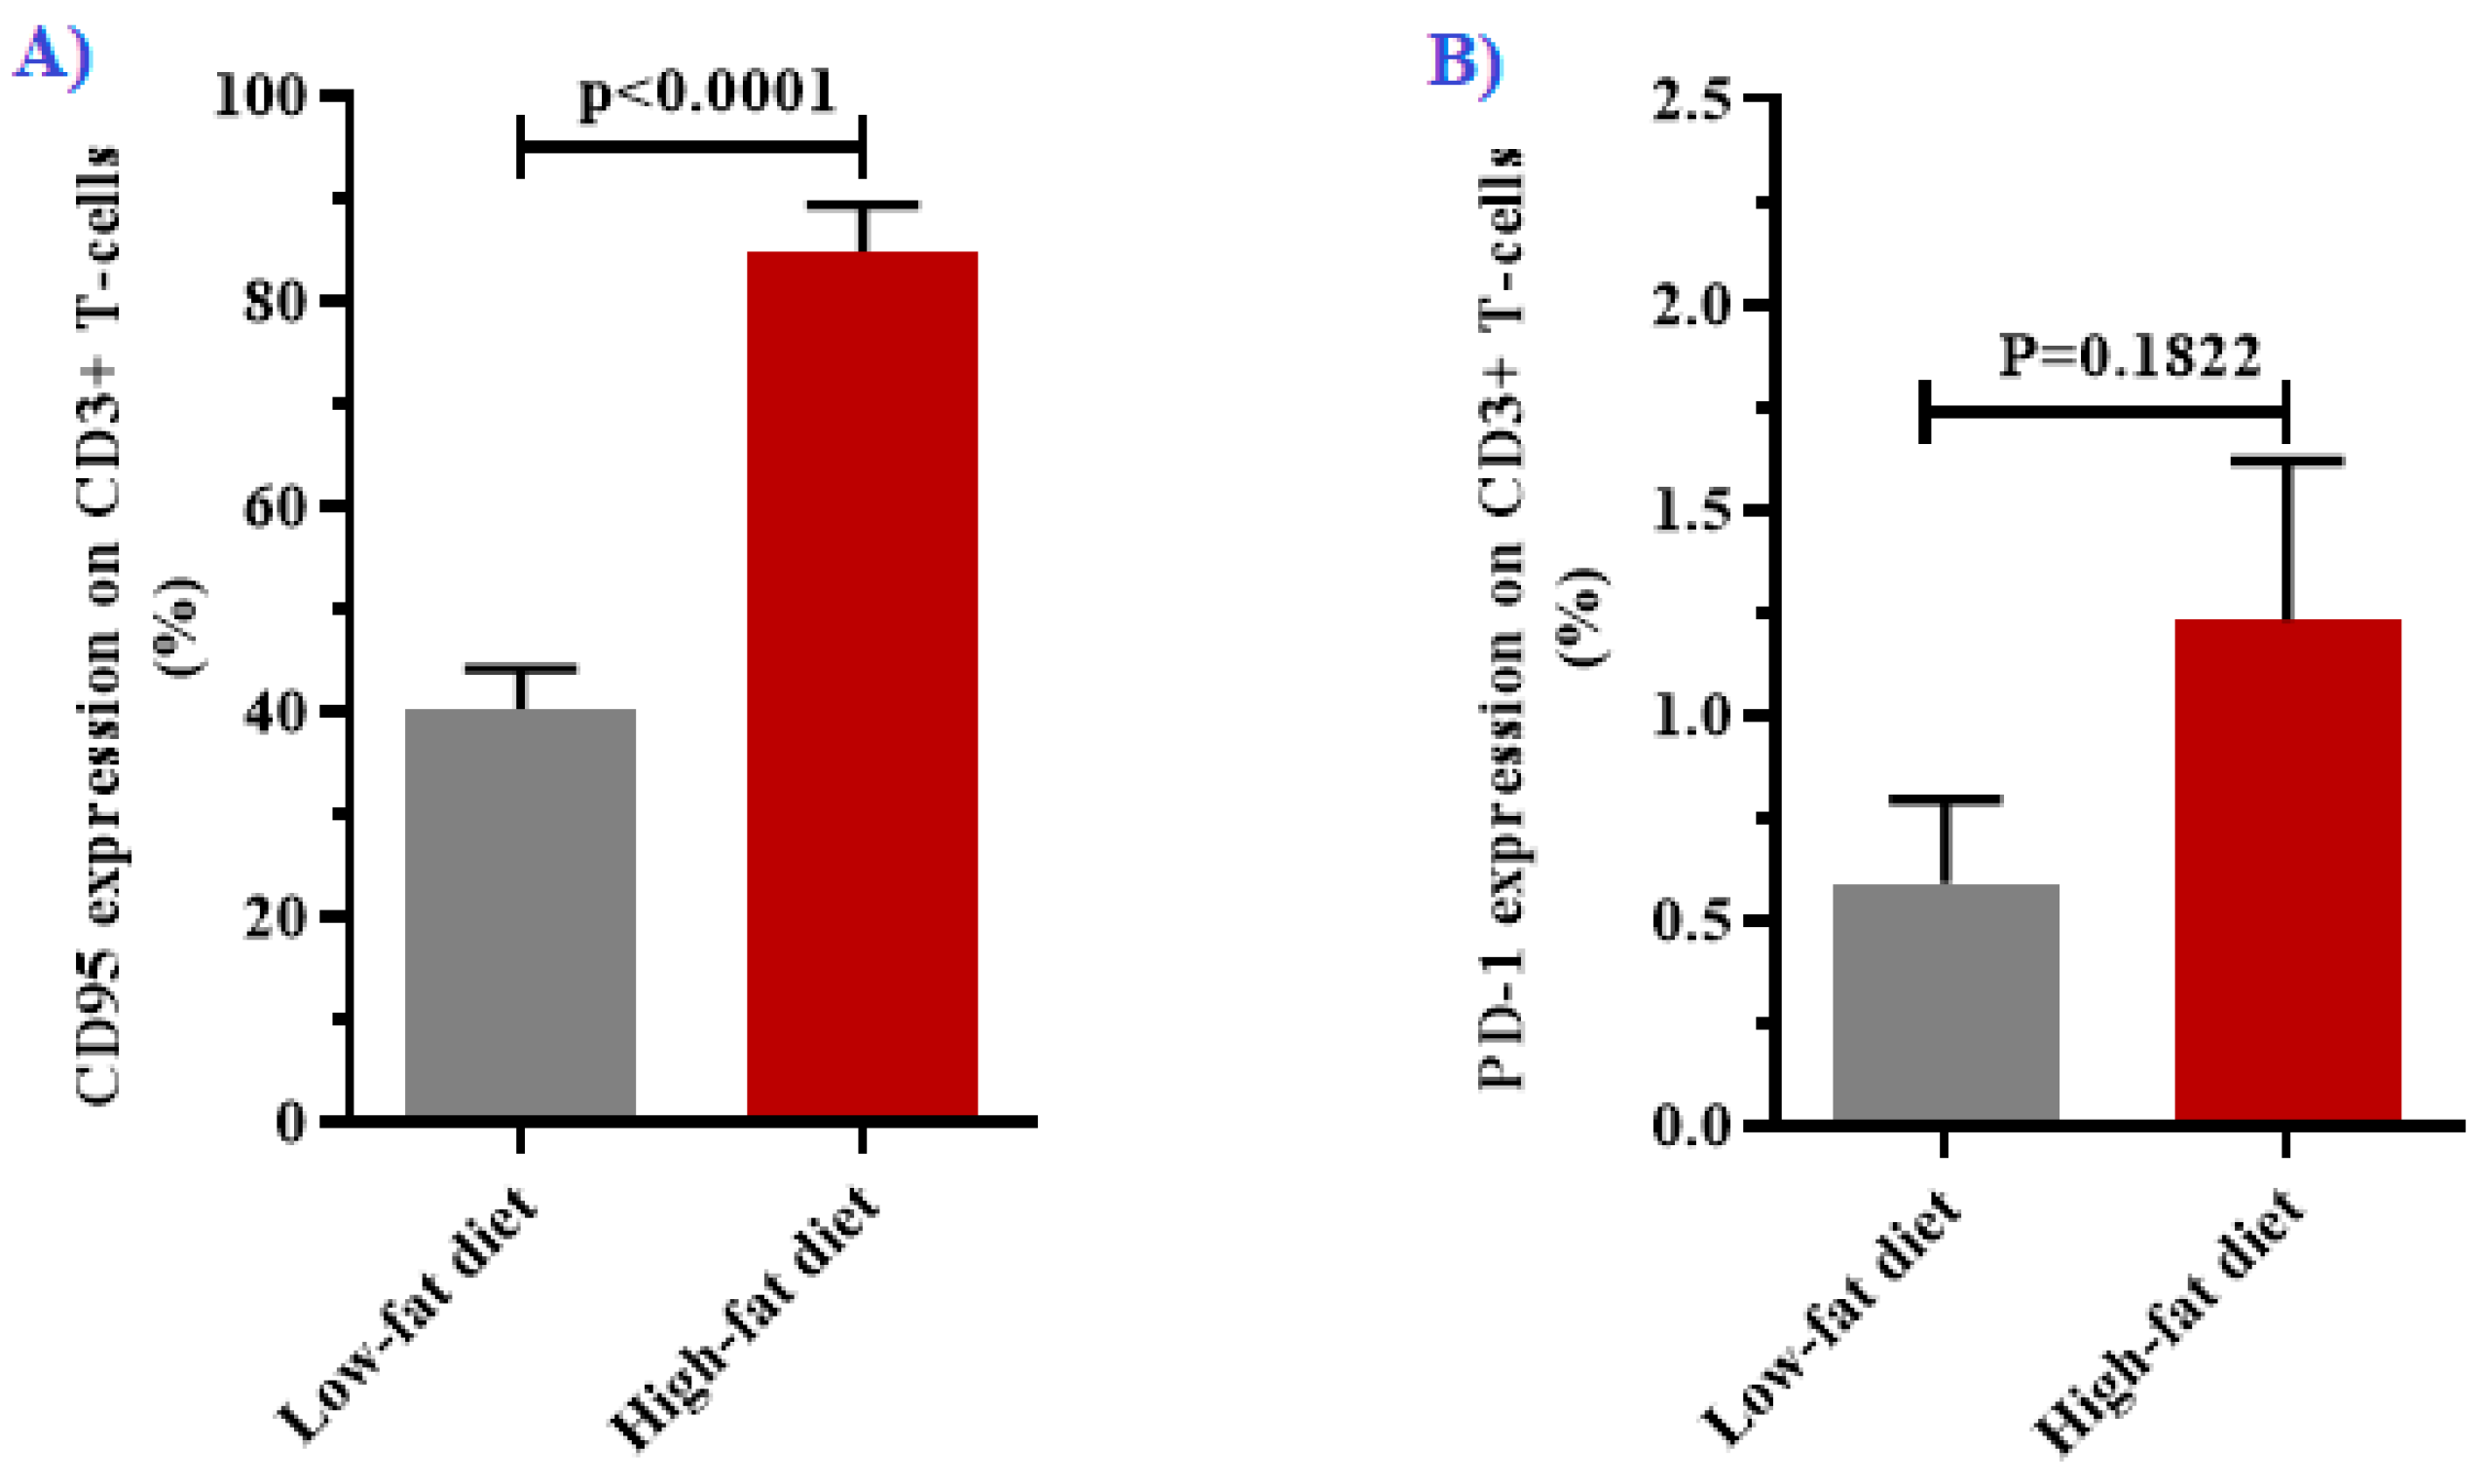
In order to assess T-cell dysfunction in obesity and poor glucose control, we measured the expression Fas and PD-1 on T-cells following 8 weeks of HFD feeding (Table 1). Notably, there was a significant increase in the expression of Fas on T-cells in the HFD-fed group (84.88 ± 4.49) when compared with the LFD-fed group (40.23 ± 3.92), p < 0.0001 (Figure 3A). However, PD-1 expression was comparable between the two groups (p = 0.1822) (Figure 3B).

3.4. Associations between Fas-Mediated T-cell Dysfunction and Metabolic Disorders

Obesity is strongly characterized by poor glucose control and dyslipidemia [3,26]. We performed a correlation analysis to assess whether there is any association between Fas expression and metabolic disorder. We found a strong positive correlation between Fas expression and body weight (Pearson’s r = 0.91, p = 0.0012), and a strong negative correlation with absolute monocyte counts (Pearson’s r = −0.89, p = 0.0460). There was also a strong association between body weight and WCC (Pearson’s r = 0.94, p = 0.018) and absolute lymphocyte counts (Pearson’s r = 0.95, p = 0.0130). However, there were no significant correlations between Fas and PD-1 expression, or with glucose or lipid profiles (p > 0.05). We further performed a multivariant regression analysis of potential modifiers of Fas expression on T-cells. The association between the levels of Fas on T-cells and body weight (β = 1432, p = 0.0330) was independent of fasting blood glucose (p = 0.0720), total cholesterol (p = 0.0688), and lymphocyte count (p = 0.0947) (Table 2).

4. Discussion

The aim of this study was to assess the expression Fas and PD-1 on circulating T-cells in obesity using a DIO mouse model. In this model, 8-week HFD feeding induced long-term glucose impairment, dyslipidemia, and weight gain [27,28]. Interestingly, these changes are analogous with the characteristic features of metabolic syndrome in humans [29], whereby poor glucose control and increased total cholesterol have been reported in obese adults [30]. In our study, both lipid and glucose metabolism were altered following HFD feeding. Notably, when we assessed the lipid profiles, only the total cholesterol levels were elevated in the HFD-fed group, whereas LDL cholesterol and HDL cholesterol remained comparable between the two diet groups. The discordant cholesterol results may be attributed to increased triglyceride levels in obesity, which, together with aberrant cholesterol levels, predispose obese individuals to CVD [3].
It is established that leukocytosis is an indicator of immune activation and is closely associated with inflammation. In previous studies, obesity was positively associated with an increase in WCC [31,32], whereby an increase in BMI was associated with neutrophilia [31]. Likewise, our results showed that HFD-fed mice gained weight and had a significantly elevated WCC, which was indicative of a pro-inflammatory state in obesity. This may suggest that leukocytosis in obesity is mainly driven by the increased proliferation of neutrophils. Obesity-related leukocytosis is associated with dyslipidemia, which is characterized by increased total cholesterol and LDL cholesterol and low HDL cholesterol [33]. Notably, increased WCC has been directly associated with aberrant cholesterol levels in patients with metabolic syndrome [34]. Overall, our findings seem to suggest that increased immune activation and dyslipidemia may be responsible for the pathogenesis of metabolic syndrome in individuals with obesity.
Fas is one of the increasingly explored proteins for its modulatory role in immune activation [16]. Apart from mediating apoptotic cell death, Fas signaling also induces other non-apoptotic activities regulated by members of the tumor necrosis factor receptor superfamily. These include the activation and proliferation of leucocytes [35], which is well-described in patients with metabolic disorders, and experimental models of obesity and non-alcoholic fatty liver disease [13,26,36,37]. In obese individuals, increased expression of Fas on monocytes, neutrophils, and T-cells was associated with activation of the pro-inflammatory pathways and differentiation of immune cells in conditions of metabolic disease [13,26,36,38]. Interestingly, the blockage of Fas signaling can attenuate obesity-induced adipose tissue inflammation by inhibiting IL-6 whilst promoting IL-10 secretion [26]. Subsequently, IL-10 can inhibit Fas expression and its signaling through the activation of FLICE-like inhibitory protein (FLIP) [39]. In our study, we observed increased Fas expression on T-cells and elevated lymphocyte counts in the HFD-fed, thus highlighting the non-apoptotic effect of the Fas-FasL axis [15]. Lastly, as it is also one of the important regulators of immune activation, we report on comparable levels of PD-1 expression on T-cells between the HFD-fed and LFD-fed group. However, this is in contrast to previous studies [22,40,41], where the upregulation of PD-1 was reported in patients with obesity. The difference in the findings may be attributed to the immunological responses in early stages of obesity-induced inflammation since the upregulation of PD-1 in T-cell exhaustion is strongly linked with a chronic inflammatory state [42]. However, to be certain, different experimental models must be explored to assess the expression levels of PD-1 on T-cells under conditions of metabolic syndrome.
Our study had a few limitations. We did not assess the expression of Fas and PD-1 on T-cell subsets, which would have provided insight to the expression of these regulatory markers. However, a previous study [13] showed that the expression levels of Fas on CD4+ T-cells were comparable between obese and lean individuals. We therefore opted to assess the expression of these regulatory markers on the major T-cell lineage. Secondly, we could not assess oxidative stress or bone marrow and thymus parameters, which are closely related to T-cell dysfunction. Future studies need to investigate these aspects. Nonetheless, the upregulation of Fas on T-cells is compatible with low levels of perforin, granzyme B, and interferon γ secretion and elevated levels of complement and caspase proteins in various metabolic disorders [43,44,45]. Thus highlighting the role of Fas expression in mediating the dysfunction of T-cells in inflammatory milieus. Lastly, we did not determine whether the upregulation of Fas expression is directly associated with increased activation of Fas signaling. Future studies need to investigate both these aspects to unveil and understand the mechanisms mediated by Fas in T-cell dysfunction.

5. Conclusions

Obesity is characterized by dyslipidemia, increased immune activation, and T-cell dysfunction. Most importantly, altered T-cell function is partially mediated by the upregulation of Fas which is independent of dyslipidemia and hyperglycemia. Therefore, therapeutic strategies that target the Fas-FasL axis may be of benefit for patients with obesity who are also at risk of developing metabolic disease-related complications such as CVD and Type 2 diabetes mellitus.

Author Contributions

Conceptualization, T.M.N., P.V.D. and B.B.N.; methodology, T.M.N., P.V.D. and B.B.N.; software, T.M.N. and B.B.N.; validation, T.M.N. and B.B.N.; formal analysis, T.M.N. and B.B.N.; investigation, T.M.N., P.V.D. and B.B.N.; resources, P.V.D. and B.B.N.; data curation, T.M.N. and B.B.N.; writing—original draft preparation, T.M.N.; writing—review and editing, T.M.N., P.V.D. and B.B.N.; visualization, T.M.N. and B.B.N.; supervision, P.V.D. and B.B.N.; funding acquisition, P.V.D. and B.B.N. All authors have read and agreed to the published version of the manuscript.

Funding

This research was funded by the National Research Foundation (NRF) of South Africa (Grant Number: 107519 to B.B. Nkambule). B.B.N. is also a University of KwaZulu-Natal (UKZN) Developing Research Innovation, Localization and Leadership in South Africa (DRILL) fellow. DRILL is a NIH D43 grant (D43TW010131) awarded to UKZN in 2015 to support a research training and induction program for early-career academics. P.V. Dludla was partly supported as a postdoctoral fellow by funding from Research Capacity Division of the South African Medical Research Council (SAMRC) through its division of Research Capacity Development under the Intra-Mural Postdoctoral Fellowship Programme from funding received from the South African Treasury. The content hereof is the sole responsibility of the authors and do not necessarily represent the official views of SAMRC or the funders.

Institutional Review Board Statement

The study was conducted according to the National Society of Medical Research and the National Institutes of Animal Care and Use of Laboratory Animals of the National Academy of Science, and the study protocol was approved by the University of KwaZulu-Natal Animal Research Ethics Committee (AREC) (protocol number: AREC/086/016; date of approval: 16 August 2018).

Informed Consent Statement

Not applicable.

Data Availability Statement

The data presented in this study are available on request from the corresponding author.

Conflicts of Interest

The authors declare no conflict of interest.

References

  1. Blüher, M. Obesity: Global epidemiology and pathogenesis. Nat. Rev. Endocrinol. 2019, 15, 288–298. [Google Scholar] [CrossRef] [PubMed]
  2. Bays, H.E.; Toth, P.P.; Kris-Etherton, P.M.; Abate, N.; Aronne, L.J.; Brown, W.V.; Gonzalez-Campoy, J.M.; Jones, S.R.; Kumar, R.; La Forge, R.; et al. Obesity, adiposity, and dyslipidemia: A consensus statement from the National Lipid Association. J. Clin. Lipidol. 2013, 7, 304–383. [Google Scholar] [CrossRef] [Green Version]
  3. Vekic, J.; Zeljkovic, A.; Stefanovic, A.; Jelic-ivanovic, Z.; Spasojevic-kalimanovska, V. Obesity and dyslipidemia. Metab. Clin. Exp. 2019, 92, 71–81. [Google Scholar] [CrossRef]
  4. Saltiel, A.R.; Olefsky, J.M. Inflammatory mechanisms linking obesity and metabolic disease. J. Clin. Investig. 2017, 127, 1–4. [Google Scholar] [CrossRef] [PubMed]
  5. Andersen, C.J.; Murphy, K.E.; Fernandez, M.L. Impact of Obesity and Metabolic Syndrome on Immunity. Adv. Nutr. 2016, 7, 66–75. [Google Scholar] [CrossRef] [PubMed] [Green Version]
  6. Yamauchi, T.; Kamon, J.; Minokoshi, Y.; Ito, Y.; Waki, H.; Uchida, S.; Yamashita, S.; Noda, M.; Kita, S.; Ueki, K.; et al. Adiponectin stimulates glucose utilization and fatty-acid oxidation by activating AMP-activated protein kinase. Nat. Med. 2002, 8, 1288–1295. [Google Scholar] [CrossRef] [PubMed]
  7. Nyambuya, T.M.; Dludla, P.V.; Mxinwa, V.; Nkambule, B.B. Obesity-induced inflammation and insulin resistance: A mini-review on T-cells. Metab. Open 2019, 3, 100015. [Google Scholar] [CrossRef] [PubMed]
  8. Wunderlich, C.M.; Hövelmeyer, N.; Wunderlich, F.T. Mechanisms of chronic JAK-STAT3-SOCS3 signaling in obesity. JAKSTAT 2013, 2, e238781–e2387817. [Google Scholar] [CrossRef] [PubMed]
  9. Francisco, V.; Pino, J.; Campos-Cabaleiro, V.; Ruiz-Fernández, C.; Mera, A.; Gonzalez-Gay, M.A.; Gómez, R.; Gualillo, O. Obesity, Fat Mass and Immune System: Role for Leptin. Front. Physiol. 2018, 9, 640. [Google Scholar] [CrossRef] [PubMed] [Green Version]
  10. Mashili, F.; Chibalin, A.V.; Krook, A.; Zierath, J.R. Constitutive STAT3 Phosphorylation Contributes to Skeletal Muscle Insulin Resistance in Type 2 Diabetes. Diabetes 2013, 62, 457–465. [Google Scholar] [CrossRef] [PubMed] [Green Version]
  11. Jorgensen, S.B.; O’Neill, H.M.; Sylow, L.; Honeyman, J.; Hewitt, K.A.; Palanivel, R.; Fullerton, M.D.; Öberg, L.; Balendran, A.; Galic, S.; et al. Deletion of Skeletal Muscle SOCS3 Prevents Insulin Resistance in Obesity. Diabetes 2013, 62, 56–64. [Google Scholar] [CrossRef] [PubMed] [Green Version]
  12. Wang, Q.; Wu, H. T Cells in Adipose Tissue: Critical Players in Immunometabolism. Front. Immunol. 2018, 9, 9–11. [Google Scholar] [CrossRef] [Green Version]
  13. O’Rourke, R.W.; Kay, T.; Scholz, M.H.; Diggs, B.; Jobe, B.A.; Lewinsohn, D.M.; Bakke, A.C. Alterations in T-Cell Subset Frequency in Peripheral Blood in Obesity. Obes. Surg. 2005, 15, 1463–1468. [Google Scholar] [CrossRef] [PubMed]
  14. Aguilar, E.G.; Murphy, W.J. Obesity induced T cell dysfunction and implications for cancer immunotherapy. Curr. Opin. Immunol. 2018, 51, 181–186. [Google Scholar] [CrossRef]
  15. Paulsen, M.; Janssen, O. Pro- and anti-apoptotic CD95 signaling in T cells. Cell Commun. Signal. 2011, 9, 7. [Google Scholar] [CrossRef] [Green Version]
  16. Puliaeva, I.; Puliaev, R.; Shustov, A.; Haas, M.; Via, C.S. Fas expression on antigen-specific T cells has costimulatory, helper and downregulatory functions in vivo for cytotoxic T cell responses but not for T cell-dependent B cell responses. J. Immunol. 2008, 181, 5912–5929. [Google Scholar] [CrossRef] [Green Version]
  17. Maksimow, M.; Soderstrom, T.S.; Jalkanen, S.; Eriksson, J.E.; Hanninen, A. Fas costimulation of naive CD4 T cells is controlled by NF-kB signaling and caspase activity. J. Leukoc. Biol. 2006, 79, 369–377. [Google Scholar] [CrossRef] [PubMed]
  18. Nyambuya, T.; Davison, G.M.; Hon, G.; Kengne, A.; Erasmus, R.; Matsha, T. T-cell Activation and Dysfunction in Hyperglycaemia. Med. Technol. S. Afr. 2018, 32, 24–27. [Google Scholar]
  19. Bennett, F.; Luxenberg, D.; Ling, V.; Wang, I.-M.; Marquette, K.; Lowe, D.; Khan, N.; Veldman, G.; Jacobs, K.A.; Valge-Archer, V.E.; et al. Program Death-1 Engagement Upon TCR Activation Has Distinct Effects on Costimulation and Cytokine-Driven Proliferation: Attenuation of ICOS, IL-4, and IL-21, But Not CD28, IL-7, and IL-15 Responses. J. Immunol. 2003, 170, 711–718. [Google Scholar] [CrossRef] [PubMed] [Green Version]
  20. Lee, J.; Ahn, E.; Kissick, H.T.; Ahmed, R. Reinvigorating Exhausted T Cells by Blockade of the PD-1 Pathway. For. Immunopathol. Dis. Therap. 2015, 6, 7–17. [Google Scholar] [CrossRef] [PubMed] [Green Version]
  21. Butte, M.J.; Keir, M.E.; Phamduy, T.B.; Sharpe, A.H.; Freeman, G.J. Programmed Death-1 Ligand 1 Interacts Specifically with the B7-1 Costimulatory Molecule to Inhibit T Cell Responses. Immunity 2007, 27, 111–122. [Google Scholar] [CrossRef] [PubMed] [Green Version]
  22. Wang, Z.; Aguilar, E.G.; Luna, J.I.; Dunai, C.; Khuat, L.T.; Le, C.T.; Mirsoian, A.; Minnar, C.M.; Stoffel, K.M.; Sturgill, I.R.; et al. Paradoxical effects of obesity on T cell function during tumor progression and PD-1 checkpoint blockade. Nat. Med. 2019, 25, 141–151. [Google Scholar] [CrossRef]
  23. Fujisawa, R.; Haseda, F.; Tsutsumi, C.; Hiromine, Y.; Noso, S.; Kawabata, Y.; Mitsui, S.; Terasaki, J.; Ikegami, H.; Imagawa, A.; et al. Low programmed cell death-1 (PD-1) expression in peripheral CD4+ T cells in Japanese patients with autoimmune type 1 diabetes. Clin. Exp. Immunol. 2015, 180, 452–457. [Google Scholar] [CrossRef] [PubMed] [Green Version]
  24. Sun, P.; Jin, Q.; Nie, S.; Jia, S.; Li, Y.; Li, X.; Guo, F. Unlike PD-L1, PD-1 is downregulated on partial immune cells in type 2 diabetes. J. Diabetes Res. 2019, 2019, 1–8. [Google Scholar] [CrossRef] [PubMed] [Green Version]
  25. Andrikopoulos, S.; Blair, A.R.; Deluca, N.; Fam, B.C.; Proietto, J. Evaluating the glucose tolerance test in mice. Am. J. Physiol. Metab. 2008, 295, E1323–E1332. [Google Scholar] [CrossRef] [PubMed] [Green Version]
  26. Wueest, S.; Rapold, R.A.; Schumann, D.M.; Rytka, J.M.; Schildknecht, A.; Nov, O.; Chervonsky, A.V.; Rudich, A.; Schoenle, E.J.; Donath, M.Y.; et al. Deletion of Fas in adipocytes relieves adipose tissue inflammation and hepatic manifestations of obesity in mice. J. Clin. Investig. 2010, 120, 191–202. [Google Scholar] [CrossRef] [PubMed] [Green Version]
  27. Podrini, C.; Project, S.M.G.; Cambridge, E.L.; Lelliott, C.J.; Carragher, D.M.; Estabel, J.; Gerdin, A.-K.; Karp, N.A.; Scudamore, C.L.; Ramirez-Solis, R.; et al. High-fat feeding rapidly induces obesity and lipid derangements in C57BL/6N mice. Mamm. Genome 2013, 24, 240–251. [Google Scholar] [CrossRef] [Green Version]
  28. Lang, P.; Hasselwander, S.; Li, H.; Xia, N. Effects of different diets used in diet-induced obesity models on insulin resistance and vascular dysfunction in C57BL/6 mice. Sci. Rep. 2019, 9, 1–14. [Google Scholar] [CrossRef] [Green Version]
  29. Della Vedova, M.C.; Muñoz, M.D.; Santillan, L.D.; Plateo-Pignatari, M.G.; Germanó, M.J.; Tosi, M.E.R.; Garcia, S.; Gomez, N.N.; Fornes, M.W.; Mejiba, S.E.G.; et al. A Mouse Model of Diet-Induced Obesity Resembling Most Features of Human Metabolic Syndrome. Nutr. Metab. Insights 2016, 9, 93–102. [Google Scholar] [CrossRef] [Green Version]
  30. Lukács, A.; Horváth, E.; Máté, Z.; Szabó, A.; Virág, K.; Papp, M.; Sándor, J.; Ádány, R.; Paulik, E. Abdominal obesity increases metabolic risk factors in non-obese adults: A Hungarian cross-sectional study. BMC Public Health 2019, 19, 1–8. [Google Scholar] [CrossRef] [Green Version]
  31. Sait, S.; Alqassas, M.; Othman, S.; Sb, S.; Alqalayta, L.; Alqusair, S.; Qari, M. Obesity correlates with neutrophilia. Hamatol. Transfus. Intern. J. 2016, 3, 159–162. [Google Scholar] [CrossRef]
  32. Dixon, J.B.; O’Brien, P.E. Obesity and the White Blood Cell Count: Changes with Sustained Weight Loss. Obes. Surg. 2006, 16, 251–257. [Google Scholar] [CrossRef]
  33. Kim, D.-J.; Noh, J.-H.; Lee, B.-W.; Choi, Y.-H.; Chung, J.-H.; Min, Y.-K.; Lee, M.-S.; Lee, M.-K.; Kim, K.-W. The Associations of Total and Differential White Blood Cell Counts with Obesity, Hypertension, Dyslipidemia and Glucose Intolerance in a Korean Population. J. Korean Med. Sci. 2008, 23, 193–198. [Google Scholar] [CrossRef] [PubMed]
  34. Nakanishi, N.; Sato, M.; Shirai, K.; Nakajima, K.; Murakami, S.; Takatorige, T.; Suzuki, K.; Tatara, K. Associations between White Blood Cell Count and Features of the Metabolic Syndrome in Japanese Male Office Workers. Ind. Health 2002, 40, 273–277. [Google Scholar] [CrossRef] [PubMed]
  35. Peter, M.E.; Budd, R.C.; Desbarats, J.; Hedrick, S.M.; Hueber, A.-O.; Newell, M.K.; Owen, L.B.; Pope, R.M.; Tschopp, J.; Wajant, H.; et al. The CD95 Receptor: Apoptosis Revisited. Cell 2007, 129, 447–450. [Google Scholar] [CrossRef] [PubMed]
  36. Blüher, M.; Klöting, N.; Wueest, S.; Schoenle, E.J.; Schön, M.R.; Dietrich, A.; Fasshauer, M.; Stumvoll, M.; Konrad, D. Fas and FasL Expression in Human Adipose Tissue Is Related to Obesity, Insulin Resistance, and Type 2 Diabetes. J. Clin. Endocrinol. Metab. 2014, 99, E36–E44. [Google Scholar] [CrossRef] [PubMed] [Green Version]
  37. Item, F.; Wueest, S.; Lemos, V.; Stein, S.; Lucchini, F.C.; Denzler, R.; Fisser, M.C.; Challa, T.D.; Pirinen, E.; Kim, Y.; et al. Fas cell surface death receptor controls hepatic lipid metabolism by regulating mitochondrial function. Nat. Commun. 2017, 8, 1–10. [Google Scholar] [CrossRef] [PubMed] [Green Version]
  38. Wueest, S.; Mueller, R.; Blüher, M.; Item, F.; Chin, A.S.H.; Wiedemann, M.S.F.; Takizawa, H.; Kovtonyuk, L.; Chervonsky, A.V.; Schoenle, E.J.; et al. Fas (CD95) expression in myeloid cells promotes obesity-induced muscle insulin resistance. EMBO Mol. Med. 2014, 6, 43–56. [Google Scholar] [CrossRef] [PubMed] [Green Version]
  39. Aschkenazi, S.; Straszewski, S.; Verwer, K.M.A.; Foellmer, H.; Rutherford, T.; Mor, G. Differential Regulation and Function of the Fas/Fas Ligand System in Human Trophoblast Cells. Biol. Reprod. 2002, 66, 1853–1861. [Google Scholar] [CrossRef]
  40. Canter, R.J.; Aguilar, E.; Wang, Z.; Le, C.; Khuat, L.; Dunai, C.; Rebhun, R.; Tarantal, A.; Blazar, B.R.; Monjazeb, A.; et al. Obesity results in higher PD-1-mediated T-cell suppression but greater T-cell effector functions following blockade. J. Clin. Oncol. 2018, 36, 65. [Google Scholar] [CrossRef]
  41. Jia, Y.; Zhao, Y.; Li, C.; Shao, R. The Expression of Programmed Death-1 on CD4+ and CD8+ T Lymphocytes in Patients with Type 2 Diabetes and Severe Sepsis. PLoS ONE 2016, 11, e0159383. [Google Scholar] [CrossRef] [PubMed]
  42. Petrelli, A.; Mijnheer, G.; Van Konijnenburg, D.P.H.; Van Der Wal, M.M.; Giovannone, B.; Mocholi, E.; Vazirpanah, N.; Broen, J.C.; Hijnen, D.; Oldenburg, B.; et al. PD-1+CD8+ T cells are clonally expanding effectors in human chronic inflammation. J. Clin. Investig. 2018, 128, 4669–4681. [Google Scholar] [CrossRef] [PubMed]
  43. Tao, J.; Li, L.; Wang, Y.; Fu, R.; Wang, H.; Shao, Z. Increased TIM3+CD8+T cells in Myelodysplastic Syndrome patients displayed less perforin and granzyme B secretion and higher CD95 expression. Leuk. Res. 2016, 51, 49–55. [Google Scholar] [CrossRef] [PubMed]
  44. Song, L.-J.; Wang, X.; Wang, X.-P.; Li, D.; Ding, F.; Liu, H.-X.; Yu, X.; Li, X.-F.; Shu, Q. Increased Tim-3 expression on peripheral T lymphocyte subsets and association with higher disease activity in systemic lupus erythematosus. Diagn. Pathol. 2015, 10, 71. [Google Scholar] [CrossRef] [Green Version]
  45. Li, N.; Ma, T.; Han, J.; Zhou, J.; Wang, J.; Zhang, J.; Zheng, S. Increased apoptosis induction in CD4+CD25+ Foxp3+ T cells contributes to enhanced disease activity in patients with rheumatoid arthritis through IL-10 regulation. Eur. Rev. Med. Pharmacol. Sci. 2014, 18, 78–85. [Google Scholar] [PubMed]
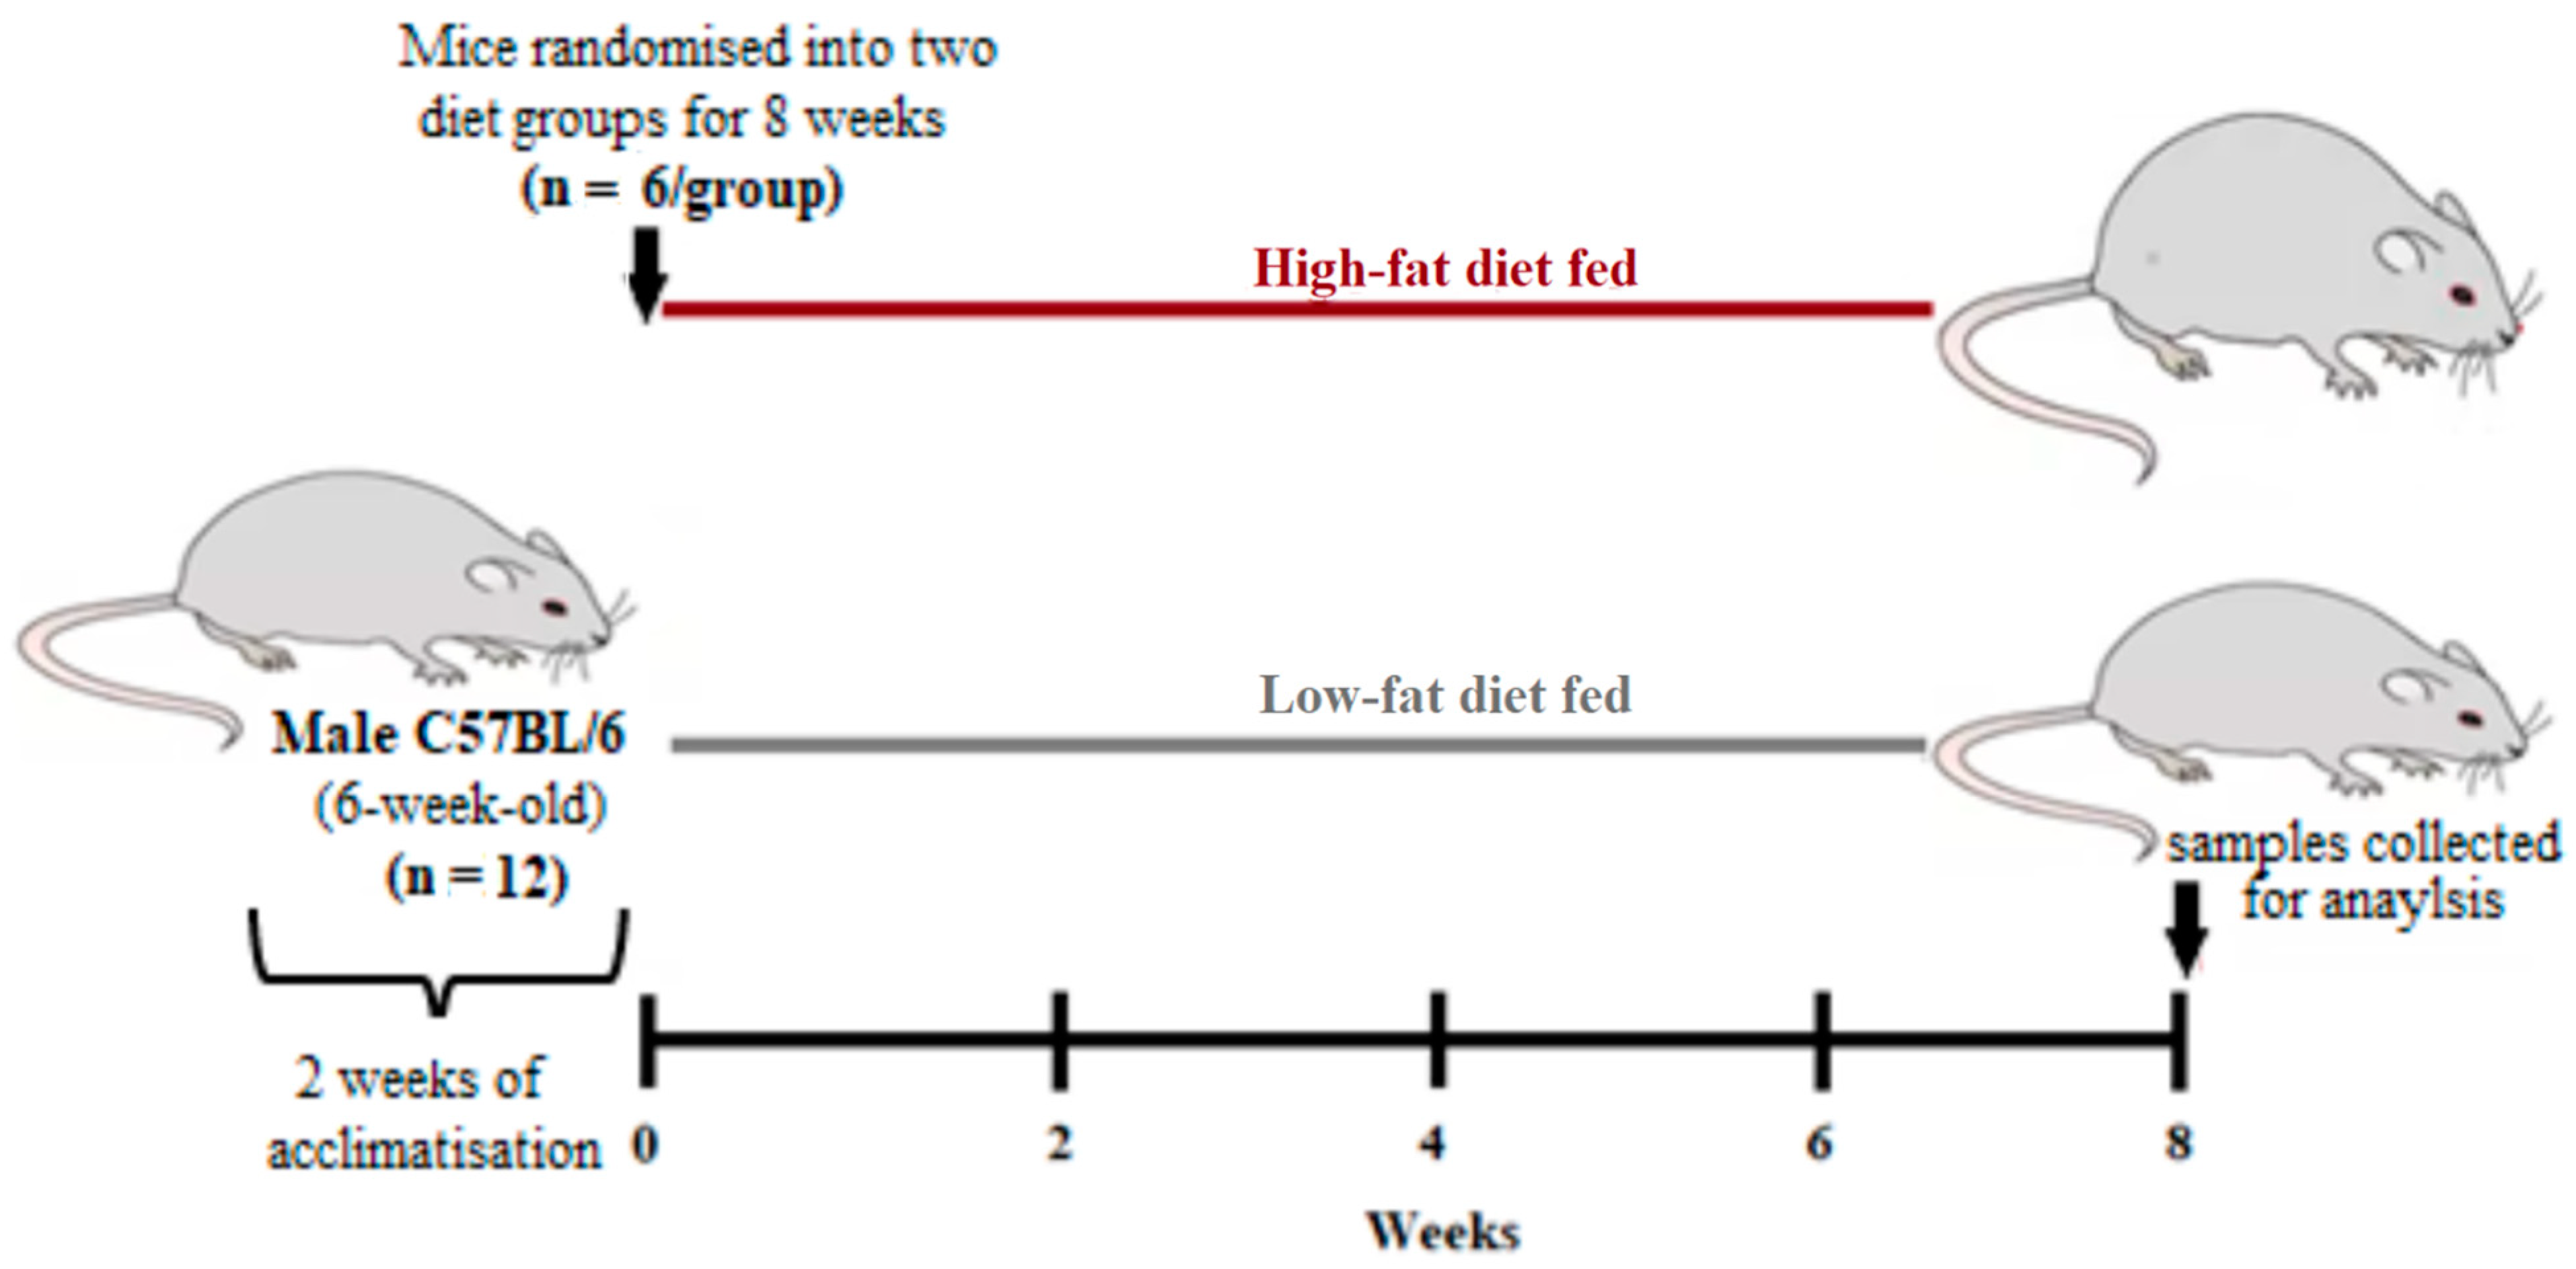
Figure 1. Experimental design. A total of 12 6-week-old male C57BL/6 mice were used in this experiment. Briefly, the mice were randomly allocated into two diets groups receiving a high-fat diet or a low-fat diet for 8 weeks (n = 6/group). The weights were measured weekly, while the postprandial glucose levels, hematological parameters, and blood lipid profiles were measured on the eighth week after diet feeding.
Biology 10 00217 g001
Figure 2. Panel (A) demonstrates changes in animal body weights over 8 weeks, whilst (B,C) illustrate fasting glucose and the area under the curve (AUC) in the 2-h postprandial glucose test, respectively. The lipid profiles were measured using total cholesterol (D), high-density lipoprotein cholesterol (E), and low-density lipoprotein cholesterol levels (F). All data are presented as means ± standard error (SE), except for total cholesterol, which is presented as the median interquartile range.
Biology 10 00217 g002
Figure 3. Changes in the expression of T-cell markers after 8 weeks of being on the respective diets (n = 6/group). The high-fat diet (HFD)-fed group had increased levels of Fas (CD95) expression when compared with the low-fat diet (LFD)-fed group (A). However, programmed cell death 1 (PD-1) expression on CD3+ T-cells was comparable between the two groups (B). All data are presented as means ± standard error (SE).
Biology 10 00217 g003
Table 1. Characteristics of mice after 8 weeks of feeding on a low-fat diet versus a high-fat diet (n = 6/group).
Parameter Low-Fat Diet (n = 6)High-Fat Diet (n = 6)p-Value
Body weight (g) *1.38 ± 0.121.47 ± 0.01 <0.0001
Fasting glucose (mg/dL)3.08 ± 0.116.30 ± 0.390.0007
Area under the curve (mmol/L × 120 min)692.70 ± 67.821062 ± 35.220.0029
Lipid profiles
Total cholesterol (µg/uL)0.020 [0.014–0.023]0.043 [0.039–0.048]0.0079
HDL cholesterol (µg/uL)0.114 ± 0.0480.091 ± 0.0040.6611
LDL cholesterol (µg/uL)0.152 ± 0.0250.093 ± 0.0030.0803
White cell indices
White cell count (103/µL)4.42 ± 0.479.26 ± 1.130.0096
Neutrophils (103/µL)0.34 ± 0.091.01 ± 0.240.0022
Lymphocytes (103/µL)3.98 ± 0.95 7.99 ± 2.360.0155
Monocytes (103/µL)0.08 ± 0.02 0.23 ± 0.070.0015
Red cell indices
Red cell count (106/µL)7.03 ± 0.276.52 ± 0.440.3575
Hemoglobin (g/dL)27.13 ± 0.9426.13 ± 1.030.4933
Hematocrit (%)30.24 ± 1.2927.44 ± 2.010.2809
Mean cell volume (FL)43.00 [43.00–43.50]42.00 [41.00–43.00]0.119
Platelet indices
Platelet count572.00 ± 124.60888.60 ± 73.800.068
Mean platelet volume (FL)5.47 ± 0.235.42 ± 0.130.8553
T-cell markers
% expression of Fas in CD3+ T-cells40.23 ± 3.9284.88 ± 4.49<0.0001
% expression of PD-1 in CD3+ T-cells0.59 ± 0.201.23 ± 0.390.1822
*: Log-transformed data. Results are expressed as the means ± standard error and the median interquartile range. Significant p-values highlighted in bold.
Table 2. A multivariable logistic regression of the potential modifiers of Fas expression in T-cells.
ParameterBetaStandard Error95% Confidence Intervalt-Valuep-Value
Intercept−1951107−3310 to −591.2018.230.0349
Body weight143274.33487.8 to 237719.270.0330
Fasting plasma glucose−4.210.48−10.29 to 1.878.800.0720
Total cholesterol−489.2053.06−1163 to 1859.220.0688
Lymphocyte count −2.590.39−7.51 to 2.346.670.0947
Significant p-values highlighted in bold.
Publisher’s Note: MDPI stays neutral with regard to jurisdictional claims in published maps and institutional affiliations.