
New Mechanistic Insights on Carbon Nanotubes’ Nanotoxicity Using Isolated Submitochondrial Particles, Molecular Docking, and Nano-QSTR Approaches

 , and
, and 
Abstract
Simple Summary
Abstract
1. Introduction
2. Materials and Methods
2.1. Experimental Section
2.1.1. Reagents and Solutions
2.1.2. Carbon Nanotubes’ Characterization
2.1.3. Isolation of Rat Liver Submitochondrial Particles (SMP)
2.1.4. Standard Incubation Procedure
2.1.5. Determination of Mitochondrial F0F1-ATPase Inhibition in Isolated Rat Liver Submitochondrial Particles (SMP)
2.1.6. Statistical Procedures for the Mitochondrial Assays Using SMP
2.2. Theoretical Section
2.2.1. Molecular Docking Study
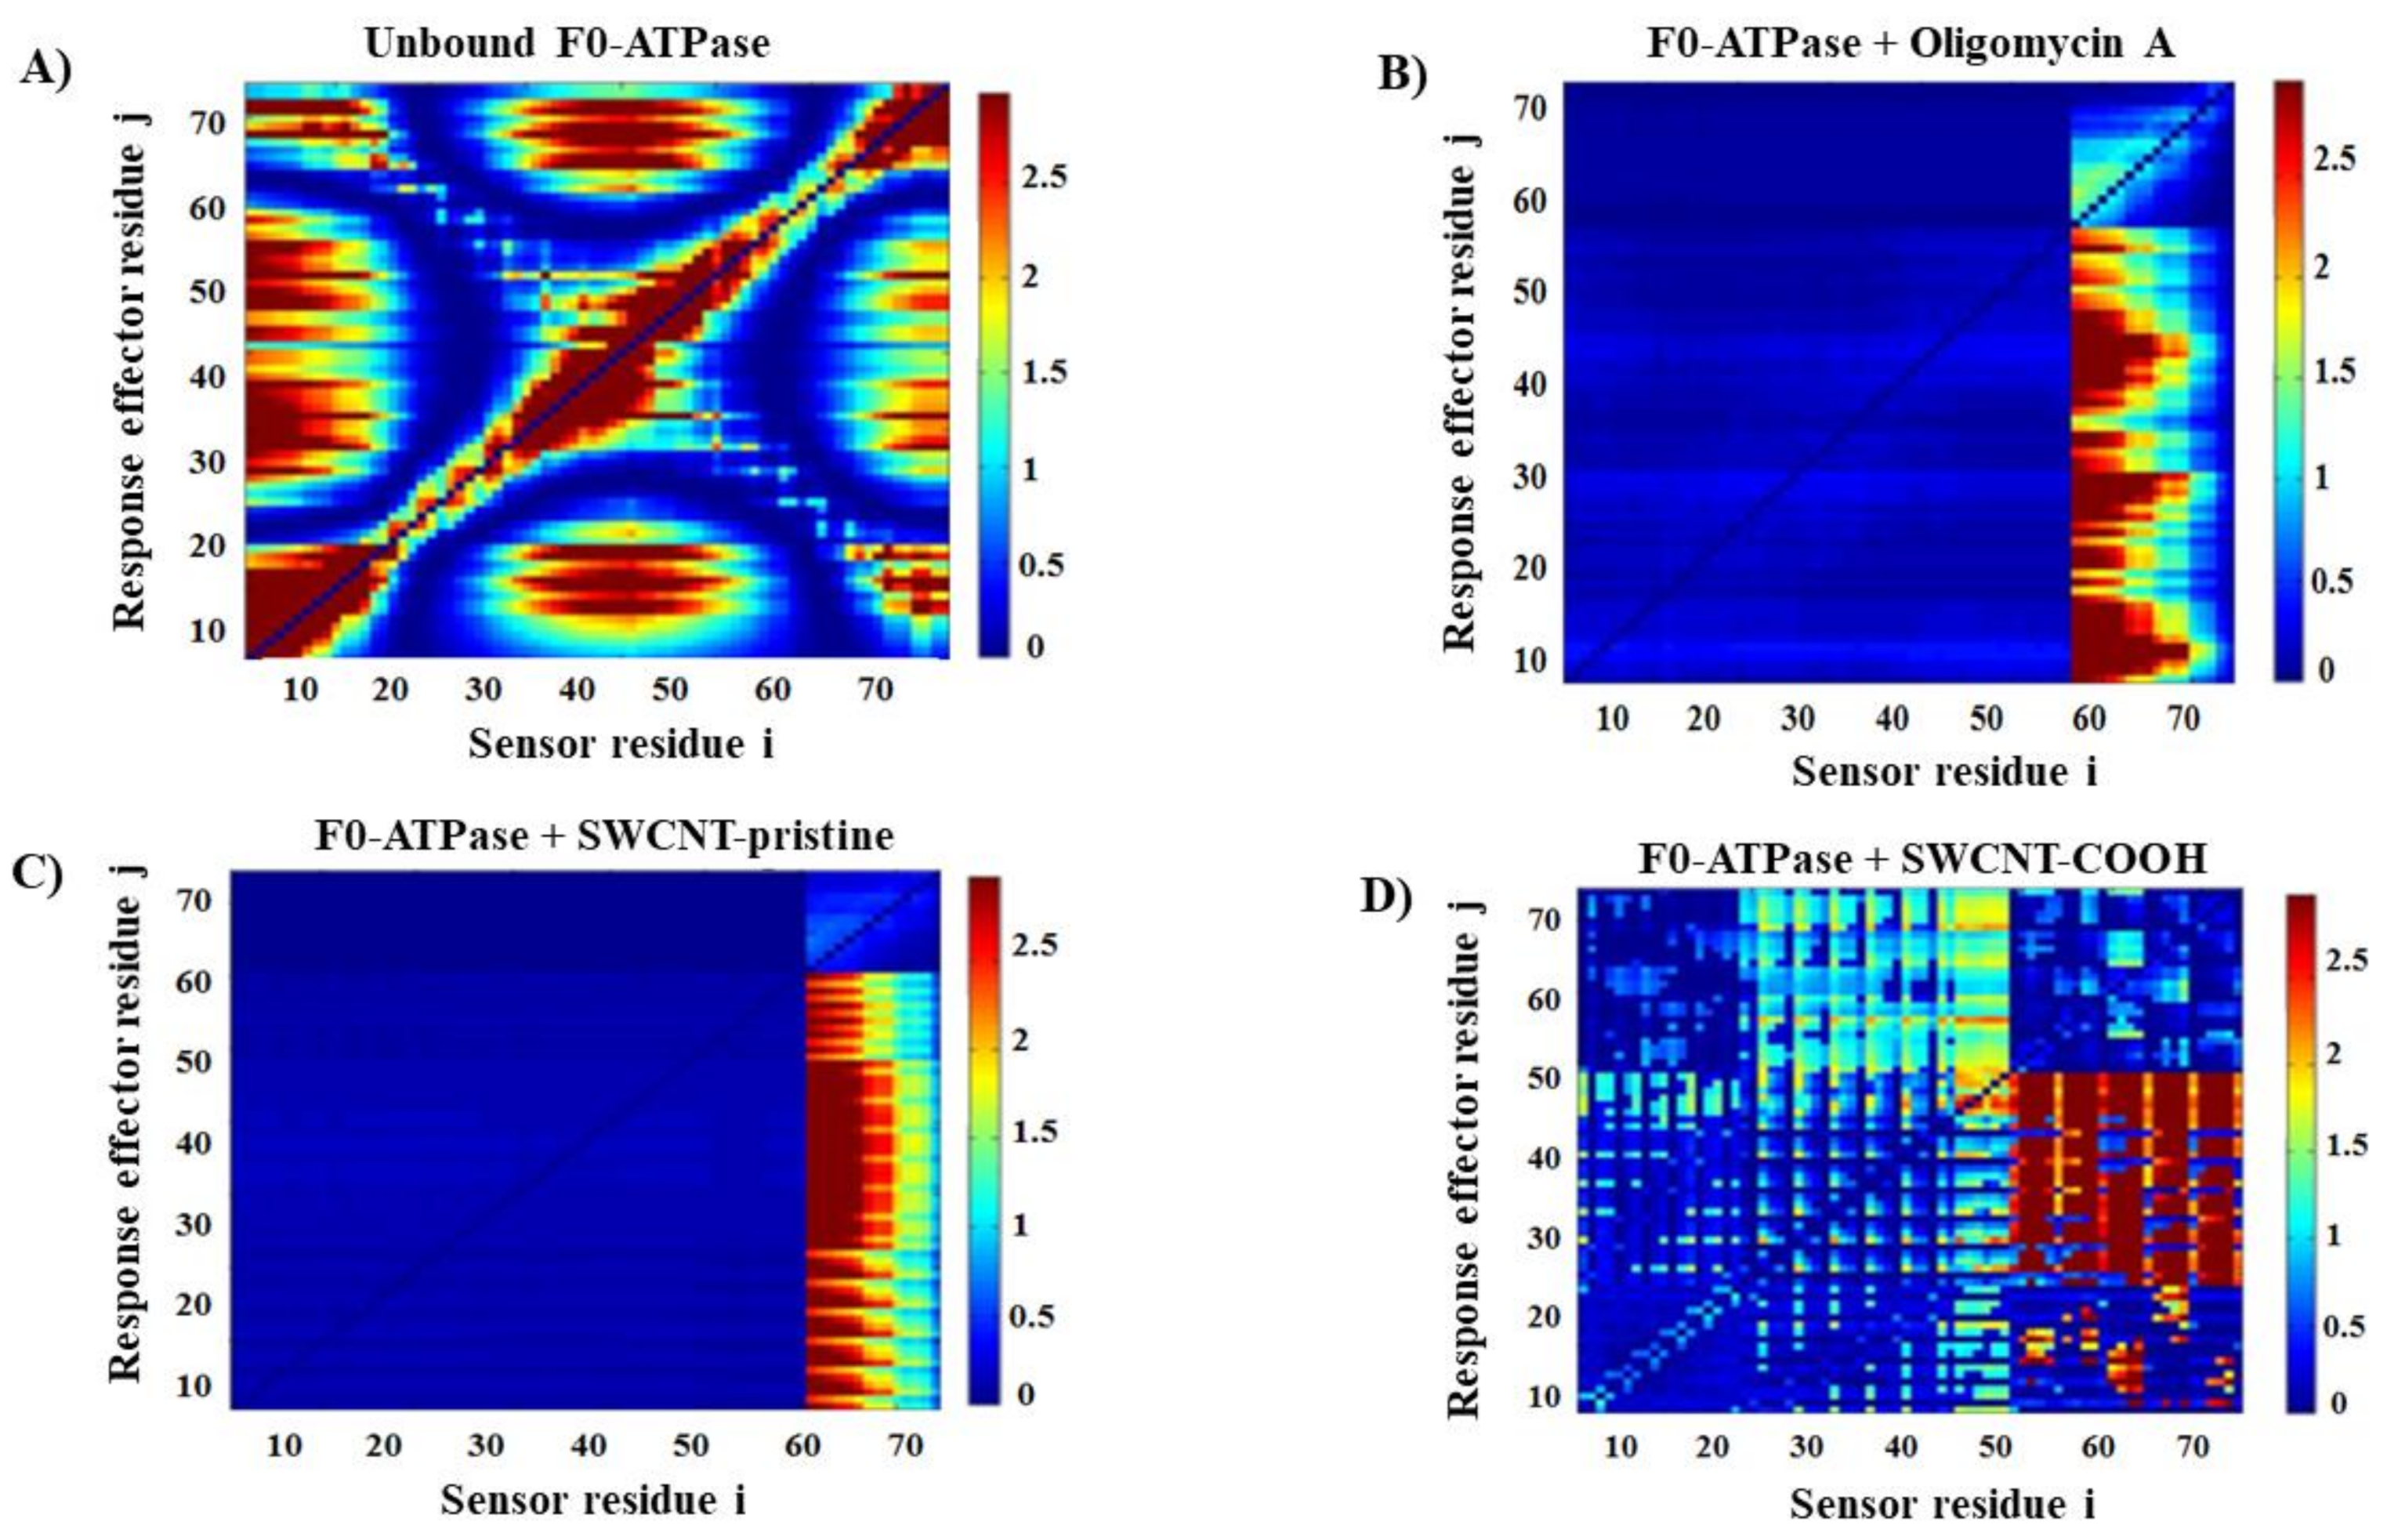
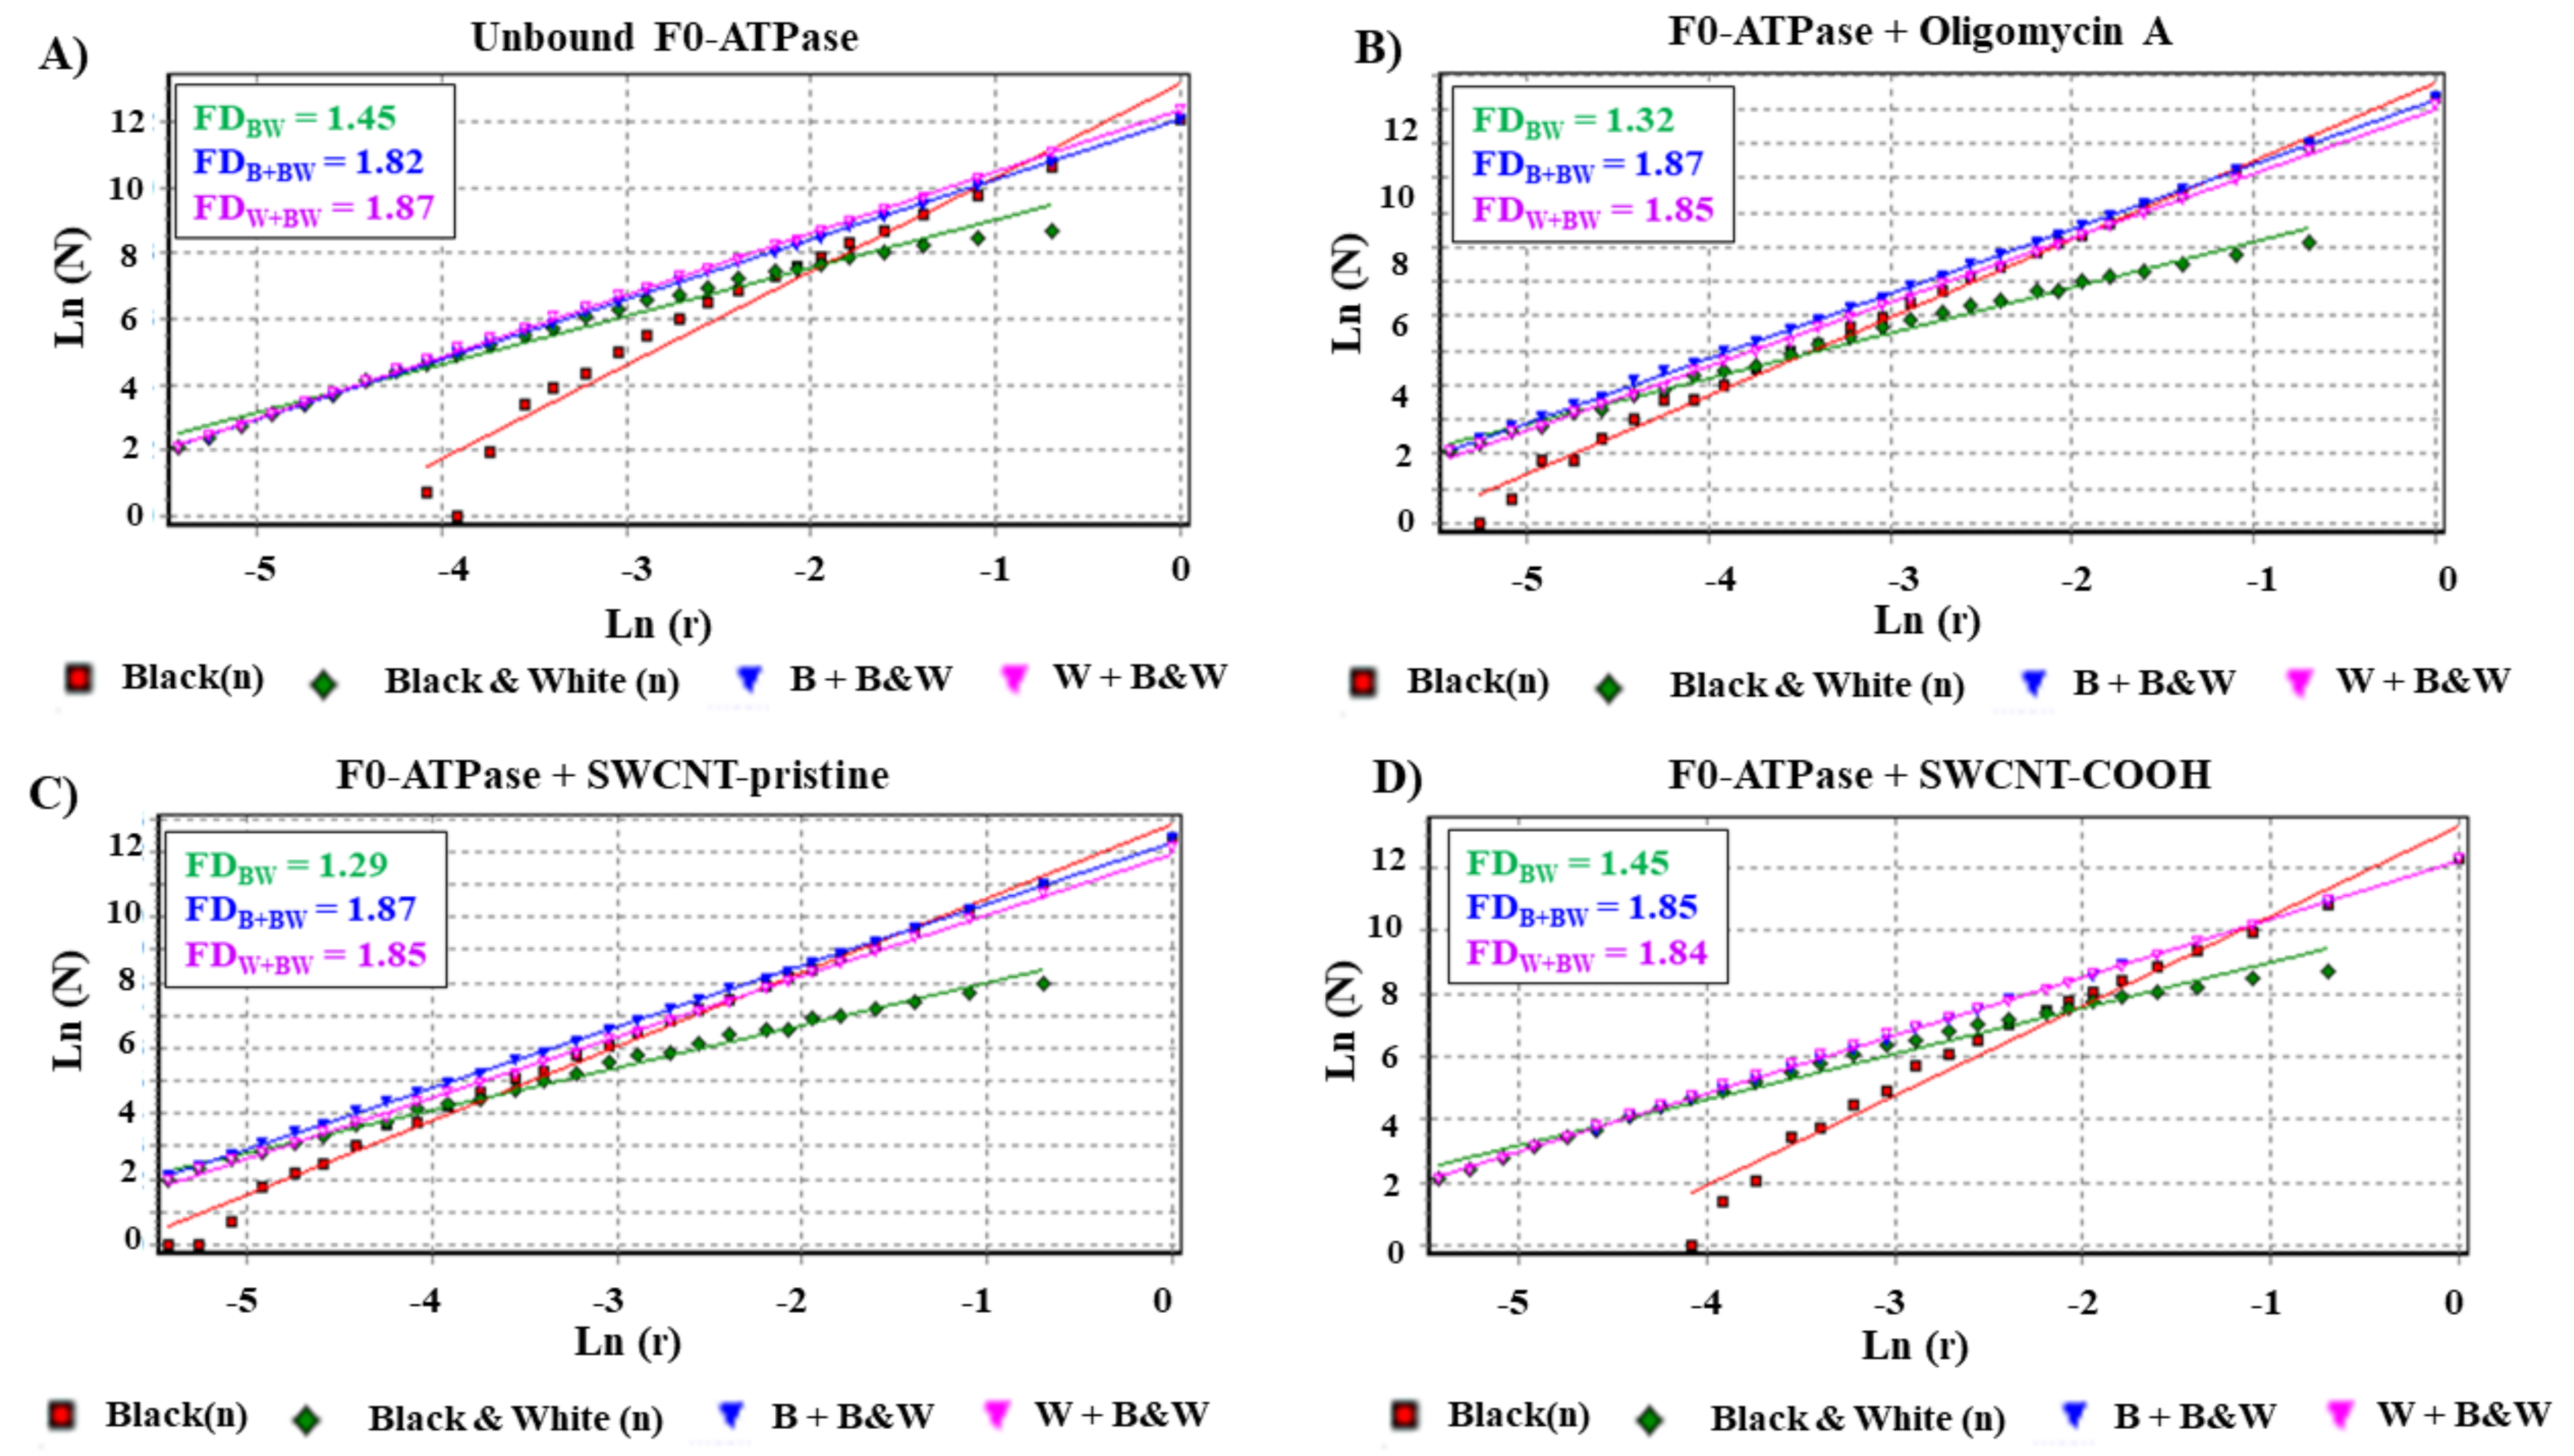
2.2.2. Local Perturbation Response Induced by SWCNT on the F0-ATPase Subunit
2.2.3. Performing Nano-QSTR Approaches
3. Results and Discussion
3.1. CNT Effects on Submitochondrial Particles (SMP)
3.2. Modeling F0ATPase Inhibition Induced by SWCNTs
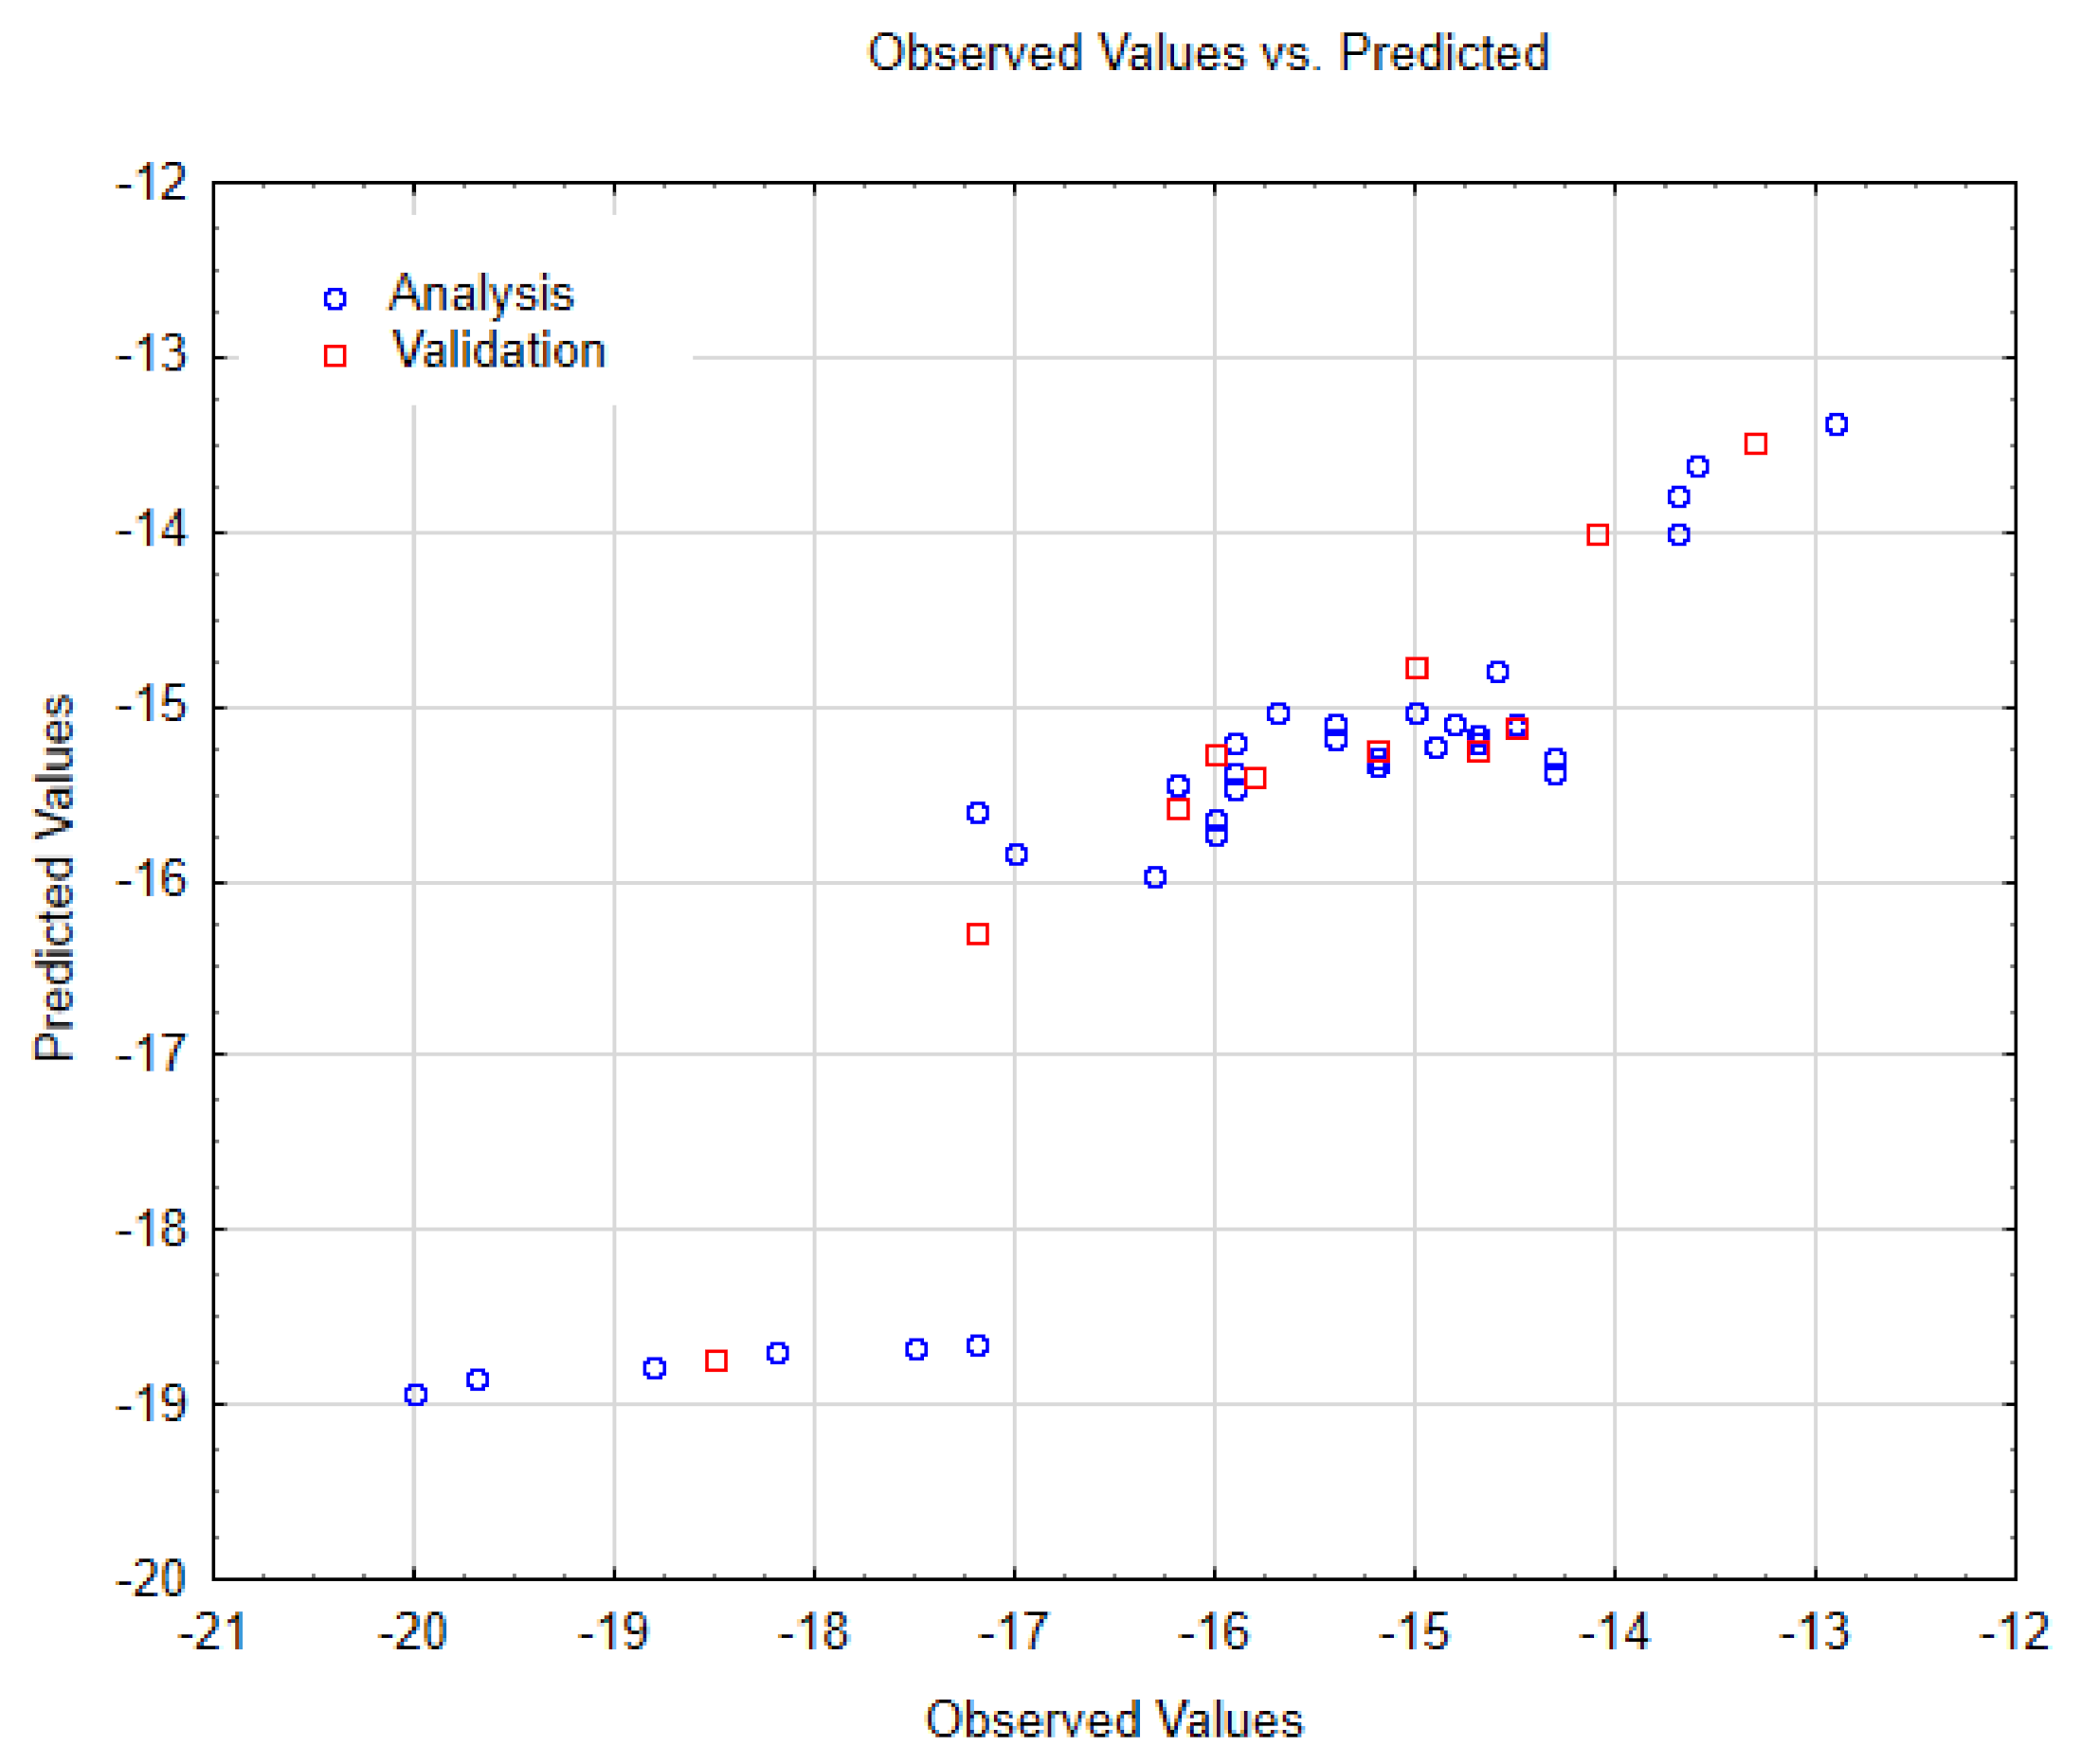
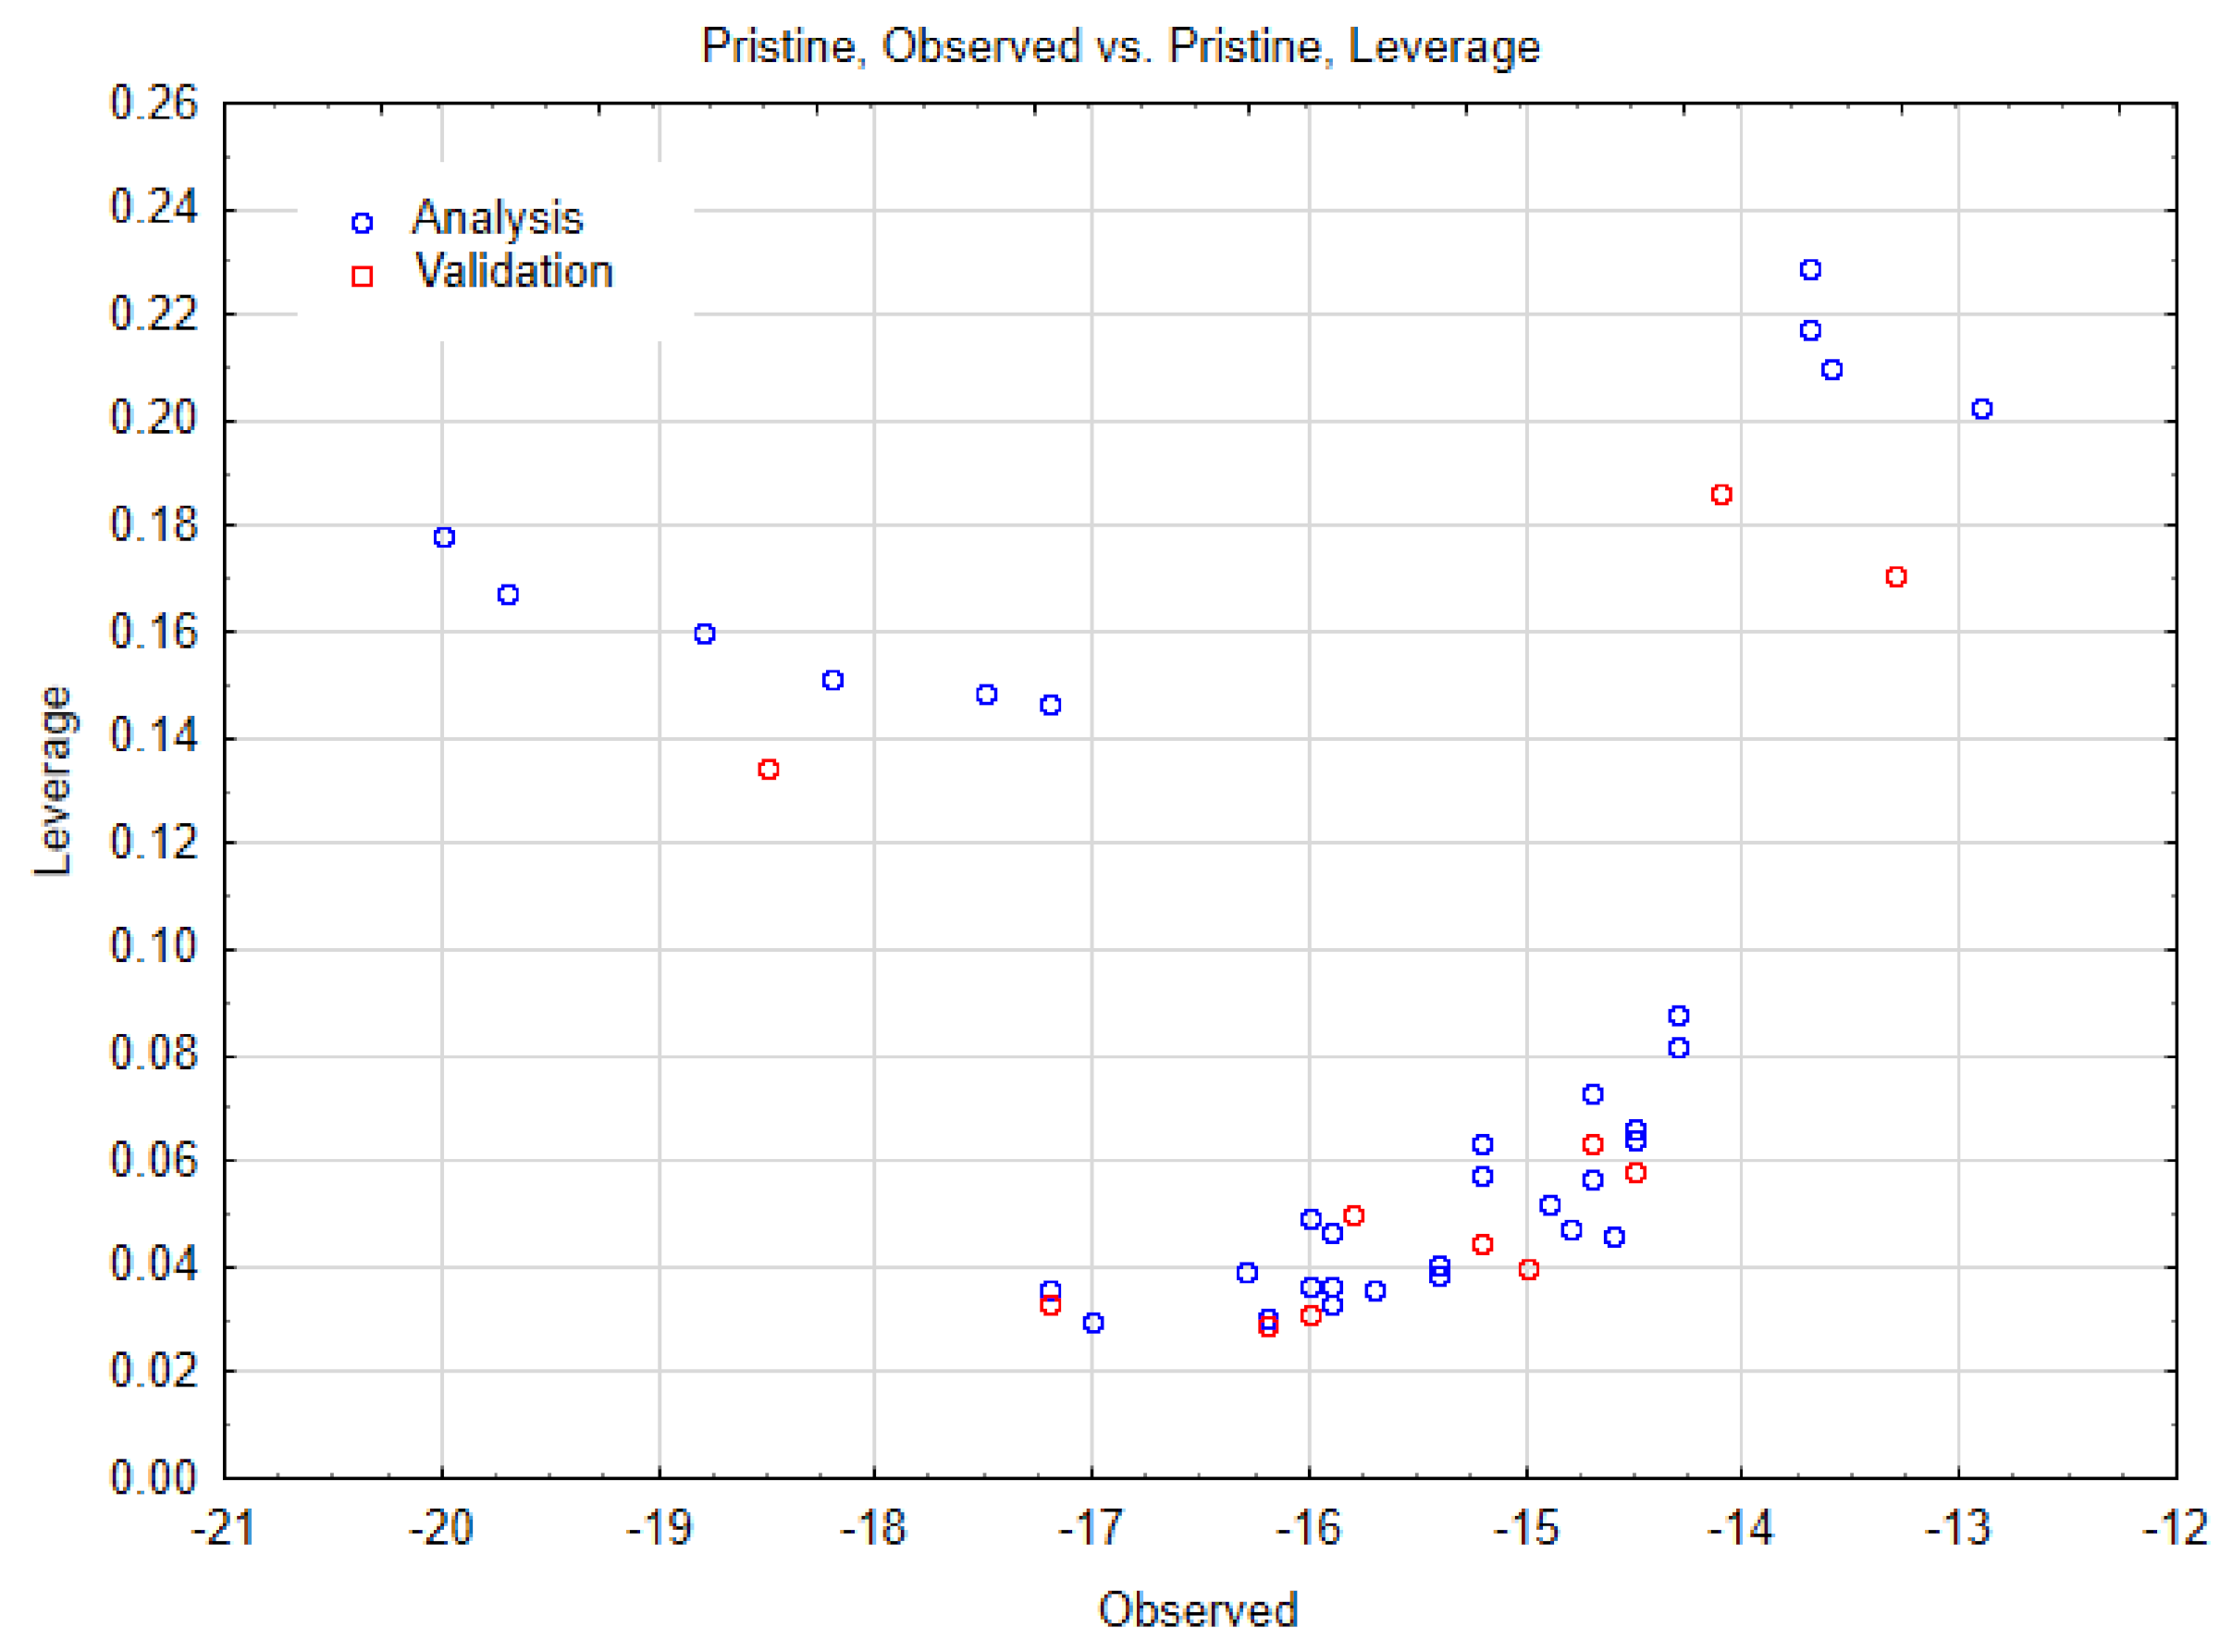
3.3. Performed Nano-QSTR Models
4. Conclusions
Supplementary Materials
Author Contributions
Funding
Institutional Review Board Statement
Informed Consent Statement
Data Availability Statement
Acknowledgments
Conflicts of Interest
References
- Fillingame, R.H.; Jiang, W.; Dmitriev, O.Y. Coupling H(+) transport to rotary catalysis in F-type ATP synthases: Structure and organization of the transmembrane rotary motor. J. Exp. Biol. 2000, 203, 9–17. [Google Scholar] [PubMed]
- Mitchell, P. Coupling of Phosphorylation to Electron and Hydrogen Transfer by a Chemi-Osmotic type of Mechanism. Nature 1961, 191, 144–148. [Google Scholar] [CrossRef]
- Bulygin, V.V.; Duncan, T.M.; Cross, R.L. Rotor/Stator interactions of the epsilon subunit in Escherichia coli ATP synthase and implications for enzyme regulation. J. Biol. Chem. 2004, 279, 35616–35621. [Google Scholar] [CrossRef] [PubMed]
- Martínez-Cano, E.; Ortiz-Genaro, G.; Pacheco-Moisés, F.; Macías-Islas, M.A.; Sánchez-Nieto, S.; Rosales-Corral, S.A. Functional disorders of FOF1-ATPase in submitochondrial particles obtained from platelets of patients with a diagnosis of probable Alzheimer’s disease. Rev. Neurol. 2005, 40, 81–85. [Google Scholar] [PubMed]
- Senior, A.E. The structure of mitochondrial ATPase. Biochim. Biophys. Acta (BBA) Rev. Bioenerg. 1973, 301, 249–277. [Google Scholar] [CrossRef]
- Seyfried, T.N.; Shelton, L.M. Cancer as a metabolic disease. Nutr. Metab. 2010, 7, 7. [Google Scholar] [CrossRef] [PubMed]
- Yang, Z.; Zhang, Y.; Yang, Y.; Sun, L.; Han, D.; Li, H.; Wang, C. Pharmacological and toxicological target organelles and safe use of single-walled carbon nanotubes as drug carriers in treating Alzheimer disease. Nanomed. Nanotechnol. Biol. Med. 2010, 6, 427–441. [Google Scholar] [CrossRef] [PubMed]
- González-Durruthy, M.; Giri, A.K.; Moreira, I.; Concu, R.; Melo, A.; Ruso, J.M.; Cordeiro, M.N.D.S. Computational modeling on mitochondrial channel nanotoxicity. Nano Today 2020, 34, 100913. [Google Scholar] [CrossRef]
- González-Durruthy, M.; Manske Nunes, S.; Ventura-Lima, J.; Gelesky, M.A.; González-Díaz, H.; Monserrat, J.M.; Concu, R.; Cordeiro, M.N.D.S. MitoTarget Modeling Using ANN-Classification Models Based on Fractal SEM Nano-Descriptors: Carbon Nanotubes as Mitochondrial F0F1-ATPase Inhibitors. J. Chem. Inf. Modeling 2019, 59, 86–97. [Google Scholar] [CrossRef]
- González-Durruthy, M.; Castro, M.; Nunes, S.M.; Ventura-Lima, J.; Alberici, L.C.; Naal, Z.; Atique-Sawazaki, D.T.; Curti, C.; Ruas, C.P.; Gelesky, M.A.; et al. QSPR/QSAR-based Perturbation Theory approach and mechanistic electrochemical assays on carbon nanotubes with optimal properties against mitochondrial Fenton reaction experimentally induced by Fe2+-overload. Carbon 2017, 115, 312–330. [Google Scholar] [CrossRef]
- Atwal, K.S.; Wang, P.; Rogers, W.L.; Sleph, P.; Monshizadegan, H.; Ferrara, F.N.; Traeger, S.; Green, D.W.; Grover, G.J. Small molecule mitochondrial F1F0 ATPase hydrolase inhibitors as cardioprotective agents. Identification of 4-(N-arylimidazole)-substituted benzopyran derivatives as selective hydrolase inhibitors. J. Med. Chem. 2004, 47, 1081–1084. [Google Scholar] [CrossRef]
- Liu, J.; Yuan, B.; Wu, X.; Li, J.; Han, F.; Dou, Y.; Chen, M.; Yang, Z.; Yang, K.; Ma, Y. Modulated enhancement in ion transport through carbon nanotubes by lipid decoration. Carbon 2017, 111, 459–466. [Google Scholar] [CrossRef]
- González-Durruthy, M.; Werhli, A.V.; Seus, V.; Machado, K.S.; Pazos, A.; Munteanu, C.R.; González-Díaz, H.; Monserrat, J.M. Decrypting Strong and Weak Single-Walled Carbon Nanotubes Interactions with Mitochondrial Voltage-Dependent Anion Channels Using Molecular Docking and Perturbation Theory. Sci. Rep. 2017, 7, 13271. [Google Scholar] [CrossRef] [PubMed]
- González-Durruthy, M.; Werhli, A.V.; Cornetet, L.; Machado, K.S.; González-Díaz, H.; Wasiliesky, W.; Ruas, C.P.; Gelesky, M.A.; Monserrat, J.M. Predicting the binding properties of single walled carbon nanotubes (SWCNT) with an ADP/ATP mitochondrial carrier using molecular docking, chemoinformatics, and nano-QSBR perturbation theory. RSC Adv. 2016, 6, 58680–58693. [Google Scholar] [CrossRef]
- Halestrap, A.P. The C Ring of the F1Fo ATP Synthase Forms the Mitochondrial Permeability Transition Pore: A Critical Appraisal. Front. Oncol. 2014, 4, 234. [Google Scholar] [CrossRef] [PubMed][Green Version]
- Alavian, K.N.; Beutner, G.; Lazrove, E.; Sacchetti, S.; Park, H.-A.; Licznerski, P.; Li, H.; Nabili, P.; Hockensmith, K.; Graham, M.; et al. An uncoupling channel within the c-subunit ring of the F1FOATP synthase is the mitochondrial permeability transition pore. Proc. Natl. Acad. Sci. USA 2014, 111, 10580–10585. [Google Scholar] [CrossRef]
- Shchepina, L.A.; Pletjushkina, O.Y.; Avetisyan, A.V.; Bakeeva, L.E.; Fetisova, E.K.; Izyumov, D.S.; Saprunova, V.B.; Vyssokikh, M.Y.; Chernyak, B.V.; Skulachev, V.P. Oligomycin, inhibitor of the F0 part of H+-ATP-synthase, suppresses the TNF-induced apoptosis. Oncogene 2002, 21, 8149–8157. [Google Scholar] [CrossRef] [PubMed]
- Ponnalagu, D.; Singh, H. Insights into the Role of Mitochondrial Ion Channels in Inflammatory Response. Front. Physiol. 2020, 11, 258. [Google Scholar] [CrossRef]
- Missiroli, S.; Patergnani, S.; Caroccia, N.; Pedriali, G.; Perrone, M.; Previati, M.; Wieckowski, M.R.; Giorgi, C. Mitochondria-associated membranes (MAMs) and inflammation. Cell Death Dis. 2018, 9, 329. [Google Scholar] [CrossRef]
- Trott, O.; Olson, A.J. AutoDock Vina: Improving the speed and accuracy of docking with a new scoring function, efficient optimization, and multithreading. J. Comput. Chem. 2010, 31, 455–461. [Google Scholar] [CrossRef] [PubMed]
- Forli, S.; Huey, R.; Pique, M.E.; Sanner, M.F.; Goodsell, D.S.; Olson, A.J. Computational protein-ligand docking and virtual drug screening with the AutoDock suite. Nat. Protoc. 2016, 11, 905–919. [Google Scholar] [CrossRef]
- Lavecchia, A. Machine-learning approaches in drug discovery: Methods and applications. Drug Discov. Today 2015, 20, 318–331. [Google Scholar] [CrossRef]
- Chennubhotla, C.; Bahar, I. Signal Propagation in Proteins and Relation to Equilibrium Fluctuations. PLoS Comput. Biol. 2007, 3, e172. [Google Scholar]
- Li, H.; Chen, S.; Zhao, H. Fractal structure and conformational entropy of protein chain. Int. J. Biol. Macromol. 1990, 12, 374–378. [Google Scholar] [CrossRef]
- Weng, G.; Bhalla, U.S.; Iyengar, R. Complexity in biological signaling systems. Science 1999, 284, 92–96. [Google Scholar] [CrossRef]
- Lezon, T.; Shrivastava, I.; Yang, Z.; Bahar, I. Chapter 7 Elastic Network Models for Biomolecular Dynamics: Theory and Application to Membrane Proteins and Viruses. In Hanbook on Biological Networks; World Scientific Publishing: Singapore, 2009. [Google Scholar]
- Riccardi, D.; Cui, Q.; Phillips, G.N., Jr. Application of elastic network models to proteins in the crystalline state. Biophys. J. 2009, 96, 464–475. [Google Scholar] [CrossRef] [PubMed]
- Flechsig, H.; Togashi, Y. Designed Elastic Networks: Models of Complex Protein Machinery. Int. J. Mol. Sci. 2018, 19, 3152. [Google Scholar] [CrossRef] [PubMed]
- Atwal, K.S.; Ahmad, S.; Ding, C.Z.; Stein, P.D.; Lloyd, J.; Hamann, L.G.; Green, D.W.; Ferrara, F.N.; Wang, P.; Rogers, W.L.; et al. N-[1-Aryl-2-(1-imidazolo)ethyl]-guanidine derivatives as potent inhibitors of the bovine mitochondrial F1F0 ATP hydrolase. Bioorg. Med. Chem. Lett. 2004, 14, 1027–1030. [Google Scholar] [CrossRef]
- Zhang, S.; Golbraikh, A.; Tropsha, A. Development of Quantitative Structure−Binding Affinity Relationship Models Based on Novel Geometrical Chemical Descriptors of the Protein−Ligand Interfaces. J. Med. Chem. 2006, 49, 2713–2724. [Google Scholar] [CrossRef] [PubMed]
- Burello, E.; Worth, A.P. QSAR modeling of nanomaterials. Wiley Interdiscip. Rev. Nanomed. Nanobiotechnol. 2011, 3, 298–306. [Google Scholar] [CrossRef] [PubMed]
- Fourches, D.; Pu, D.; Tassa, C.; Weissleder, R.; Shaw, S.Y.; Mumper, R.J.; Tropsha, A. Quantitative Nanostructure−Activity Relationship Modeling. ACS Nano 2010, 4, 5703–5712. [Google Scholar] [CrossRef]
- Buglak, A.A.; Zherdev, A.V.; Dzantiev, B.B. Nano-(Q)SAR for Cytotoxicity Prediction of Engineered Nanomaterials. Molecules 2019, 24, 4537. [Google Scholar] [CrossRef] [PubMed]
- Basant, N.; Gupta, S. Multi-target QSTR modeling for simultaneous prediction of multiple toxicity endpoints of nano-metal oxides. Nanotoxicology 2017, 11, 339–350. [Google Scholar] [CrossRef]
- Concu, R.; Kleandrova, V.V.; Speck-Planche, A.; Cordeiro, M. Probing the toxicity of nanoparticles: A unified in silico machine learning model based on perturbation theory. Nanotoxicology 2017, 11, 891–906. [Google Scholar] [CrossRef] [PubMed]
- Ahmadi, S. Mathematical modeling of cytotoxicity of metal oxide nanoparticles using the index of ideality correlation criteria. Chemosphere 2020, 242, 125192. [Google Scholar] [CrossRef]
- Mu, Y.; Wu, F.; Zhao, Q.; Ji, R.; Qie, Y.; Zhou, Y.; Hu, Y.; Pang, C.; Hristozov, D.; Giesy, J.P.; et al. Predicting toxic potencies of metal oxide nanoparticles by means of nano-QSARs. Nanotoxicology 2016, 10, 1207–1214. [Google Scholar] [CrossRef]
- Toropova, A.P.; Toropov, A.A.; Veselinovic, A.M.; Veselinovic, J.B.; Benfenati, E.; Leszczynska, D.; Leszczynski, J. Nano-QSAR: Model of mutagenicity of fullerene as a mathematical function of different conditions. Ecotoxicol. Environ. Saf. 2016, 124, 32–36. [Google Scholar] [CrossRef]
- Toropov, A.A.; Toropova, A.P. Quasi-SMILES and nano-QFAR: United model for mutagenicity of fullerene and MWCNT under different conditions. Chemosphere 2015, 139, 18–22. [Google Scholar] [CrossRef]
- Toropova, A.P.; Toropov, A.A. Mutagenicity: QSAR—Quasi-QSAR—Nano-QSAR. Mini Rev. Med. Chem. 2015, 15, 608–621. [Google Scholar] [CrossRef]
- Toropova, A.P.; Toropov, A.A.; Benfenati, E.; Korenstein, R.; Leszczynska, D.; Leszczynski, J. Optimal nano-descriptors as translators of eclectic data into prediction of the cell membrane damage by means of nano metal-oxides. Environ. Sci. Pollut. Res. Int. 2015, 22, 745–757. [Google Scholar] [CrossRef] [PubMed]
- Liu, R.; Rallo, R.; Weissleder, R.; Tassa, C.; Shaw, S.; Cohen, Y. Nano-SAR development for bioactivity of nanoparticles with considerations of decision boundaries. Small 2013, 9, 1842–1852. [Google Scholar] [CrossRef] [PubMed]
- Tantra, R.; Oksel, C.; Puzyn, T.; Wang, J.; Robinson, K.N.; Wang, X.Z.; Ma, C.Y.; Wilkins, T. Nano(Q)SAR: Challenges, pitfalls and perspectives. Nanotoxicology 2015, 9, 636–642. [Google Scholar] [CrossRef]
- Argese, E.; Bettiol, C.; Giurin, G.; Miana, P. Quantitative structure—Activity relationships for the toxicity of chlorophenols to mammalian submitochondrial particles. Chemosphere 1999, 38, 2281–2292. [Google Scholar] [CrossRef]
- Ferguson, S.J.; Sorgato, M.C. The phosphorylation potential generated by respiring bovine heart submitochondrial particles. Biochem. J. 1977, 168, 299–303. [Google Scholar] [CrossRef] [PubMed]
- Argese, E.; Bettiol, C.; Ghelli, A.; Todeschini, R.; Miana, P. Submitochondrial particles as toxicity biosensors of chlorophenols. Environ. Toxicol. Chem. Int. J. 1995, 14, 363–368. [Google Scholar] [CrossRef]
- Sorgato, M.C.; Branca, D.; Ferguson, S.J. The rate of ATP synthesis by submitochondrial particles can be independent of the magnitude of the protonmotive force. Biochem. J. 1980, 188, 945–948. [Google Scholar] [CrossRef]
- Bergin, S.; Sun, Z.; Streich, P.; Hamilton, J.; Coleman, J. New Solvents for Nanotubes: Approaching the Dispersibility of Surfactants. J. Phys. Chem. C 2010, 114, 231–237. [Google Scholar] [CrossRef]
- Pedersen, P.L.; Greenawalt, J.W.; Reynafarje, B.; Hullihen, J.; Decker, G.L.; Soper, J.W.; Bustamente, E. Preparation and characterization of mitochondria and submitochondrial particles of rat liver and liver-derived tissues. Methods Cell Biol. 1978, 20, 411–481. [Google Scholar] [PubMed]
- Starkov, A.A. Measurement of mitochondrial ROS production. Methods Mol. Biol. 2010, 648, 245–255. [Google Scholar]
- Berman, H.M.; Westbrook, J.; Feng, Z.; Gilliland, G.; Bhat, T.N.; Weissig, H.; Shindyalov, I.N.; Bourne, P.E. The Protein Data Bank. Nucleic Acids Res. 2000, 28, 235–242. [Google Scholar] [CrossRef] [PubMed]
- Feinstein, W.P.; Brylinski, M. Calculating an optimal box size for ligand docking and virtual screening against experimental and predicted binding pockets. J. Cheminform. 2015, 7, 18. [Google Scholar] [CrossRef]
- Oliwa, T.; Shen, Y. cNMA: A framework of encounter complex-based normal mode analysis to model conformational changes in protein interactions. Bioinformatics 2015, 31, i151–i160. [Google Scholar] [CrossRef]
- Talete srl, K. Dragon (Software for Molecular Descriptor Calculation); 7.0.10; Talete SRL: Milan, Italy, 2017. [Google Scholar]
- González-Durruthy, M.; Scanavachi, G.; Rial, R.; Liu, Z.; Cordeiro, M.N.D.S.; Itri, R.; Ruso, J.M. Mapping the underlying mechanisms of fibrinogen benzothiazole drug interactions using computational and experimental approaches. Int. J. Biol. Macromol. 2020, 163, 730–744. [Google Scholar] [CrossRef]
- OECD Principles for the Validation, for Regulatory Porposes of (Quantitative) Structure Activity Relationship Model. Available online: https://www.oecd.org/chemicalsafety/risk-assessment/37849783.pdf (accessed on 13 March 2020).


| SWCNT-Pristine (n, m) | Data Observed | Data Predicted | Data Residuals | Cross-Validation (a,b) |
|---|---|---|---|---|
| amchair 3.3 | −20.00000 | −18.93350 | −1.06650 | training |
| amchair 4.4 | −19.70000 | −18.83954 | −0.86046 | training |
| amchair 5.5 | −18.80000 | −18.77444 | −0.02556 | training |
| amchair 6.6 | −18.50000 | −18.72592 | 0.22592 | validation |
| amchair 7.7 | −18.20000 | −18.68908 | 0.48908 | training |
| amchair 8.8 | −17.50000 | −18.66083 | 1.16083 | training |
| amchair 9.9 | −17.20000 | −18.63872 | 1.43872 | training |
| chiral 3.2 | −17.20000 | −16.28865 | −0.91135 | validation |
| chiral 4.1 | −17.20000 | −15.58908 | −1.61092 | training |
| chiral 4.2 | −17.00000 | −15.84427 | −1.15573 | training |
| chiral 4.3 | −16.30000 | −15.96788 | −0.33212 | training |
| chiral 5.1 | −16.20000 | −15.56891 | −0.63109 | validation |
| chiral 5.2 | −16.20000 | −15.44925 | −0.75075 | training |
| chiral 5.3 | −16.00000 | −15.63349 | −0.36651 | training |
| chiral 5.4 | −16.00000 | −15.72809 | −0.27191 | training |
| chiral 6.1 | −16.00000 | −15.26864 | −0.73136 | validation |
| chiral 6.2 | −15.90000 | −15.19863 | −0.70137 | training |
| chiral 6.3 | −15.90000 | −15.37446 | −0.52554 | training |
| chiral 6.4 | −15.90000 | −15.47126 | −0.42874 | training |
| chiral 6.5 | −15.80000 | −15.39773 | −0.40227 | validation |
| chiral 7.1 | −15.70000 | −15.02346 | −0.67654 | training |
| chiral 7.2 | −15.40000 | −15.17288 | −0.22712 | training |
| chiral 7.3 | −15.40000 | −15.10112 | −0.29888 | training |
| chiral 7.4 | −15.20000 | −15.24345 | 0.04345 | validation |
| chiral 7.5 | −15.20000 | −15.34078 | 0.14078 | training |
| chiral 7.6 | −15.20000 | −15.28875 | 0.08875 | training |
| chiral 8.1 | −15.00000 | −15.03210 | 0.03210 | training |
| chiral 8.2 | −15.00000 | −14.77537 | −0.22463 | validation |
| chiral 8.3 | −14.90000 | −15.23422 | 0.33422 | training |
| chiral 8.4 | −14.80000 | −15.08583 | 0.28583 | training |
| chiral 8.5 | −14.70000 | −15.15833 | 0.45833 | training |
| chiral 8.6 | −14.70000 | −15.24567 | 0.54567 | validation |
| chiral 8.7 | −14.70000 | −15.20136 | 0.50136 | training |
| chiral 9.3 | −14.60000 | −14.79209 | 0.19209 | training |
| chiral 9.4 | −14.50000 | −15.12489 | 0.62489 | training |
| chiral 9.5 | −14.50000 | −15.11612 | 0.61612 | validation |
| chiral 9.6 | −14.50000 | −15.09848 | 0.59848 | training |
| chiral 9.7 | −14.30000 | −15.29203 | 0.99203 | training |
| zigzag 3.0 | −14.30000 | −15.37860 | 1.07860 | training |
| zigzag 4.0 | −14.10000 | −14.00654 | −0.09346 | validation |
| zigzag 5.0 | −13.70000 | −14.00654 | 0.30654 | training |
| zigzag 6.0 | −13.70000 | −13.79221 | 0.09221 | training |
| zigzag 7.0 | −13.60000 | −13.62087 | 0.02087 | training |
| zigzag 8.0 | −13.30000 | −13.48024 | 0.18024 | validation |
| zigzag 9.0 | −12.90000 | −13.36294 | 0.46294 | training |
| Statistical Parameters | Value |
|---|---|
| Multiple R | 0.911445 |
| Multiple R² | 0.830731 |
| Adjusted R² | 0.819811 |
| Sum of squares Model | 77.70196 |
| Degrees of freedom Model | 2 |
| Mean squared errors Model | 38.85098 |
| Sum of squares Residual | 15.83245 |
| Degrees of freedom Residual | 31 |
| Mean squared errors Residual | 0.510724 |
| F | 76.07035 |
| P | 0 |
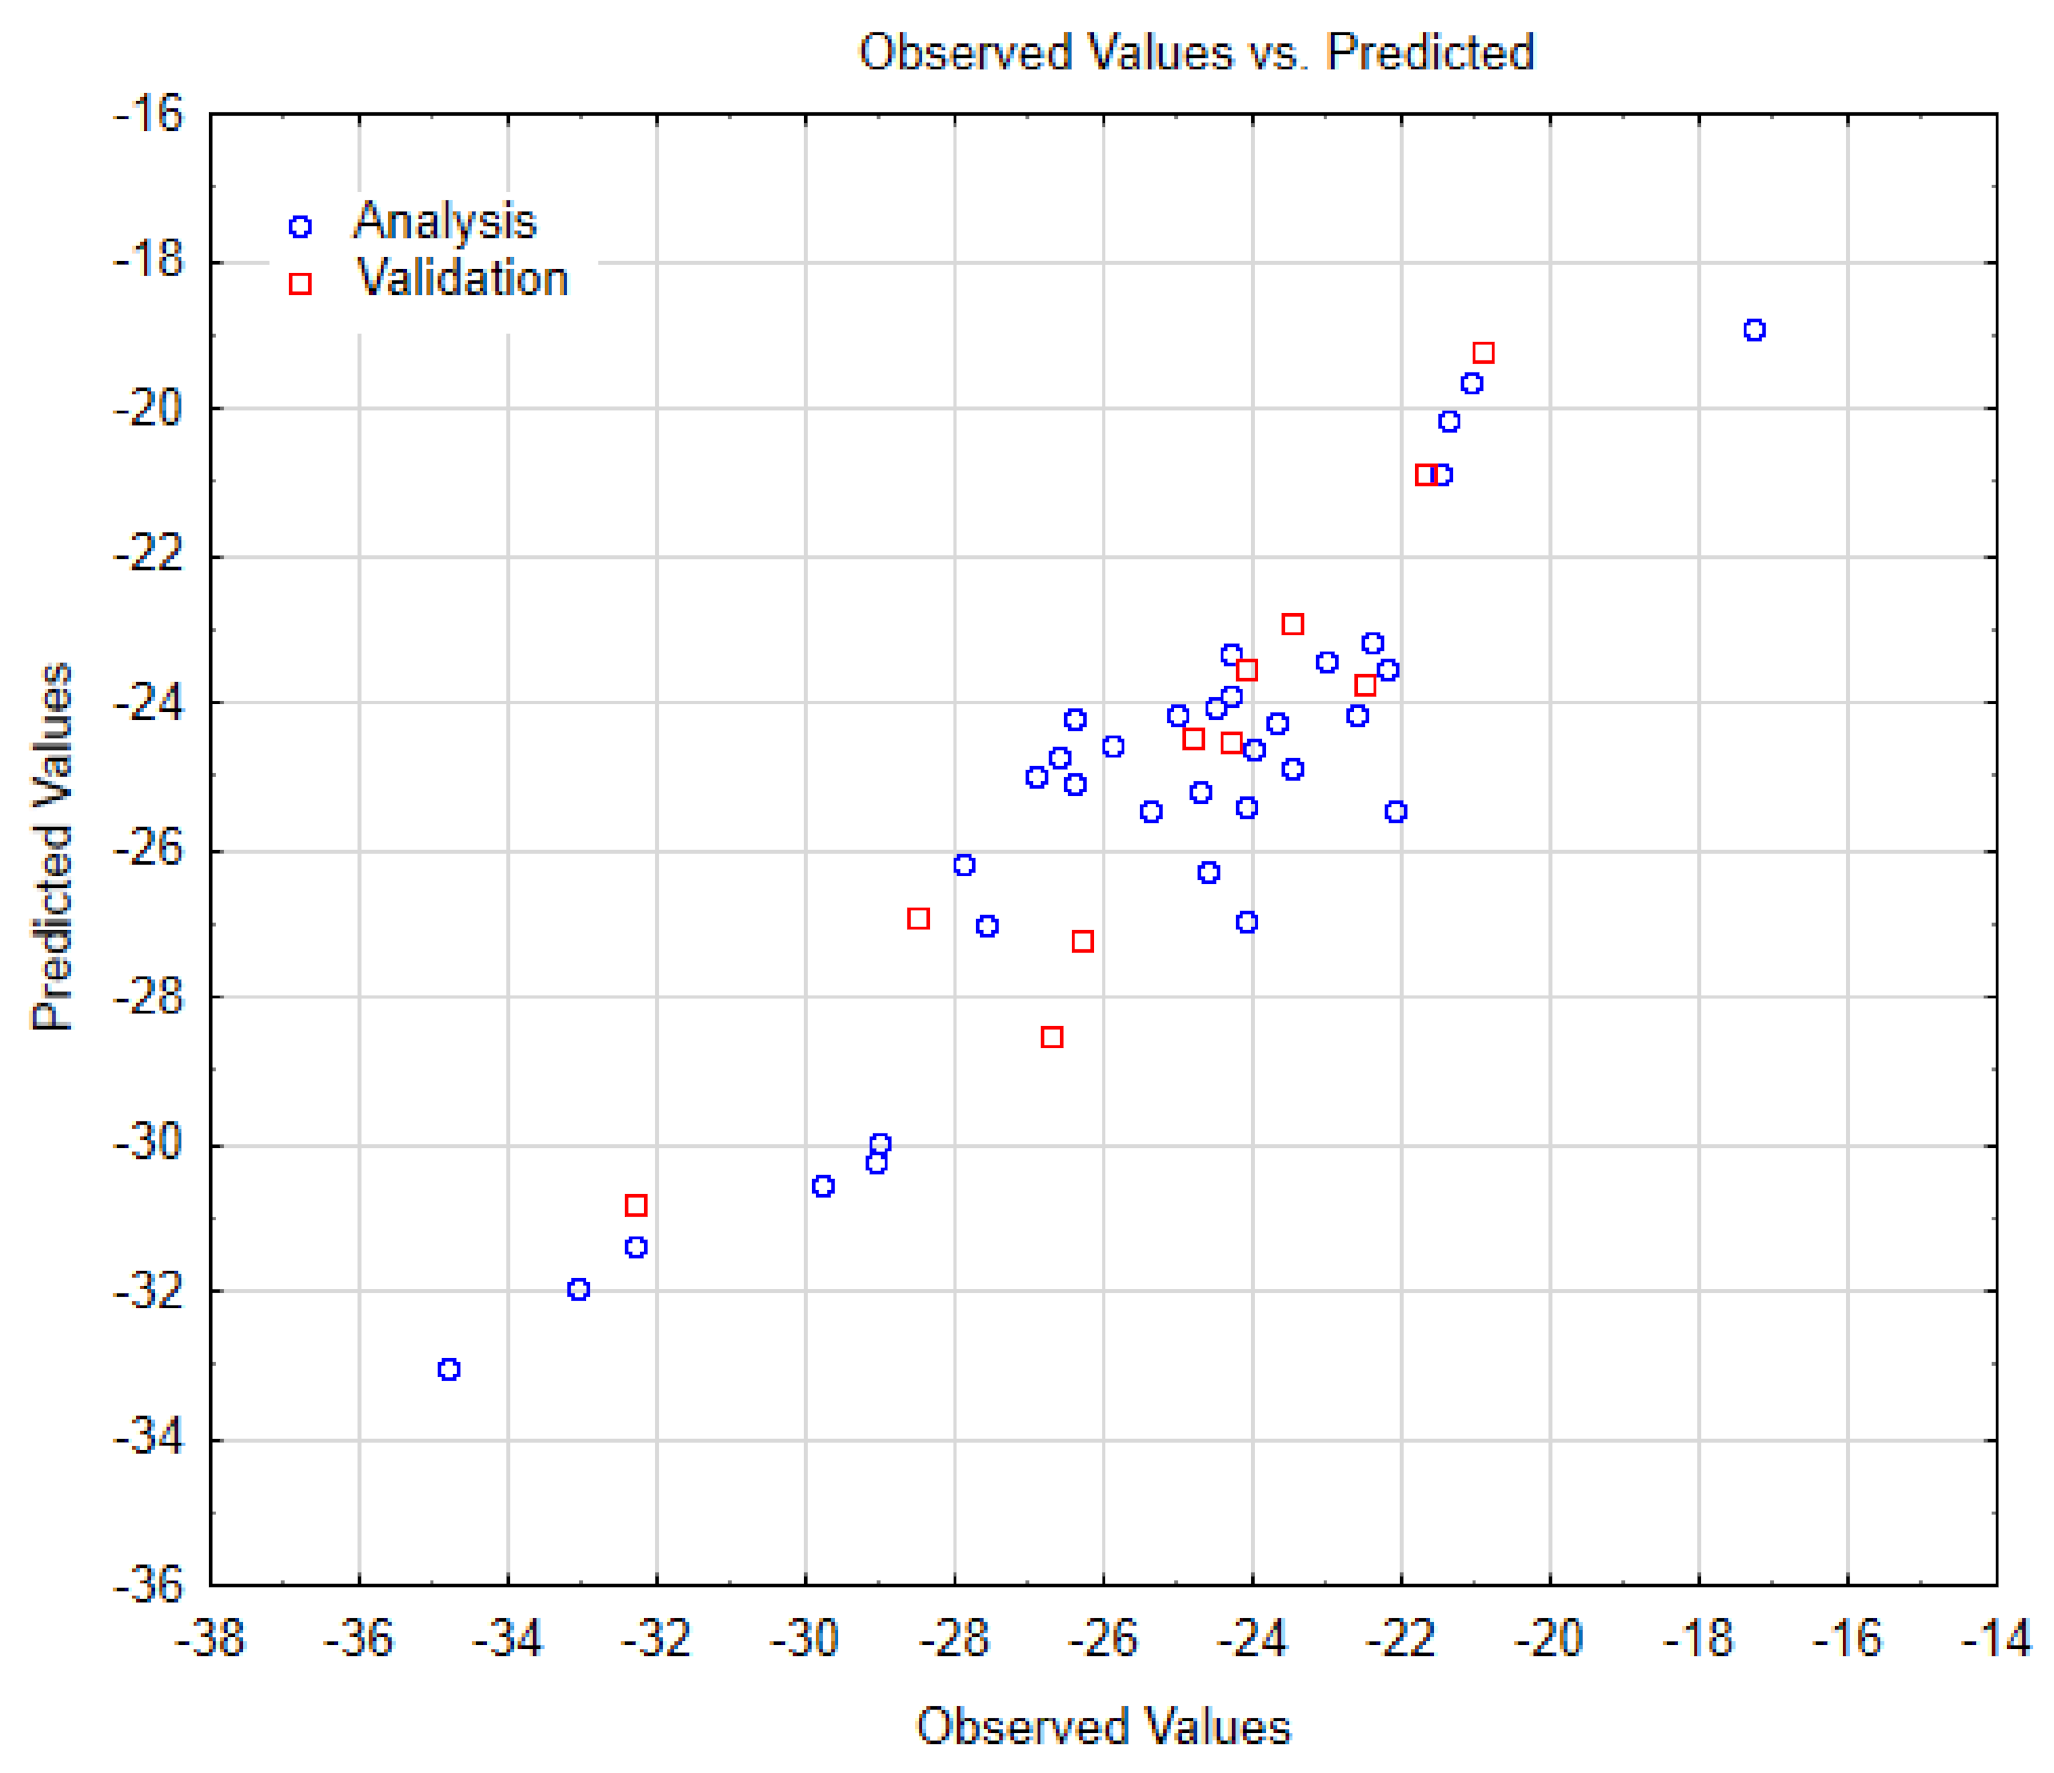
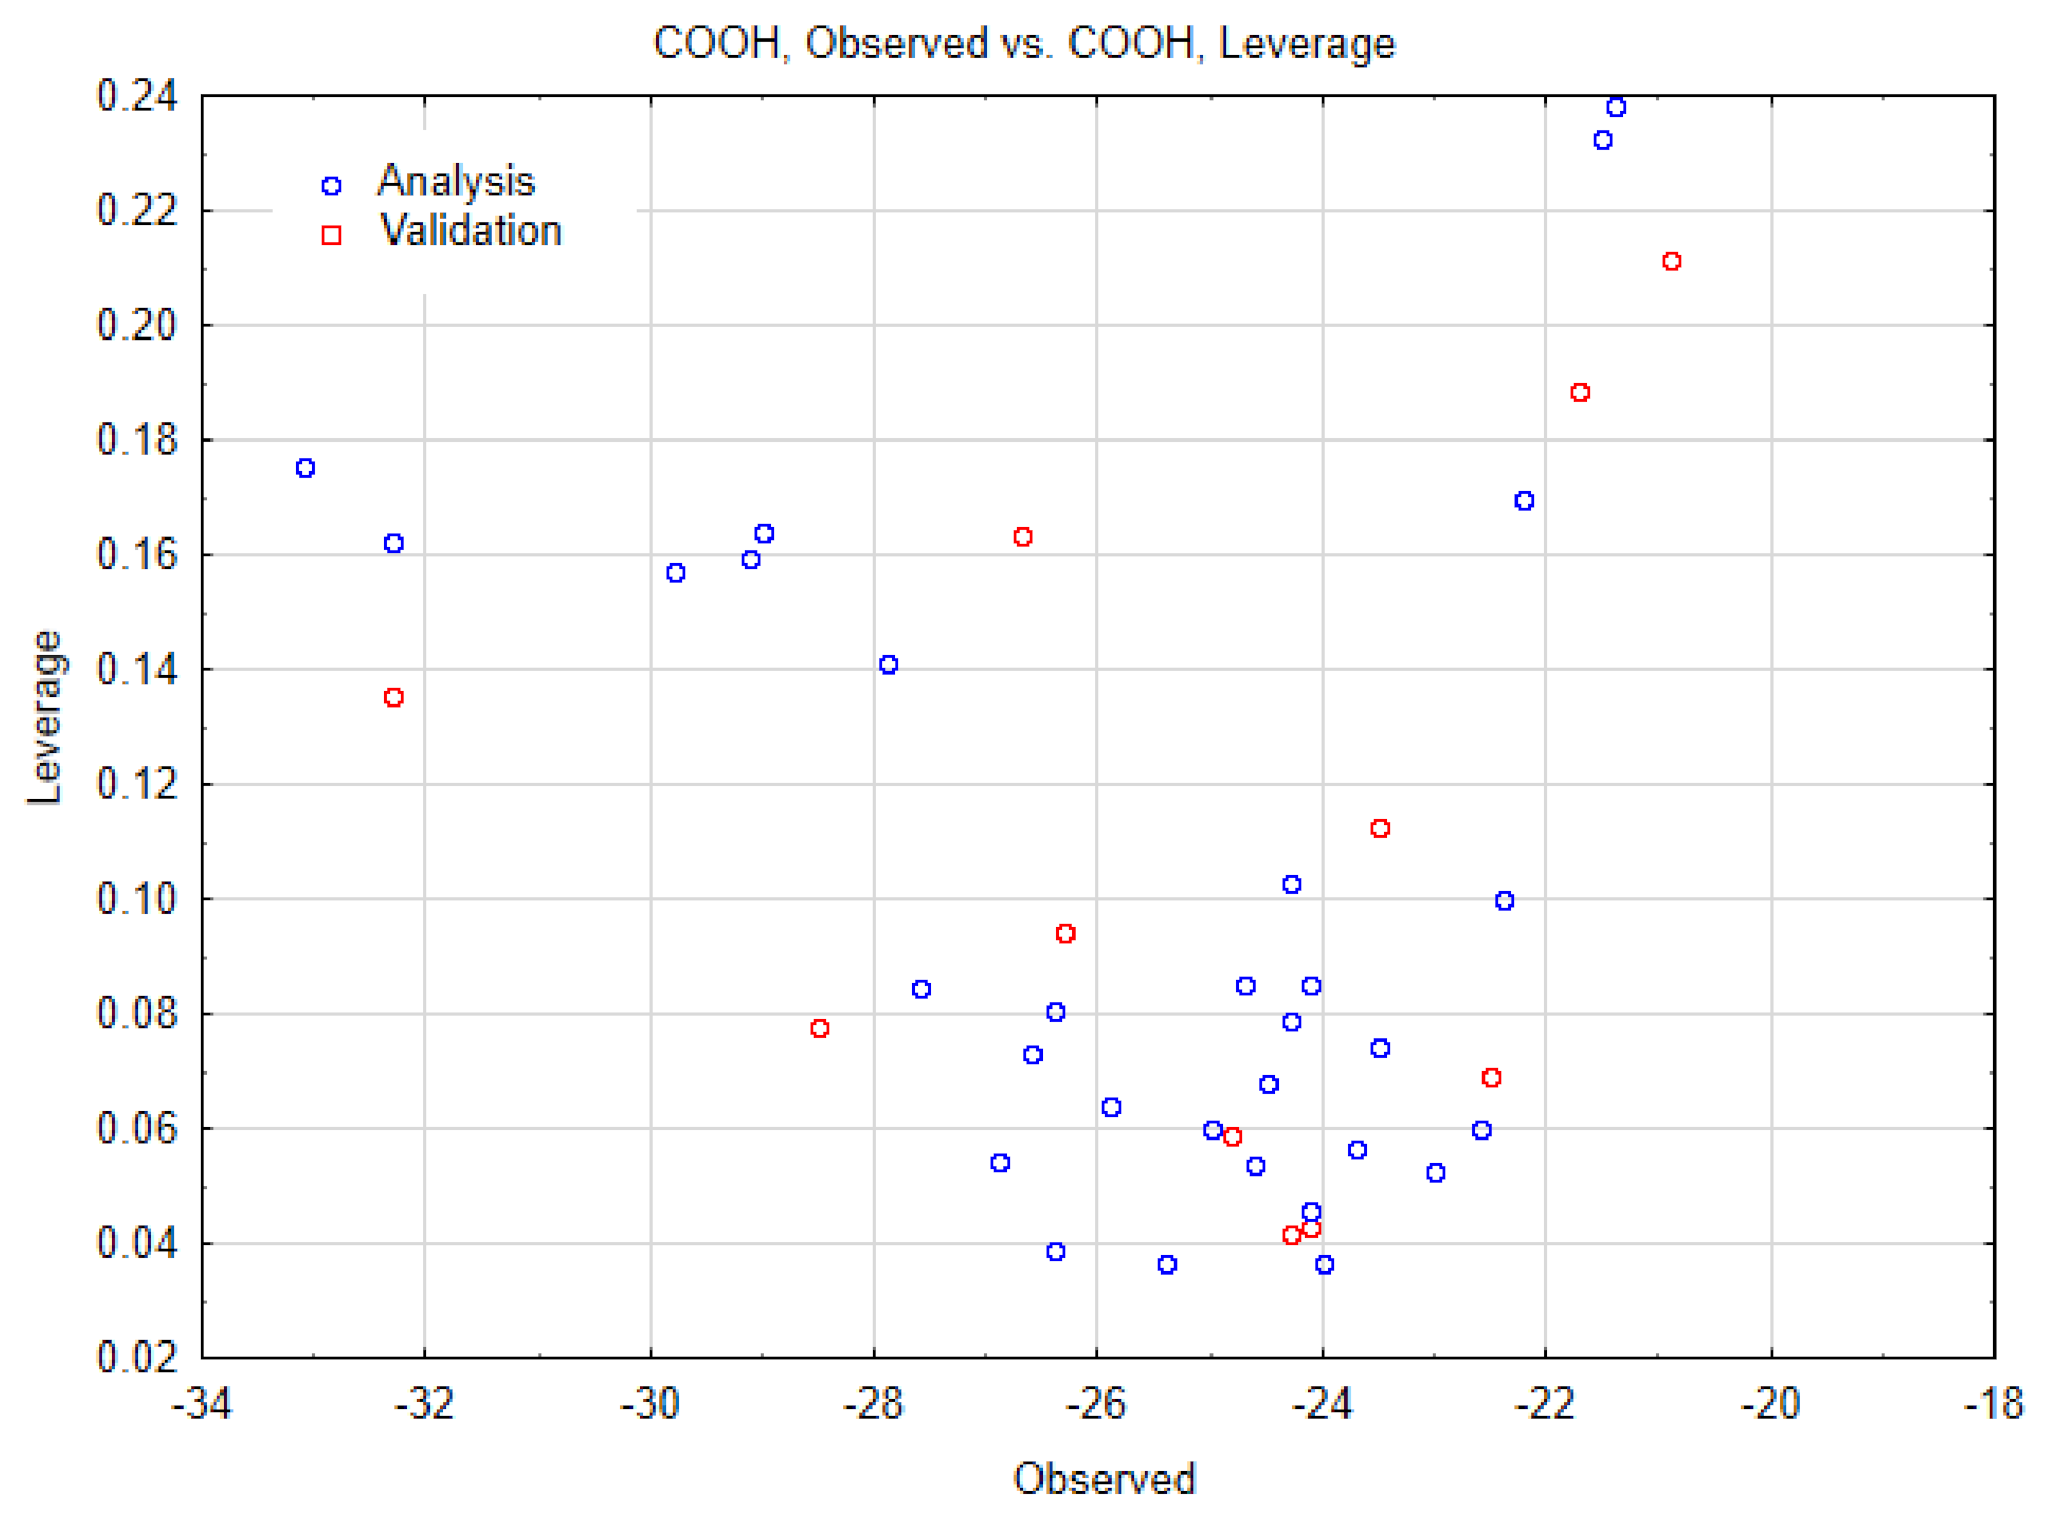
| SWCNT-COOH (n, m) | Data Observed | Data Predicted | Data Residuals | Cross-Validation (a,b) |
|---|---|---|---|---|
| amchair 3.3 | −34.80000 | −33.04305 | −1.75695 | training |
| amchair 4.4 | −33.10000 | −31.92664 | −1.17336 | training |
| amchair 5.5 | −32.30000 | −31.36844 | −0.93156 | training |
| amchair 6.6 | −32.30000 | −30.81023 | −1.48977 | validation |
| amchair 7.7 | −29.80000 | −30.53113 | 0.73113 | training |
| amchair 8.8 | −29.10000 | −30.25203 | 1.15203 | training |
| amchair 9.9 | −29.00000 | −29.97293 | 0.97293 | training |
| chiral 3.2 | −28.50000 | −26.92826 | −1.57174 | validation |
| chiral 4.1 | −27.90000 | −26.16358 | −1.73642 | training |
| chiral 4.2 | −27.60000 | −27.01059 | −0.58941 | training |
| chiral 4.3 | −26.90000 | −25.00316 | −1.89684 | training |
| chiral 5.1 | −26.70000 | −28.51704 | 1.81704 | validation |
| chiral 5.2 | −26.60000 | −24.71436 | −1.88564 | training |
| chiral 5.3 | −26.40000 | −25.08549 | −1.31451 | training |
| chiral 5.4 | −26.40000 | −24.19447 | −2.20553 | training |
| chiral 6.1 | −26.30000 | −27.20385 | 0.90385 | validation |
| chiral 6.2 | −25.90000 | −24.54620 | −1.35380 | training |
| chiral 6.3 | −25.40000 | −25.47553 | 0.07553 | training |
| chiral 6.4 | −25.00000 | −24.13724 | −0.86276 | training |
| chiral 6.5 | −24.80000 | −24.44496 | −0.35504 | validation |
| chiral 7.1 | −24.70000 | −25.21534 | 0.51534 | training |
| chiral 7.2 | −24.60000 | −26.28422 | 1.68422 | training |
| chiral 7.3 | −24.50000 | −24.04522 | −0.45478 | training |
| chiral 7.4 | −24.30000 | −24.52728 | 0.22728 | validation |
| chiral 7.5 | −24.30000 | −23.88676 | −0.41324 | training |
| chiral 7.6 | −24.30000 | −23.32855 | −0.97145 | training |
| chiral 8.1 | −24.10000 | −26.95336 | 2.85336 | training |
| chiral 8.2 | −24.10000 | −23.51211 | −0.58789 | validation |
| chiral 8.3 | −24.10000 | −25.39320 | 1.29320 | training |
| chiral 8.4 | −24.00000 | −24.63822 | 0.63822 | training |
| chiral 8.5 | −23.70000 | −24.27680 | 0.57680 | training |
| chiral 8.6 | −23.50000 | −22.90990 | −0.59010 | validation |
| chiral 8.7 | −23.50000 | −24.89841 | 1.39841 | training |
| chiral 9.3 | −23.00000 | −23.42979 | 0.42979 | training |
| chiral 9.4 | −22.60000 | −24.13724 | 1.53724 | training |
| chiral 9.5 | −22.50000 | −23.71859 | 1.21859 | validation |
| chiral 9.6 | −22.40000 | −23.16039 | 0.76039 | training |
| chiral 9.7 | −22.20000 | −23.53151 | 1.33151 | training |
| zigzag 3.0 | −22.10000 | −25.42752 | 3.32752 | training |
| zigzag 4.0 | −21.70000 | −20.86901 | −0.83099 | validation |
| zigzag 5.0 | −21.50000 | −20.86901 | −0.63099 | training |
| zigzag 6.0 | −21.40000 | −20.17126 | −1.22874 | training |
| zigzag 7.0 | −21.10000 | −19.61305 | −1.48695 | training |
| zigzag 8.0 | −20.90000 | −19.19440 | −1.70560 | validation |
| zigzag 9.0 | −17.30000 | −18.91530 | 1.61530 | training |
| Statistical Parameters | Value |
|---|---|
| Multiple R | 0.918915 |
| Multiple R² | 0.844404 |
| Adjusted R² | 0.828845 |
| Sum of squares Model | 366.1187 |
| Degrees of freedom Model | 3 |
| Mean squared errors Model | 122.0396 |
| Sum of squares Residual | 67.46364 |
| Degrees of freedom Residual | 30 |
| Mean squared errors Residual | 2.248788 |
| F | 54.26905 |
| p | 0.000000 |
Publisher’s Note: MDPI stays neutral with regard to jurisdictional claims in published maps and institutional affiliations. |
© 2021 by the authors. Licensee MDPI, Basel, Switzerland. This article is an open access article distributed under the terms and conditions of the Creative Commons Attribution (CC BY) license (http://creativecommons.org/licenses/by/4.0/).
Share and Cite
González-Durruthy, M.; Concu, R.; Ruso, J.M.; Cordeiro, M.N.D.S. New Mechanistic Insights on Carbon Nanotubes’ Nanotoxicity Using Isolated Submitochondrial Particles, Molecular Docking, and Nano-QSTR Approaches. Biology 2021, 10, 171. https://doi.org/10.3390/biology10030171
González-Durruthy M, Concu R, Ruso JM, Cordeiro MNDS. New Mechanistic Insights on Carbon Nanotubes’ Nanotoxicity Using Isolated Submitochondrial Particles, Molecular Docking, and Nano-QSTR Approaches. Biology. 2021; 10(3):171. https://doi.org/10.3390/biology10030171
Chicago/Turabian StyleGonzález-Durruthy, Michael, Riccardo Concu, Juan M. Ruso, and M. Natália D. S. Cordeiro. 2021. "New Mechanistic Insights on Carbon Nanotubes’ Nanotoxicity Using Isolated Submitochondrial Particles, Molecular Docking, and Nano-QSTR Approaches" Biology 10, no. 3: 171. https://doi.org/10.3390/biology10030171
APA StyleGonzález-Durruthy, M., Concu, R., Ruso, J. M., & Cordeiro, M. N. D. S. (2021). New Mechanistic Insights on Carbon Nanotubes’ Nanotoxicity Using Isolated Submitochondrial Particles, Molecular Docking, and Nano-QSTR Approaches. Biology, 10(3), 171. https://doi.org/10.3390/biology10030171