1. Introduction
In addition to their recognized biotechnological potential [
1,
2,
3], microalgae represent a unique group of unicellular organisms for the investigation of cell-cycle patterns. Some microalgae divide through binary fission, in which one cell divides into two cells, while others divide through multiple fission, in which a cell can produce up to several thousand daughter cells [
4], however, in some cases, both binary and multiple fission can be executed in response to changes in ambient conditions or life cycle phase (reviewed by Bišová and Zachleder, 2014) [
4].
The cell-cycle can be described as a sequence of events reoccurring in each cell leading to the production of daughter cells [
5,
6,
7]. This perception has been offered as a better way to understand the multiple fission cell-cycle [
4]. Mitchison [
8] suggested that the cell-cycle can be presented as a sequence composed of two coordinated processes. The first is the G1 phase in which the cell grows in size, and the second is the DNA replication–division sequence (DNArds), in which the cells undergo S, G2, M, and C phases. The S, G2, M, and C phases represent DNA synthesis for replication, second growth phase, nuclear division through meiosis and daughter cell formation through cytokinesis, respectively. It is important to note that several G1 phases and DNArds can be conducted and can partly overlap during one cell-cycle. After approximately doubling in cell size (during the G1 phase), a commitment point (CP, commitment to divide) is attained and thereafter DNArds can be executed in the dark [
4]. The mechanism/s by which the doubling in size is verified is not clear yet, though three models were proposed (for more details see [
9]).
Two distinct patterns of multiple fission cell-cycle have been described [
4]. The first is the consecutive pattern, characteristic to
Scenedesmus and
Desmodesmus, under which DNA replication and nuclear division are executed shortly after the attainment of CP; if several CPs were attained during one cell-cycle then several sessions of DNArds would occur in a consecutive pattern. Hence, the cell-cycle of microalgae expressing the consecutive pattern of multiple fission would include polynuclear cells (PNC). The second pattern is the clustered pattern of multiple fission cell-cycle typical to
Chlamydomonas reinhardtii. In this type of multiple fission, nuclear division occurs soon after DNA replication and is immediately followed by cell division; consequently, it does not include polynuclear stages [
10].
In microalgae capable of multiple fission, when conditions allow cells to grow and double in size, a number of CPs can be attained during one cell-cycle that will terminate in an equal number of DNArds [
4]. Therefore, the number of daughter cells will be equal to 2 in the order of the number of CPs attained. In theory, this type of cell-cycle allows the illuminated period to be dedicated to photo-assimilation, anabolic processes, and growth, while cell divisions and the underlying processes facilitating them are postponed to the dark period, not to interfere with growth, and are protected from the harmful effects of solar radiation. Therefore, the multiple fission cell-cycle tends to spontaneously synchronize the growth (G1) and the division processes (DNArds) with the available illumination regime [
4,
11].
The multiple-fission cell-cycle is the main reproduction strategy of many green algae, including the genera
Desmodesmus,
Chlorella,
Chlamydomonas,
Scenedesmus and
Chromochloris. Environmentally responsible and profitable microalgal biotechnology would utilize solar irradiance, therefore, a worthwhile attempt to produce biocommodities from microalgae would inevitably include a light/dark synchronized population that divides through one of the above-mentioned patterns of multiple fission. As cell-cycle events directly affect major culture parameters, including cell size, cell density and amount of storage compounds [
4,
11,
12], cell-cycle characterization is of central importance for microalgae-based biotechnology.
Chromochloris zofingiensis ((Dönz) Fučíková K. et Lewis L.A.) stands out among the biotechnologically-interesting microalgae, as an alternative microalgal source of the high value pigment astaxanthin, since it can grow to high biomass densities through phototrophic, heterotrophic, or mixotrophic cultivation modes [
13]. In addition,
C. zofingiensis can tolerate media based on low-quality water and produce valuable biocommodities, such as lipids, starch, and the carotenoid pigments lutein, canthaxanthin, and astaxanthin [
14,
15,
16,
17,
18]. Recently, the chromosome-level assembly of the genome [
19] and time-resolved carotenoid profiling and transcriptomic analysis for
C. zofingiensis were published [
20,
21]. These analyses advance the understanding of carotenoid production in this alga and enhance prospects for improving commercial production of
C. zofingiensis.
Since it was isolated,
C. zofingiensis was mostly investigated in the context of biotechnological applications associated with the production of pigments and oil, and only few investigations referred to cell-cycle-associated morphology. Fučíková and Lewis (2012) [
22] resurrected the genus
Chromochloris, previously affiliated with the genus
Chlorella, by considering both morphological observations and phylogenetic analyses. Although several morphological and life history investigations were performed [
19,
22,
23,
24,
25], the basic characteristics of
C. zofingiensis reproduction under common cultivation techniques were not elucidated yet. Evidently, Fučíková and Lewis (2012) [
22], despite performing a thorough literature review and direct attempts to stain nuclei, were unable to determine with complete certainty whether mature cells of the genus members contain several nuclei. It is only recently that Cryo-soft X-ray tomography visualized the nuclei in a cluster of cells, indicating that
C. zofingiensis divides by multiple fission [
19]. The same study also suggested a temporal separation between growth and division and indicated a similarity between
C. zofingiensis and
C. reinhardtii patterns of reproduction. The similarity, however, is not straightforward, as
Chlamydomonas is affiliated with a different order within
Chlorophyceae,
Chlamydomonadales, whereas
C. zofingiensis belongs to
Sphaeropleales [
4,
19]. In addition,
C. reinhardtii cell-cycle was characterized as the clustered multiple fission type [
4]: under this type, no multinuclear stages are observed during the cell-cycle.
C. zofingiensis cultures, however, include a variety of multinuclear stages, as will be shown in the results section. Therefore, additional investigation is needed to clarify
C. zofingiensis cell-cycle pattern.
In this study, we set out to characterize the division pattern that is executed by C. zofingiensis in cultures grown phototrophically, both under batch and continuous cultivation modes and different illumination intensities. The methodology used in this study demonstrates an accessible and cost-efficient way to investigate the microalgal pattern of reproduction and showed that C. zofingiensis executes the consecutive cell-cycle division pattern which under the tested conditions is completed within several 24 h L/D cycles.
4. Discussion
The presented results are discussed in light of the published information [
4,
28] on microalgal cell-cycle in attempt to better characterize
C. zofingiensis division pattern. Under continuous LL, we detected the previously reported [
22,
24,
25,
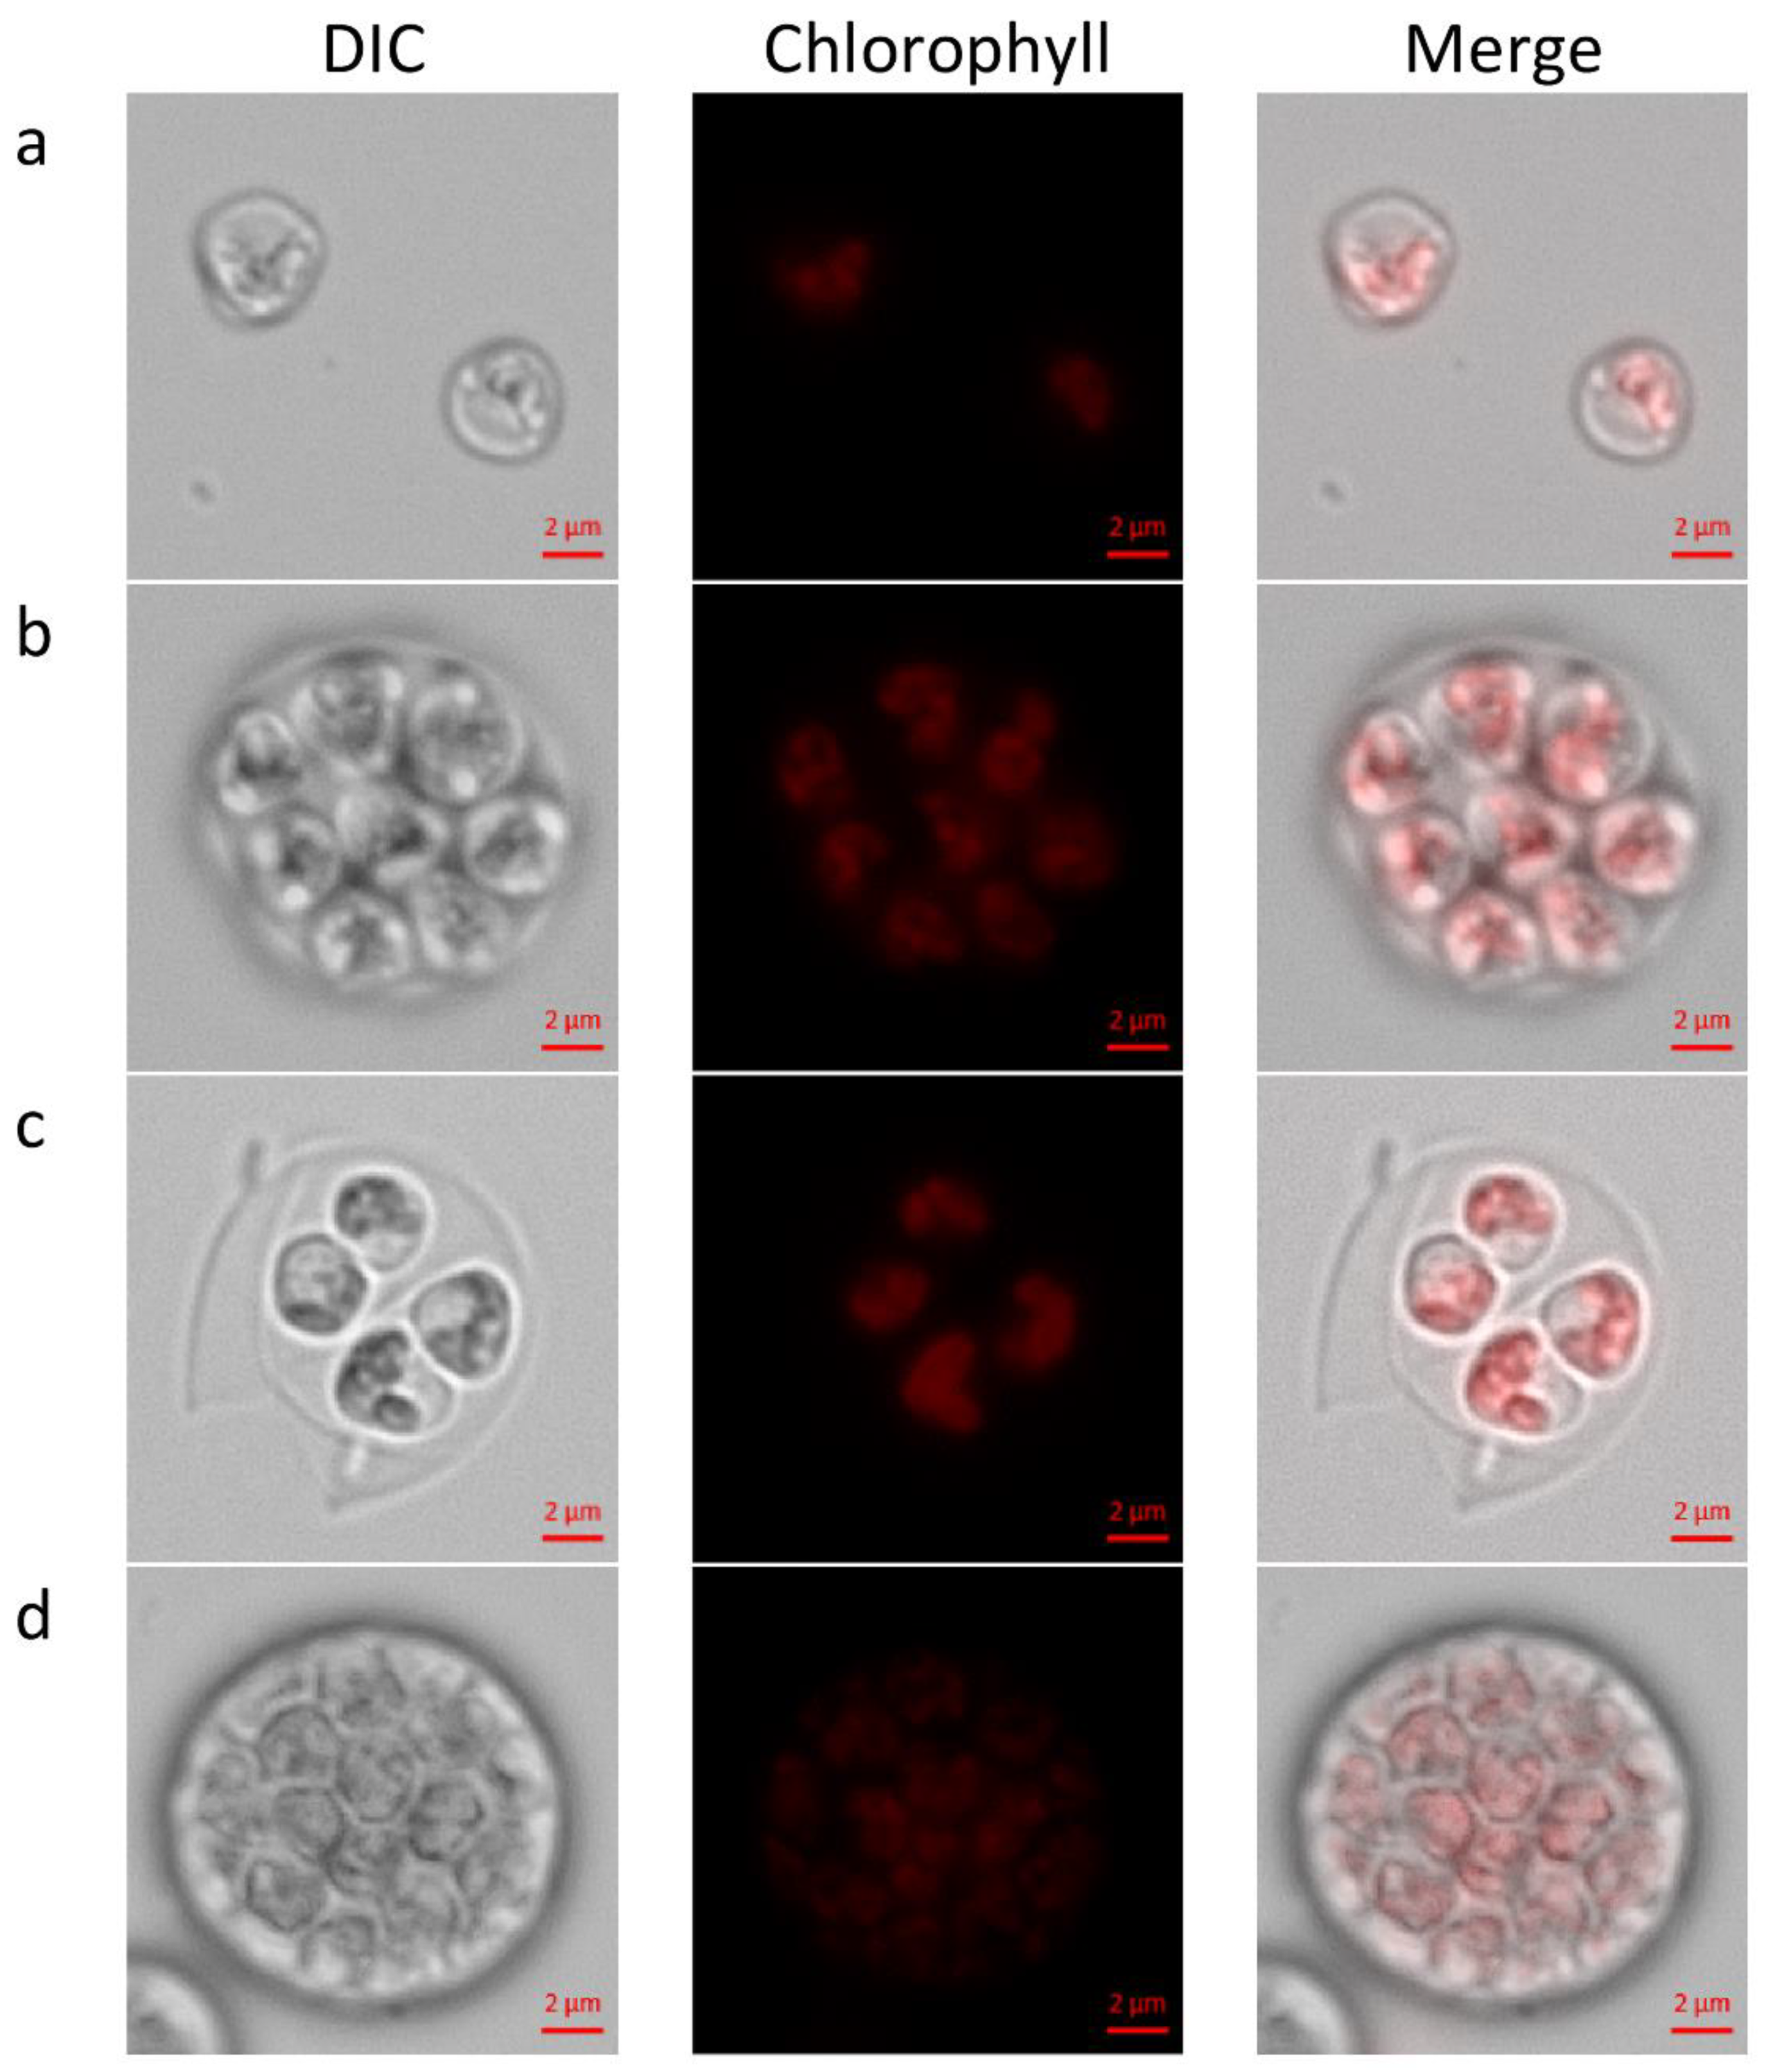
29] morphologies of newly hatched autospores and autosporangia (
Figure 1a–d). We observed autosporangia, which released 2 to 32 and rarely even 64 autospores, as published earlier [
23]. These observations indicate that
C. zofingiensis can divide by either binary or multiple fission division patterns. As discussed in Bišová and Zachleder (2014) [
4], the number of daughter cells is correlated with the culture growth rate in microalgae that can perform both binary and multiple fission. Higher growth rates are associated with bigger population of large autosporangia that can divide into several (more than two) autospores. We suggest that under the conditions of batch culture and LL, at the beginning of cultivation, the growth of
C. zofingiensis was unlimited by the conditions, and the cultures attained high growth rate and thus cells divided by multiple fission. At the plateau stage, as the culture become dense and turbidity of the culture is relatively high, light became limiting and growth rate declined so that binary fission was executed. Chloroplast dynamics during cell-cycle was not recorded in the current study. Nevertheless, the previously reported observations of parietal chloroplast/s in young autospores (
Figure 1a–c) and polygonal disk-like shaped chloroplasts in the forming autosporangia (
Figure 1d) were detected and verified [
22,
25,
29].
The nuclei visualization protocol that we developed in this study enabled, for the first time, the detection of mono and PNC along the cultivation period and the assessment of nuclei sizes. Under the examined conditions, a single cell-cycle of
C. zofingiensis can spread over a period of several days; during this period cells’ size enlarged (
Figure 2), indicating the progress in G1 phase. We suggest that, with every approximate doubling of size, CP is attained. According to our observations, up to five or six CPs can be attained during a single cell-cycle of
C. zofingiensis, and subsequently facilitate the formation of up to 32–64 autospores. As mentioned previously [
4], every CP attained should be followed by DNArds. The detected multinucleated stages and differences in the sizes of nuclei among the PNC indicate that DNArds are being executed in the cells in a consecutive pattern. We suggest that the observed large nuclei (approximately 1.6–3 µm in diameter,
Figure 2, 2–8 PNC) represent cells containing two copies of DNA during and after S phase and before M phase, and the observed small nuclei (approximately 1.2–1.6 µm in diameter,
Figure 2, 1, 16 and >16 nuclei containing cells) represent cells before S phase or after M phase is completed. In principle, the cell undergoes multiple rounds of S phase before it divides and autosporangia are mainly visible in 8 and 16 PNC. Such consecutive division pattern described herein for
C. zofingiensis is similar to its close relative
Scenedesmus, but contradicts previous suggestions [
19] comparing it to the model green alga
C. reinhardtii.The results discussed above indicate that C. zofingiensis can divide by binary or multiple fission in a consecutive pattern. Continuous illumination, however, is unnatural and therefore may not support reliable characterization of the division pattern. Moreover, continuous illumination is of a lesser relevance to outdoor mass culture applications. More relevant to natural behavior and realistic application is the investigation of C. zofingiensis cell-cycle under alternating L/D regime.
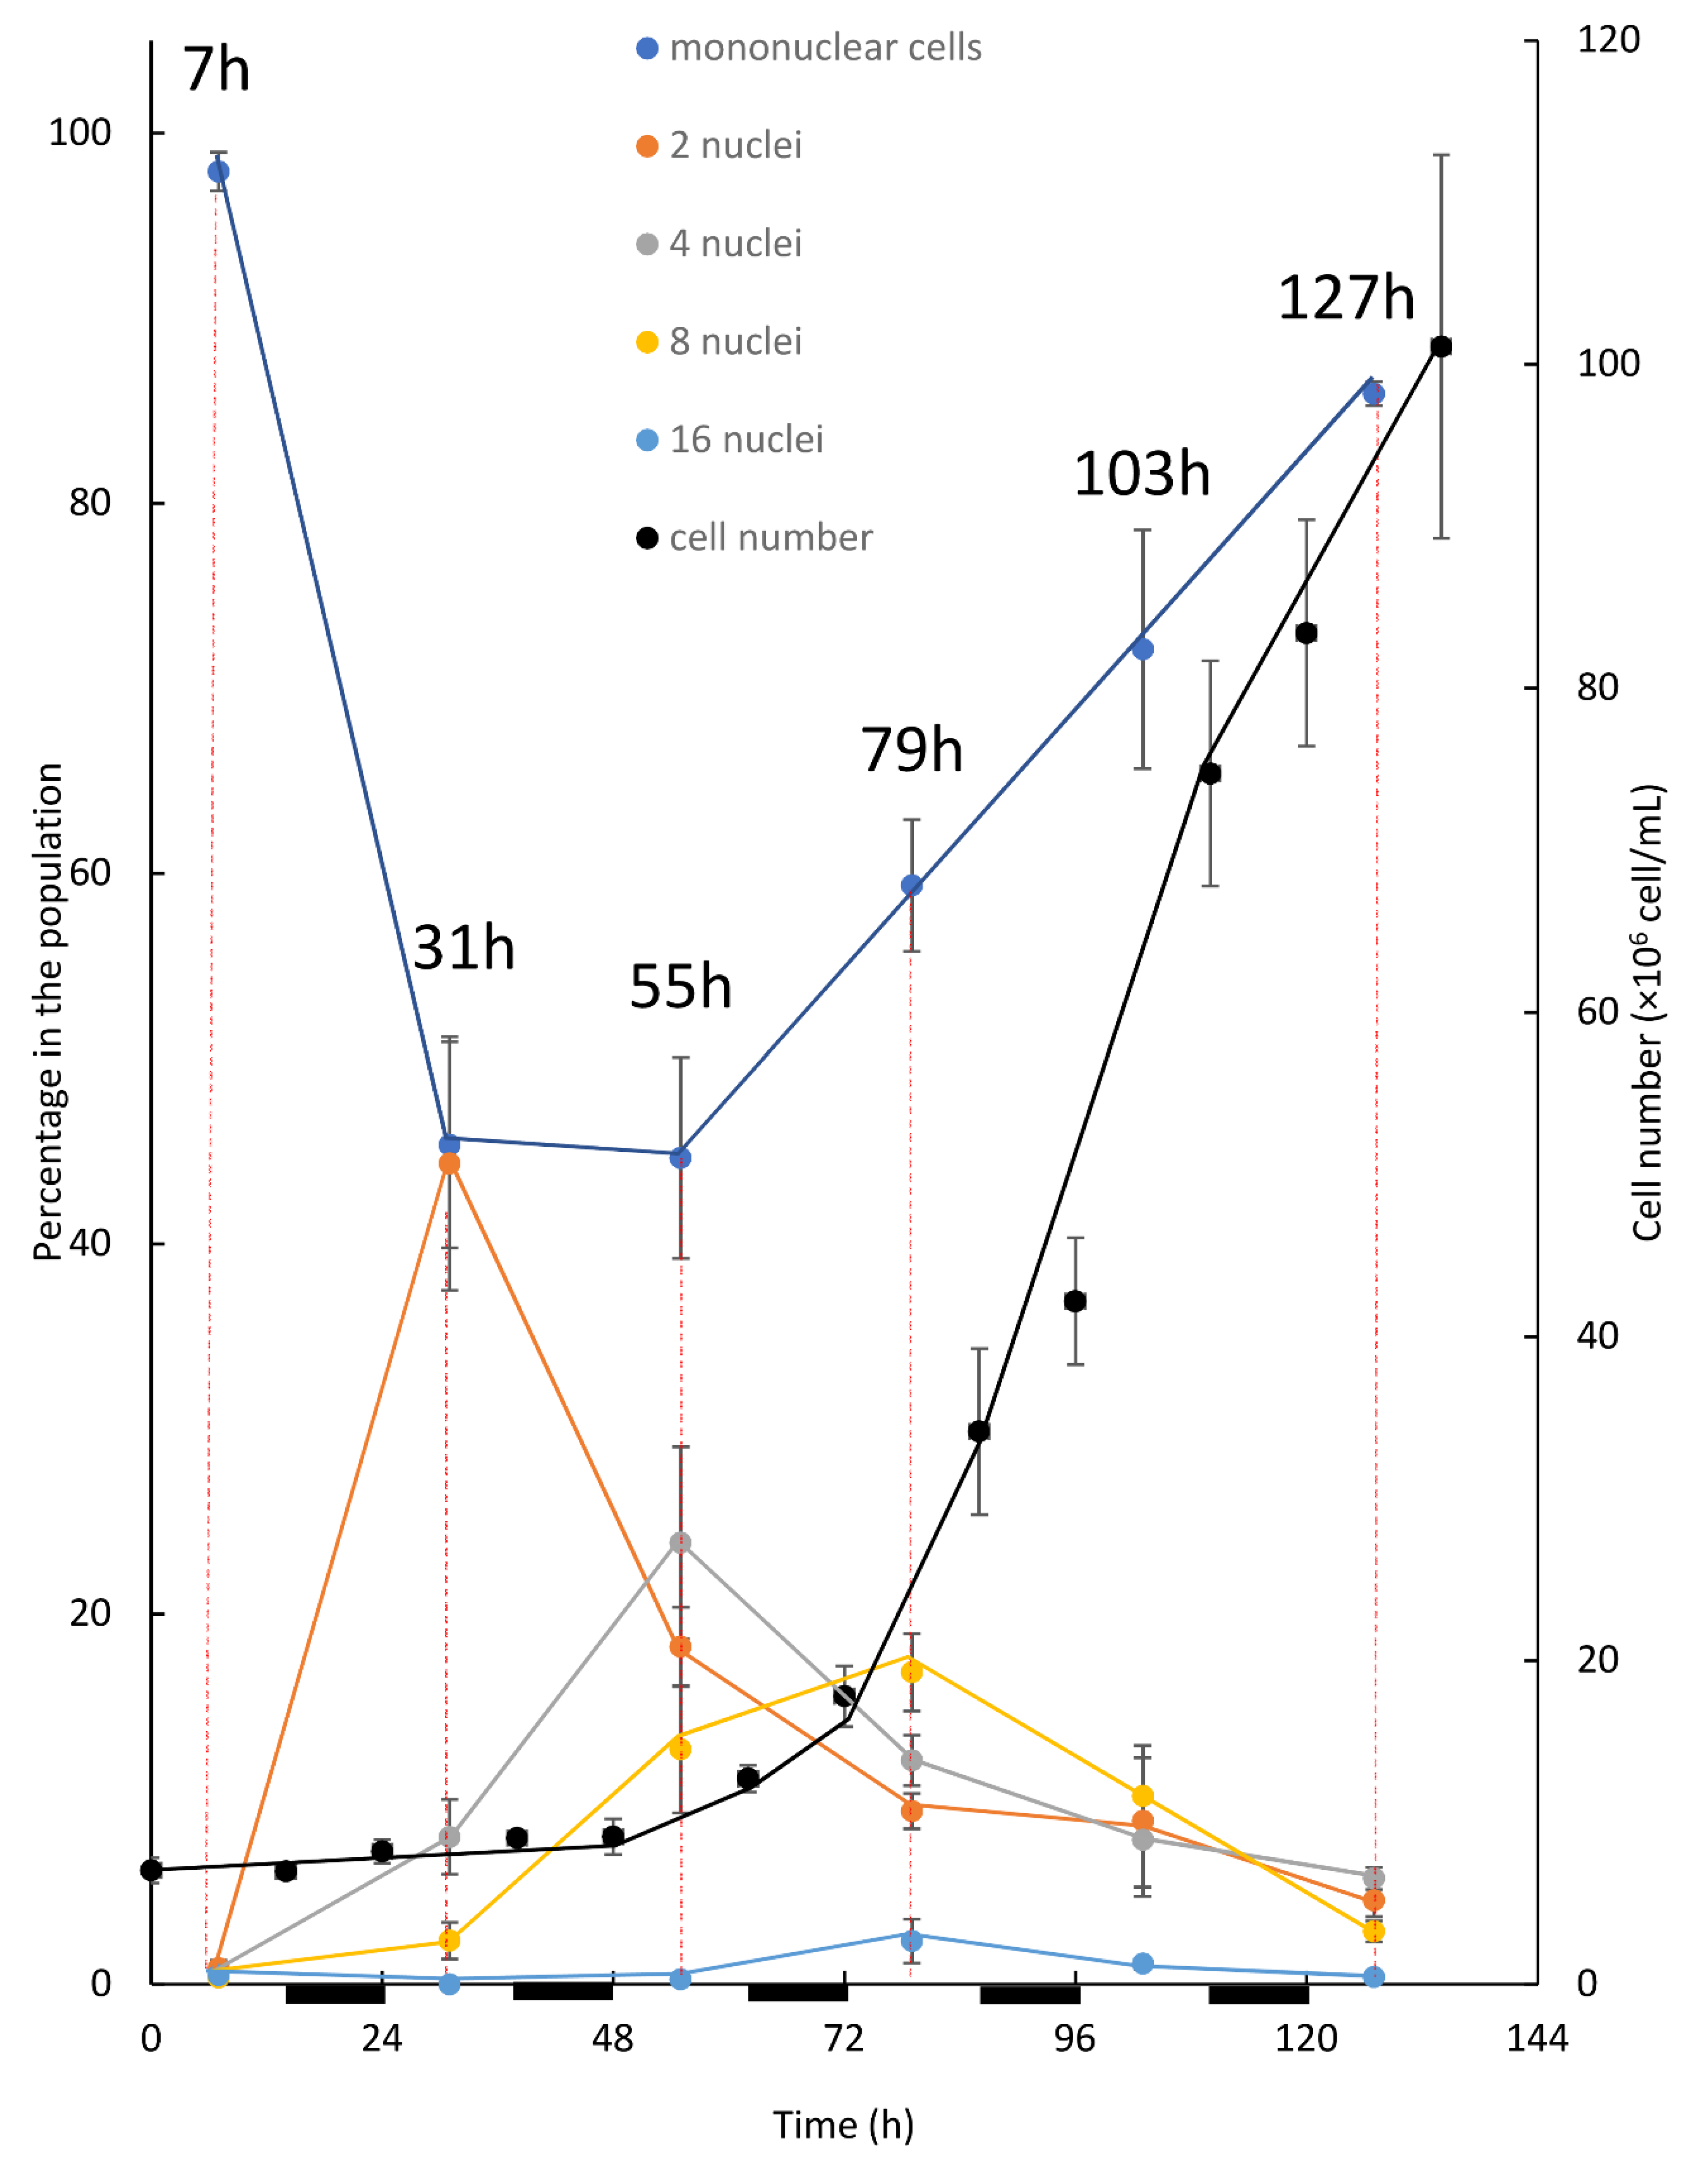
The first experimental setup for investigating the pattern of division under an alternating L/D regime was performed in batch mode. In this setup (
Figure 3), after inoculation the dominant subpopulation of solitary mononuclear cells initiated their first growth phase (G1). Throughout the G1 phase, as cells doubled in volume (not shown), the first CP was attained. Consequently, DNArds was initiated and included execution of S, G2, and M phases, giving a rise to the binuclear cells. Evidently, the peak of binuclear cells subpopulation (observed at 31 h), along with the reduction in the mononuclear cell subpopulation, indicate the transition of cells from one subpopulation to the other. Cell number did not increase at this stage, indicating that cytokinesis was not yet conducted. It appears that instead, a second G1 phase was started with the attainment of the first CP, leading to a second doubling in cell volume and the attainment of a second CP. The second CP was, like the first one, accompanied by the initiation of a third G1 phase. Binuclear cells, which doubled their volume in their second G1 phase, started executing a second DNArds, giving a rise to the four-nuclei PNC, and in most of the cells cytokinesis was not yet conducted. Supporting this assumption is the reduction in the percentage of binuclear cells, along with the increase—to a peak value—of the 4-nuclei PNC, indicating the flow from one sub-population to the other. In the same manner, it can be suggested that the 4-nuclei PNC, after attaining the third CP, grew to around 8 times the volume of an autospore and executed a third DNArds to give rise to the 8-nuclei PNC. Again, supporting this assumption is the drop in the percentage of the 4-nuclei PNC subpopulation to a peak value, indicating the flow from one population to the other. The results suggest that some of the cells progressed more in the cell-cycle, and therefore conducted three G1 phases and attained three CPs; these cells were able to grow and subsequently committed to divide once again in order to give rise to the 16-nuclei PNC. The 16-nuclei PNC, in turn, produced 16 autospores via large-volume (16 times the volume of an autospore) autosporangia, which were visible under the microscope (not shown). The 16-PNC subpopulation started to grow at around 55 h after cultivation and expanded to a peak level at 79 h. According to the suggested explanation, the 16-PNC detected at 55 h are at the cutting edge of progress in cell-cycle and are followed in level of progression by the 16-PNC detected at 79 h. As indicated by an increase in cell number, the assessment of total population growth relative to changes in the size of the 5 subpopulations composing it, revealed a clear pattern. The increase in cell number and the increase in the mononuclear subpopulation temporally correlated with the expansion of 8 and 16-PNC subpopulations. This pattern continued and became more profound as the 8 and 16-PNC subpopulations decreased in size, suggesting a flow from these subpopulations to the mononuclear subpopulation via cell division. Thus, a cell from the 8- nuclei PNC subpopulation can have two possible fates. If culture conditions permit growth at a sufficient level during the third G1 phase [
4,
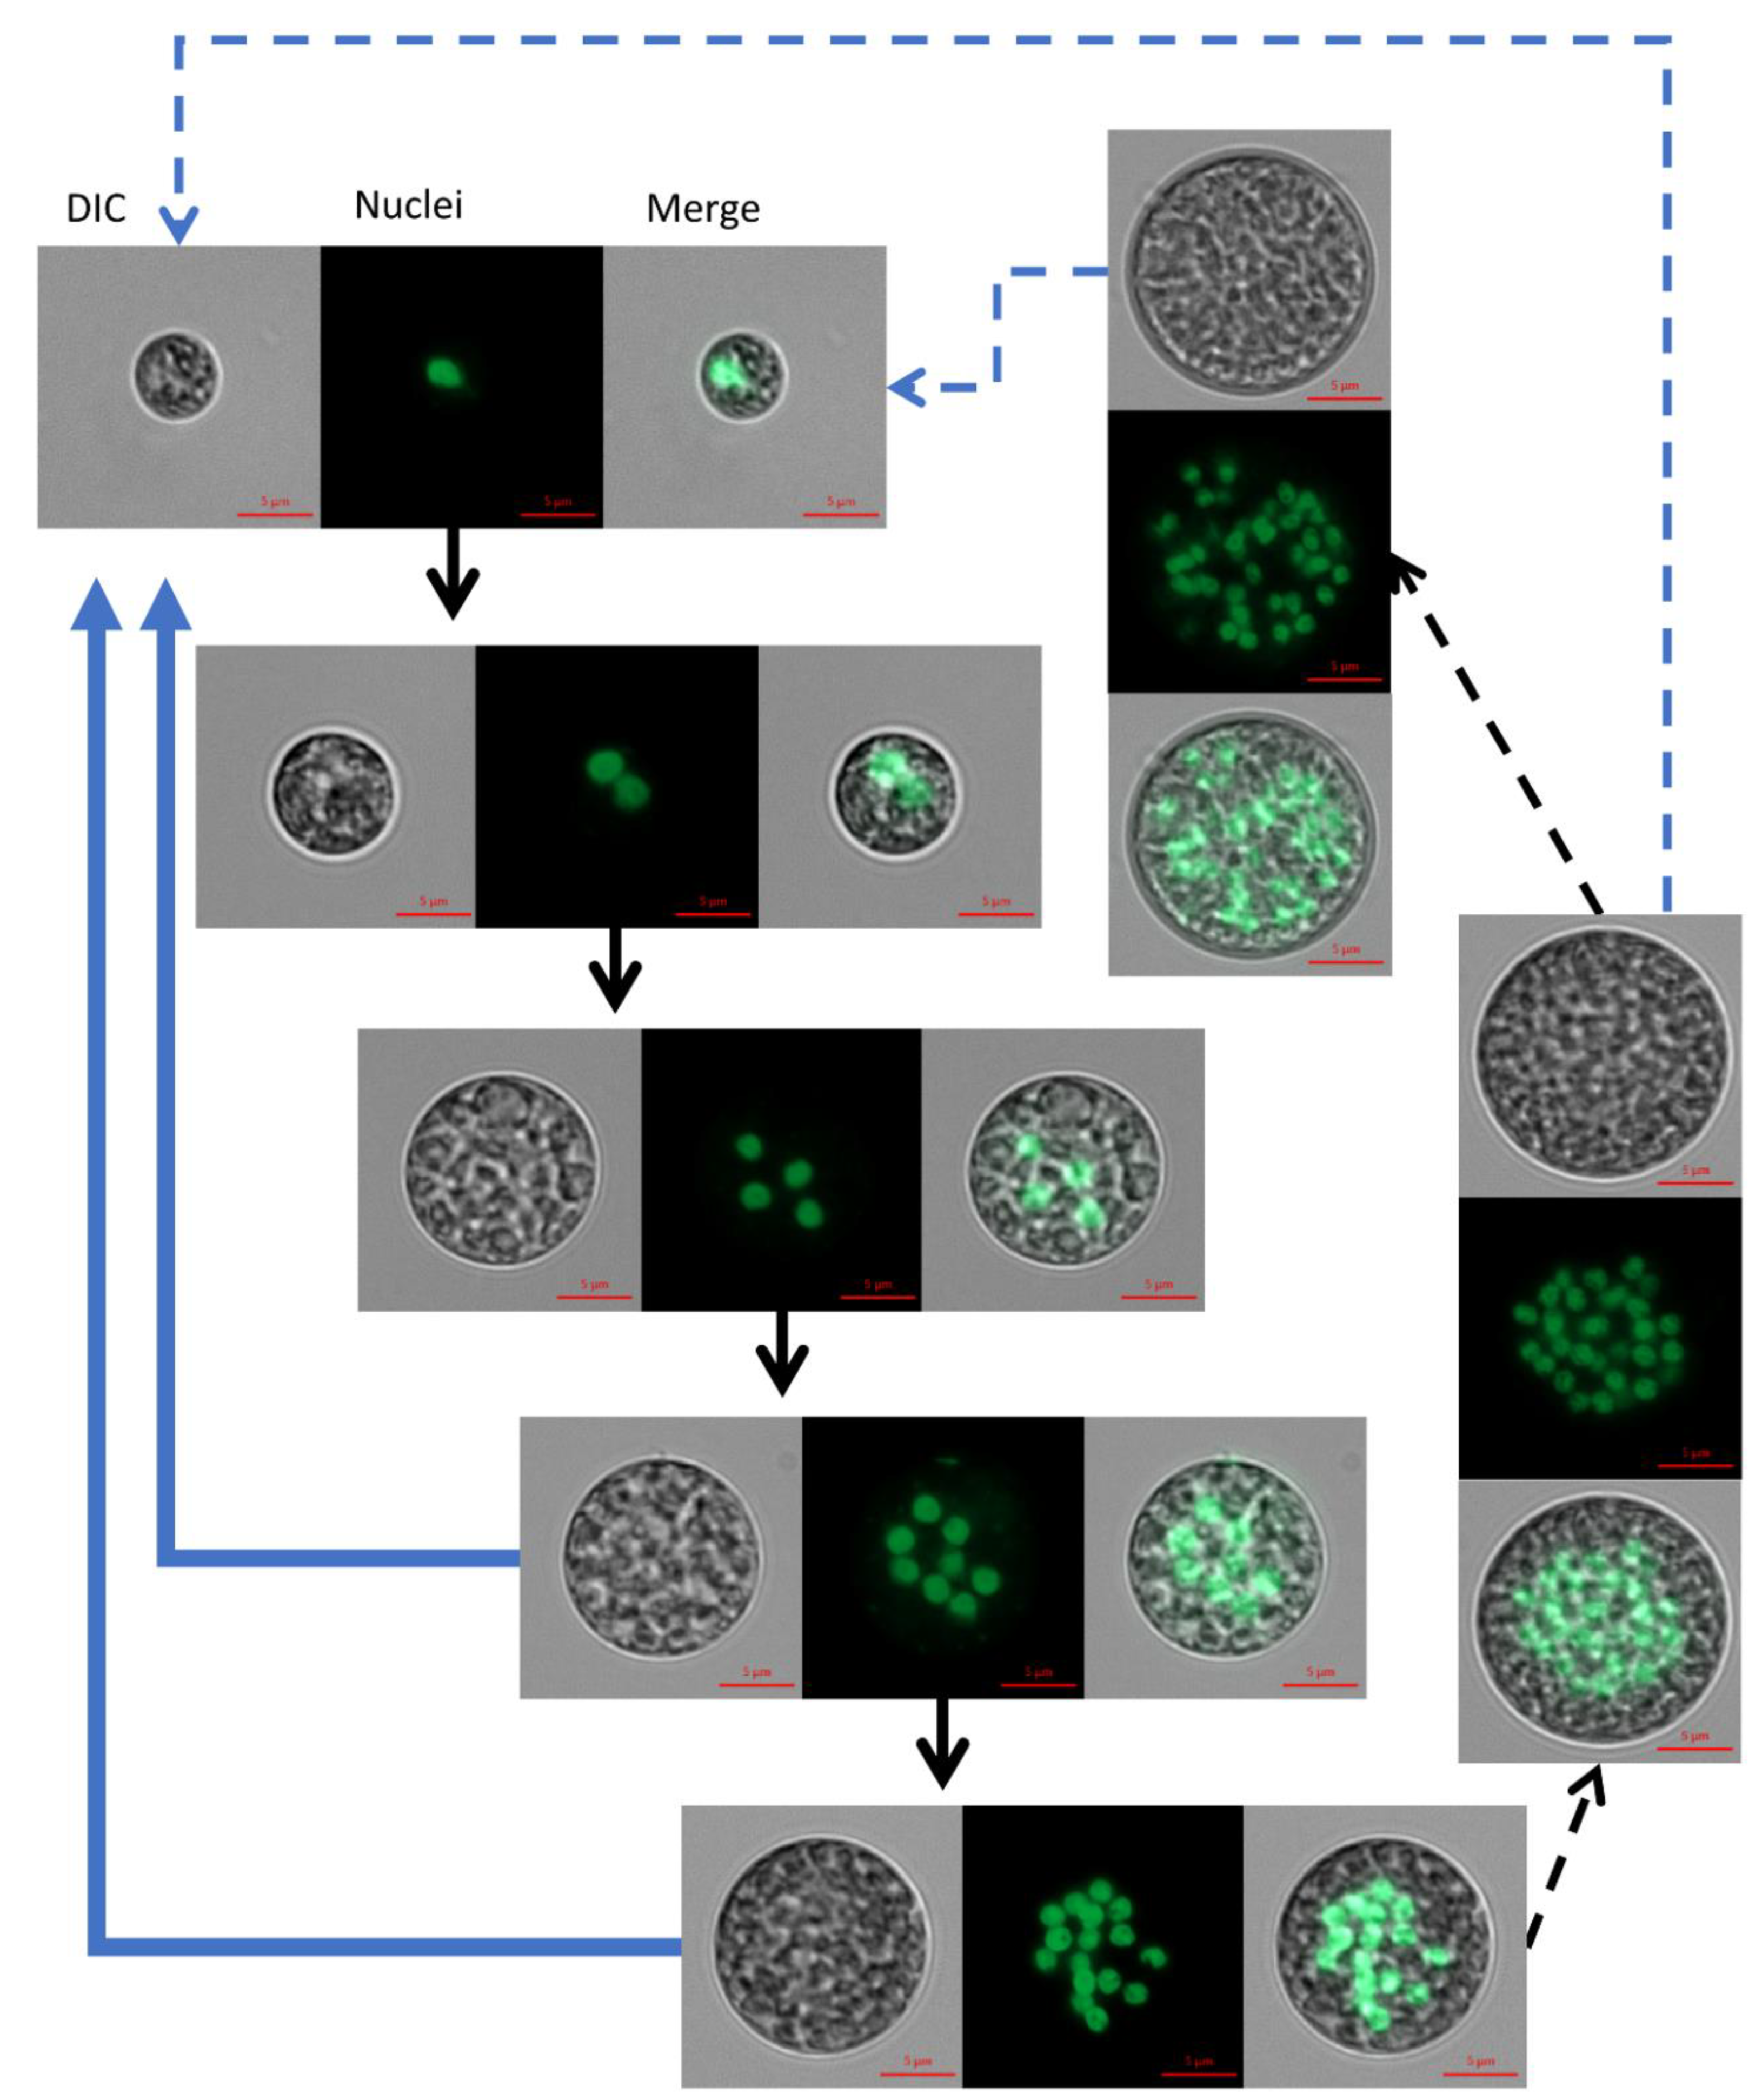
11], a fourth CP will be attained and a fourth G1 phase will be initiated (usually without attainment of additional CP). Subsequently, the 8-PNC subpopulation would be converted to the 16-PNC subpopulation (
Figure 5). Alternatively, if growth is not permitted at the sufficient level [
4,
11], the fourth CP will not be attained and the third DNArds will be terminated with C phases (as demonstrated in the model,
Figure 5).
As part of this experimental setup, cultures were kept under alternating light and dark periods and cell numbers were measured at the beginning and at the end of the dark period, such that cell division in the dark could be assessed (
Figure 3). Even though the phenomenon under which algal cells dividing by multiple fission synchronize growth and divisions with the available illumination regime is well known [
4,
11], such synchronization was not observed. It can be suggested that the batch cultivation included a constant change in culture conditions, as throughout the cultivation cells presumably increased in size and/or total cell density increased. As the cultures were kept under LL, it is likely that such changes could affect the available light per cell profoundly. In addition, as the batch mode does not include refreshment of the media, it is possible that the depletion of nutrients and the accumulation of waste products can also contribute to the instability of culture conditions overtime. Under this constant change, as every light and every dark period are different, synchronization of cell division with the light regime was not established.
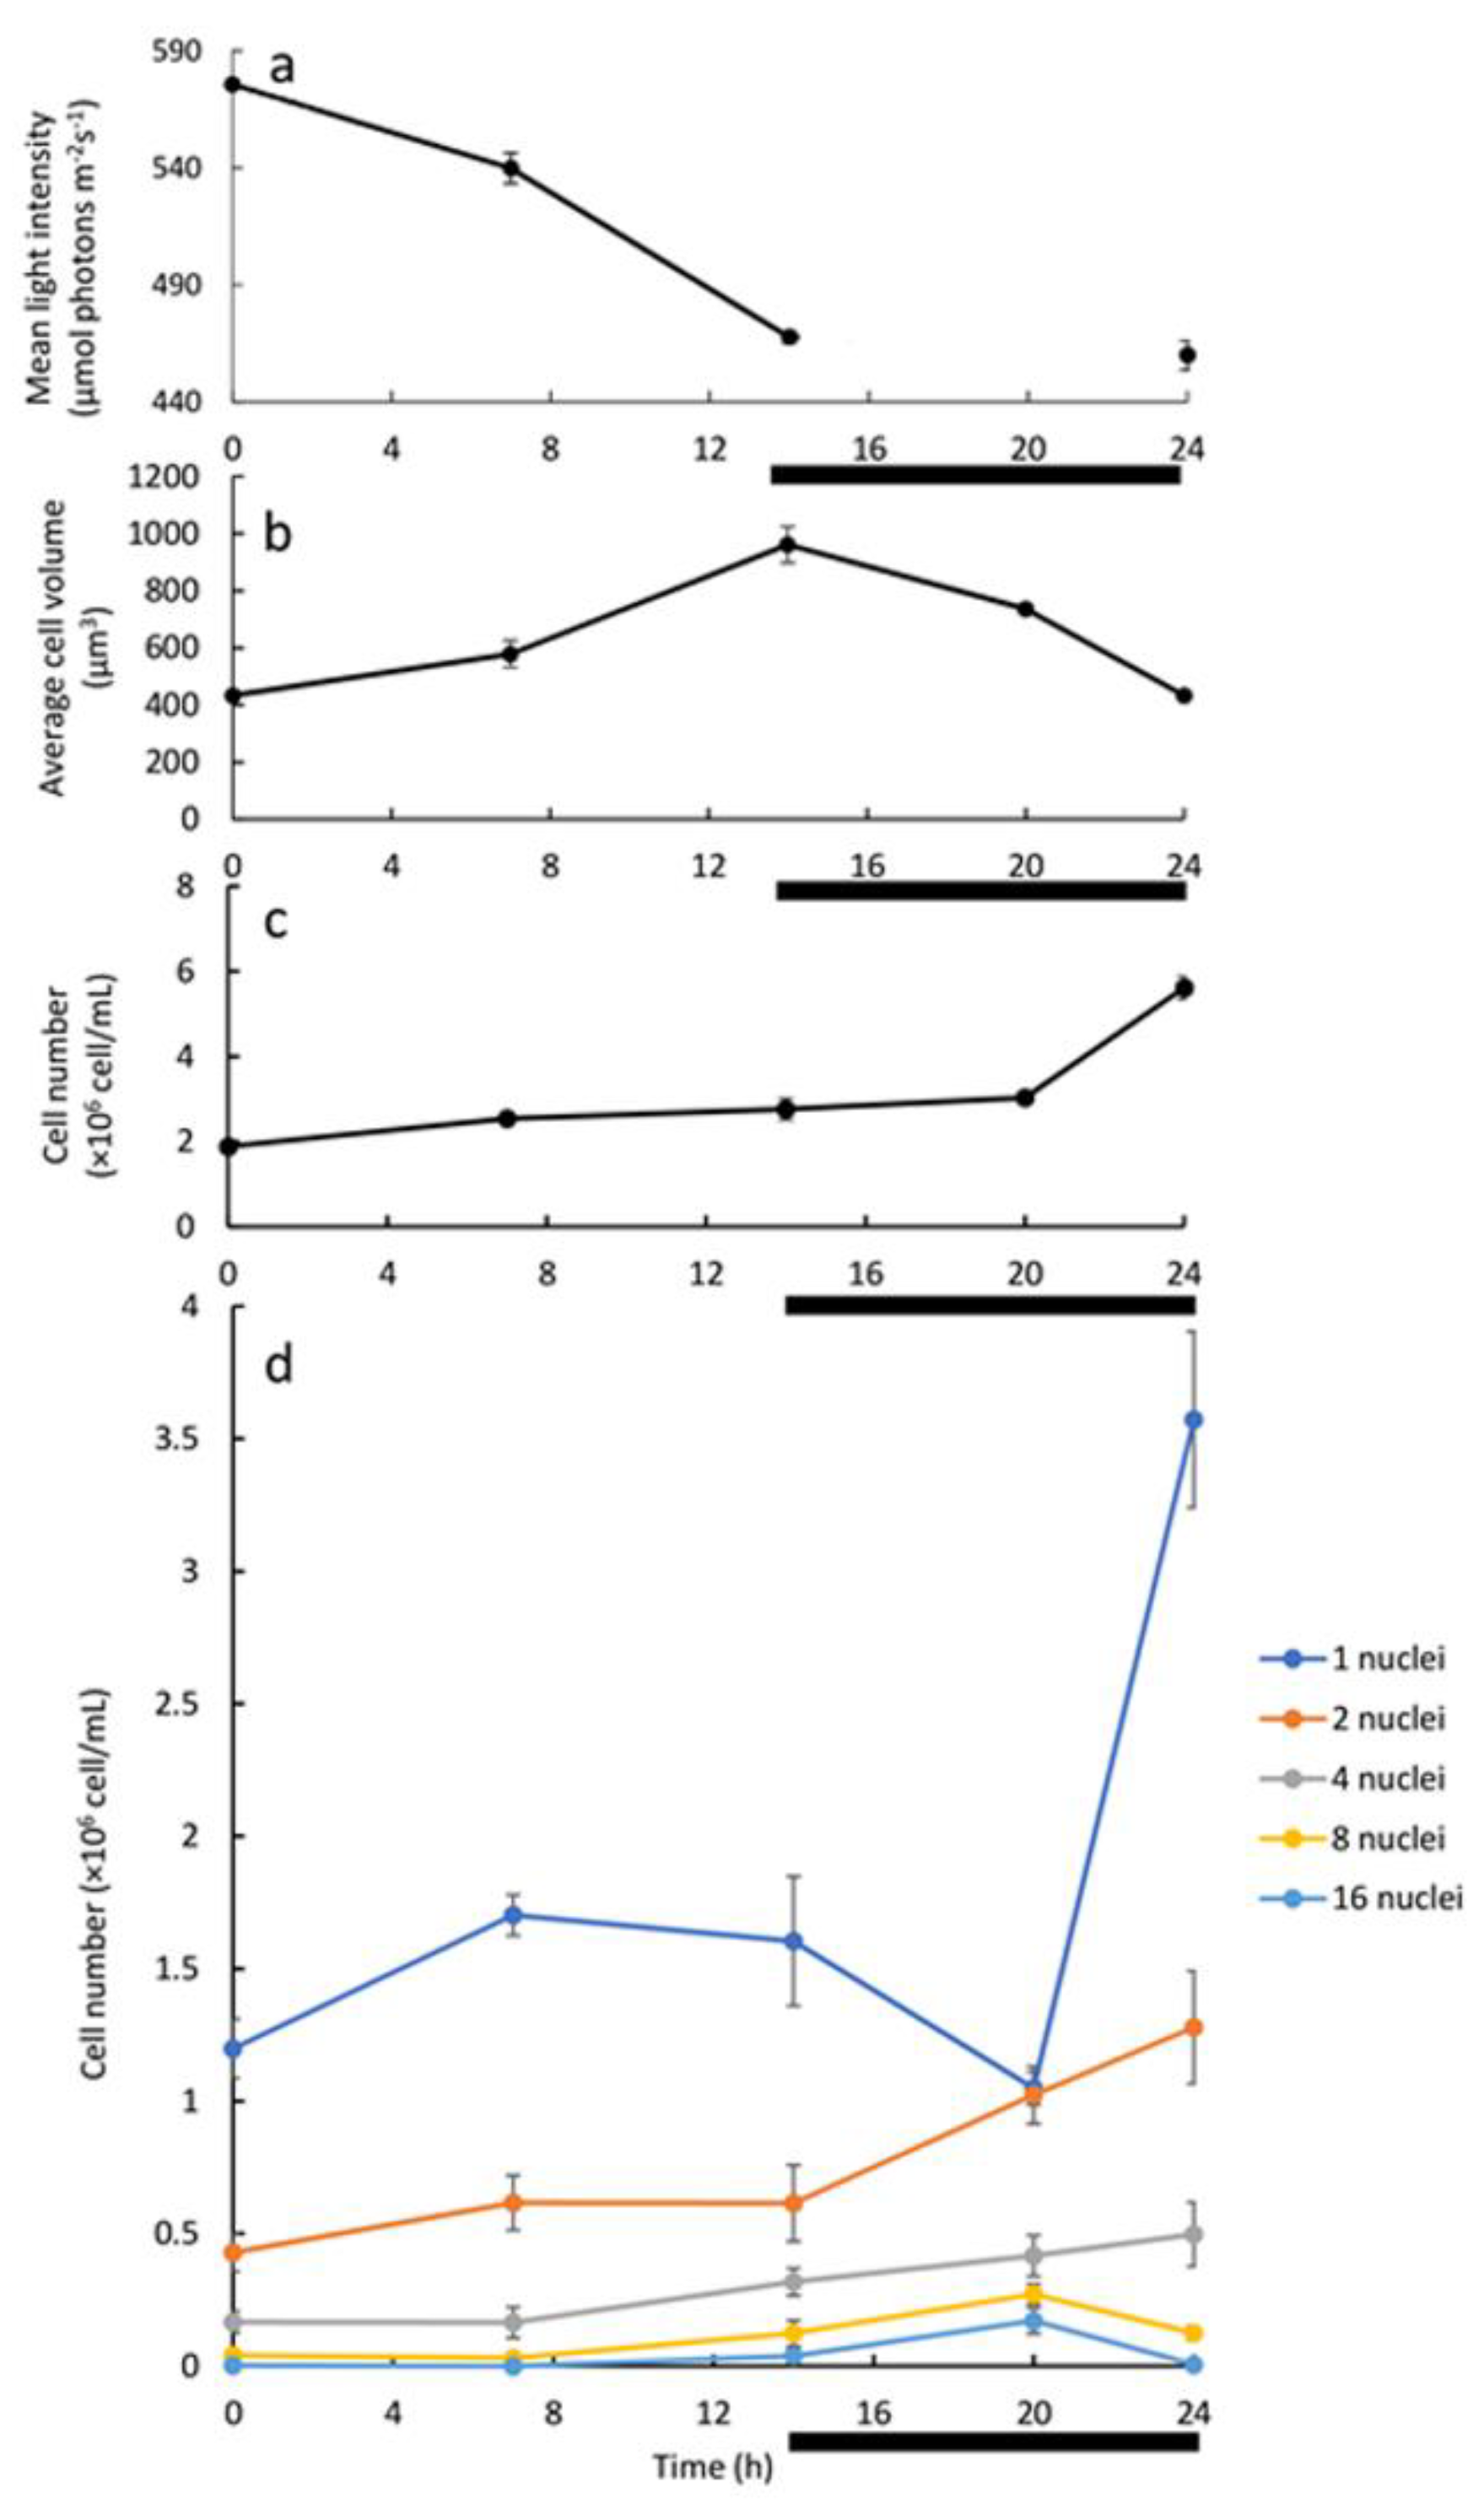
Analysis of the batch culture grown under L/D illumination regime may suggest association between the development and division of 8 and 16-PNC with the release of autospores. The batch cultivation, however, facilitates constant changes in conditions as stated above. To overcome the limitations of the two above-mentioned experimental setups (batch under continuous LL and batch under L/D with LL), a 24 h cultivation cycle with alternating 14 h-light and 10 h-dark and dilution at the end of every dark period was established. Under this continuous experimental setup, cell density was kept low during experiment, with a maximum density of 5.62 ± 0.27 × 10
6 cells/mL (
Figure 4c) under HL, ensuring that considerable light limitation would not occur. Indeed, the change in the mean light intensity was not significant; it decreased from 575.6 ± 2.1 to 467.7 ± 2.6 μmol photons m
−2 s
−1 during the 14 h light period (
Figure 4a, 0–14 h). The daily dilution, replacing around 65% of the culture media every 24 h, ensured that all nutrients are available, and no waste builds up. It can be argued that under this experimental setup there is no abiotic growth limitation. Indeed, the µ, which was calculated from the increase in cell number during the 24 h L/D cycle (
Figure 4c), of 0.04 h
−1, is the highest µ ever reported for the photoheterotrophic cultivation of
C. zofingiensis [
14,
30]. Under this setup
C. zofingiensis cells spontaneously synchronized their growth with the light period and cell divisions with the dark period, as depicted in our schematic model (
Figure 6). Increase in turbidity and average cell volume without a major increase in cell numbers along the light period indicate that the cells are mostly growing during the light period (
Figure 4). We thus suggest that a G1 phase is being conducted. However, in the dark period, an increase in cell number coupled with a decrease in the average cell volume, particularly during the last 4 h of the dark period was observed, indicate that cells terminate cell-cycle and divide in the dark period. Nuclei visualization was conducted in order to capture the pattern of cell-cycle events under this experimental setup. As the G1 progressed, CP was attained with every approximate doubling of size, but DNArds were executed mainly during the dark period, though a minor population of cells executed DNArds after 7 h in the light. In the darkness, the mononuclear cells subpopulation decreased with a simultaneous increase in the PNC subpopulations, indicating a flow from mono to PNC. During the last 4 h of dark, a sharp increase in total cell number, coupled with a sharp increase in the number of the mononuclear cells, and a decrease in the number of the 8 and 16 PNC, indicate that these cells divided and released autospores. Therefore, it seems that under this experimental setup, the major PNC subpopulations that divide are the 8 and 16-PNC (
Figure 4,
Figure 5 and
Figure S2).
As results indicate that large cells, which makeup a small portion of the total population, are mostly dividing at the end of the dark period, and as our measurements show that volume increase of 8–16 times is not feasible during one light period (
Figure 4b), the average cell probably undergoes several L/D cycles to complete one cell-cycle event. Under the examined conditions of daily dilution and simultaneous exposure to HL, it is possible that excessive light stress is imposed to the cells and therefore cell volume does not increase enough during the light period to allow faster growth. As a matter of fact, the small increase in cell number in each L/D cycle (three-fold increase) with no peak of 8/16 PNC in the light period may indicate a growth inhibition/HL acclimation at the onset of the daily dilution. To summarize, the combined measurements of cell number, cell size, and number of nuclei per cell under different cultivation setups helped us to elaborate the pattern by which
C. zofingiensis grow and divide. Since the PNC were observed under both, high and low light conditions, and under both batch and continuous culture, we conclude that light limitations or change in extra cellular conditions (such as nutrient limitation or change in pH) do not bias our findings, and the cell cycle pattern describe herein is an intrinsic property of this alga. Further studies are needed to explore and understand the underlying mechanism of the consecutive cell cycle division in
C. zofingiensis.


