
Course of Self-Reported Dysphagia, Voice Impairment and Pain in Head and Neck Cancer Survivors

 , , , ,
Abstract
Simple Summary
Abstract
1. Introduction
2. Materials and Methods
2.1. Patients
2.2. Instruments
2.3. Statistical Analysis
3. Results
3.1. Sample Characteristics
3.2. Mean Scores
3.3. Impact of Sociodemographic and Clinical Factors on Dysphagia, Voice Problems and Pain
4. Discussion
5. Conclusions
Author Contributions
Funding
Institutional Review Board Statement
Informed Consent Statement
Data Availability Statement
Conflicts of Interest
References
- Carmignani, I.; Locatello, L.G.; Desideri, I.; Bonomo, P.; Olmetto, E.; Livi, L.; Le Saec, O.; Coscarelli, S.; Mannelli, G. Analysis of dysphagia in advanced-stage head-and-neck cancer patients: Impact on quality of life and development of a preventive swallowing treatment. Eur. Arch. Otorhinolaryngol. 2018, 275, 2159–2167. [Google Scholar] [CrossRef]
- Kolator, M.; Kolator, P.; Zatoński, T. Assessment of quality of life in patients with laryngeal cancer: A review of articles. Adv. Clin. Exp. Med. 2018, 27, 711–715. [Google Scholar] [CrossRef] [PubMed]
- Ringash, J.; Bernstein, L.J.; Devins, G.; Dunphy, C.; Giuliani, M.; Martino, R.; McEwen, S. Head and Neck Cancer Survivorship: Learning the Needs, Meeting the Needs. Semin. Radiat. Oncol. 2018, 28, 64–74. [Google Scholar] [CrossRef]
- Lahtinen, S.; Koivunen, P.; Ala-Kokko, T.; Kaarela, O.; Laurila, P.; Liisanantti, J.H. Swallowing-related quality of life after free flap surgery due to cancer of the head and neck. Eur. Arch. Otorhinolaryngol. 2018, 276, 821–826. [Google Scholar] [CrossRef]
- Platteaux, N.; Dirix, P.; Dejaeger, E.; Nuyts, S. Dysphagia in Head and Neck Cancer Patients Treated with Chemoradiotherapy. Dysphagia 2009, 25, 139–152. [Google Scholar] [CrossRef] [PubMed]
- Gillespie, M.B.; Ma, M.B.B.; Day, T.A.; Lee, F.-S.; Martin-Harris, B. Swallowing-Related Quality of Life After Head and Neck Cancer Treatment. Laryngoscope 2004, 114, 1362–1367. [Google Scholar] [CrossRef]
- Ms, L.V.D.S.; Van Gestel, D.; Vanderveken, O.; Vanderwegen, J.; Lazarus, C.; Daisne, J.-F.; Van Laer, C.; Specenier, P.; Van Rompaey, D.; Mariën, S.; et al. Evolution of self-perceived swallowing function, tongue strength and swallow-related quality of life during radiotherapy in head and neck cancer patients. Head Neck 2019, 41, 2197–2207. [Google Scholar] [CrossRef]
- Wilson, J.A.; Carding, P.N.; Patterson, J.M. Dysphagia after Nonsurgical Head and Neck Cancer Treatment. Otolaryngol. Neck Surg. 2011, 145, 767–771. [Google Scholar] [CrossRef]
- Patterson, J.M. Late Effects of Organ Preservation Treatment on Swallowing and Voice; Presentation, Assessment, and Screening. Front. Oncol. 2019, 9, 401. [Google Scholar] [CrossRef]
- Lango, M.N.; Egleston, B.; Fang, C.; Burtness, B.; Galloway, T.; Liu, J.; Mehra, R.; Ebersole, B.; Moran, K.; Ridge, J.A. Baseline health perceptions, dysphagia, and survival in patients with head and neck cancer. Cancer 2013, 120, 840–847. [Google Scholar] [CrossRef] [PubMed]
- Pugliano, F.A.; Piccirillo, J.F.; Zequeira, M.R.; Emami, B.; Perez, C.A.; Simpson, J.R.; Fredrickson, J.M. Clinical-severity staging system for oropharyngeal cancer: Five-year survival rates. Arch. Otolaryngol. Head Neck Surg. 1997, 123, 1118–1124. [Google Scholar] [CrossRef]
- Pugliano, F.A.; Piccirillo, J.F.; Zequeira, M.R.; Fredrickson, J.M.; Perez, C.A.; Simpson, J.R. Clinical-Severity Staging System for Oral Cavity Cancer. Otolaryngol. Neck Surg. 1999, 120, 38–45. [Google Scholar] [CrossRef]
- Ribeiro, K.D.C.B.; Kowalski, L.P.; Latorre, M.d.R.D.d.O. Impact of Comorbidity, Symptoms, and Patients’ Characteristics on the Prognosis of Oral Carcinomas. Arch. Otolaryngol. Head Neck Surg. 2000, 126, 1079. [Google Scholar] [CrossRef] [PubMed]
- Ma, S.E.S.; Karnell, L.H.; Karnell, M.P.; Van Daele, D.J.; Funk, G.F. Association between severity of dysphagia and survival in patients with head and neck cancer. Head Neck 2012, 34, 776–784. [Google Scholar] [CrossRef]
- Zebralla, V.; Pohle, N.; Singer, S.; Neumuth, T.; Dietz, A.; Stier-Jarmer, M.; Boehm, A. Vorstellung des Screeningsystems (OncoFunction) für Funktionsstörungen im Kopf-Hals-Tumor-Follow-up. Tumordiagn. Ther. 2015, 95, 118–124. [Google Scholar] [CrossRef] [PubMed]
- Regan, J.; Lawson, S.; De Aguiar, V. The Eating Assessment Tool-10 Predicts Aspiration in Adults with Stable Chronic Obstructive Pulmonary Disease. Dysphagia 2017, 32, 714–720. [Google Scholar] [CrossRef]
- Arslan, S.S.; Demir, N.; Kılınç, H.E.; Karaduman, A.A. The Ability of the Eating Assessment Tool-10 to Detect Aspiration in Patients with Neurological Disorders. J. Neurogastroenterol. Motil. 2017, 23, 550–554. [Google Scholar] [CrossRef]
- Cheney, D.M.; Siddiqui, M.T.; Litts, J.K.; Kuhn, M.A.; Belafsky, P.C. The Ability of the 10-Item Eating Assessment Tool (EAT-10) to Predict Aspiration Risk in Persons with Dysphagia. Ann. Otol. Rhinol. Laryngol. 2014, 124, 351–354. [Google Scholar] [CrossRef]
- Bjordal, K.; Hammerlid, E.; Ahlner-Elmqvist, M.; De Graeff, A.; Boysen, M.; Evensen, J.F.; Biörklund, A.; De Leeuw, J.R.J.; Fayers, P.M.; Jannert, M.; et al. Quality of Life in Head and Neck Cancer Patients: Validation of the European Organization for Research and Treatment of Cancer Quality of Life Questionnaire-H&N35. J. Clin. Oncol. 1999, 17, 1008. [Google Scholar] [CrossRef]
- Arrese, L.C.; Carrau, R.; Plowman, E.K. Relationship Between the Eating Assessment Tool-10 and Objective Clinical Ratings of Swallowing Function in Individuals with Head and Neck Cancer. Dysphagia 2017, 32, 83–89. [Google Scholar] [CrossRef] [PubMed]
- Printza, A.; Kyrgidis, A.; Pavlidou, E.; Triaridis, S.; Constantinidis, J. Reliability and validity of the Eating Assessment Tool-10 (Greek adaptation) in neurogenic and head and neck cancer-related oropharyngeal dysphagia. Eur. Arch. Otorhinolaryngol. 2018, 275, 1861–1868. [Google Scholar] [CrossRef] [PubMed]
- Kirsh, E.; Naunheim, M.; Ma, C.T.G.; Kammer, R.; Varvares, M.; Goldsmith, T. Patient-reported versus physiologic swallowing outcomes in patients with head and neck cancer after chemoradiation. Laryngoscope 2019, 129, 2059–2064. [Google Scholar] [CrossRef]
- Pedersen, A.; Wilson, J.; McColl, E.; Carding, P.; Patterson, J. Swallowing outcome measures in head and neck cancer—How do they compare? Oral Oncol. 2016, 52, 104–108. [Google Scholar] [CrossRef] [PubMed]
- Patterson, J.M.; McColl, E.; Carding, P.N.; Hildreth, A.J.; Kelly, C.; Wilson, J.A. Swallowing in the first year after chemoradiotherapy for head and neck cancer: Clinician-and patient-reported outcomes. Head Neck 2013, 36, 352–358. [Google Scholar] [CrossRef] [PubMed]
- Nguyen, N.P.; Frank, C.; Moltz, C.C.; Karlsson, U.; Nguyen, P.D.; Ward, H.W.; Vos, P.; Smith, H.J.; Huang, S.; Nguyen, L.M.; et al. Analysis of factors influencing Dysphagia severity following treatment of head and neck cancer. Anticancer Res. 2009, 29, 3299–3304. [Google Scholar] [PubMed]
- Bartella, A.K.; Kamal, M.; Berman, S.; Steiner, T.; Frölich, D.; Hölzle, F.; Lethaus, B. Role of Swallowing Function of Tracheotomised Patients in Major Head and Neck Cancer Surgery. J. Craniofacial Surg. 2018, 29, e122–e124. [Google Scholar] [CrossRef]
- Hamzany, Y.; Crevier-Buchman, L.; Lechien, J.R.; Bachar, G.; Brasnu, D.; Hans, S. Multidimensional Voice Quality Evaluation After Transoral CO2 Laser Cordectomy: A Prospective Study. Ear Nose Throat J. 2021, 100, 27S–32S. [Google Scholar] [CrossRef]
- Van Sluis, K.E.; Van Son, R.J.J.H.; Van Der Molen, L.; McGuinness, A.J.; Palme, C.E.; Novakovic, D.; Stone, D.; Natsis, L.; Charters, E.; Jones, K.; et al. Multidimensional evaluation of voice outcomes following total laryngectomy: A prospective multicenter cohort study. Eur. Arch. Otorhinolaryngol. 2020, 1–14. [Google Scholar] [CrossRef]
- Kumai, Y. Pathophysiology of Fibrosis in the Vocal Fold: Current Research, Future Treatment Strategies, and Obstacles to Restoring Vocal Fold Pliability. Int. J. Mol. Sci. 2019, 20, 2551. [Google Scholar] [CrossRef] [PubMed]
- Buchakjian, M.R.; Davis, A.B.; Sciegienka, S.J.; Pagedar, N.A.; Sperry, S.M. Longitudinal Perioperative Pain Assessment in Head and Neck Cancer Surgery. Ann. Otol. Rhinol. Laryngol. 2017, 126, 646–653. [Google Scholar] [CrossRef]
- Bossi, P.; Giusti, R.; Tarsitano, A.; Airoldi, M.; De Sanctis, V.; Caspiani, O.; Alterio, D.; Tartaro, T.; Alfieri, S.; Siano, M. The point of pain in head and neck cancer. Crit. Rev. Oncol. 2019, 138, 51–59. [Google Scholar] [CrossRef] [PubMed]
- Chaplin, J.M.; Morton, R.P. A prospective, longitudinal study of pain in head and neck cancer patients. Head Neck 1999, 21, 531–537. [Google Scholar] [CrossRef]
- Leeuw, I.M.V.-D.; Van Bleek, W.-J.; Leemans, C.R.; De Bree, R. Employment and return to work in head and neck cancer survivors. Oral Oncol. 2010, 46, 56–60. [Google Scholar] [CrossRef] [PubMed]
- Koch, R.; Wittekindt, C.; Altendorf-Hofmann, A.; Singer, S.; Guntinas-Lichius, O. Employment pathways and work-related issues in head and neck cancer survivors. Head Neck 2015, 37, 585–593. [Google Scholar]


| Total (n = 299) | Males (n = 223) | Females (n = 76) | ||||
|---|---|---|---|---|---|---|
| n | % | n | % | n | % | |
| Age Group | ||||||
| 18–59 years | 144 | 48.2 | 104 | 46.6 | 40 | 52.6 |
| 60–69 years | 98 | 32.8 | 78 | 35.0 | 20 | 26.3 |
| ≥70 years | 57 | 19.1 | 41 | 18.4 | 16 | 21.1 |
| Occupation | ||||||
| Not occupied | 219 | 73.2 | 167 | 74.9 | 52 | 68.4 |
| Occupied | 80 | 26.8 | 56 | 25.1 | 24 | 31.6 |
| Alcohol consumption * | ||||||
| No | 225 | 75.5 | 156 | 70.0 | 69 | 92.0 |
| Yes | 73 | 24.5 | 67 | 30.0 | 6 | 8.0 |
| Tobacco consumption * | ||||||
| No | 218 | 73.2 | 158 | 71.3 | 59 | 78.7 |
| Yes | 80 | 26.8 | 64 | 28.7 | 16 | 21.3 |
| Tumor group | ||||||
| Oral cavity | 47 | 15.7 | 33 | 14.8 | 14 | 18.4 |
| Oropharynx | 115 | 38.5 | 84 | 37.7 | 31 | 40.8 |
| Larynx, Hypopharynx | 85 | 28.4 | 74 | 33.2 | 11 | 14.5 |
| Other | 52 | 17.4 | 32 | 14.3 | 20 | 26.3 |
| Tumor stage * | ||||||
| I | 53 | 19.1 | 37 | 17.7 | 16 | 23.5 |
| II | 33 | 11.9 | 27 | 12.9 | 6 | 8.8 |
| III | 51 | 18.4 | 37 | 17.7 | 14 | 20.6 |
| IV | 140 | 50.5 | 108 | 51.7 | 32 | 47.1 |
| Treatment group | ||||||
| 1: OP+ RT- CT- | 71 | 23.7 | 48 | 21.5 | 23 | 30.3 |
| 2: OP+ RT+ CT- | 83 | 27.8 | 69 | 30.9 | 14 | 18.4 |
| 3: OP+ RT+ CT+ | 98 | 32.8 | 73 | 32.7 | 25 | 32.9 |
| 4: OP- RT+ CT+ | 39 | 13.0 | 26 | 11.7 | 13 | 17.1 |
| 5: Other | 8 | 2.7 | 7 | 3.1 | 1 | 1.3 |
| Metastases | ||||||
| No | 157 | 52.5 | 113 | 50.7 | 44 | 57.9 |
| Yes | 142 | 47.5 | 110 | 49.3 | 32 | 42.1 |
| Tracheotomy | ||||||
| No | 218 | 70.9 | 151 | 67.7 | 61 | 80.3 |
| Yes | 87 | 29.1 | 72 | 32.3 | 15 | 19.7 |
| Feeding tube | ||||||
| No | 186 | 62.8 | 135 | 61.1 | 51 | 68.0 |
| Yes | 110 | 37.2 | 86 | 38.9 | 24 | 32.0 |
| ECOG performance * | ||||||
| 0 | 69 | 32.4 | 47 | 31.1 | 22 | 35.5 |
| 1 | 116 | 54.5 | 85 | 56.3 | 31 | 50.0 |
| 2–4 | 28 | 13.1 | 19 | 12.6 | 9 | 14.5 |
| Body Mass Index | ||||||
| <20 kg/m² | 50 | 16.7 | 32 | 14.3 | 18 | 23.7 |
| 20–<25 kg/m² | 148 | 49.5 | 115 | 51.6 | 33 | 43.4 |
| 25–<30 kg/m² | 75 | 25.1 | 58 | 26.0 | 17 | 22.4 |
| ≥30 kg/m² | 26 | 8.7 | 18 | 8.1 | 8 | 10.5 |
| t1 | t2 | t3 | d(t1, t3) | Sign. | r(t1, t3) | Sign. | ||||
|---|---|---|---|---|---|---|---|---|---|---|
| M | (SD) | M | (SD) | M | (SD) | |||||
| EAT-10 (item range 0–4) | ||||||||||
| Item 1. Weight loss | 0.90 | (1.12) | 0.43 | (0.82) | 0.37 | (0.81) | 0.55 | *** | 0.35 | *** |
| Item 2. Problems with meals | 1.18 | (1.46) | 0.92 | (1.28) | 0.84 | (1.27) | 0.25 | *** | 0.57 | *** |
| Item 3. Swallowing liquids | 0.47 | (0.88) | 0.46 | (0.84) | 0.37 | (0.70) | 0.13 | n.s. | 0.29 | *** |
| Item 4. Swallowing solids | 1.07 | (1.23) | 0.92 | (1.19) | 0.91 | (1.19) | 0.13 | * | 0.60 | *** |
| Item 5. Swallowing tablets | 0.71 | (1.17) | 0.70 | (1.07) | 0.71 | (1.09) | 0.00 | n.s. | 0.42 | *** |
| Item 6. Swallowing painful | 0.52 | (0.85) | 0.42 | (0.78) | 0.29 | (0.63) | 0.31 | *** | 0.37 | *** |
| Item 7. Reduced pleasure to eat | 1.00 | (1.28) | 0.80 | (1.13) | 0.73 | (1.21) | 0.22 | ** | 0.57 | *** |
| Item 8. Food sticks in throat | 0.29 | (0.74) | 0.33 | (0.73) | 0.37 | (0.87) | −0.10 | n.s. | 0.54 | *** |
| Item 9. Coughing when eating | 0.56 | (0.93) | 0.66 | (0.98) | 0.63 | (1.02) | −0.07 | n.s. | 0.53 | *** |
| Item 10. Swallowing stressful | 0.76 | (1.00) | 0.70 | (1.00) | 0.62 | (1.03) | 0.14 | * | 0.52 | *** |
| EAT-10 sum score (range 0–40) | 7.47 | (8.12) | 6.41 | (7.87) | 5.85 | (7.86) | 0.20 | ** | 0.59 | *** |
| Voice problems (range 0–100) | 48.4 | (35.7) | 39.8 | (33.3) | 37.0 | (33.7) | 0.33 | *** | 0.50 | *** |
| Pain (range 0–10) | 2.40 | (2.29) | 1.94 | (2.06) | 1.81 | (2.19) | 0.26 | *** | 0.46 | *** |
| n | t1 | t2 | t3 | Significance | ||||||
|---|---|---|---|---|---|---|---|---|---|---|
| M | (SD) | M | (SD) | M | (SD) | Main Effect | Time | Interaction | ||
| Gender | 0.966 | 0.020 | 0.439 | |||||||
| Males | 164 | 7.4 | (8.2) | 6.5 | (8.1) | 5.7 | (7.9) | |||
| Females | 52 | 7.6 | (7.8) | 6.1 | (7.1) | 6.2 | (7.9) | |||
| Age group | 0.034 | 0.147 | 0.079 | |||||||
| ≤59 years | 113 | 7.9 | (7.9) | 5.9 | (7.2) | 5.4 | (7.2) | |||
| 60–69 years | 63 | 8.7 | (9.3) | 8.3 | (9.0) | 7.5 | (8.7) | |||
| ≥70 years | 40 | 4.4 | (6.1) | 4.7 | (7.5) | 4.6 | (7.9) | |||
| Occupational state | 0.005 | 0.008 | 0.634 | |||||||
| Not occupied | 147 | 8.3 | (8.6) | 7.3 | (8.4) | 6.6 | (8.4) | |||
| Occupied | 69 | 5.8 | (6.8) | 4.7 | (6.6) | 4.2 | (6.4) | |||
| Alcohol consumption | 0.241 | 0.013 | 0.828 | |||||||
| No | 157 | 7.8 | (8.3) | 6.7 | (8.1) | 6.2 | (8.2) | |||
| Yes | 59 | 6.6 | (7.5) | 5.6 | (7.2) | 4.9 | (7.0) | |||
| Tobacco consumption | 0.995 | 0.012 | 0.933 | |||||||
| No | 157 | 7.4 | (8.0) | 6.4 | (7.8) | 5.9 | (8.0) | |||
| Yes | 59 | 7.7 | (8.4) | 6.5 | (8.1) | 5.6 | (7.6) | |||
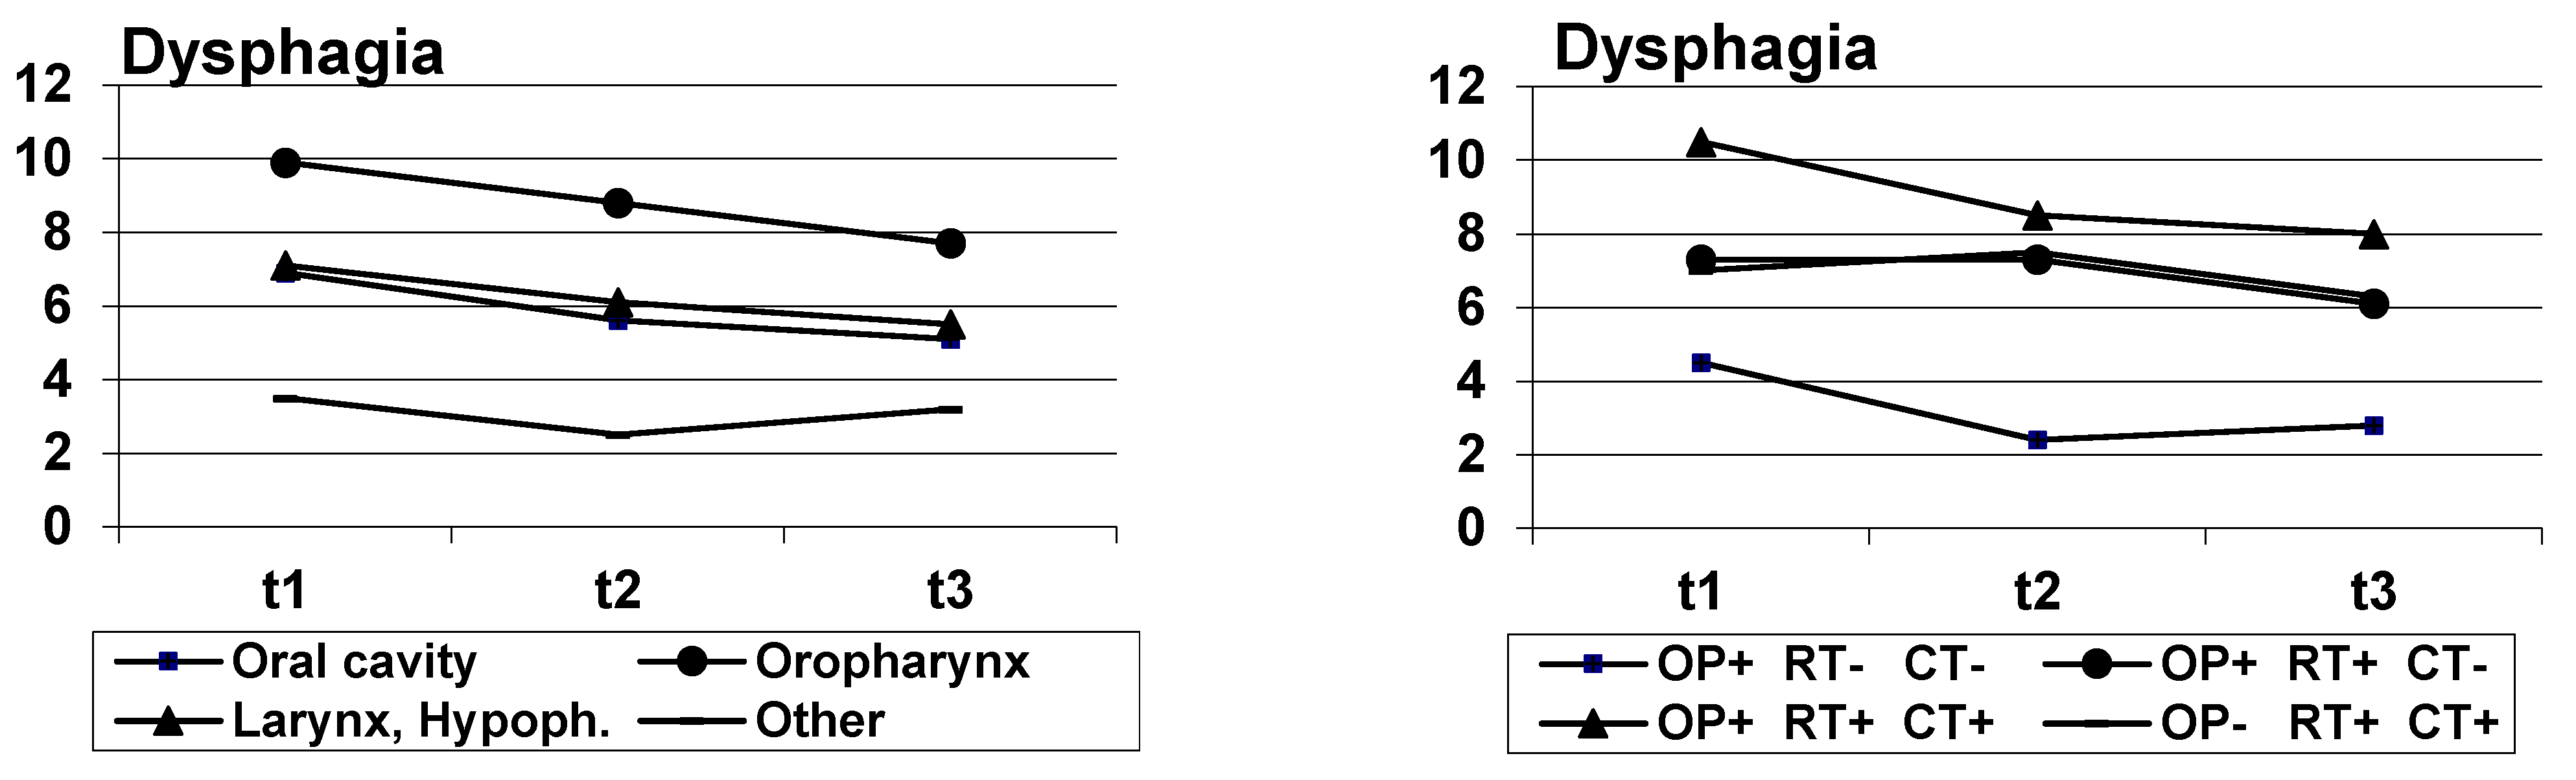
| Tumor | 0.001 | 0.021 | 0.571 | |||||||
| Oral cavity | 35 | 6.9 | (7.9) | 5.6 | (7.8) | 5.1 | (8.5) | |||
| Oropharynx | 80 | 9.9 | (7.7) | 8.8 | (7.8) | 7.7 | (8.4) | |||
| Larynx, Hypopharynx | 64 | 7.1 | (8.9) | 6.1 | (8.4) | 5.5 | (7.5) | |||
| Other | 37 | 3.5 | (5.9) | 2.5 | (5.0) | 3.2 | (5.6) | |||
| Tumor stage | 0.002 | 0.120 | 0.035 | |||||||
| I | 45 | 4.1 | (7.9) | 2.6 | (6.0) | 2.7 | (6.1) | |||
| II | 27 | 4.9 | (5.8) | 7.4 | (9.2) | 5.4 | (7.3) | |||
| III | 35 | 7.0 | (6.8) | 7.2 | (8.5) | 6.9 | (9.5) | |||
| IV | 94 | 10.1 | (8.7) | 7.8 | (7.8) | 7.1 | (8.0) | |||
| Treatment group | 0.001 | 0.008 | 0.606 | |||||||
| 1: OP+ RT- CT- | 59 | 4.5 | (7.6) | 2.4 | (5.3) | 2.8 | (5.7) | |||
| 2: OP+ RT+ CT- | 62 | 7.3 | (7.8) | 7.3 | (8.0) | 6.1 | (7.5) | |||
| 3: OP+ RT+ CT+ | 66 | 10.5 | (8.4) | 8.5 | (8.3) | 8.0 | (8.5) | |||
| 4: OP- RT+ CT+ | 23 | 7.0 | (7.3) | 7.5 | (7.6) | 6.3 | (8.1) | |||
| Metastases | 0.001 | 0.003 | 0.721 | |||||||
| No | 116 | 6.0 | (8.1) | 4.7 | (6.9) | 4.6 | (7.4) | |||
| Yes | 100 | 9.1 | (7.8) | 8.4 | (8.5) | 7.3 | (8.1) | |||
| Tracheotomy | 0.418 | 0.005 | 0.286 | |||||||
| No | 171 | 7.2 | (8.4) | 6.4 | (8.2) | 5.5 | (7.9) | |||
| Yes | 45 | 8.4 | (6.9) | 6.5 | (6.8) | 7.3 | (7.5) | |||
| Feeding tube | 0.054 | 0.001 | 0.295 | |||||||
| No | 165 | 6.7 | (8.0) | 6.0 | (8.1) | 5.4 | (8.0) | |||
| Yes | 51 | 10.0 | (8.1) | 7.9 | (6.9) | 7.2 | (7.3) | |||
| ECOG performance | <0.001 | 0.511 | 0.168 | |||||||
| 0 | 59 | 4.1 | (6.3) | 3.7 | (6.6) | 3.2 | (6.6) | |||
| 1 | 83 | 9.7 | (8.5) | 8.1 | (8.1) | 7.2 | (7.3) | |||
| 2–4 | 9 | 7.8 | (8.5) | 6.8 | (8.4) | 6.0 | (7.8) | |||
| BMI | 0.103 | 0.021 | 0.619 | |||||||
| <20 kg/m² | 27 | 9.9 | (8.7) | 8.5 | (8.5) | 8.4 | (9.6) | |||
| 20–<25 kg/m² | 109 | 8.3 | (8.9) | 6.6 | (7.7) | 6.3 | (8.3) | |||
| 25–<30 kg/m² | 57 | 5.8 | (6.1) | 6.2 | (8.5) | 4.6 | (6.4) | |||
| ≥30 kg/m² | 23 | 5.0 | (7.1) | 3.1 | (5.5) | 3.7 | (5.8) | |||
| n | t1 | t2 | t3 | Significance | ||||||
|---|---|---|---|---|---|---|---|---|---|---|
| M | (SD) | M | (SD) | M | (SD) | Main Effect | Time | Interaction | ||
| Gender | 0.781 | <0.001 | 0.745 | |||||||
| Males | 212 | 48.0 | (35.6) | 39.0 | (33.3) | 37.7 | (34.7) | |||
| Females | 72 | 49.5 | (36.3) | 42.1 | (33.4) | 34.7 | (30.9) | |||
| Age group | 0.681 | <0.001 | 0.166 | |||||||
| ≤59 years | 138 | 47.6 | (33.1) | 40.6 | (32.0) | 36.8 | (32.9) | |||
| 60–69 years | 94 | 50.2 | (36.7) | 42.7 | (32.8) | 38.5 | (33.9) | |||
| ≥70 years | 52 | 47.4 | (40.7) | 31.4 | (37.1) | 34.6 | (36.1) | |||
| Occupational state | 0.001 | <0.001 | 0.336 | |||||||
| Not occupied | 208 | 52.3 | (36.2) | 42.7 | (34.2) | 41.1 | (34.7) | |||
| Occupied | 76 | 37.7 | (32.1) | 32.7 | (29.9) | 25.7 | (27.9) | |||
| Alcohol consumption | 0.162 | <0.001 | 0.766 | |||||||
| No | 212 | 50.6 | (35.6) | 40.9 | (32.8) | 38.5 | (34.0) | |||
| Yes | 72 | 42.1 | (35.4) | 36.8 | (34.6) | 32.4 | (32.6) | |||
| Tobacco consumption | 0.654 | <0.001 | 0.196 | |||||||
| No | 206 | 49.3 | (35.6) | 39.1 | (33.0) | 38.2 | (33.7) | |||
| Yes | 78 | 46.2 | (36.0) | 41.5 | (34.3) | 33.8 | (33.7) | |||
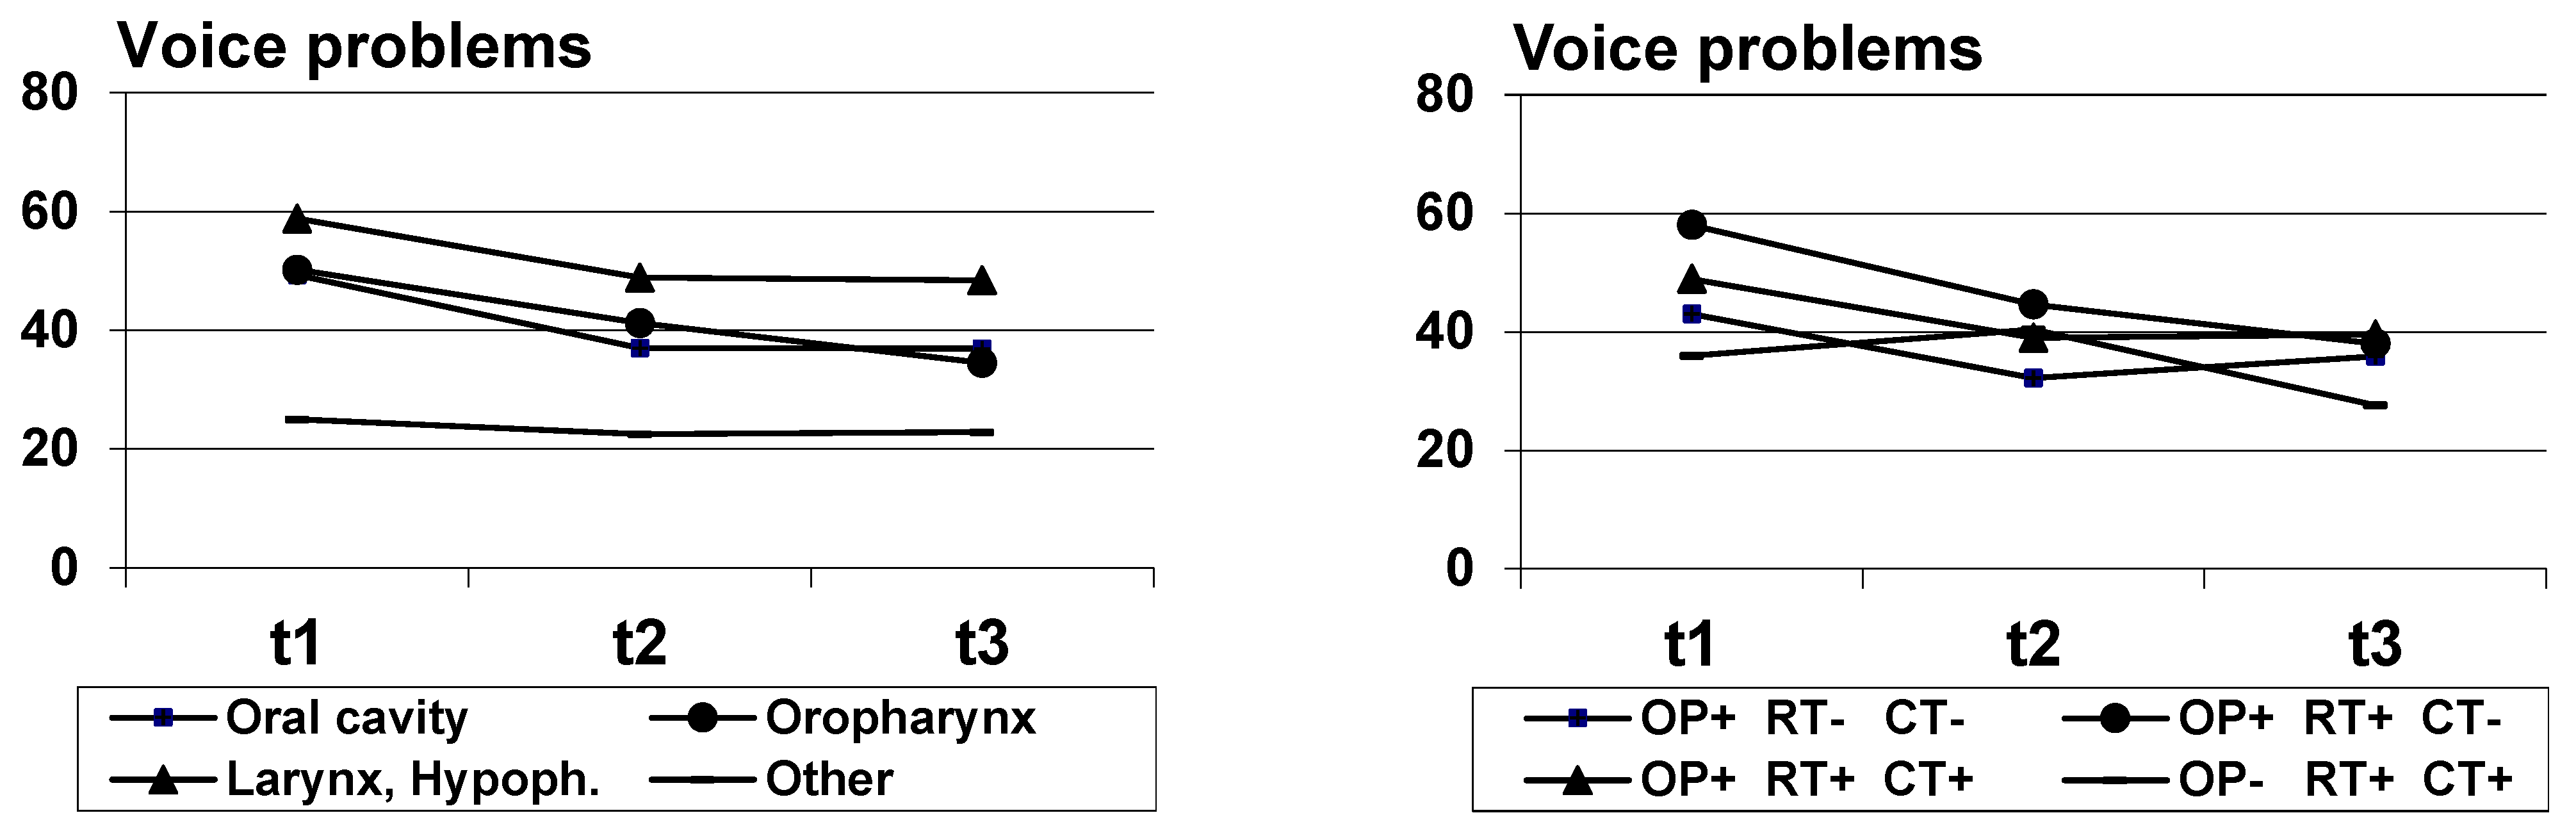
| Tumor | <0.001 | <0.001 | 0.424 | |||||||
| Oral cavity | 47 | 49.3 | (33.0) | 37.0 | (31.5) | 36.9 | (33.3) | |||
| Oropharynx | 110 | 50.2 | (34.6) | 41.2 | (32.5) | 34.5 | (34.1) | |||
| Larynx, Hypopharynx | 81 | 58.8 | (33.2) | 48.9 | (36.1) | 48.4 | (33.3) | |||
| Other | 46 | 25.0 | (35.4) | 22.5 | (27.4) | 22.8 | (28.0) | |||
| Tumor stage | 0.065 | <0.001 | 0.140 | |||||||
| I | 50 | 40 | (33.3) | 28.3 | (30.3) | 31.7 | (31.1) | |||
| II | 31 | 47.3 | (39.0) | 47.0 | (37.4) | 40.3 | (33.0) | |||
| III | 49 | 42.2 | (32.3) | 42.0 | (30.4) | 30.3 | (32.8) | |||
| IV | 133 | 54.6 | (35.8) | 41.5 | (34.3) | 41.1 | (34.9) | |||
| Treatment group | 0.104 | <0.001 | 0.003 | |||||||
| 1: OP+ RT- CT- | 67 | 43.0 | (36.4) | 32.2 | (34.5) | 35.8 | (33.0) | |||
| 2: OP+ RT+ CT- | 79 | 58.0 | (35.4) | 44.6 | (33.9) | 38.0 | (34.8) | |||
| 3: OP+ RT+ CT+ | 92 | 48.9 | (32.7) | 39.0 | (31.7) | 39.5 | (33.8) | |||
| 4: OP- RT+ CT+ | 38 | 36.0 | (36.9) | 40.4 | (32.3) | 27.6 | (30.3) | |||
| Metastases | 0.466 | <0.001 | 0.807 | |||||||
| No | 147 | 45.7 | (35.7) | 39.0 | (33.3) | 35.8 | (34.1) | |||
| Yes | 137 | 51.3 | (35.5) | 40.7 | (33.3) | 38.2 | (33.4) | |||
| Tracheotomy | <0.001 | <0.001 | 0.006 | |||||||
| No | 202 | 40.3 | (34.1) | 35.0 | (31.4) | 29.3 | (30.3) | |||
| Yes | 82 | 68.5 | (31.4) | 50.9 | (35.1) | 55.9 | (34.5) | |||
| Feeding tube | 0.003 | <0.001 | 0.142 | |||||||
| No | 178 | 42.0 | (35.0) | 37.3 | (32.3) | 32.9 | (32.8) | |||
| Yes | 104 | 59.3 | (34.3) | 44.3 | (34.5) | 43.7 | (33.8) | |||
| ECOG performance | <0.001 | <0.001 | 0.568 | |||||||
| 0 | 67 | 38.6 | (34.6) | 30.1 | (31.3) | 24.9 | (29.5) | |||
| 1 | 110 | 50.2 | (33.3) | 45.0 | (33.1) | 41.7 | (32.9) | |||
| 2–4 | 25 | 74.0 | (28.1) | 60.5 | (36.5) | 52.7 | (38.4) | |||
| BMI | 0.017 | <0.001 | 0.196 | |||||||
| <20 kg/m² | 49 | 55.8 | (35.3) | 52.7 | (33.3) | 41.2 | (33.7) | |||
| 20–<25 kg/m² | 142 | 44.8 | (35.6) | 36.6 | (31.0) | 36.0 | (33.2) | |||
| 25–<30 kg/m² | 68 | 50.7 | (34.8) | 44.6 | (35.2) | 39.5 | (35.3) | |||
| ≥30 kg/m² | 25 | 48.0 | (38.3) | 20.5 | (30.8) | 27.3 | (32.2) | |||
| n | t1 | t2 | t3 | Significance | ||||||
|---|---|---|---|---|---|---|---|---|---|---|
| M | (SD) | M | (SD) | M | (SD) | Main Effect | Time | Interaction | ||
| Gender | 0.593 | 0.001 | 0.518 | |||||||
| Males | 218 | 2.38 | (2.24) | 1.95 | (2.14) | 1.76 | (2.27) | |||
| Females | 76 | 2.46 | (2.44) | 1.93 | (1.80) | 1.95 | (1.95) | |||
| Age group | 0.072 | <0.001 | 0.817 | |||||||
| ≤59 years | 142 | 2.61 | (2.29) | 2.24 | (2.16) | 2.08 | (2.27) | |||
| 60–69 years | 96 | 2.42 | (2.27) | 1.67 | (1.89) | 1.65 | (2.15) | |||
| ≥70 years | 56 | 1.86 | (2.28) | 1.60 | (2.00) | 1.39 | (2.00) | |||
| Occupational state | 0.249 | <0.001 | 0.472 | |||||||
| Not occupied | 215 | 2.45 | (2.37) | 2.01 | (2.17) | 1.95 | (2.35) | |||
| Occupied | 79 | 2.28 | (2.06) | 1.78 | (1.76) | 1.43 | (1.62) | |||
| Alcohol consumption | 0.510 | <0.001 | 0.330 | |||||||
| No | 221 | 2.42 | (2.27) | 2.00 | (2.06) | 1.91 | (2.29) | |||
| Yes | 72 | 2.39 | (2.36) | 1.80 | (2.06) | 1.50 | (1.85) | |||
| Tobacco consumption | 0.024 | 0.002 | 0.530 | |||||||
| No | 213 | 2.32 | (2.21) | 1.77 | (1.89) | 1.62 | (2.07) | |||
| Yes | 80 | 2.65 | (2.50) | 2.42 | (2.40) | 2.32 | (2.44) | |||
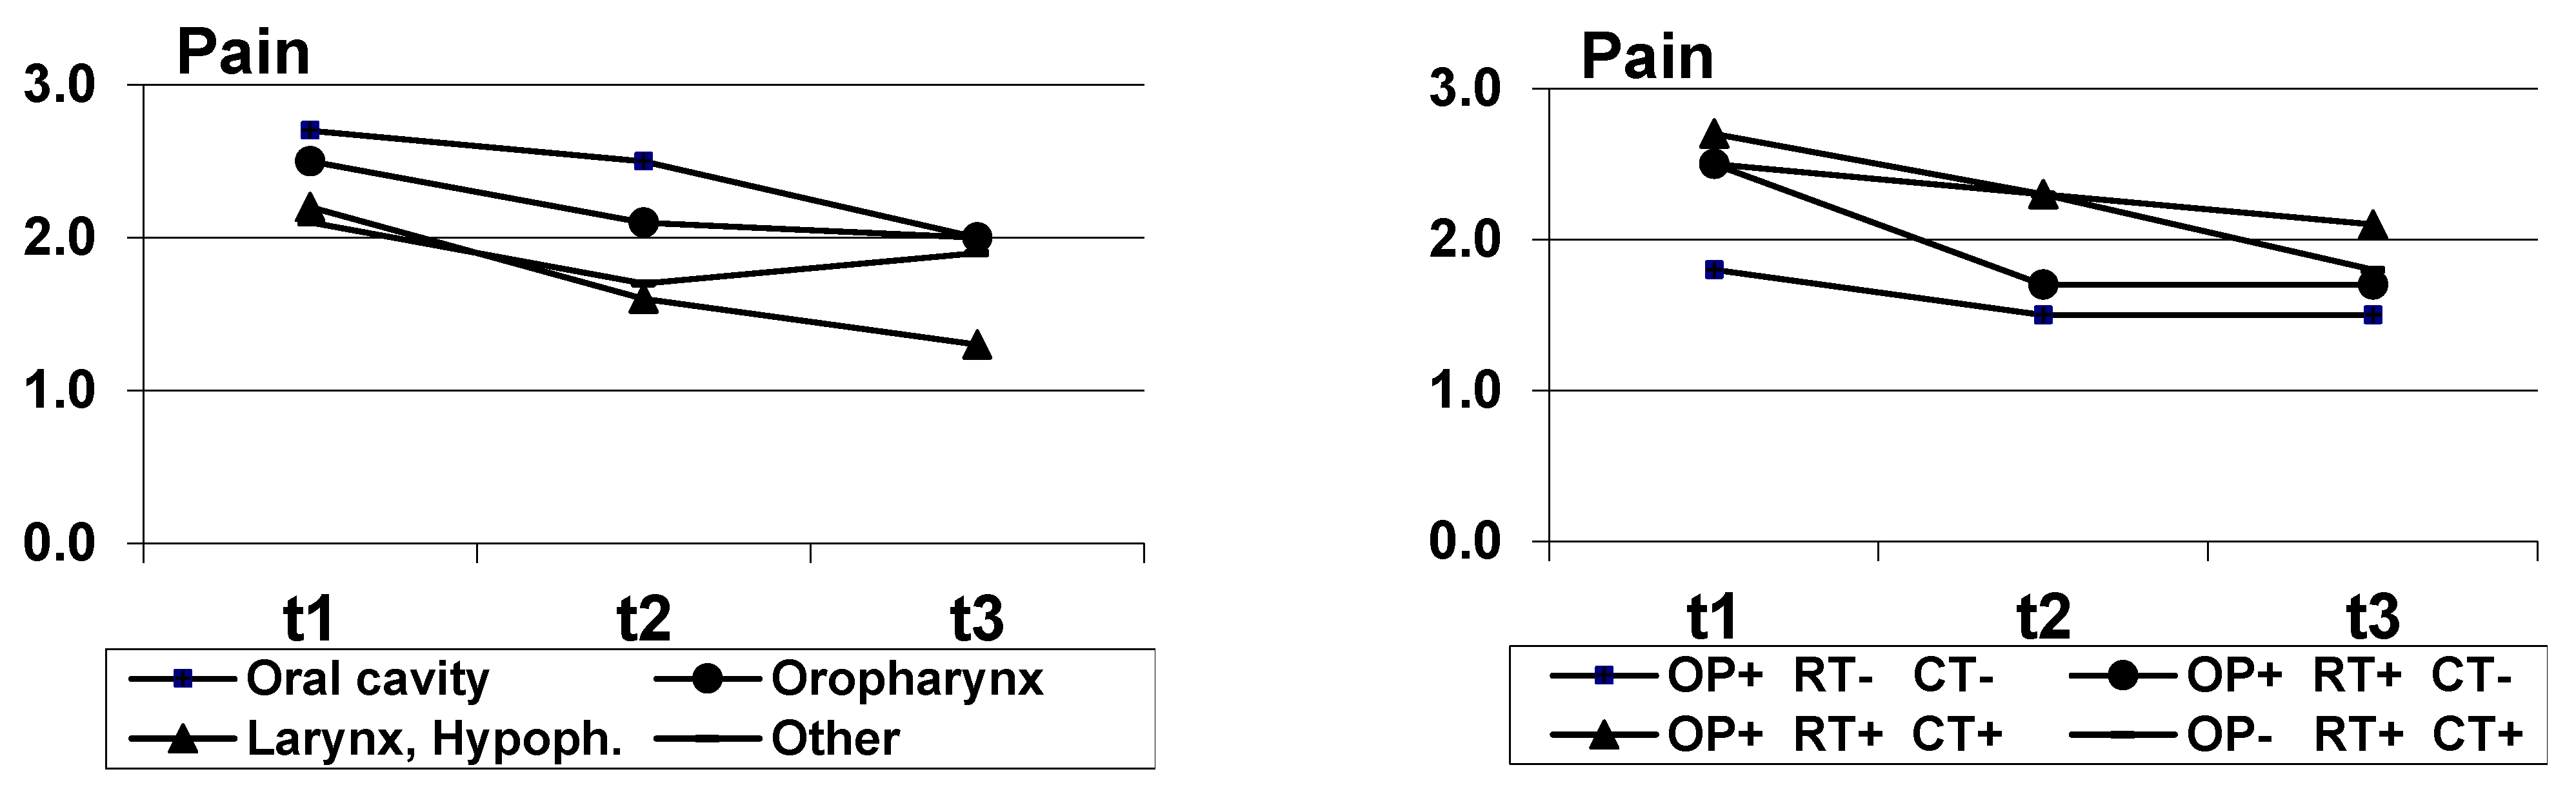
| Tumor | 0.226 | <0.001 | 0.577 | |||||||
| Oral cavity | 47 | 2.66 | (2.34) | 2.46 | (2.27) | 1.96 | (2.33) | |||
| Oropharynx | 115 | 2.53 | (2.11) | 2.06 | (2.05) | 2.03 | (2.18) | |||
| Larynx, Hypopharynx | 82 | 2.23 | (2.39) | 1.64 | (2.10) | 1.33 | (1.94) | |||
| Other | 50 | 2.14 | (2.49) | 1.73 | (1.75) | 1.94 | (2.40) | |||
| Tumor stage | 0.211 | 0.004 | 0.443 | |||||||
| I | 52 | 1.62 | (1.94) | 1.65 | (1.90) | 1.42 | (1.87) | |||
| II | 32 | 1.84 | (1.82) | 1.68 | (2.24) | 1.62 | (1.83) | |||
| III | 49 | 2.45 | (2.48) | 2.07 | (2.19) | 1.88 | (2.32) | |||
| IV | 140 | 2.76 | (2.30) | 2.05 | (2.06) | 1.79 | (2.16) | |||
| Treatment group | 0.083 | <0.001 | 0.708 | |||||||
| 1: OP+ RT- CT- | 69 | 1.81 | (2.11) | 1.48 | (1.83) | 1.48 | (1.86) | |||
| 2: OP+ RT+ CT- | 80 | 2.51 | (2.42) | 1.74 | (2.03) | 1.74 | (2.19) | |||
| 3: OP+ RT+ CT+ | 98 | 2.68 | (2.28) | 2.27 | (2.23) | 2.13 | (2.37) | |||
| 4: OP- RT+ CT+ | 39 | 2.51 | (2.32) | 2.29 | (1.87) | 1.77 | (2.21) | |||
| Metastases | 0.123 | <0.001 | 0.438 | |||||||
| No | 152 | 2.25 | (2.36) | 1.73 | (1.95) | 1.57 | (1.97) | |||
| Yes | 142 | 2.56 | (2.21) | 2.18 | (2.16) | 2.06 | (2.39) | |||
| Tracheotomy | 0.464 | <0.001 | 0.095 | |||||||
| No | 208 | 2.32 | (2.21) | 1.98 | (2.06) | 1.66 | (2.08) | |||
| Yes | 86 | 2.59 | (2.48) | 1.85 | (2.07) | 2.16 | (2.41) | |||
| Feeding tube | 0.074 | <0.001 | 0.045 | |||||||
| No | 184 | 2.08 | (2.01) | 1.93 | (2.08) | 1.59 | (2.00) | |||
| Yes | 109 | 2.97 | (2.61) | 1.99 | (2.02) | 2.18 | (2.45) | |||
| ECOG performance | 0.107 | 0.001 | 0.118 | |||||||
| 0 | 67 | 1.91 | (2.04) | 1.84 | (1.90) | 1.46 | (1.96) | |||
| 1 | 115 | 2.16 | (2.20) | 1.79 | (1.89) | 1.89 | (2.05) | |||
| 2–4 | 27 | 3.78 | (2.56) | 2.48 | (2.19) | 2.19 | (2.42) | |||
| BMI | 0.290 | 0.002 | 0.703 | |||||||
| <20 kg/m² | 50 | 2.90 | (2.66) | 2.38 | (2.56) | 2.26 | (2.55) | |||
| 20–<25 kg/m² | 147 | 2.41 | (2.36) | 1.82 | (2.08) | 1.92 | (2.34) | |||
| 25–<30 kg/m² | 72 | 2.26 | (2.00) | 1.97 | (1.96) | 1.49 | (1.64) | |||
| ≥30 kg/m² | 25 | 1.76 | (1.71) | 1.74 | (1.79) | 1.20 | (1.71) | |||
| At t1 t2 t3 | Number of Patients | Percent | At t1 t2 t3 | Number of Patients | Percent | ||
|---|---|---|---|---|---|---|---|
| Feeding tube (- no, + yes) | - - - | 165 | 60.4 | Tracheostomy (- no, + yes) | - - - | 184 | 66.4 |
| - - + | 2 | 0.7 | - + - | 3 | 1.1 | ||
| - + - | 2 | 0.7 | - + + | 6 | 2.2 | ||
| - + + | 5 | 1.8 | + - - | 29 | 10.5 | ||
| + - - | 39 | 14.3 | + - + | 3 | 1.1 | ||
| + + - | 16 | 5.9 | + + - | 10 | 3.6 | ||
| + + + | 44 | 16.1 | + + + | 42 | 15.2 |
Publisher’s Note: MDPI stays neutral with regard to jurisdictional claims in published maps and institutional affiliations. |
© 2021 by the authors. Licensee MDPI, Basel, Switzerland. This article is an open access article distributed under the terms and conditions of the Creative Commons Attribution (CC BY) license (http://creativecommons.org/licenses/by/4.0/).
Share and Cite
Zebralla, V.; Wiegand, S.; Dietz, A.; Wichmann, G.; Neumuth, T.; Mehnert-Theuerkauf, A.; Hinz, A. Course of Self-Reported Dysphagia, Voice Impairment and Pain in Head and Neck Cancer Survivors. Biology 2021, 10, 144. https://doi.org/10.3390/biology10020144
Zebralla V, Wiegand S, Dietz A, Wichmann G, Neumuth T, Mehnert-Theuerkauf A, Hinz A. Course of Self-Reported Dysphagia, Voice Impairment and Pain in Head and Neck Cancer Survivors. Biology. 2021; 10(2):144. https://doi.org/10.3390/biology10020144
Chicago/Turabian StyleZebralla, Veit, Susanne Wiegand, Andreas Dietz, Gunnar Wichmann, Thomas Neumuth, Anja Mehnert-Theuerkauf, and Andreas Hinz. 2021. "Course of Self-Reported Dysphagia, Voice Impairment and Pain in Head and Neck Cancer Survivors" Biology 10, no. 2: 144. https://doi.org/10.3390/biology10020144
APA StyleZebralla, V., Wiegand, S., Dietz, A., Wichmann, G., Neumuth, T., Mehnert-Theuerkauf, A., & Hinz, A. (2021). Course of Self-Reported Dysphagia, Voice Impairment and Pain in Head and Neck Cancer Survivors. Biology, 10(2), 144. https://doi.org/10.3390/biology10020144