Article

Circadian Gene PER2 Silencing Downregulates PPARG and SREBF1 and Suppresses Lipid Synthesis in Bovine Mammary Epithelial Cells

1
State Key Laboratory of Sheep Genetic Improvement and Healthy Production, Xinjiang Academy of Agricultural Reclamation Sciences, Shihezi 832000, China
2
College of Animal Science and Technology, Yangzhou University, Yangzhou 225009, China
3
Department of Animal Sciences and Division of Nutritional Sciences, University of Illinois, Urbana, IL 61801, USA
*
Authors to whom correspondence should be addressed.
Biology 2021, 10(12), 1226; https://doi.org/10.3390/biology10121226
Submission received: 26 September 2021 / Revised: 12 November 2021 / Accepted: 17 November 2021 / Published: 24 November 2021

Abstract

:

Simple Summary

The present study was constructed to determine the effects of the core circadian clock gene, Period 2 (PER2), on lipid synthesis in bovine mammary epithelial cells (BMECs). Data revealed that PER2-regulated genes were involved in fatty acid de novo synthesis, desaturation, TAG accumulation, and lipid droplet secretion in primary BMECs, partly by inhibiting PPARG and SREBF1. Our overall data suggests that PER2 in bovine mammary cells plays a role in regulating milk fat synthesis directly, or via the activation of the transcription regulators PPARG and SREBF1. This study provides molecular evidence underscoring a link between the circadian clock and lipid metabolism in bovines.

Abstract

PER2, a circadian clock gene, is associated with mammary gland development and lipid synthesis in rodents, partly via regulating peroxisome proliferator-activated receptor gamma (PPARG). Whether such a type of molecular link existed in bovines was unclear. We hypothesized that PER2 was associated with lipid metabolism and regulated cell cycles and apoptosis in bovine mammary epithelial cells (BMECs). To test this hypothesis, BMECs isolated from three mid-lactation (average 110 d postpartum) cows were used. The transient transfection of small interfering RNA (siRNA) was used to inhibit PER2 transcription in primary BMECs. The silencing of PER2 led to lower concentrations of cellular lipid droplets and triacylglycerol along with the downregulation of lipogenic-related genes such as ACACA, FASN, LPIN1, and SCD, suggesting an overall inhibition of lipogenesis and desaturation. The downregulation of PPARG and SREBF1 in response to PER2 silencing underscored the importance of circadian clock signaling and the transcriptional regulation of lipogenesis. Although the proliferation of BMECs was not influenced by PER2 silencing, the number of cells in the G2/GM phase was upregulated. PER2 silencing did not affect cell apoptosis. Overall, the data provided evidence that PER2 participated in the coordination of mammary lipid metabolism and was potentially a component of the control of lipid droplets and TAG synthesis in ruminant mammary cells. The present data suggested that such an effect could occur through direct effects on transcriptional regulators.

Graphical Abstract

1. Introduction

In non-ruminants, peripheral clocks exhibit a rhythmic oscillation with autonomic rhythms in almost all peripheral tissues and organs, including the mammary gland [1,2,3]. In the bovine mammary gland, there is also evidence that a number of circadian rhythm genes, some of which have well-known metabolic roles, play a key role in mammary gland function [4,5].
In cows, indirect evidence indicates that endogenous circadian clock systems could represent important control points of the biological rhythms associated with physiology and biochemistry. For example, rectal temperatures, respiratory rates, plasma concentrations of metabolites (glucose, urea, and cholesterol) [6], and concentrations of the growth hormones [7] prolactin [8] and cortisone [9] exhibit circadian oscillations in lactating cows. The synthesis of milk components also appears to follow a rhythmic pattern, which can be regulated, in part, by a circadian mechanism [10,11,12].
In rodents, Period circadian regulator 2 (PER2), a core circadian clock gene, plays a role in lipid metabolism. PER1/2-deficient mice have reduced liver TG levels [13], suggesting that PER could be involved in lipid metabolism. Another study in a rat model revealed that PER2 controls lipid metabolism via targeting PPARG expression [14]. Thus, PER2 might represent a novel control point in the bovine mammary lipid metabolism. The PER2 gene is not only associated with lipid metabolism, but it also shares inextricable molecular links with cell cycle oscillators [15,16]. In non-ruminants, the synchronized physiological signals of the circadian clock could lead to cell aggregation and division [17], indicating that the cell cycle is synchronized by the circadian clock. Although data supports an important role for PER2 in lipid metabolism, such effects, and the molecular mechanisms in bovine mammary epithelial cells (BMECs), are largely unknown.
In the present study, we hypothesized that PER2 regulated lipid metabolism and was potentially associated with cell cycle control in BMECs. To test this hypothesis, small interfering RNA (siRNA) was used to silence PER2 expression in primary BMECs. We investigated the role of PER2 on cell cycle activity and lipid synthesis at a transcription level, aiming to provide molecular evidence to support the link between the circadian clock and lipid metabolism in the bovine.

2. Materials and Methods

2.1. The Isolation and Culture of Primary BMECs

The use of animals and the experimental procedures were approved by the Ethical Committee of Yangzhou University, Jiangsu Province, China (Approval Code: SYXK (Su)2021-0026). Three mid-lactation (average 110 ± 5 d in milk (DIM) and 34.6 ± 0.5 kg/d of milk) cows from the Yangzhou University dairy farm were used. Bovine mammary tissue was obtained using a published mammary biopsy method [18] and was washed thoroughly with PBS, containing 100 IU/mL of penicillin/streptomycin (Sigma-Aldrich, St. Louis, MO, USA). Primary BMECs were harvested by isolation and purification using 0.25% collagenase (Gibco, Grand Island, NY, USA) digestion as described by Hu et al. (2017) [19]. Cells were cultured in DMEM-F12 (Dubecco’s Modified Eagle Medium Nutrient Mixture F-12 (Ham), Gibco, Grand Island, NY, USA) containing 10% fetal bovine serum (Gibco, Grand Island, NY, USA), 50 IU/mL of prolactin (Gibco, Grand Island, NY, USA), 1 μg/mL of cortisol (Gibco, Grand Island, NY, USA), 0.5 μL/mL of Insulin–Transferrin–Selenium (ITS-G; Gibco, Grand Island, NY, USA), 10 ng/mL of the Epidermal Growth Factor (EGF; Peprotech, Rocky Hill, NJ, USA), 100 IU/mL of penicillin, 0.2 mg/mL of streptomycin (Sigma-Aldrich, St. Louis, MO, USA), and 2.5 ug/mL of amphotericin B (Solarbio, Beijing, China). Cells were routinely cultured at 37 °C with 5% CO2.

2.2. Cell Transfection

Small interfering RNA (siRNA) was used to inhibit PER2 expression in primary BMECs. The primary BMECs were transfected with three siRNAs, targeting the PER2 gene at 0, 12, 24, 36, 48, and 60 h, to screen for optimal siRNA and its transfection time point. The real-time PCR was employed to determine the transfection efficiency.
The primary BMECs were divided into a PER2 silencing group and a non-transfected group (without transfection, blank control). Negative siRNA was used as negative control during the real-time PCR. SiRNA and negative siRNA was synthesized by GenePharma Co., Ltd., (Genepharma Co., Ltd, Shanghai, China) and the sequences are listed in Table S1. The transfection protocol was as follows: primary BMECs were inoculated onto 24-well plates until reaching 70–80% confluence. Subsequently, the siRNA was transfected using a Transfection Reagent Kit (ViewSold Biotech, Beijing, China) according to the manufacturer’s protocol.

2.3. RNA Extraction and RT-PCR

Total RNA was extracted from BMECs with the TRIzol reagent (TIANGEN, Beijing, China) and was quantified by spectrophotometry at 260 nm using a NanoDrop 1000 spectrophotometer (NanoDrop Technologies, Wilmington, DE, USA). First-strand cDNA was synthesized with the FastQuant RT Kit (No. KR106, TIANGEN, Beijing, China) according to the manufacturer’s instructions. The primer sequences for the target and internal reference genes were designed with Oligo 6 (Table S2) and were synthetized by Invitrogen Biotechnology Co., Ltd. (Invitrogen Biotechnology Co., Ltd, Shanghai, China).
The RT-PCR was conducted with the SuperReal PreMix Plus (SYBR Green, No. FP215) from TIANGEN Biotech Co., Ltd. (TIANGEN Biotech Co., Ltd, Beijing, China) in an Applied Biosystems 7500 Real-Time PCR System (USA) to determine the relative expression of the target genes. Reactions were as follows: 15 min at 95 °C, followed by 10 s at 95 °C, and then 32 s at 60 °C, for 40 cycles. Each sample was run in triplicate. The relative gene expression was calculated with the 2−ΔΔCt method.

2.4. The Cell Proliferation Activity, Cell Cycles, and Apoptosis Assays

The primary BMECs on 24-well plates were exposed to PER2 siRNA and the cell proliferation activity at 12, 24, and 36 h-transfections determined using the Cell Counting Kit-8 (CCK8, Dojindo, Japan) according to the manufacturer’s protocols. After 12, 24, and 36 h-transfection, the culture medium was aspirated and the cells were rinsed with PBS and cultured with DMEM-F12, containing a 10% CCK8, for 1.5 h. A 200 μL-culture medium was transferred to 96-well plates to determine absorbance at 450 nm with an MD-SpectraMax M5 plate reader (Molecular Devices Corporation, Sunnyvale, CA, USA).
The cell cycle was assessed with the Cell Cycle and Apoptosis Analysis Kit (C1062, Beyotime, Shanghai, China). The cellular DNA content was quantified via flow cytometry (FACS LSRFortessa, BD, USA) at a 488 nm wavelength and was analyzed with the FlowJo software. The proliferation index (PI) was calculated as: PI = (S + G2/M)/(G0/G1 + S + G2/M) × 100%. Apoptosis was monitored by FITC-conjugated antibodies with Annexin V, using the Annexin V-FITC Apoptosis Detection Kit (C1062, Beyotime, Shanghai, China). Apoptotic cell numbers were determined by FACS LSRFortessa (BD, USA) as described in the manufacturer’s protocols. The expression of the apoptosis-related genes caspase-3, caspase-8, and P53 was determined by the real-time PCR and the primers listed in Table S2.

2.5. Triacylglycerol Content and Lipid Droplet Determination

The lipid droplet content was determined with red oil O (Sigma, USA). Briefly, transfected cells were fixed in formaldehyde at 4 °C for 1 h and stained with 0.5% oil red O overnight at room temperature. Subsequently, samples were washed with 60% isopropyl alcohol several times. The lipid droplet content was quantified via counting under an inverted microscope (Olympus, Tokyo, Japan, CKX41). To quantify the lipid droplet density, each oil red O optical density (OD) value at 500 nm was measured, after de-staining with isopropanol for 30 min, using a MD-SpectraMax M5 plate reader (Molecular Devices Corporation, CA, USA).
The triacylglycerol (TAG) content in primary BMECs was determined with the Tissue Triglyceride Assay Kit (Applygen, Beijing, China) following the manufacturer’s instructions. The specific steps were as follows: cells were lysed and centrifuged at 2000× g for 5 min to harvest the supernatant. The supernatant was incubated at 70 °C for 10 min and was then collected for an enzyme activity measurement. The samples, and a 4 mM glycerol standard at different dilutions, were measured at 550 nm with a microplate reader. The TAG content in samples was calculated using a standard curve, following the manufacturer’s protocols.
To investigate lipogenesis at the transcription level, the gene expressions of PPARG, SREBF1, mTOR, ACACA, FAS, LPIN1, SCD, and LPL were determined using the real-time PCR. Primers for these genes are listed in Table S2.

2.6. Statistical Analyses

SPSS software version 22.0 was used for statistical analyses. Each experiment was performed in triplicate on different days with three experimental replicates at each time. Differences in cell cycles, cell apoptosis, and lipid synthesis between the PER2 silenced and non-transfected groups were analyzed via a Student’s t test. The differences in the target gene expression between PER2 silencing, the negative control, and the non-transfected group were evaluated by a one-way ANOVA. Statistical significance was declared at p < 0.05.

3. Results

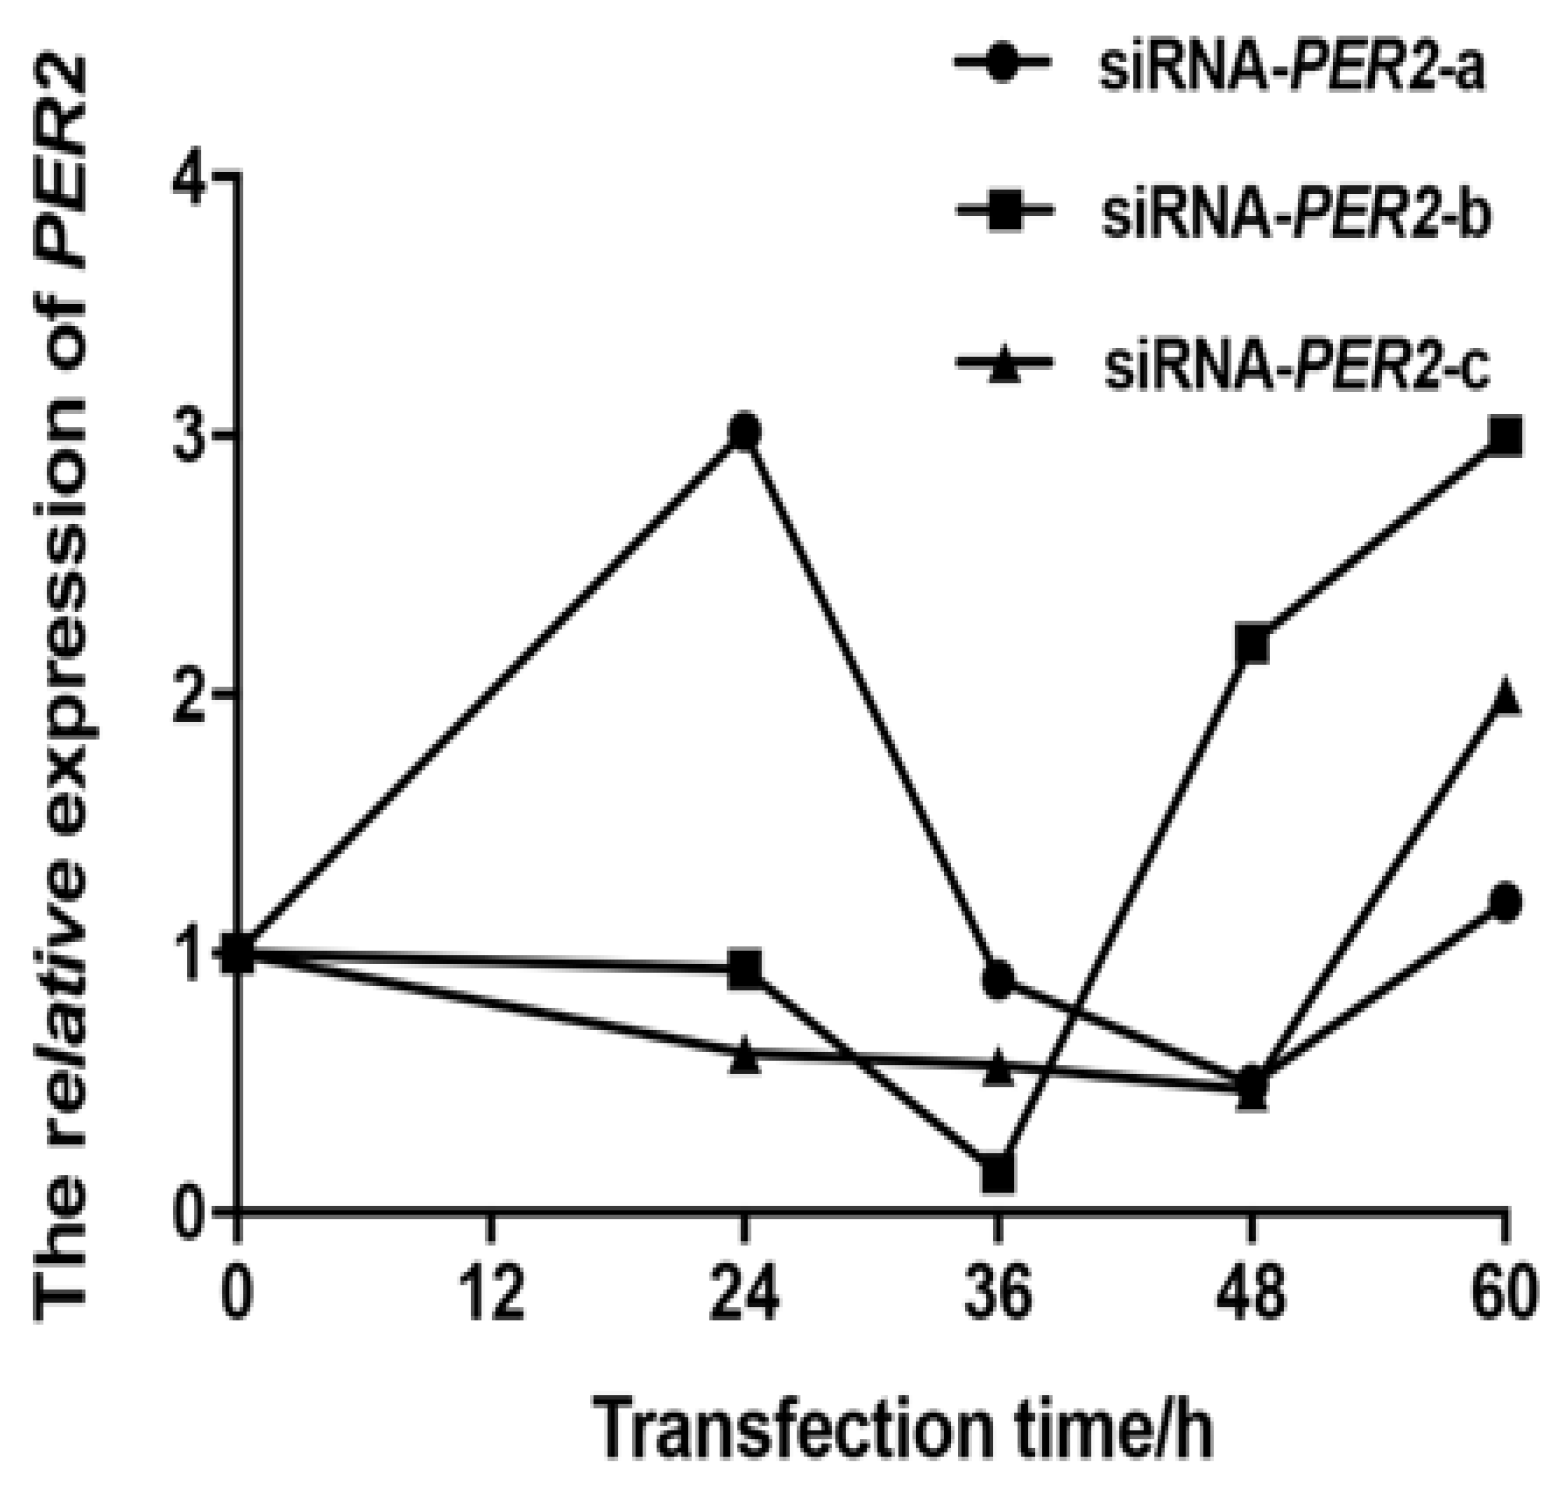
3.1. Screening for Transfection Efficiency

The BMECs transfected with siRNA-PER2-b for 36 h had the lowest PER2 mRNA abundance, with an 84.7% inhibitory effect compared to normal BMECs (0 h) (Figure 1). Thus, all subsequent tests involving PER2 silencing were performed using BMECs transfected with siRNA-PER2-b for 36 h.

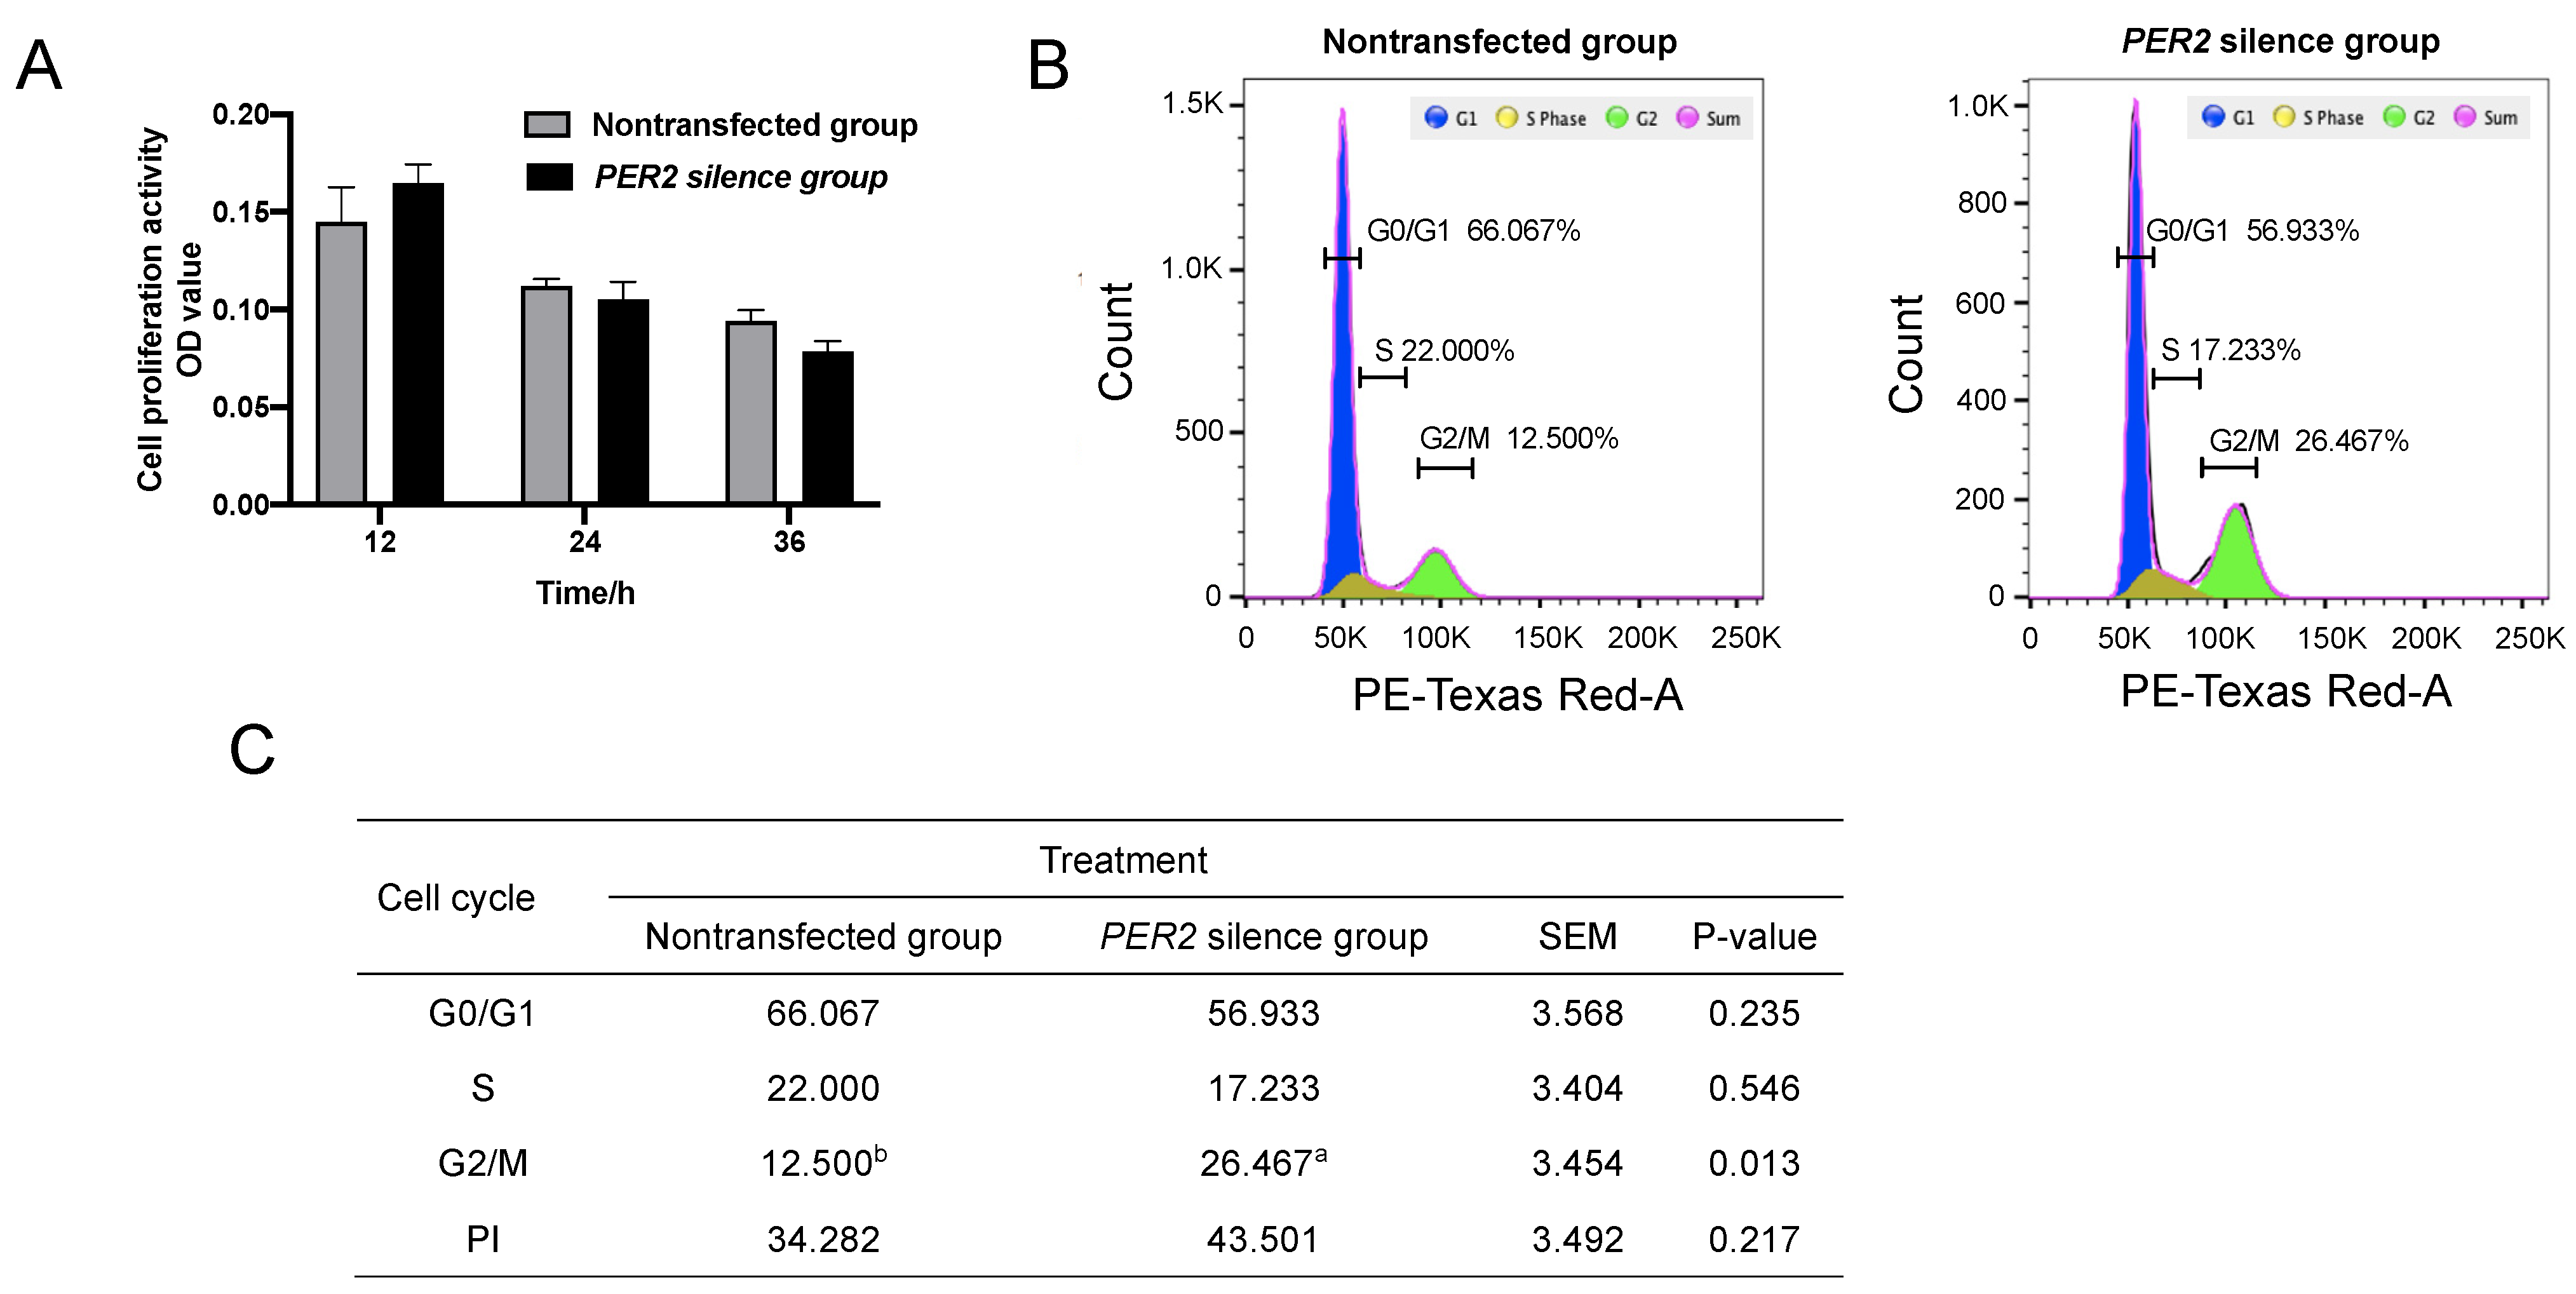
3.2. The Cell Proliferation Activity and Cell Cycles
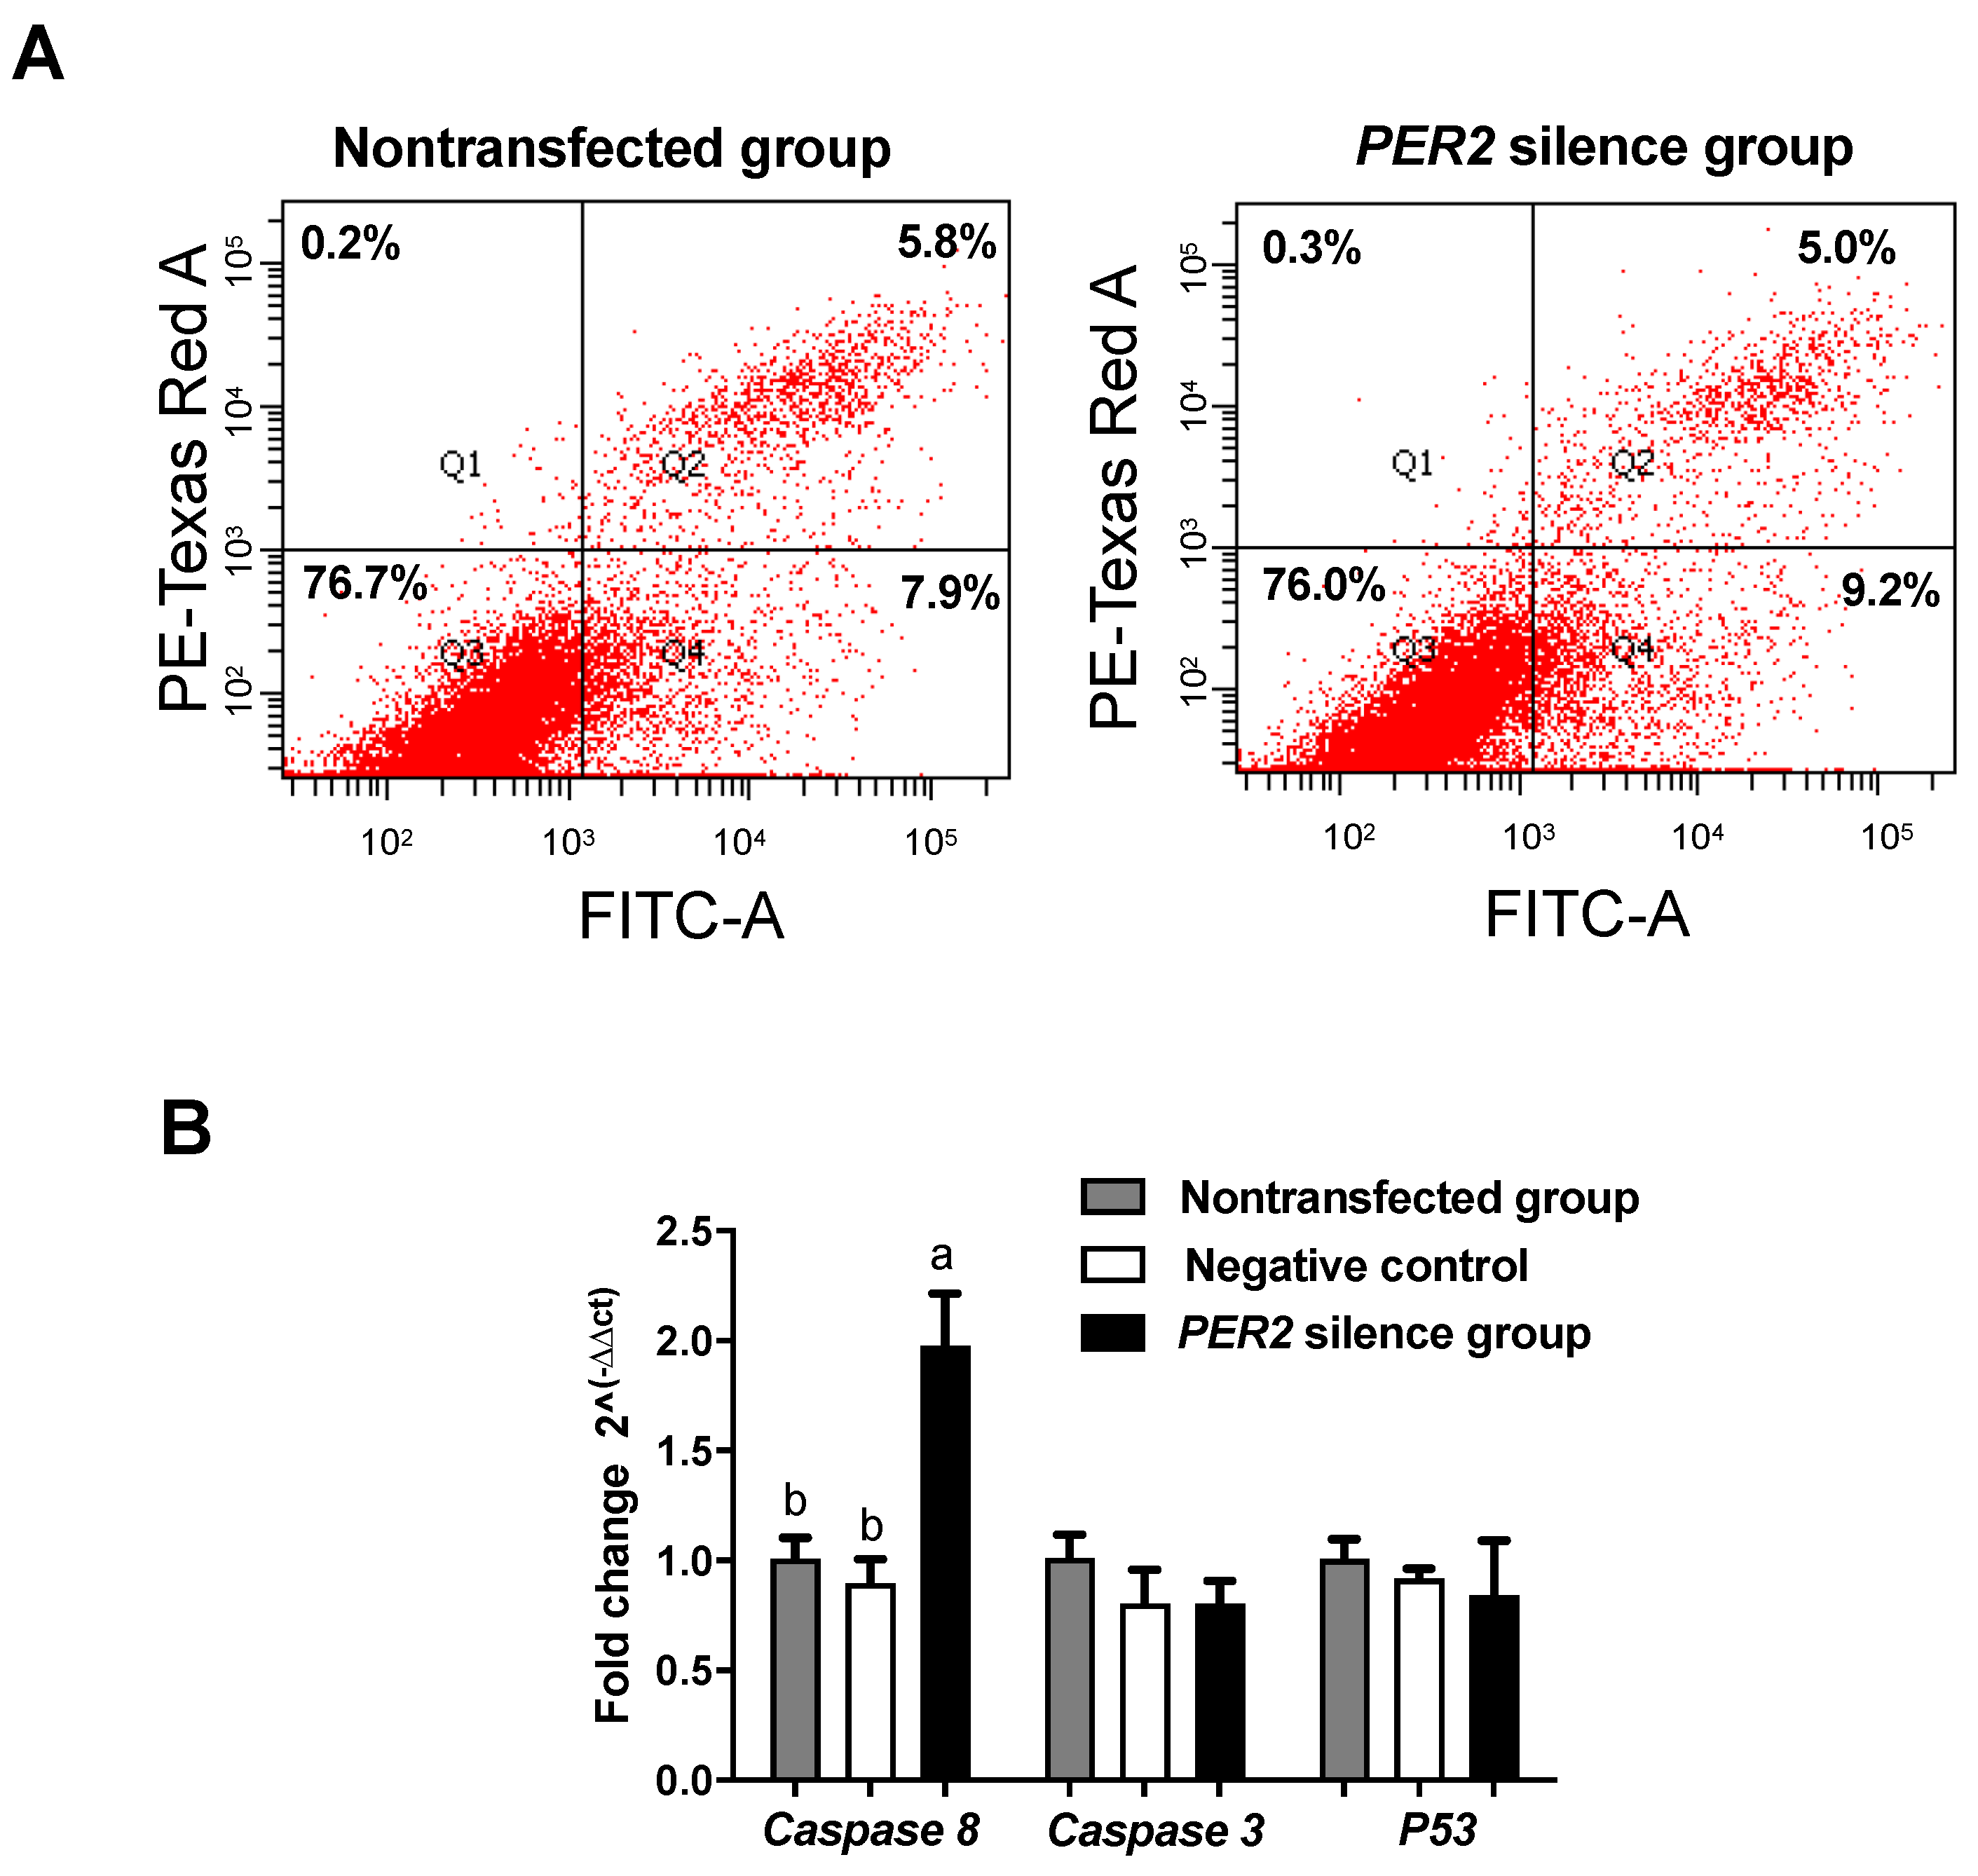
The cell proliferation activity did not differ after the transfection of PER2-siRNA for 12, 24, and 36 h (p > 0.05) (Figure 2A). Based on the cell cycle analysis (Figure 2B,C), PER2 silencing increased cell numbers in the G2/M phase (p < 0.05), but there was no significant effect on cells in the G0/G1 and S phases (p > 0.05). The proliferation index (PI) was higher in the PER2 silence group (43.501%) than the non-transfected group (34.282%), but there was no significant difference (p > 0.05).

3.3. Cell Apoptosis

The cell apoptosis index (the proportion of apoptotic cells among the total counted cells) was not affected by PER2 silencing (p > 0.05) (Figure 3A). Among the genes measured (Figure 3B), caspase-8 mRNA expression was upregulated by PER2 silencing (p < 0.05), but its downstream gene, caspase-3, did not differ between the groups (p > 0.05). This indicated that PER2 silencing might have upregulated caspase-8 but failed to drive caspase-3 expression, hence preventing an increase in apoptosis.

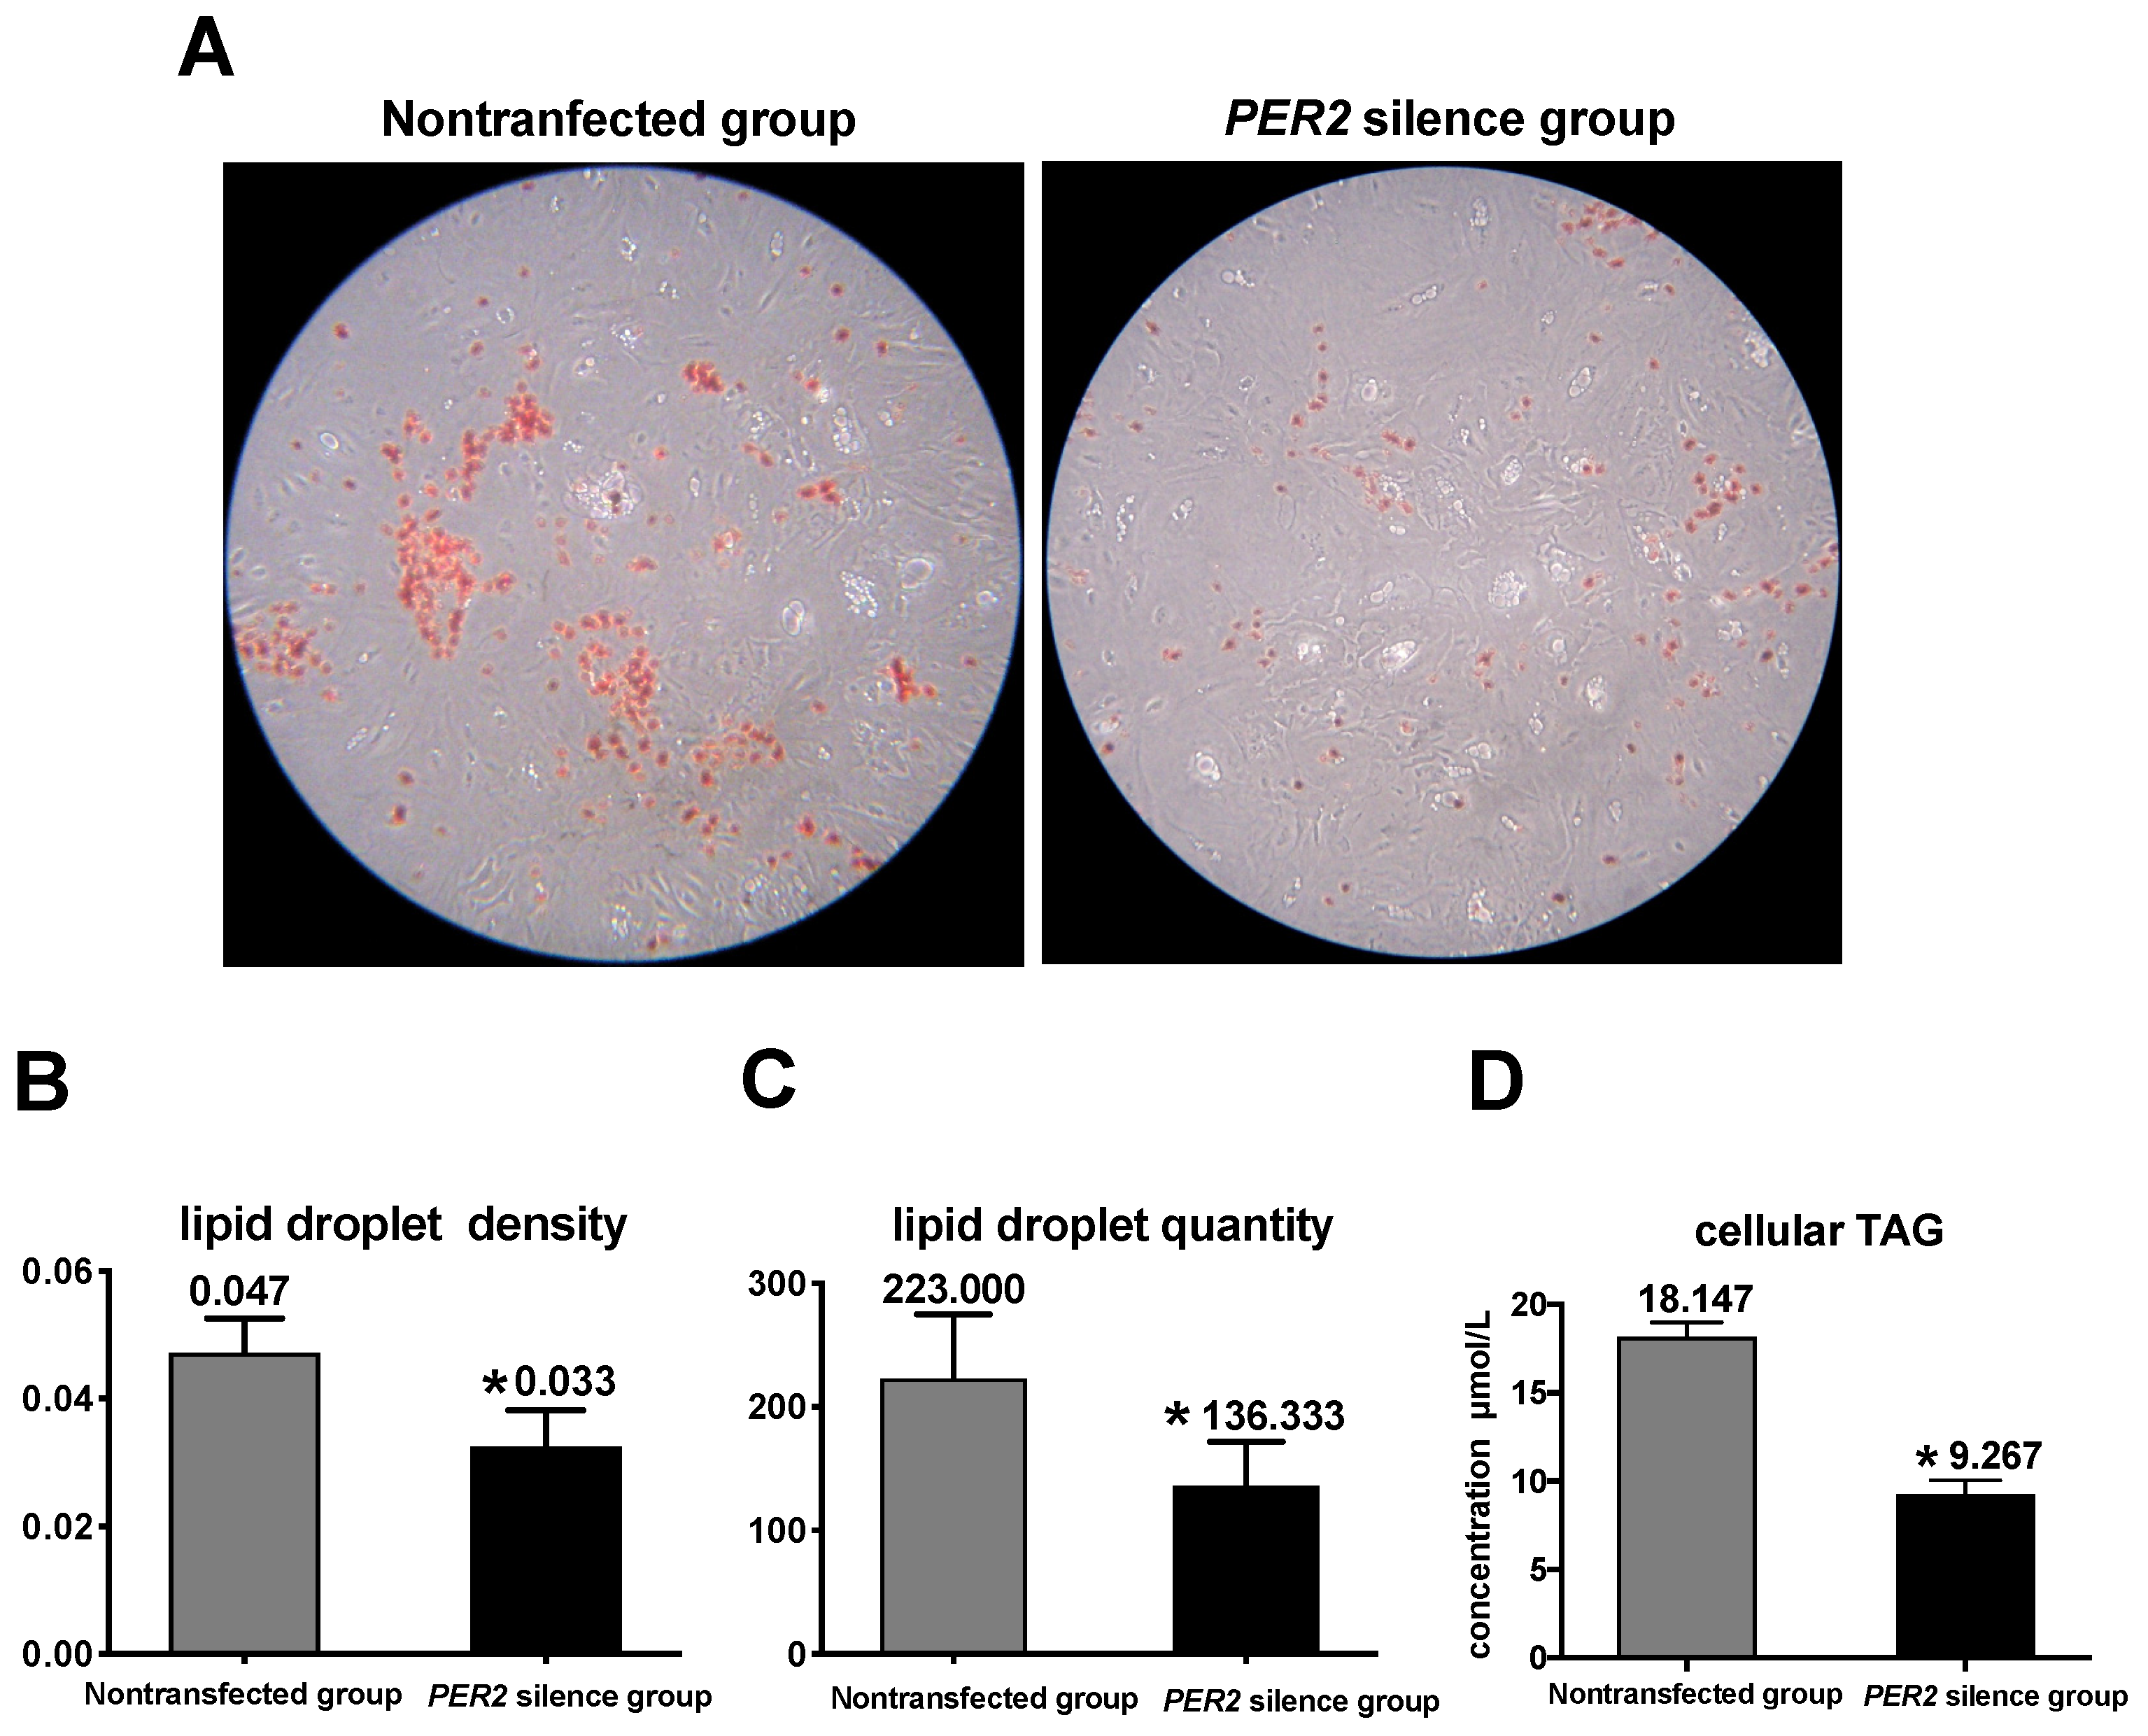
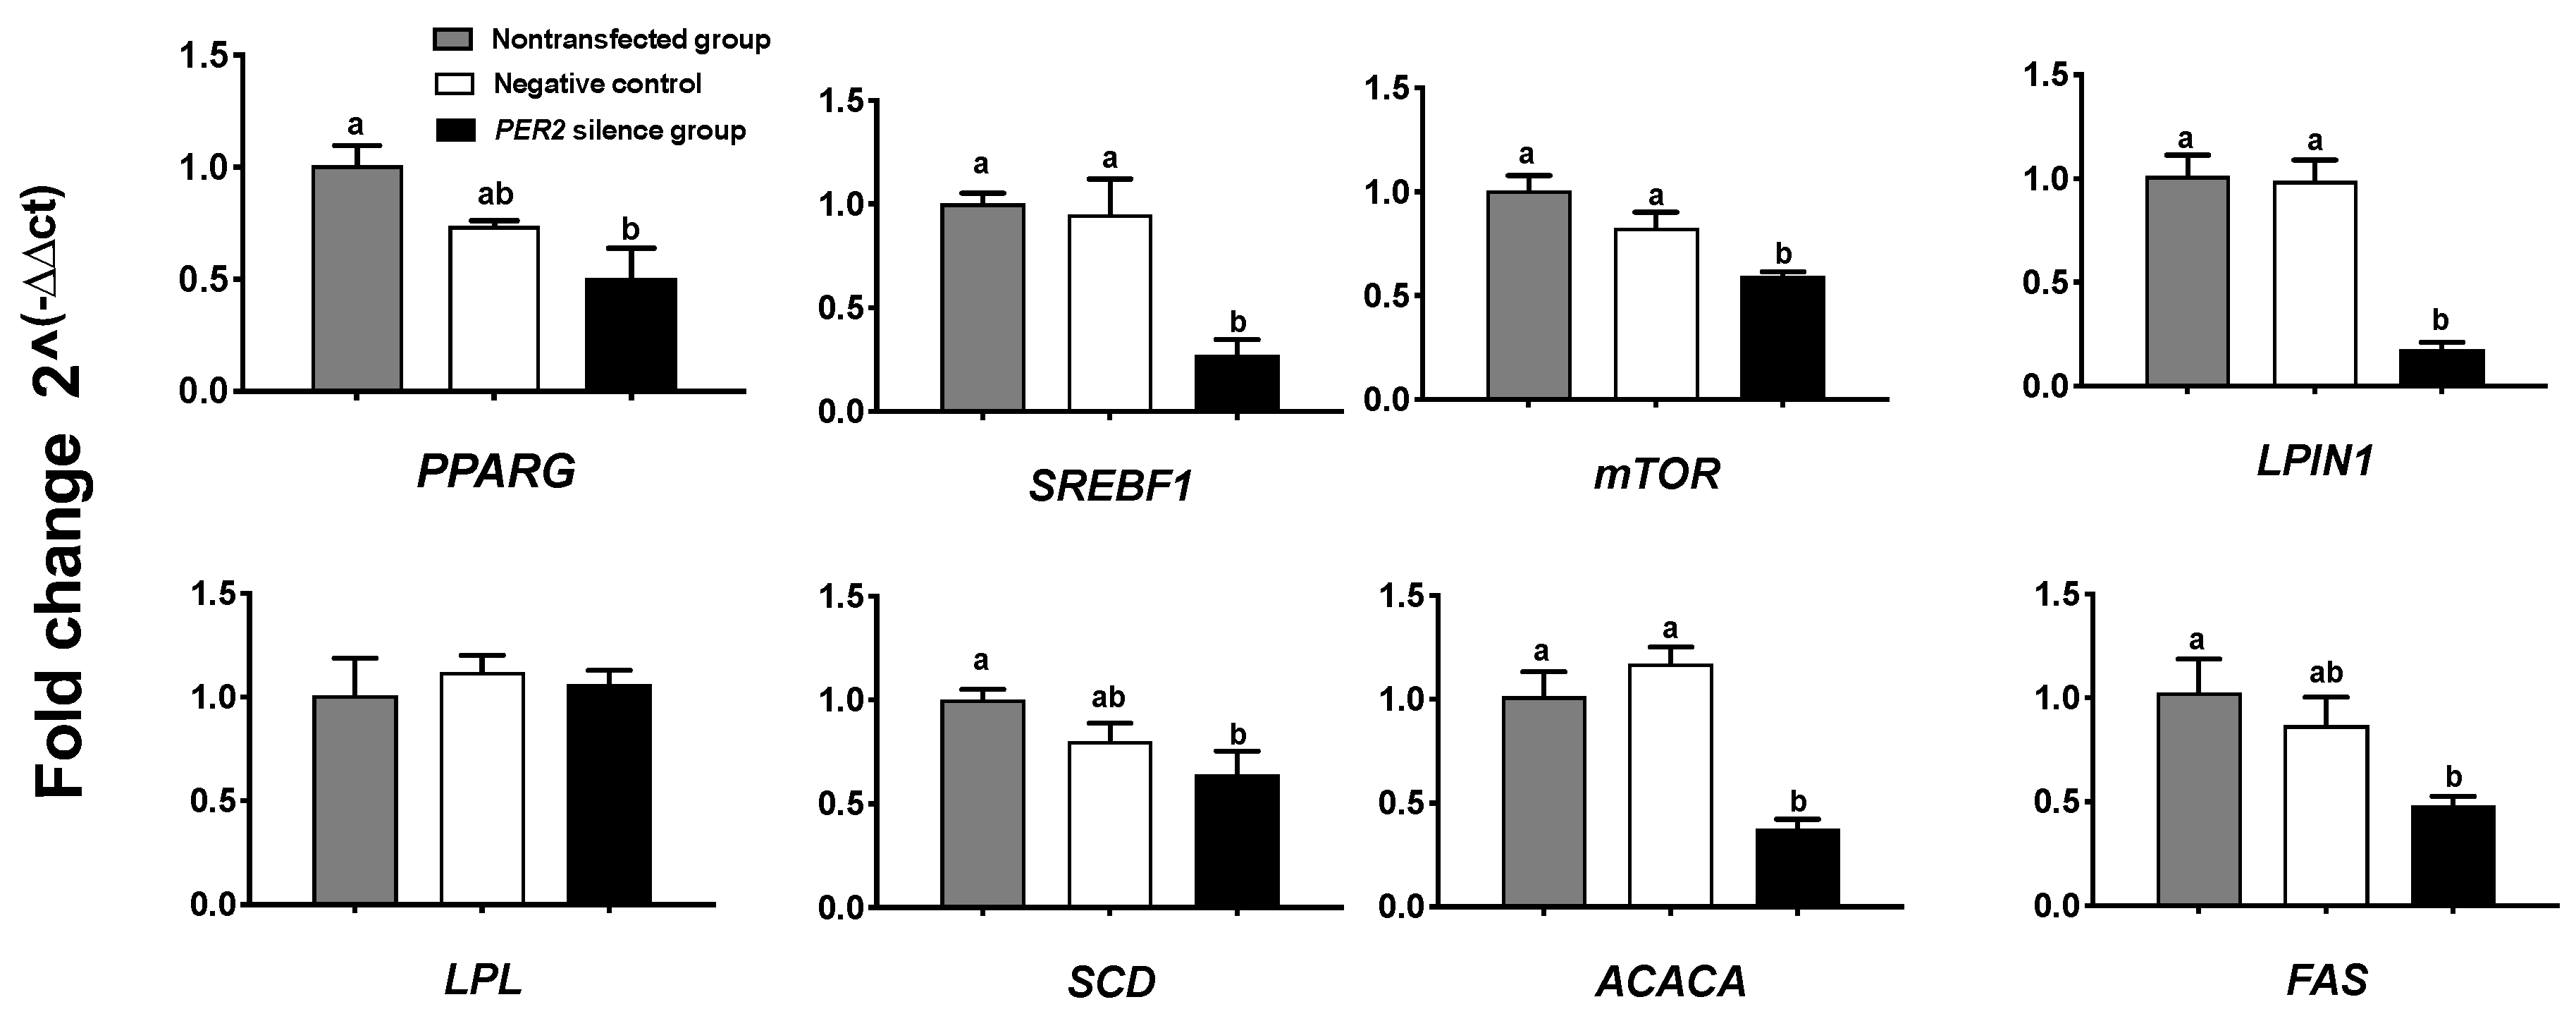
3.4. Lipid Synthesis

The concentrations of triacylglycerol, lipid droplets, and lipogenic gene expressions were measured as indicators of lipid sythesis. Figure 4A depicts lipid droplets in BMECs by oil red O staining. In comparison with the non-transfected group, PER2 silencing led to a 29.8% decrease in lipid droplet density and 38.86% decrease in lipid droplet quantity (p < 0.05) (Figure 4B,C). Furthermore, the cellular triacylglycerol concentration (p < 0.05) significantly decreased by 48.93% after PER2 silencing (Figure 4D). At the transcription level, the expression of the lipid transcription regulators PPARG and SREBF1 was downregulated after PER2 silencing in comparison with the non-transfected group (p < 0.05). The expression of the lipid synthesis-related genes (Figure 5) mTOR, ACACA, FAS, LPIN1, and SCD was downregulated by PER2 silencing (p < 0.05), while LPL mRNA expression was not affected (p > 0.05).

4. Discussion

The milk fat content in dairy cows follows a rhythmic pattern and is thought to be regulated by circadian rhythms. The present study was an investigation to better understand the role of the clock gene PER2 on milk fat synthesis gene networks in BMECs. We employed PER2 silencing experiments in BMECs and observed that PER2 silencing led to a significant inhibition of lipid synthesis-related gene expression. A PER2 silencing model was proposed based on the results from the present study (Figure 6). The findings suggest that PER2 participates in the coordination of mammary lipid metabolism and may be a component of the control of lipid synthesis in ruminant mammary cells. Thus, these data provide an important reference to molecular links between the circadian clock and lipid metabolism in bovine mammary cells.

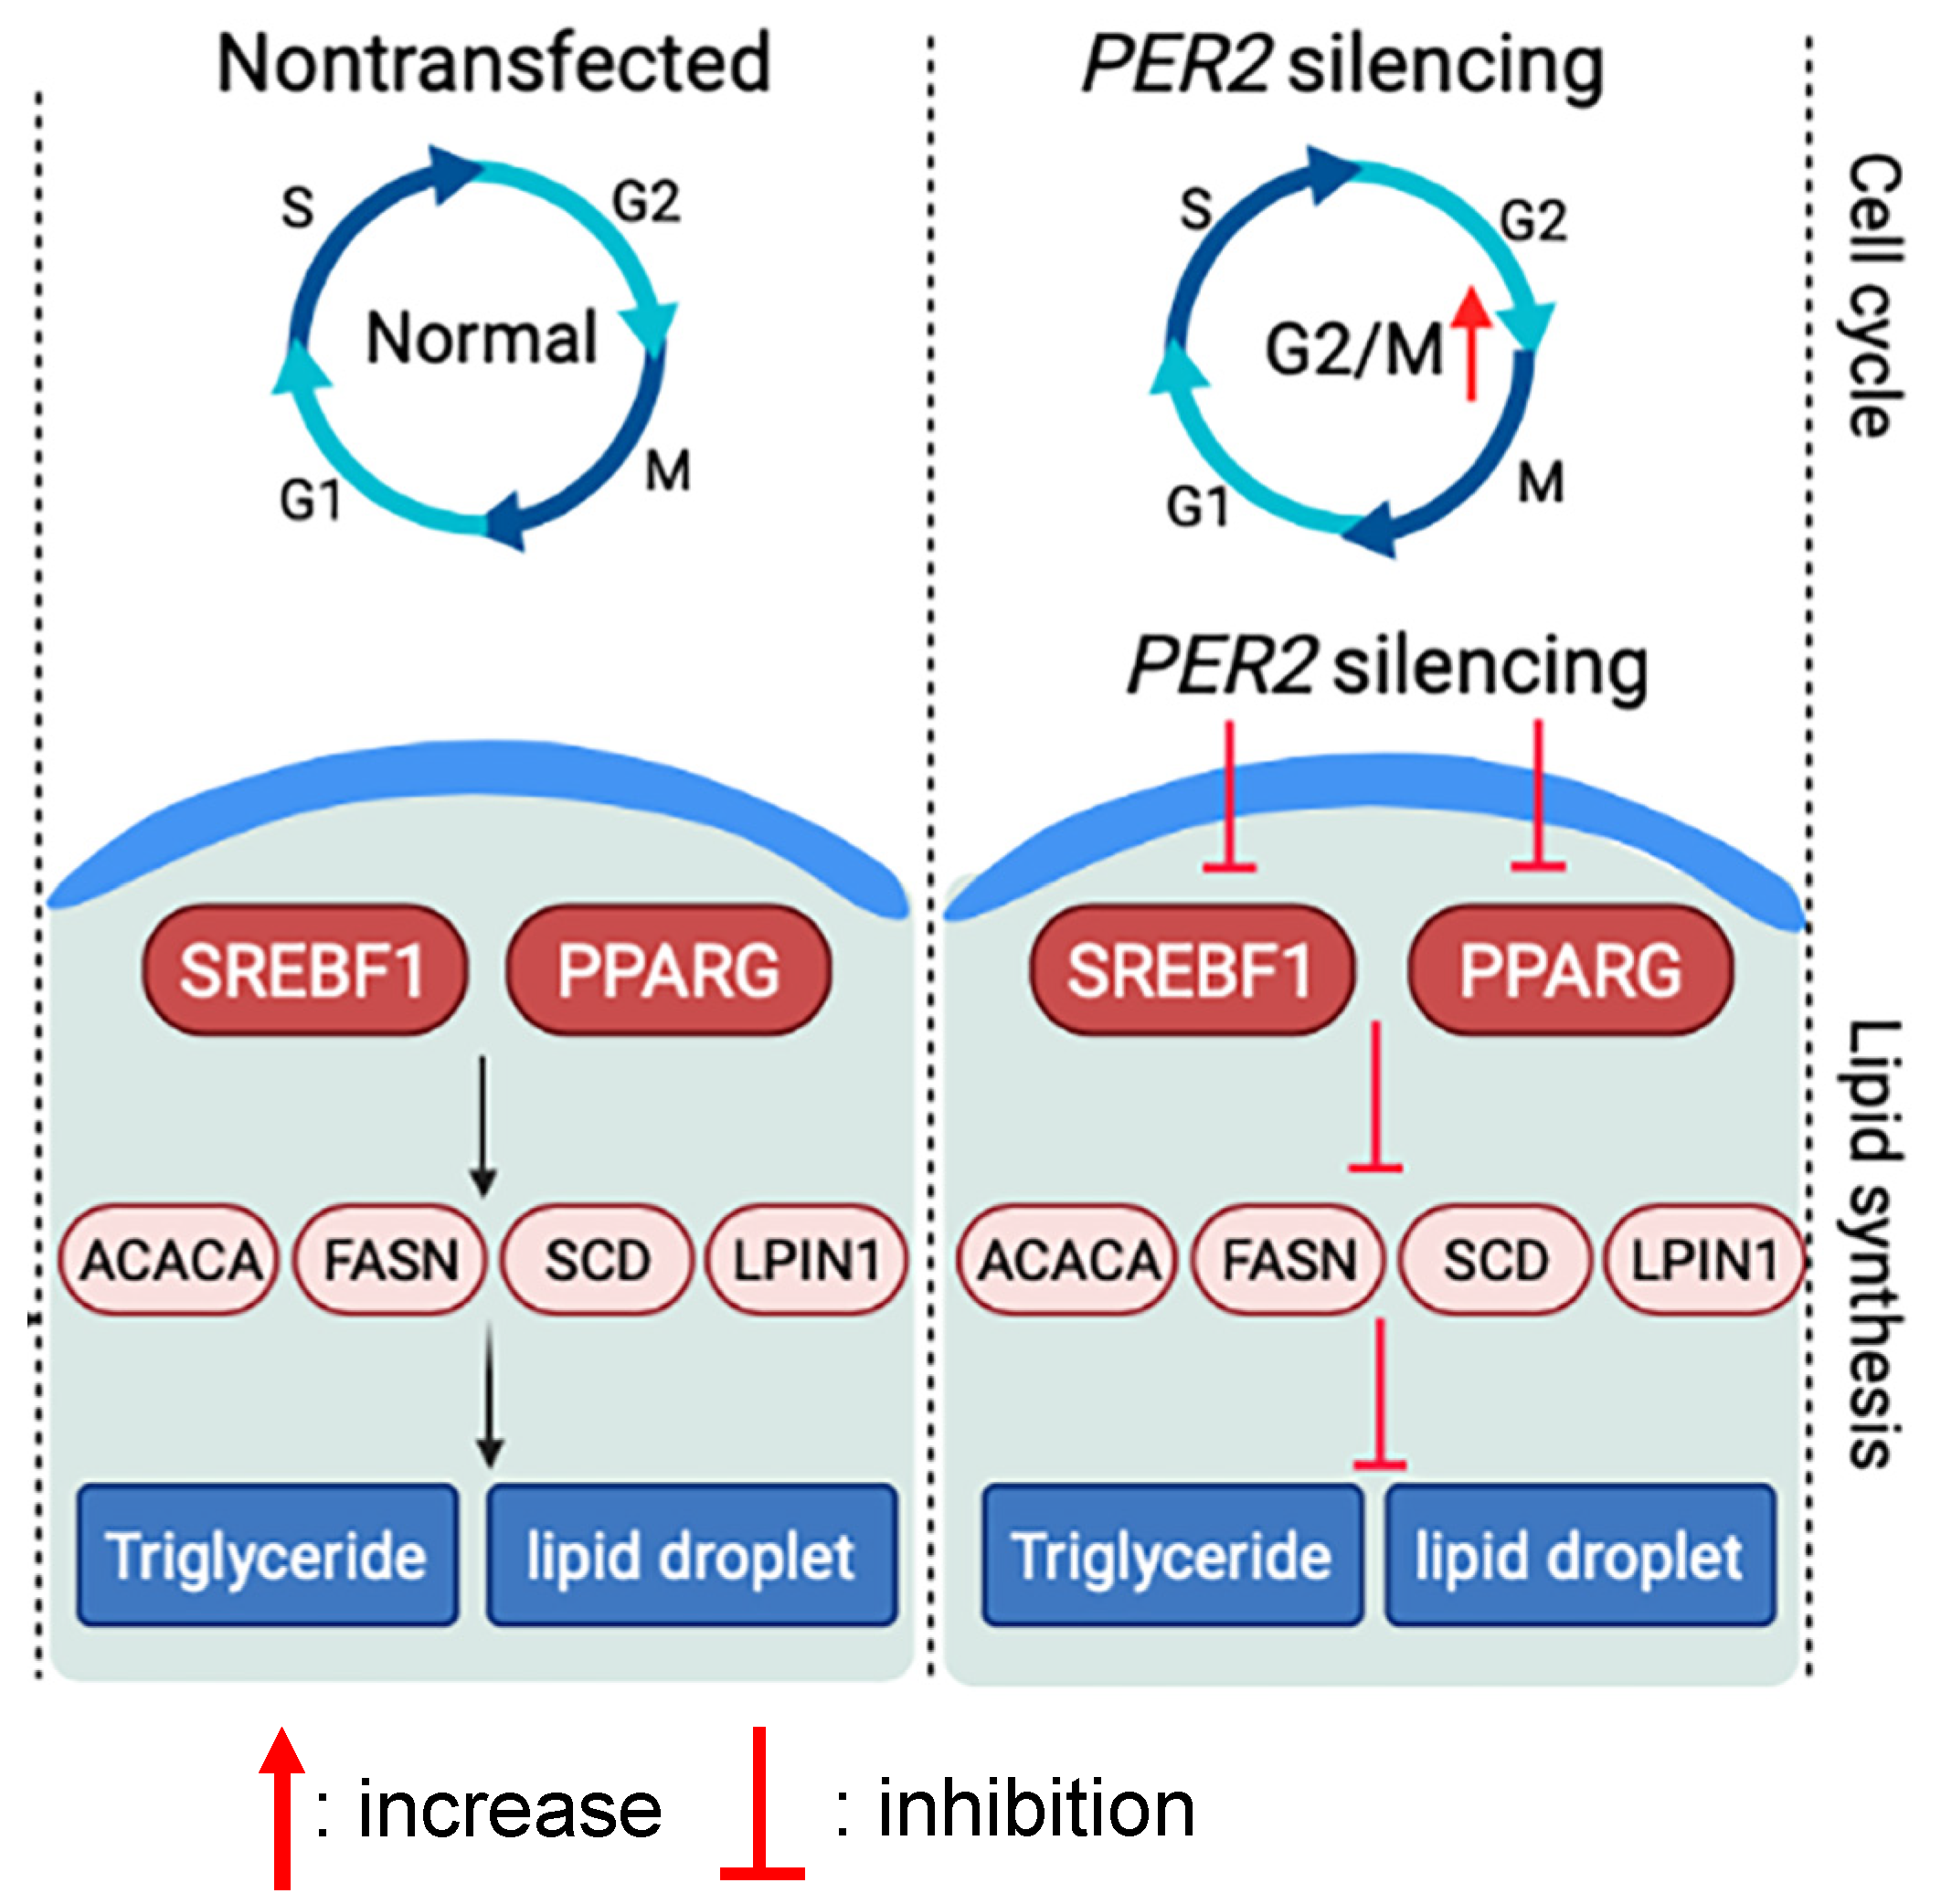
4.1. PER2 Silencing Downregulates Mammary Lipogenic Genes

PPARG and SREBF1 play a central role in lipid metabolism. In this study, the downregulation of the lipid-related transcription regulators PPARG and SREBF1 in BMECs after PER2 silencing underscored the potential for PER2 to participate in the regulation of mammary lipid synthesis. Consistent with our findings, previous studies revealed that circadian clock genes control lipid metabolism in non-ruminants [20,21,22]. PER2 could directly control PPARG expression as demonstrated by Grimaldi et al. [14] where the knockout of PER2 inhibits lipid metabolism by directly downregulating PPARG in mice. Furthermore, a concerted function between SREBF1 and PPARG was reported in regulating lipid synthesis in ruminants [23]. Thus, by inhibiting PPARG and SREBF1 in BMECs, PER2 could alter various aspects of lipid synthesis in BMECs.
A recent study from our laboratory (not published) aimed to determine circadian rhythms in mRNA expressions of PER2 and lipogenic genes in normal BMECs. We found the expression of both PER2 and PPARG kept decreasing between 12 and 24 h after determination. This suggested the existence of a synchrony of PER2 and PPARG expression in primary BMECs. We further analyzed the rhythms of SREBF1 and observed that the decrease in SREBF1 occurred approximately 4 h after the decrease of PER2 and PPARG, with the decrease continuing between 16 and 24 h after analysis. Together, these findings are consistent with the present study, indicating a similar pattern of change with the circadian rhythm in PER2, SREBF1, and PPARG expression.
Data indicated, at least in non-ruminants, that the expression of SREBF1 and PPARG is partly under the control of the mechanistic target of mTOR [24,25]. Non-ruminant studies revealed that the mTOR pathway could regulate lipid synthesis by integrating various molecular signals culminating in the activation of adipogenesis/lipogenesis through SREBF1 and PPARG [26,27,28,29]. mTOR is essential for regulating SREBF1 at both transcriptional and post-translational levels [30,31,32], and mTORC2 can control lipid synthesis in BMECs by regulating the lipogenic gene expression through PPARG in ruminants [33]. In this study, the downregulation of mTOR at the mRNA level, as well as SREBF1 and PPARG, indicated a strong mechanistic link, whereby PER2 downregulated SREBF1 and PPARG through mTOR.

4.2. PER2 Silencing Suppresses Cellular TAG Accumulation and Lipid Droplet Formation

The TAG and lipid droplet levels reflected the lipid synthesis capacity in BMECs. Lipid synthesis included the de novo synthesis of fatty acids and the esterification of newly synthesized fatty acids into TAG [34]. Lipid droplets in BMECs contained a cytosolic TAG-rich core, which is the end result of lipogenesis and esterification. The lower mRNA expression of TAG-related genes (SCD, ACACA, LPIN1 and FAS) and lipid droplet secretion-related genes (LPIN1) when PER2 was silenced represented a possible mechanism for the decrease in TAG and lipid droplet content. Thus, the fact that PER2 silencing decreased lipid droplets and cellular TAG concentrations in BMECs is further evidence that this clock gene can regulate the basic mechanisms associated with lipid synthesis in BMECs.
The downregulation in the expression of FAS and ACACA, as well as SCD, when PER2 was silenced, indicated that the inhibition of de novo fatty acid synthesis by PER2 silencing contributed to the lower TAG content in BMECs. Both PPARG [35,36,37] and SREBF1 [38,39,40] can regulate TAG synthesis. Our findings were consistent with previous studies where the inhibition of SREBF1 activity was associated with the downregulation of SCD, ACACA, and LPIN1 [25,41]. In accordance with the increased activity of PPARG, it led to the upregulation of SCD and LPIN1 expression [35]. LPIN1, a target gene of PPARG in ruminants [23], is one key gene associated with lipid droplet formation. The downregulation of LPIN1, when PER2 was silenced, agreed with the decrease in PPARG expression and the content of lipid droplets, indicating that PER2 also exerted its effect on lipid droplet formation by regulating LPIN1. Collectively, the decrease in lipid droplets and cellular TAG concentrations in BMECs by PER2 silencing was consistent with the mRNA expression data. Thus, this clock protein is associated with various aspects of lipid synthesis in BMECs.

4.3. PER2 Silencing Regulates the Cell Cycle, but Not Apoptosis

Cells operate in strict accordance with the G1-S-G2-M cycle and maintain normal biological rhythms under the control of the cell cycle network, Cyclins-CDKs-CKIs [17]. In this study, we observed that the proliferation index was not significantly influenced by PER2 silencing. Furthermore, the increased number of cells in the G2/M phase suggested that PER2 silencing can upregulate the DNA proliferation activity and cellular mitosis to induce more cells into the G2/M. Consistent with our findings, there is compelling evidence for a mechanistic link between PER2 and the cell cycle [42,43], where the downregulation of PER2 accelerated the growth of breast cancer cells [44]. Our results showed that PER2 silencing did not affect cell apoptosis, which was consistent with Hu et al. [19]. Caspase-8, as the initiator of apoptosis at the top of the caspase signaling cascade [45], was significantly upregulated by PER2 silencing, although its downstream gene caspase-3 was not significantly influenced. It is possible that the higher expression of caspase-8 failed to drive the upregulation of downstream genes in the caspase signaling pathway, hence explaining the lack of an effect on cell apoptosis when PER2 was silenced.

5. Conclusions

The clock protein PER2 regulates genes involved in lipid metabolism, including fatty acid de novo synthesis, fatty acid desaturation, TAG accumulation, and lipid droplet secretion in primary BMECs. The inhibition of PPARG and SREBF1 when PER2 is silenced appears to be an important cause for the reduction in lipid synthesis. Our overall data suggests that PER2 in bovine mammary cells plays a role in governing milk fat synthesis directly, or through the activation of the transcriptional regulators PPARG and SREBF1. This study provides molecular evidence in support of a link between circadian clocks and lipid metabolism in bovines.

Supplementary Materials

The following are available online at https://www.mdpi.com/article/10.3390/biology10121226/s1, Table S1: The sequences of siRNAs for PER2 silencing, Table S2: The Primer sequences of apoptosis pathway genes and lipogenic-related genes.

Author Contributions

Conceptualization, M.W. and B.Z.; methodology, Y.J.; software, Y.J.; validation, Q.Y., Y.C. and L.H.; formal analysis, Y.J.; investigation, Y.J. and S.W.; resources, L.H.; data curation, J.O.; writing—original draft preparation, Y.J.; writing—review and editing, M.W. and J.J.L.; supervision, J.J.L.; project administration, Q.Y.; funding acquisition, M.W. and B.Z. All authors have read and agreed to the published version of the manuscript.

Funding

This work is supported by a Natural Science Foundation of China (31672446), key program of State Key Laboratory of Sheep Genetic Improvement and Healthy Production (2021ZD07, 2021ZD01), and Priority Academic Program Development (PAPD) of Jiangsu province, China.

Institutional Review Board Statement

The use of animals and the experimental procedures were approved by the Ethical Committee of Yangzhou University, Jiangsu Province, China (Approval Code: SYXK (Su)2021-0026).

Informed Consent Statement

Not applicable.

Data Availability Statement

Not applicable.

Acknowledgments

The authors acknowledge the funding received to conduct this study from the project funded by a Natural Science Foundation of China (31672446), key program of State Key Laboratory of Sheep Genetic Improvement and Healthy Production (2021ZD07, 2021ZD01), and Priority Academic Program Development (PAPD) of Jiangsu province, China. The authors have not stated any conflicts of interest.

Conflicts of Interest

The authors declare that they have no conflicts of interest.

References

  1. Canaple, L.; Kakizawa, T.; Laudet, V. The days and nights of cancer cells. Cancer Res. 2003, 63, 7545–7552. [Google Scholar] [PubMed]
  2. Xiang, S.; Mao, L.; Duplessis, T.; Dauchy, R.; Dauchy, E.; Blask, D.E.; Frasch, T.; Hill, S.M. Oscillation of clock and clock controlled genes induced by serum shock in human breast epithelial and breast cancer cells: Regulation by melatonin. Breast Cancer-Basic 2012, 6, 137–150. [Google Scholar] [CrossRef]
  3. Deng, F.; Yang, K. Current status of research on the period family of clock genes in the occurrence and development of cancer. J. Cancer 2019, 10, 1117–1123. [Google Scholar] [CrossRef] [PubMed]
  4. Casey, T.M.; Plaut, K. Lactation biology symposium: Circadian clocks as mediators of the homeorhetic response to lactation. J. Anim. Sci. 2012, 90, 744–754. [Google Scholar] [CrossRef] [PubMed]
  5. Porter, W. Circadian clocks in mammary gland development and differentiation. J. Anim. Sci. 2011, 89, 185. [Google Scholar]
  6. Giannetto, C.; Piccione, G. Daily rhythms of 25 physiological variables in bos taurus maintained under natural conditions. J. Appl. Biomed. 2009, 7, 55–61. [Google Scholar] [CrossRef] [Green Version]
  7. Lefcourt, A.M.; Bitman, J.; Wood, D.L.; Akers, R.M. Circadian and ultradian rhythms of peripheral growth hormone concentrations in lactating dairy cows. Domest. Anim. Endocrinol. 1995, 12, 247–256. [Google Scholar] [CrossRef]
  8. Lefcourt, A.M.; Akers, R.M.; Wood, D.L.; Bitman, J. Circadian and ultradian rhythms of peripheral prolactin concentrations in lactating dairy cows. Am. Physiol.-Reg. I 1994, 267, R1461–R1466. [Google Scholar] [CrossRef]
  9. Lefcourt, A.M.; Bitman, J.; Kahl, S.; Wood, D.L. Circadian and ultradian rhythms of peripheral cortisol concentrations in lactating dairy cows. J. Dairy Sci. 1993, 76, 2607–2612. [Google Scholar] [CrossRef]
  10. Harvatine, K.; Allen, M. Effects of fatty acid supplements on feed intake, and feeding and chewing behavior of lactating dairy cows. J. Dairy. Sci. 2006, 89, 1104–1112. [Google Scholar] [CrossRef]
  11. Quist, M.A.; LeBlanc, S.J.; Hand, K.J.; Lazenby, D.; Miglior, F.; Kelton, D.F. Milking-to-milking variability for milk yield, fat and protein percentage, and somatic cell count. J. Dairy Sci. 2008, 91, 3412–3423. [Google Scholar] [CrossRef] [PubMed]
  12. Gilbert, G.R.; Hargrove, G.L.; Kroger, M. Diurnal variation in milk yield, fat yield, milk fat percentage, and milk protein percentage of Holstein-Friesian cows. J. Dairy Sci. 1972, 56, 409–410. [Google Scholar] [CrossRef]
  13. Adamovich, Y.; Rousso-Noori, L.; Zwighaft, Z.; Neufeld-Cohen, A.; Golik, M.; Kraut-Cohen, J.; Wang, M.; Han, X.L.; Asher, G. Circadian clocks and feeding time regulate the oscillations and levels of hepatic triglycerides. Cell Metab. 2014, 19, 319–330. [Google Scholar] [CrossRef] [Green Version]
  14. Grimaldi, B.; Bellet, M.M.; Katada, S.; Astarita, G.; Hirayama, J.; Amin, R.H.; Granneman, J.G.; Piomelli, D.; Leff, T.; Sassone-Corsi, P. PER2 controls lipid metabolism by direct regulation of PPARg. Cell Metab. 2010, 12, 509–520. [Google Scholar] [CrossRef] [Green Version]
  15. Sun, C.M.; Huang, S.F.; Zeng, J.M.; Liu, D.D.; Xiao, Q.; Tian, W.J.; Zhu, X.D.; Huang, Z.G.; Feng, W.L. Per2 inhibits k562 leukemia cell growth in vitro and in vivo through cell cycle arrest and apoptosis induction. Pathol. Oncol. Res. 2010, 16, 403–411. [Google Scholar] [CrossRef]
  16. Cheng, A.Y.; Zhang, Y.; Mei, H.J.; Fang, S.; Ji, P.; Yang, J.; Yu, L.; Guo, W.C. Construction of a plasmid for overexpression of human circadian gene period2 and its biological activity in osteosarcoma cells. Tumor Biol. 2015, 36, 3735–3743. [Google Scholar] [CrossRef]
  17. Gaucher, J.; Montellier, E.; Sassone-Cors, P. Molecular cogs: Interplay between circadian clock and cell cycle. Trends Cell Biol. 2018, 28, 368–379. [Google Scholar] [CrossRef]
  18. Bionaz, M.; Thering, B.J.; Loor, J.J. Fine metabolic regulation in ruminants via nutrient–gene interactions: Saturated long-chain fatty acids increase expression of genes involved in lipid metabolism and immune response partly through PPAR-α activation. Brit. J. Nutr. 2012, 107, 179–191. [Google Scholar] [CrossRef] [PubMed]
  19. Hu, L.Y.; Wang, M.Z.; Ouyang, J.L.; Li, P.F.; Loor, J.J. Period2 gene silencing increases the synthesis of αs-casein protein in bovine mammary epithelial cells. J. Anim. Sci. 2017, 95, 4510–4513. [Google Scholar] [CrossRef] [PubMed]
  20. Chappuis, S.; Ripperger, J.A.; Schnell, A.; Rando, G.; Jud, C.; Wahli, W.; Albrecht, U. Role of the circadian clock gene Per2 in adaptation to cold temperature. Mol. Metab. 2013, 2, 184–193. [Google Scholar] [CrossRef]
  21. Sun, L.; Wang, Y.; Song, Y.; Cheng, X.R.; Xia, S.F.; Rahman, M.R.T.; Shi, Y.H.; Le, G.W. Resveratrol restores the circadian rhythmic disorder of lipid metabolism induced by high-fat diet in mice. Biochem. Bioph. Res. Commun. 2015, 458, 86–91. [Google Scholar] [CrossRef] [PubMed]
  22. Gooley, J.J. Circadian regulation of lipid metabolism. Proc. Nutr. Soc. 2016, 75, 440–450. [Google Scholar] [CrossRef] [PubMed]
  23. Bionaz, M.; Chen, S.; Khan, M.J.; Loor, J.J. Functional role of PPARs in ruminants: Potential targets for fine-tuning metabolism during growth and lactation. PPAR Res. 2013, 84159. [Google Scholar] [CrossRef] [PubMed] [Green Version]
  24. Porstmann, T.; Santos, C.R.; Griffiths, B.; Cully, M.; Wu, M.; Leevers, S.; Griffiths, J.R.; Chung, Y.L.; Schulze, A. SREBP activity is regulated by mTORC1 and contributes to Akt-dependent cell growth. Cell Metab. 2008, 8, 224–236. [Google Scholar] [CrossRef] [PubMed] [Green Version]
  25. Osorio, J.S.; Lohakare, J.; Bionaz, M. Biosynthesis of milk fat, protein, and lactose: Roles of transcriptional and posttranscriptional regulation. Physiol. Genom. 2016, 48, 231–256. [Google Scholar] [CrossRef] [Green Version]
  26. Lewis, C.A.; Griffiths, B.; Santos, C.R.; Pende, M.; Schulze, A. Regulation of SREBP transcription factors by mTORC1. Biochem. Soc. Trans. 2011, 39, 495–499. [Google Scholar] [CrossRef] [Green Version]
  27. Bakan, I.; Laplante, M. Connecting mTORC1 signaling to SREBP-1 activation. Curr. Opin. Lipidol. 2012, 23, 226–234. [Google Scholar] [CrossRef]
  28. Laplante, M.; Sabatini, D.M. An emerging role of mTOR in lipid biosynthesis. Curr. Biol. 2009, 19, R1046–R1052. [Google Scholar] [CrossRef] [Green Version]
  29. Zhang, X.; Zhao, F.; Si, Y.; Huang, Y.L.; Yu, C.P.; Luo, C.C.; Zhang, N.; Li, Q.Z.; Gao, X.J. GSK3β regulates milk synthesis in and proliferation of dairy cow mammary epithelial cells via the mTOR/S6K1 signaling pathway. Molecules 2014, 19, 9435–9452. [Google Scholar] [CrossRef] [Green Version]
  30. Düvel, K.; Yecies, J.L.; Menon, S.; Raman, P.; Lipovsky, A.I.; Souza, A.L.; Triantafellow, E.; Ma, Q.; Gorski, R.; Cleaver, S.; et al. Activation of a metabolic gene regulatory network downstream of mTOR complex 1. Mol. Cell. 2010, 39, 171–183. [Google Scholar] [CrossRef] [Green Version]
  31. Li, Z.; Xu, G.; Qin, Y.; Zhang, C.; Tang, H.; Yin, Y.; Xiang, X.; Zhao, J.; Mulholland, M.; Zhang, W. Ghrelin promotes hepatic lipogenesis by activation of mTOR-PPARγ signaling pathway. Proc. Natl. Acad. Sci. USA. 2014, 111, 13163–13168. [Google Scholar] [CrossRef] [Green Version]
  32. Peterson, T.R.; Sengupta, S.S.; Harris, T.E.; Carmack, A.E.; Kang, S.A.; Balderas, E.; Guertin, D.A.; Madden, K.L.; Carpenter, A.E.; Finck, B.N.; et al. mTOR complex 1 regulates lipin 1 localization to control the SREBP pathway. Cell 2011, 146, 408–420. [Google Scholar] [CrossRef] [PubMed] [Green Version]
  33. Guo, Z.X.; Zhao, K.Y.; Feng, X.; Yang, D.D.; Yao, R.Y.; Chen, Y.H.; Bao, L.L.; Wang, Z.G. mTORC2 regulates lipogenic gene expression through PPARγ to control lipid synthesis in bovine mammary epithelial cells. Biomed. Res. Int. 2019, 5196028. [Google Scholar] [CrossRef] [Green Version]
  34. Li, N.; Zhao, F.; Wei, C.J.; Liang, M.Y.; Zhang, N.; Wang, C.M.; Li, Q.Z.; Gao, X.J. Function of SREBP1 in the milk fat synthesis of dairy cow mammary epithelial cells. Int. J. Mol. Sci. 2014, 15, 16998–17013. [Google Scholar] [CrossRef] [Green Version]
  35. Kadegowda, A.K.G.; Bionaz, M.; Piperova, L.S.; Erdman, R.A. Lipogenic gene expression in MAC-T cells is affected differently by fatty acids and enhanced by PPAR-gamma activation. J. Dairy Sci. 2008, 91, 678. [Google Scholar]
  36. AlSaleh, A.; Sanders, T.A.B.; O’Dell, S.D. Effect of interaction between PPARG, PPARA and ADIPOQ gene variants and dietary fatty acids on plasma lipid profile and adiponectin concentration in a large intervention study. Proc. Nutr. Soc. 2012, 71, 141–153. [Google Scholar] [CrossRef] [Green Version]
  37. Ji, P.; Drackley, J.K.; Khan, M.J.; Loor, J.J. Overfeeding energy upregulates peroxisome proliferator-activated receptor (PPAR) γ-controlled adipogenic and lipolytic gene networks but does not affect proinflammatory markers in visceral and subcutaneous adipose depots of Holstein cows. J. Dairy Sci. 2014, 97, 3431–3440. [Google Scholar] [CrossRef] [Green Version]
  38. Brown, M.S.; Goldstein, J.L. The SREBP pathway: Regulation of cholesterol metabolism by proteolysis of a membrane-bound transcription factor. Cell 1997, 89, 331–340. [Google Scholar] [CrossRef] [Green Version]
  39. Bionaz, M.; Loor, J.J. Gene networks driving bovine milk fat synthesis during the lactation cycle. BMC Genom. 2008, 9, 366. [Google Scholar] [CrossRef] [Green Version]
  40. Bionaz, M.; Loor, J.J. ACSL1, AGPAT6, FABP3, LPIN1, and SLC27A6 are the most abundant isoforms in bovine mammary tissue and their expression is affected by stage of lactation. J. Nutr. 2008, 138, 1019–1024. [Google Scholar] [CrossRef]
  41. Ma, L.; Corl, B.A. Transcriptional regulation of lipid synthesis in bovine mammary epithelial cells by sterol regulatory element binding protein-1. J. Dairy Sci. 2012, 95, 3743–3755. [Google Scholar] [CrossRef] [PubMed]
  42. Lee, C.C. Tumor suppression by the mammalian period genes. Cancer Causes Control 2006, 17, 525–530. [Google Scholar] [CrossRef] [PubMed]
  43. Rosbash, M.; Takahashi, J.S. Circadian rhythms: The cancer connection. Nature 2002, 420, 373–374. [Google Scholar] [CrossRef]
  44. Yang, X.; Wood, P.A.; Oh, E.Y.; Quiton, J.D.; Ansell, C.M.; Hrushesky, W.J.M. Down regulation of circadian clock gene Period 2 accelerates breast cancer growth by altering its daily growth rhythm. Breast Cancer Res. Treat. 2009, 117, 423–431. [Google Scholar] [CrossRef] [PubMed]
  45. Chen, M.; Wang, J. Initiator caspases in apoptosis signaling pathways. Apoptosis 2002, 7, 313–319. [Google Scholar] [CrossRef]
Figure 1. PER2 gene mRNA expression of siRNA-PER2-a/b/c transfected primary BMECs were determined at 0, 12, 24, 36, 48, and 60 h by RT-PCR. Values are means ± SEM (n = 3).
Biology 10 01226 g001
Figure 2. Cell cycles and proliferation in primary BMECs were determined after PER2 silencing. Values are means ± SEM (n = 3). (A) The cell proliferation activity was determined at 12, 24, and 36 h after PER2-siRNA transfection using the CKK8 method. (B) The cell cycle was determined by flow cytometry and analyzed by FlowJo software after PER2 silencing. (C) Cell cycle ratios (S/G2/M phase) were calculated based on result A. PI: proliferation index = (S + G2/M)/(G0/G1 + S + G2/M) × 100%. Different lowercase letters indicate values in three groups with significant difference (one-way ANOVA, p < 0.05).
Biology 10 01226 g002
Figure 3. Cell apoptosis and apoptosis-related mRNA expressions were detected after PER2 gene silencing in primary BMECs. Values are means ± SEM (n = 3). (A) Flow cytometry analysis of cell apoptosis was monitored by FITC-conjugated antibodies to Annexin V. Apoptotic cell numbers were determined by flow cytometry. (B) Apoptosis-related mRNA expression after PER2 gene silencing. The BMECs transfected with negative siRNA were used as the negative control group. Relative mRNA expression was calculated with the 2−ΔΔCt method. Significant differences in adhesion compared to the non-transfected group were found at p < 0.05 using one-way ANOVA. Different lowercase letters indicate values in three groups with significant difference (one-way ANOVA, p < 0.05).
Biology 10 01226 g003
Figure 4. PER2 silencing effects on lipid synthesis in primary BMECs. Values are means ± SEM (n = 3). (A) lipid droplet accumulation after PER2 silencing. Lipid droplets were determined by oil red O staining and observed at 200× magnification under an inverted microscope. (B) Lipid droplet density. The density of the lipid droplet was determined by oil red O staining using a Microplate reader (510 nm). (C) Influence of PER2 silencing on lipid droplet quantity. The lipid droplet quantity was obtained by counting under an inverted microscope. (D) Mean triglyceride levels (TAG) after PER2 silencing were evaluated via a commercial TAG kit. Asterisks indicate statistically significant difference from nontransfected group (Student’s t test): * p < 0.05.
Biology 10 01226 g004
Figure 5. Effects of PER2 silencing on the mRNA expression of genes associated with mammary lipid synthesis. The BMECs transfected with the negative siRNA were used as the negative control group. Relative mRNA expression of target genes was calculated with the 2−ΔΔCt method. Values are means ± SEM (n = 3). Significant differences in expression compared with the non-transfected group was declared at p < 0.05 using one-way ANOVA. PPARG: peroxisome proliferator-activated receptor gamma. SREBF1: sterol regulatory element binding protein-1. mTOR: mammalian target of Rapamycin. LPIN1: Lipin 1. LPL: lipoprotein lipase. SCD: Stearoyl-CoA desaturase. ACACA: acetyl-CoA carboxylase alpha. FAS: fatty acid synthetase. Different lowercase letters indicate values in three groups with significant difference (one-way ANOVA, p < 0.05).
Biology 10 01226 g005
Figure 6. Proposed model of the effects of PER2 silencing on lipid synthesis and cell cycle activity in primary bovine mammary epithelial cells based on results from the present study.
Biology 10 01226 g006
Publisher’s Note: MDPI stays neutral with regard to jurisdictional claims in published maps and institutional affiliations.

