Article

Analysis of Codon Usage of Speech Gene FoxP2 among Animals

1
EduCare Academy, Silchar 788006, Assam, India
2
Department of Pharmacology, College of Pharmacy, King Khalid University, Abha 62529, Saudi Arabia
3
Department of Pharmacy, BGC Trust University Bangladesh, Chittagong 4381, Bangladesh
4
Department of Zoology, Moinul Hoque Choudhury Memorial College, Hailakandi 788150, Assam, India
*
Author to whom correspondence should be addressed.
Biology 2021, 10(11), 1078; https://doi.org/10.3390/biology10111078
Submission received: 6 September 2021 / Revised: 12 October 2021 / Accepted: 16 October 2021 / Published: 21 October 2021
(This article belongs to the Section Genetics and Genomics)

Abstract

:

Simple Summary

We evaluated codon usage bias in the FoxP2 gene in fishes, birds, reptiles, and mammals. Fishes use C or G—ending codons, while birds, reptiles, and mammals employ T or A—ending codons. Apart from the nucleotide composition, natural selection and mutation pressure might influence the CUB. The ENC observed/ENC expected ratio demonstrated that mutation pressure influences FoxP2 codon usage patterns. Natural selection may have had a key influence in shaping the CUB, although mutation pressure may have played a minor role. FoxP2 gene codon usage is affected by the base composition under mutation bias.

Abstract

The protein-coding gene FoxP2 (fork head box protein P2) plays a major role in communication and evolutionary changes. The present study carried out a comprehensive codon usage bias analysis in the FoxP2 gene among a diverse group of animals including fishes, birds, reptiles, and mammals. We observed that in the genome of fishes for the FoxP2 gene, codons ending with C or G were most frequently used, while in birds, reptiles, and mammals, codons ending with T or A were most frequently used. A higher ENC value was observed for the FoxP2 gene indicating a lower CUB. Parity role two-bias plots suggested that apart from mutation pressure, other factors such as natural selection might have influenced the CUB. The frequency distribution of the ENC observed and ENC expected ratio revealed that mutation pressure plays a key role in the patterns of codon usage of FoxP2. Besides, correspondence analysis exposed the composition of the nucleobase under mutation bias affects the codon usage of the FoxP2 gene. However, neutrality plots revealed the major role of natural selection over mutation pressure in the CUB of FoxP2. In addition, the codon usage patterns for FoxP2 among the selected genomes suggested that nature has favored nearly all the synonymous codons for encoding the corresponding amino acid. The uniform usage of 12 synonymous codons for FoxP2 was observed among the species of birds. The amino acid usage frequency for FoxP2 revealed that the amino acids Leucine, Glutamine, and Serine were predominant over other amino acids among all the species of fishes, birds, reptiles, and mammals.

1. Introduction

The standard genetic code makes use of 64 codons to characterize the 20 standard amino acids, including 3 stop codons, during the translation of a protein. The redundancy of the genetic code implies that one amino acid may be encoded by more than one codon (except methionine and tryptophan) leading to the occurrence of synonymous codon usage bias (CUB) in the genome of an organism, which varies among diverse groups [1]. Codon usage analyses have displayed that codon utilization bias is very complex and is accompanied by numerous organic influences, which include gene expression [2,3,4], gene length, the gene translation initiation sign [5], nucleotide composition [6], protein amino acid composition [7,8], protein structure [9,10], tRNA abundance [11,12,13,14], mutation frequency and patterns [15,16], environmental temperature [17], GC composition [18,19,20,21], and the balance between natural selection and gene mutation [22]. Hence, analyses of CUB are important in understanding the molecular evolution of a gene or genome of an organism, adaptation to different environmental conditions, genomic architecture, and the prediction of related functional gene expression.
FoxP2 was reported in 1990 as a putative “speech gene” that binds to the fork head box protein P2 and the autosomal dominant trait, causing a severe and specific speech disorder [23]. These findings attracted the scientific community to study the FoxP2 phenotype in diverse taxa including mammals, birds, and insects [24]. Earlier studies identified that the expression of the FoxP2 gene was linked to several brain regions for vocal development in primates [25], rodents [26], and songbirds [27]. Moreover, the protein-coding sequence of FoxP2 is amongst the most extremely conserved 5% of proteins in vertebrates and plays a key role in modulating vocal learning and communication, which might be shared by a range of animal species [28,29,30]. Recently, it was reported that the protein sequence of zebra finch FoxP2 is 98% identical to that of mouse and human FOXP2 [31]. Songbirds are an appropriate model for researching the mechanisms of imitative vocal learning, as well as speech and its pathologies. The expression patterns of FoxP2 in songbird and human brains are identical, with strong expression in the basal ganglia, thalamus, and cerebellum [31,32]. However, studies of FoxP2 are limited to nonvocal/nonsonic species of teleost fish such as medaka (Orizya latipes), zebrafish (Danio rerio), and others [33,34].
Here, in this study, we have tried to elucidate the differences in the nucleotide coding sequence of the evolutionary conserved FoxP2 gene among various species of teleost fish, birds, reptiles, and mammals. This is the first comprehensive study of CUB in four groups of the FoxP2 gene that thoroughly described the role of evolutionary forces and the evolutionary genetic relationship in these specific genes.

2. Materials and Methods

The complete nucleotide coding sequence (CDS), along with the accession number, of the FoxP2 gene among different species of fishes, birds, reptiles, and mammals has been retrieved from GenBank of the NCBI database (Table S1). The CDS, which has a perfect start codon as well as a stop codon and no unknown nucleobase in the middle of the sequence, was used in our CUB analysis.

2.1. Codon Usage Bias and Codon Usage Indices

The GC3 value is an important parameter to measure the degree of nucleobase composition bias since the proportion of the nucleobase GC contents varies at their third position of a synonymous codon [35].
Moreover, GC contents at the different codon positions of P1, P2, P3, and P12 were calculated. The P12 value represents the average value of P1 and P2 and is generally used to perform a neutrality plot analysis.
The Effective Number of Codons (ENC) values are used to measure the CUB of a gene, and its value ranges from 20 to 61 [36]. A greater ENC value represents weak codon bias, indicating the synonymous codon is used equally to code for the corresponding amino acid. The expected ENC value is calculated using the formula.
E N C e x p e c t e d = 2 + s + 29 s 2 + ( 1 s 2 )
where s is the frequency of GC3 [36].
Further, the frequency distribution of observed ENC and expected ENC [(ENC exp-ENC obs)/ENC exp] is calculated and plotted.

2.2. Relative Synonymous Codon Usage

The relative synonymous codon usage (RSCU) is computed by dividing the observed frequency of a codon by the expected frequency when there is uniform usage of the synonymous codon [4]. An RSCU value greater than 1.0 or less than 1.0 represent the more frequently (preferred) and less frequently (rare) used codons than expected, respectively, while an RSCU value greater than 1.6 indicates an over-represented codon for encoding the particular amino acid [4,37].

2.3. PR2 Plot

The parity rule plots i constructed by utilizing the values of both GC bias [G3/(G3 + C3)] and AT bias [A3/(A3 + T3)] and is used to determine the effect of mutation and selection pressure [38]. The center of the plot is 0.5 and represents no bias for selection and mutation in the two complementary strands of DNA.

2.4. Correspondence Analysis

Correspondence analysis is a multivariate statistical tool that is generally used to determine the most important trends in the codon usage variation among the genes and distribute the codons in axis1 and axis2 [39,40]. Hence, to explore the variation in the codon usage of the FoxP2 gene within the species of different groups, a correspondence analysis was performed based on RSCU values.

2.5. Neutrality Plot

A neutrality plot is generally used to determine the factor affecting the patterns of codon usage and codon bias along with the characterization of the relationship between GC3 and GC12. In this graphical plot, the regression with a slope close to 0 represents no effect of directional mutation pressure (a dominant role of natural selection) while a slope close to 1 represents complete neutrality (a dominant role of mutation pressure) [41].

2.6. Software Used

The ENC values of each CDS for the FoxP2 gene of the selected species among fish, birds, reptiles, and mammals were calculated using published online software from the Computational Biology and Bioinformatics Lab, Tezpur University, Assam, India [42]. The nucleotide composition, codon usage, amino acid usage, and phylogenetic analyses were performed using Mega 6.0 [43]. A heat map of correlation analyses between codon usage and GC3 values was produced in the online Heatmapper software [44]. Correspondence analysis was conducted using past software [45]. GRAVY and AROMATICITY was calculated using Galaxy [46].

2.7. Statistical Analysis

All statistical calculations including correlation analysis between codon usage and indices were performed in IBM SPSS version 21.0. The figures were evaluated using Microsoft Excel 16.0.

3. Results

3.1. Indices of Codon Usage

The mean length of the CDs, the composition of the GC contents along with its different codon positions (Lengthcds, GCcds, P1, P2, P3, P12), and the codon usage indices such as ENC, Aromaticity, and GRAVY among fishes, birds, reptiles, and mammals are listed in Table 1.
The ENC value reflects the extent of codon bias in a gene. In our study, we observed a mean value of ENC for the FoxP2 gene among fishes, reptiles, birds, and mammals greater than 50 (Table 1), suggesting low codon bias exists among these organisms.
The composition of the nucleotides is another essential factor that affects the CUB. The nucleotide composition and ENC value along with the mean and standard deviation in the CDS of the FoxP2 gene among different species of fish, birds, reptiles, and mammals were calculated (Table S2). The overall nucleotide composition analysis in fishes showed that the percentage of nucleobase C was the highest, followed by A, G, and T, while for the FoxP2 gene in birds, reptiles, and mammals, nucleobase A was the highest followed by C, G, and T. Similarly, the nucleobase at the third codon position in fishes and mammals showed that G3% was the highest followed by C3%, A3%, and T3%, whereas in birds and reptiles, A3% was the highest followed by G3%, T3%, and C3% (Table 2). The overall percentage of AT composition in comparison to GC composition was higher in birds, reptiles, and mammals while in fishes, the overall percentage of GC composition was higher than the AT composition. In addition, P3 content was also highest in fishes in comparison to reptiles, birds, and mammals for the FoxP2 gene (Table S2). The mean percentage of GC composition for the FoxP2 gene among the selected organisms ranged from 46.8% to 55.8%. However, the GC composition mean percentage at positions P1, P2, P3, and P12 (the average of P1 and P2) was significantly different among different organisms. The analysis of the correlation coefficients (Figure 1) showed that the mean value of GC content was significantly correlated at positions P3 and P12 for the FoxP2 gene among all the organisms except reptiles, which indicates that codon usage in the CDS of the FoxP2 were affected by the general GC contents of the organisms [47]. In fishes, P12 and both P1 and P2 showed a strong positive correlation (p < 0.01), indicating the influence of mutation pressure, but no significant correlation was detected in birds, reptiles, and mammals (Figure 1), which indicates the influence of natural selection over mutation pressure in the CUB of FoxP2 among these organisms [41]. However, the correlation between ENC and P3 showed a significant negative correlation (r = −0.938, p < 0.01) in fishes and a significant positive correlation (r = 1.000, p < 0.01) in mammals, as well as no significant correlation in birds and reptiles (Table 3). The above results indicated that the relationship of GC3 values with ENC values in fishes and mammals representing the mutation pressure accounted for the patterns of the nucleobase composition bias [48]. Earlier it was reported that the extent of P3 distribution may be linked to the divergence of directional selection and that of mutation pressure [49]. In our analysis, the P3 values for the FoxP2 gene among different groups were distributed between 0.4 and 0.7, suggesting that the FoxP2 gene in diverse groups mainly evolved via mutation pressure [50].
Moreover, the difference in ENC values between the observed and expected values was calculated using the formula [(ENCexp-ENCobs)/ENCexp] for all CDS of the FoxP2 gene among diverse groups and plotted to detect the frequency of variation (Figure 2). Nearly all the CDS of FoxP2 genes emerged in the range of −0.9 to −0.03 and −0.03 to 0.02, which indicate that most of the ENC observed values are smaller than that of the ENC expected values. Thus, the result revealed that the codon usage of the FoxP2 gene can be ascertained based on GC3 values and mutation pressure, which play a key role in the patterns of codon usage [50].
In addition, we performed correlation analysis between the overall composition of the nucleotide (A%, T%, G%, C%, GC%) and its codon in the third position (A3%, T3%, G3%, C3%, GC3%) (Table 2) to detect the effects of translational selection or mutational pressure on the codon bias of the FoxP2 gene among diverse groups. We observed a significant correlation with a positive value among homogeneous nucleotides and a significant correlation with a negative value among most of the heterogeneous nucleotides, which suggested that mutational pressure affects the base composition bias of the FoxP2 gene [37].

3.2. Codon Usage Pattern

The correlation between synonymous codon usage and GC3 values in the CDS of the FoxP2 gene among the studied organisms (Figure 3) showed that nearly all AT-ending codons were negatively correlated with GC3s while GC-ending codons were positively correlated with GC3s, which indicates that the frequency of synonymous codon usage depends on the increased bias of GC contents [51]. We observed that nearly all the synonymous codons were randomly used for encoding the corresponding amino acids among all the species of the selected genome for the FoxP2 gene. In the case of the bird genome, we observed 12 synonymous codons that were uniformly used among different species of birds for the FoxP2 gene (Figure 3), suggesting nature maintains its functional property throughout the period of evolution [52].
Analysis of overall non-uniform usage of synonymous codons i.e., the RSCU values for the FoxP2 gene of different species in each of the studied organisms were calculated (Table S3). In our analysis, the more frequently used codons (RSCU > 1.0) in fishes amounted to 23, including C-12, G-5, A-4, and T-2 as well as the over-represented codons (RSCU > 1.6, marked as yellow in Table S2) of which there were 6, namely AGA (R), CAG (Q), CGC (G), ATC (Ile), CTG (L), AGC (S), and GTG (G). Similarly, in birds, the most frequently used codons amounted to 25, including T-11, A-9, G-3, and C-2 as well as 6 over-represented codons, namely GCA (A), AGA (R), GGA (G), TTT (F), CCA (P), and GTG (V). However, in reptiles, the most frequently used codons amounted to 26 including T-11, A-10, G-3, and A-2 in which four A-ending codons were over-represented, viz. GCA (A), AGA (R), GGA (G), and CCA (P). Lastly, in mammals, the most frequently used codons totaled 29, including the codons ending with A-10, T-9, C-6, and G-4, whereas the over-represented codons include only CGA, GGA, and GTG encoding the amino acids arginine (R), glycine (G), and valine (V), respectively.

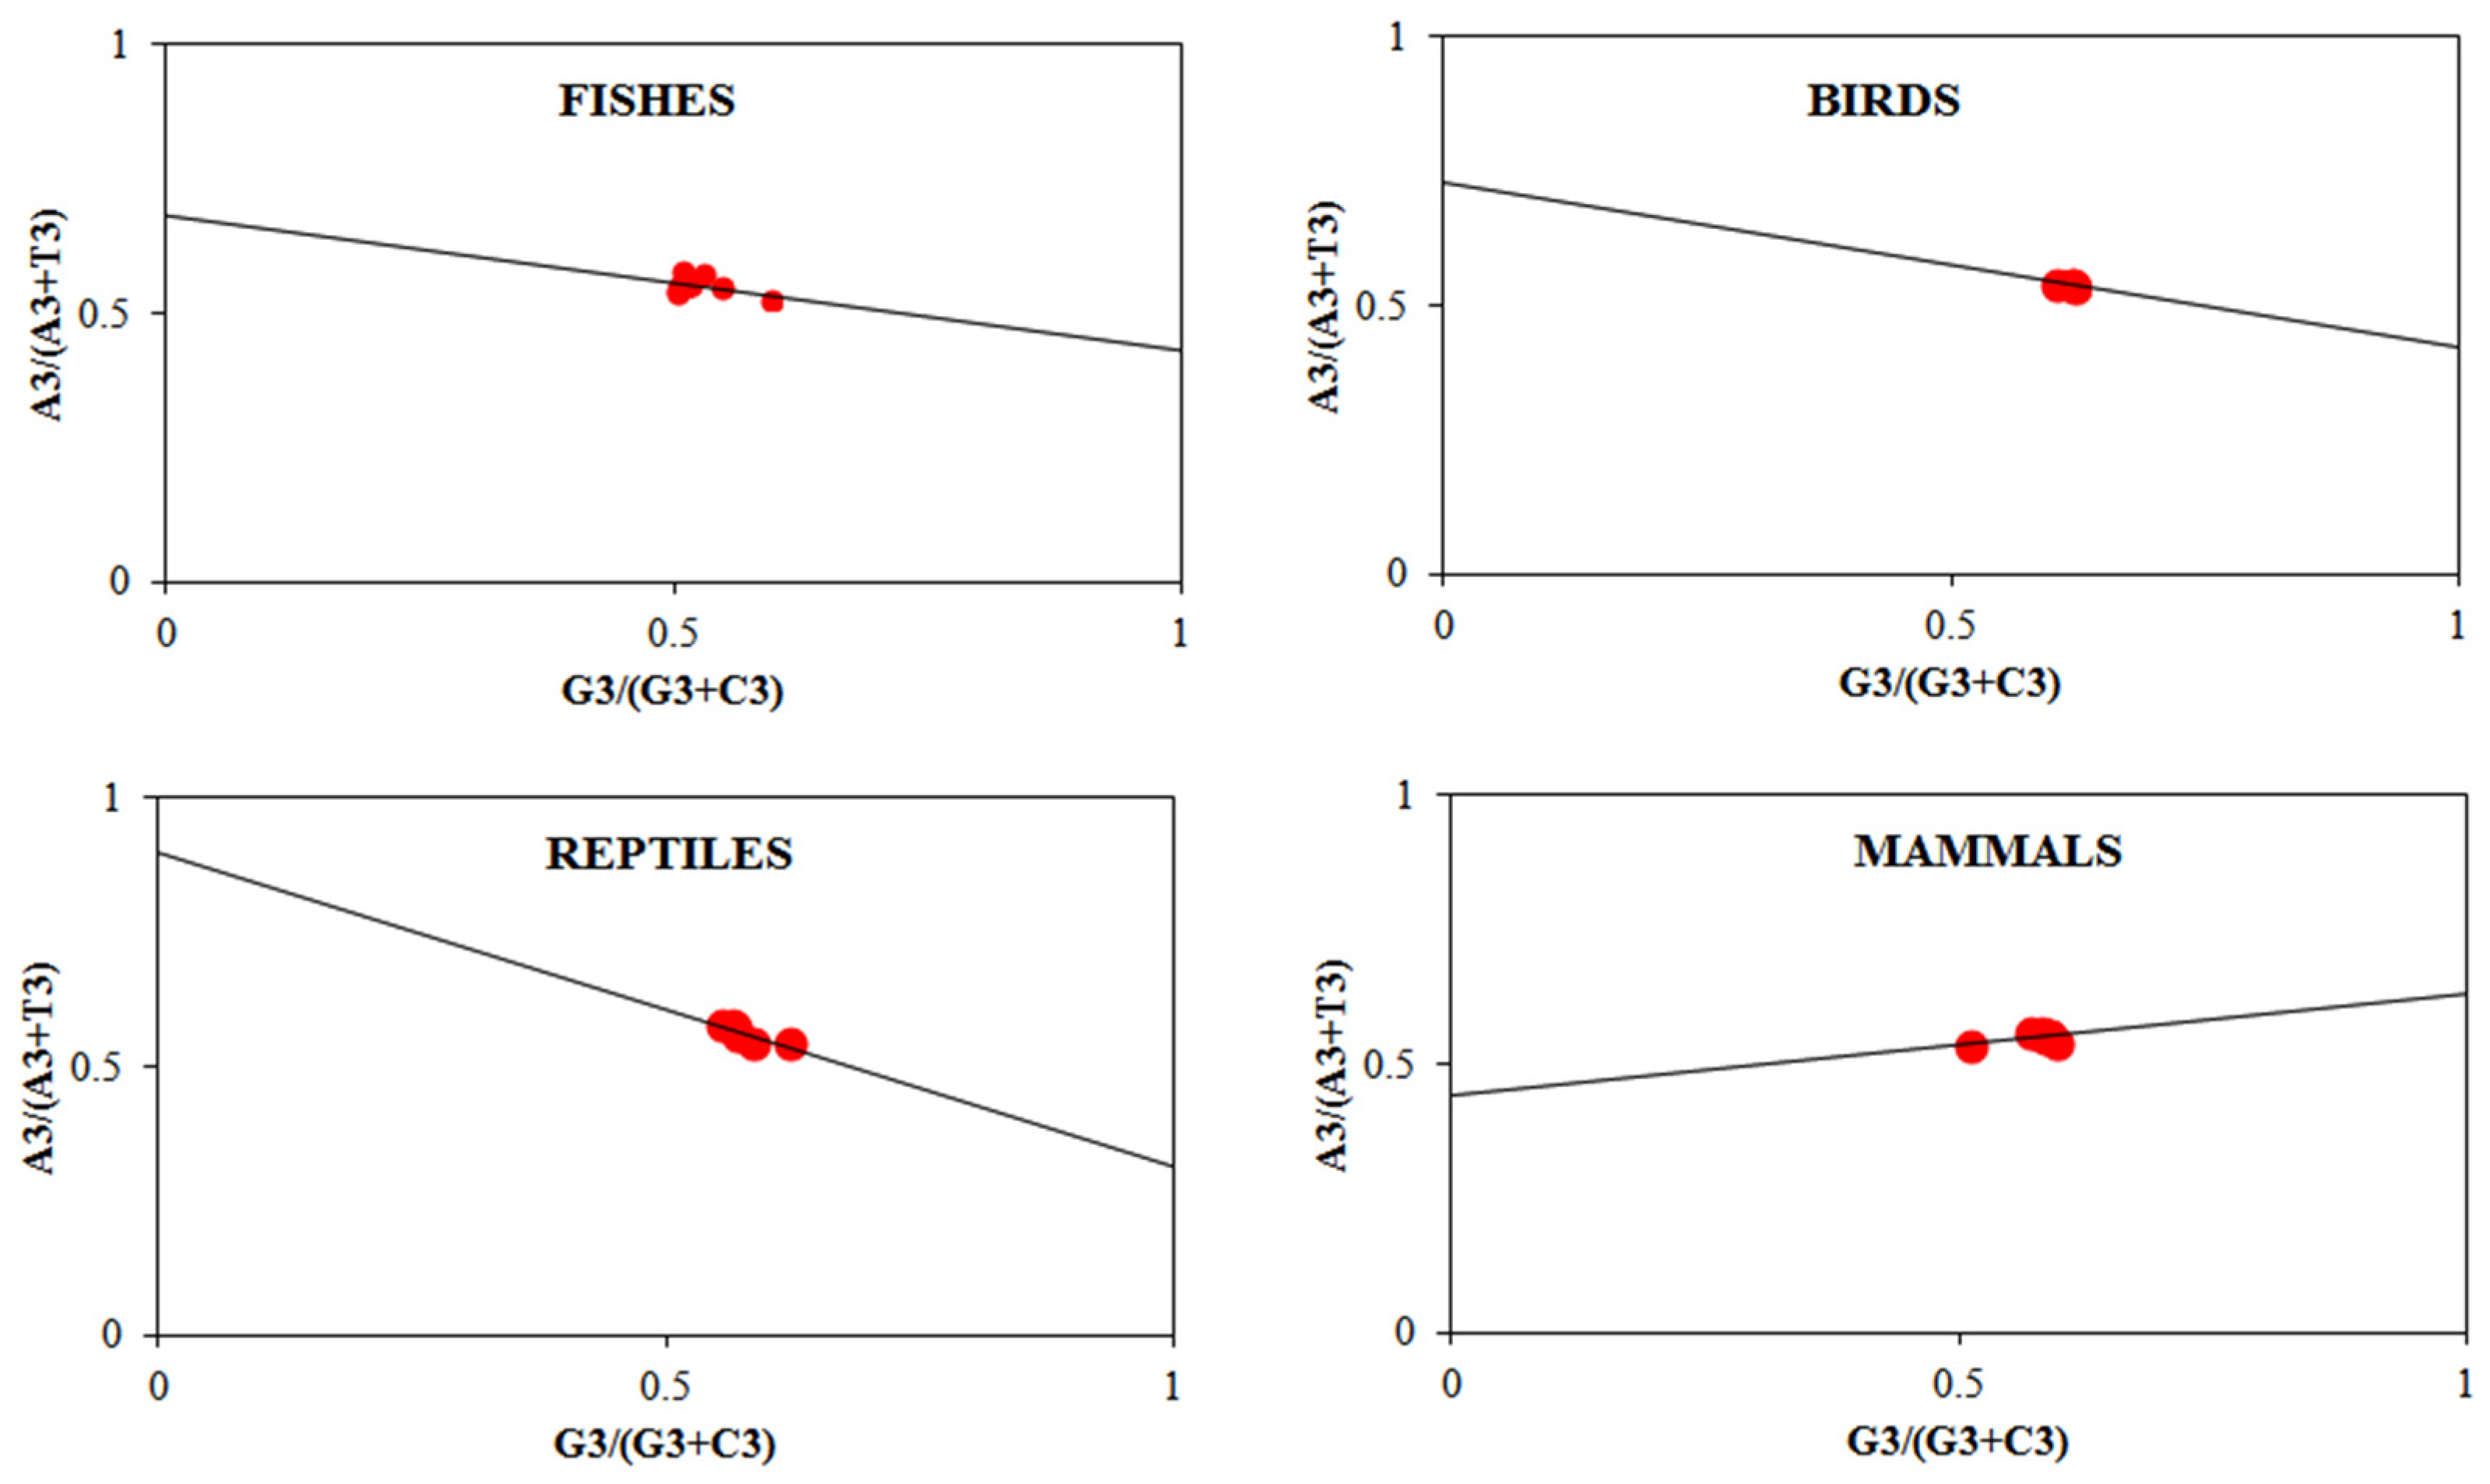
3.3. Analysis of PR2 Plot

Parity rule 2 plot (PR2) analysis for the FoxP2 gene among different species of the studied organisms showed that the mean value of both GC bias [G3/(G3 + C3)] and AT bias [A3/(A3 + T3)] was greater than 0.5 (Figure 4), which revealed that at the third position, purine was preferred over pyrimidine (G over C and A over T). If the codon bias is affected by the composition of the nucleotide, the third position between G3 and C3 along with A3 and T3 should have identical distributions, and this strand-specific rule is primarily irrespective of the G + C contents [21]. Therefore, the asymmetry between purine (GA) and pyrimidine (CT) indicates that aside from the nucleotide composition, other factors such as natural selection might influence the codon bias for the FoxP2 gene in fishes, birds, reptiles, and mammals [47].

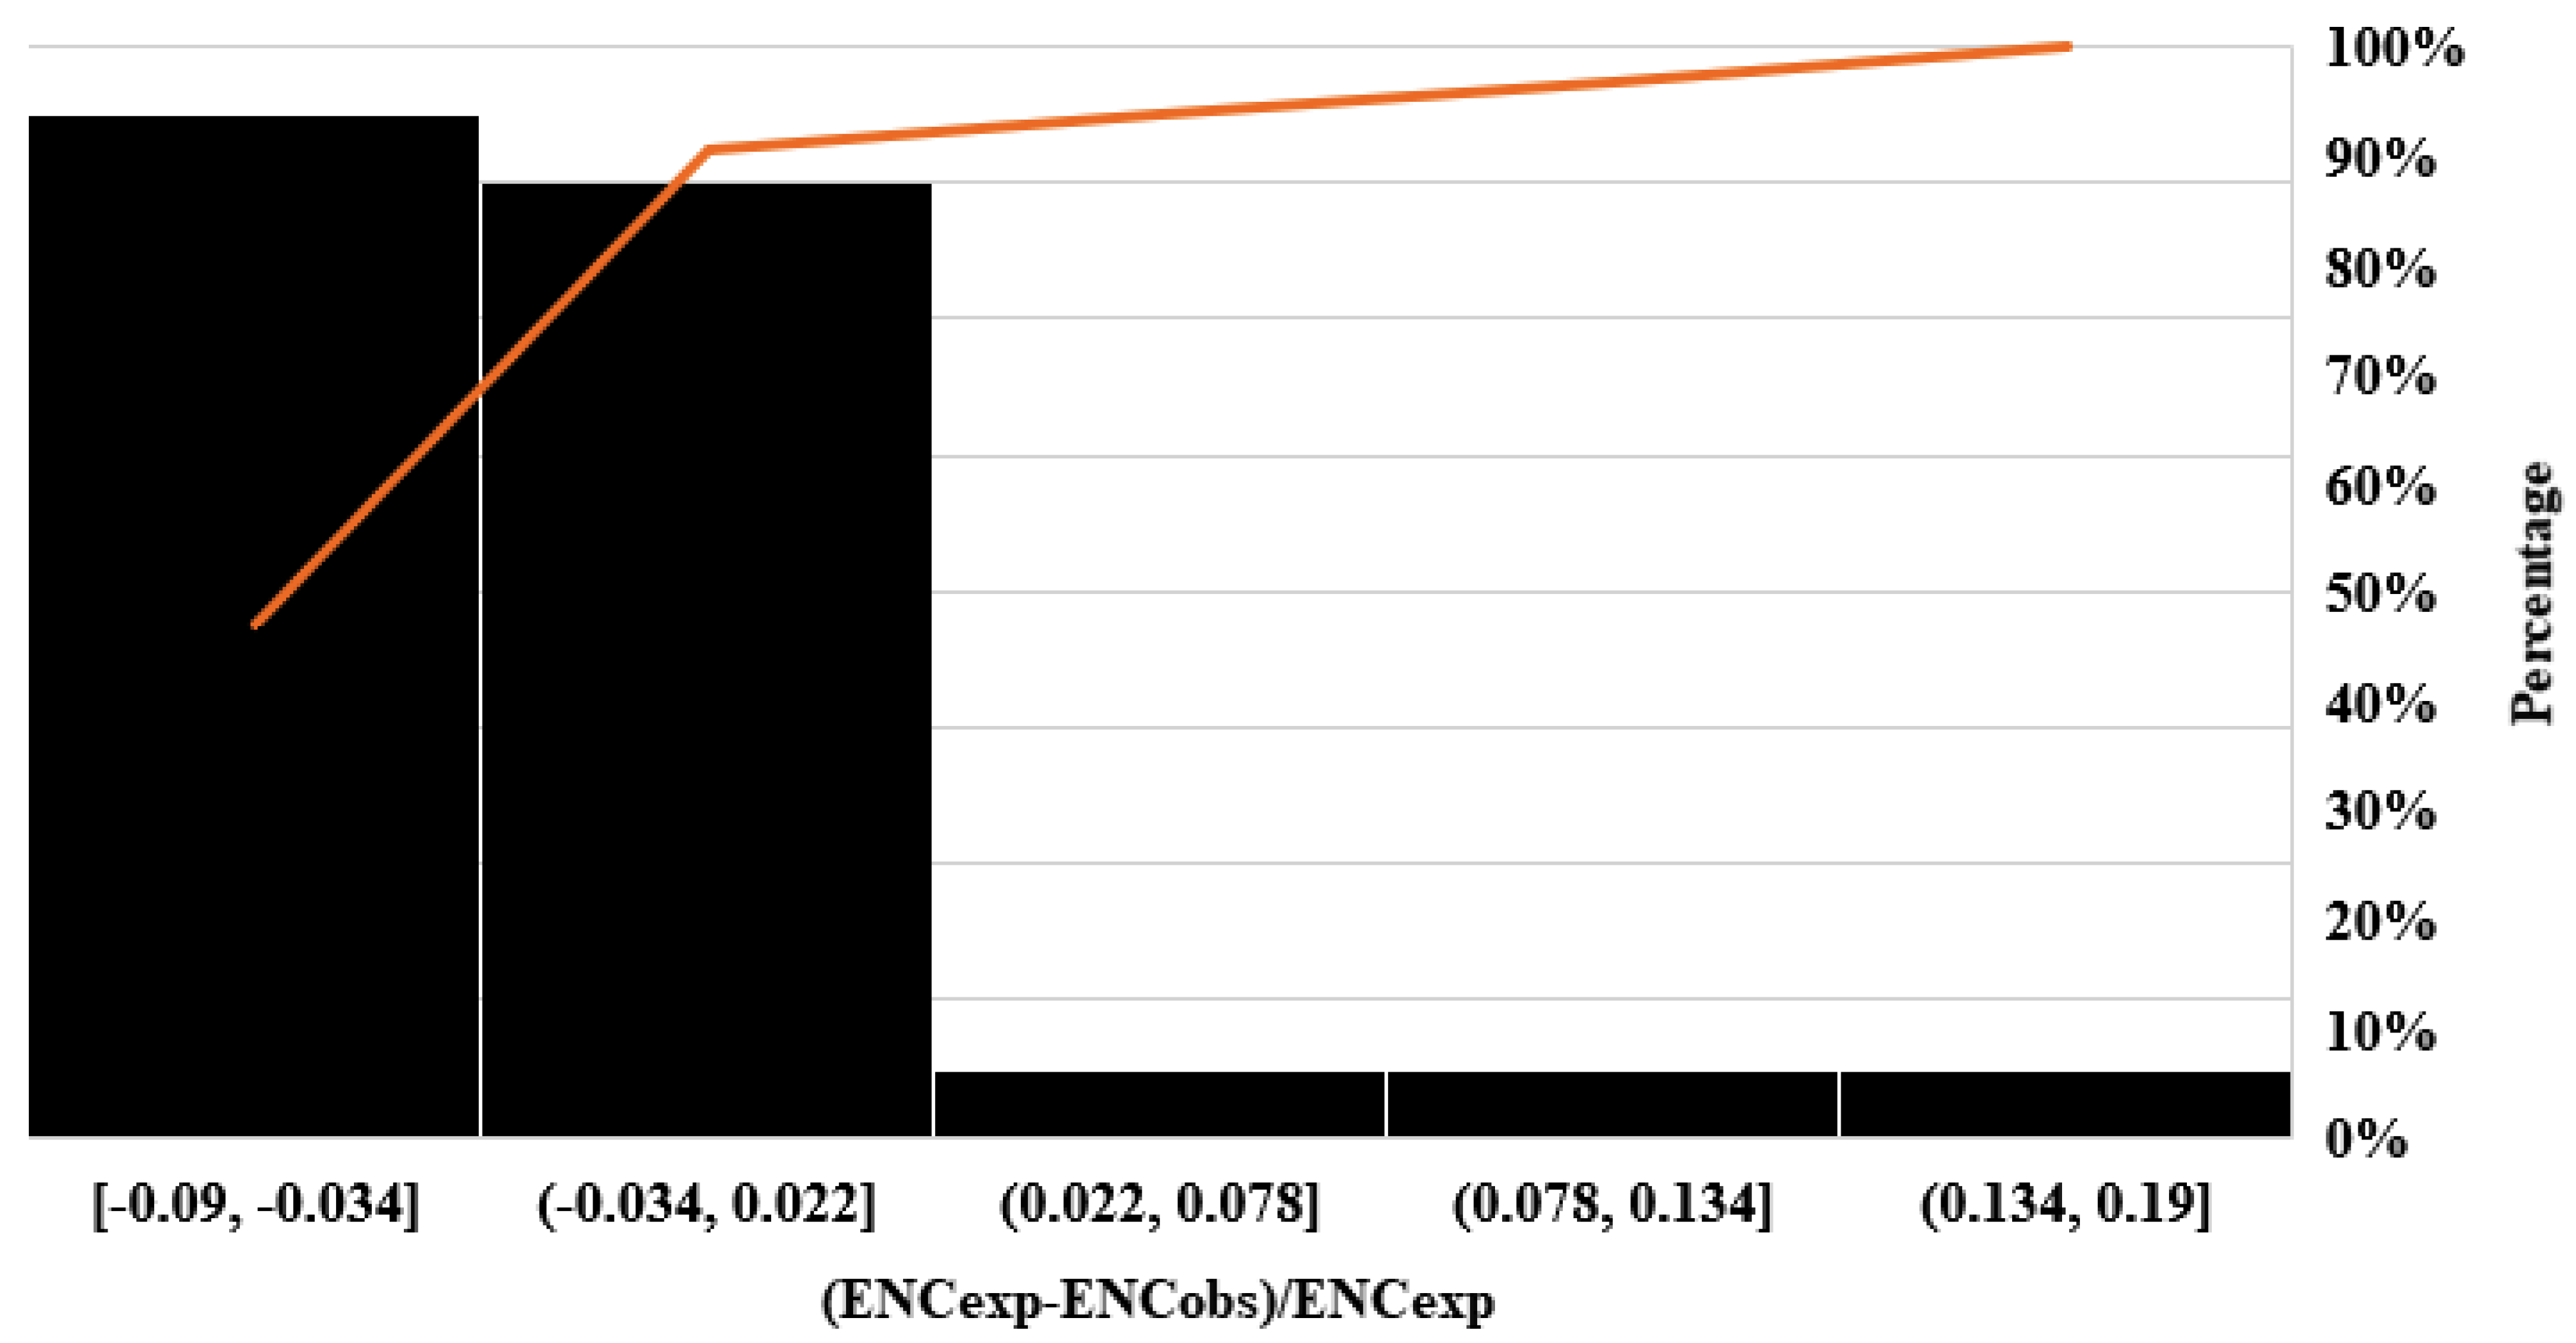
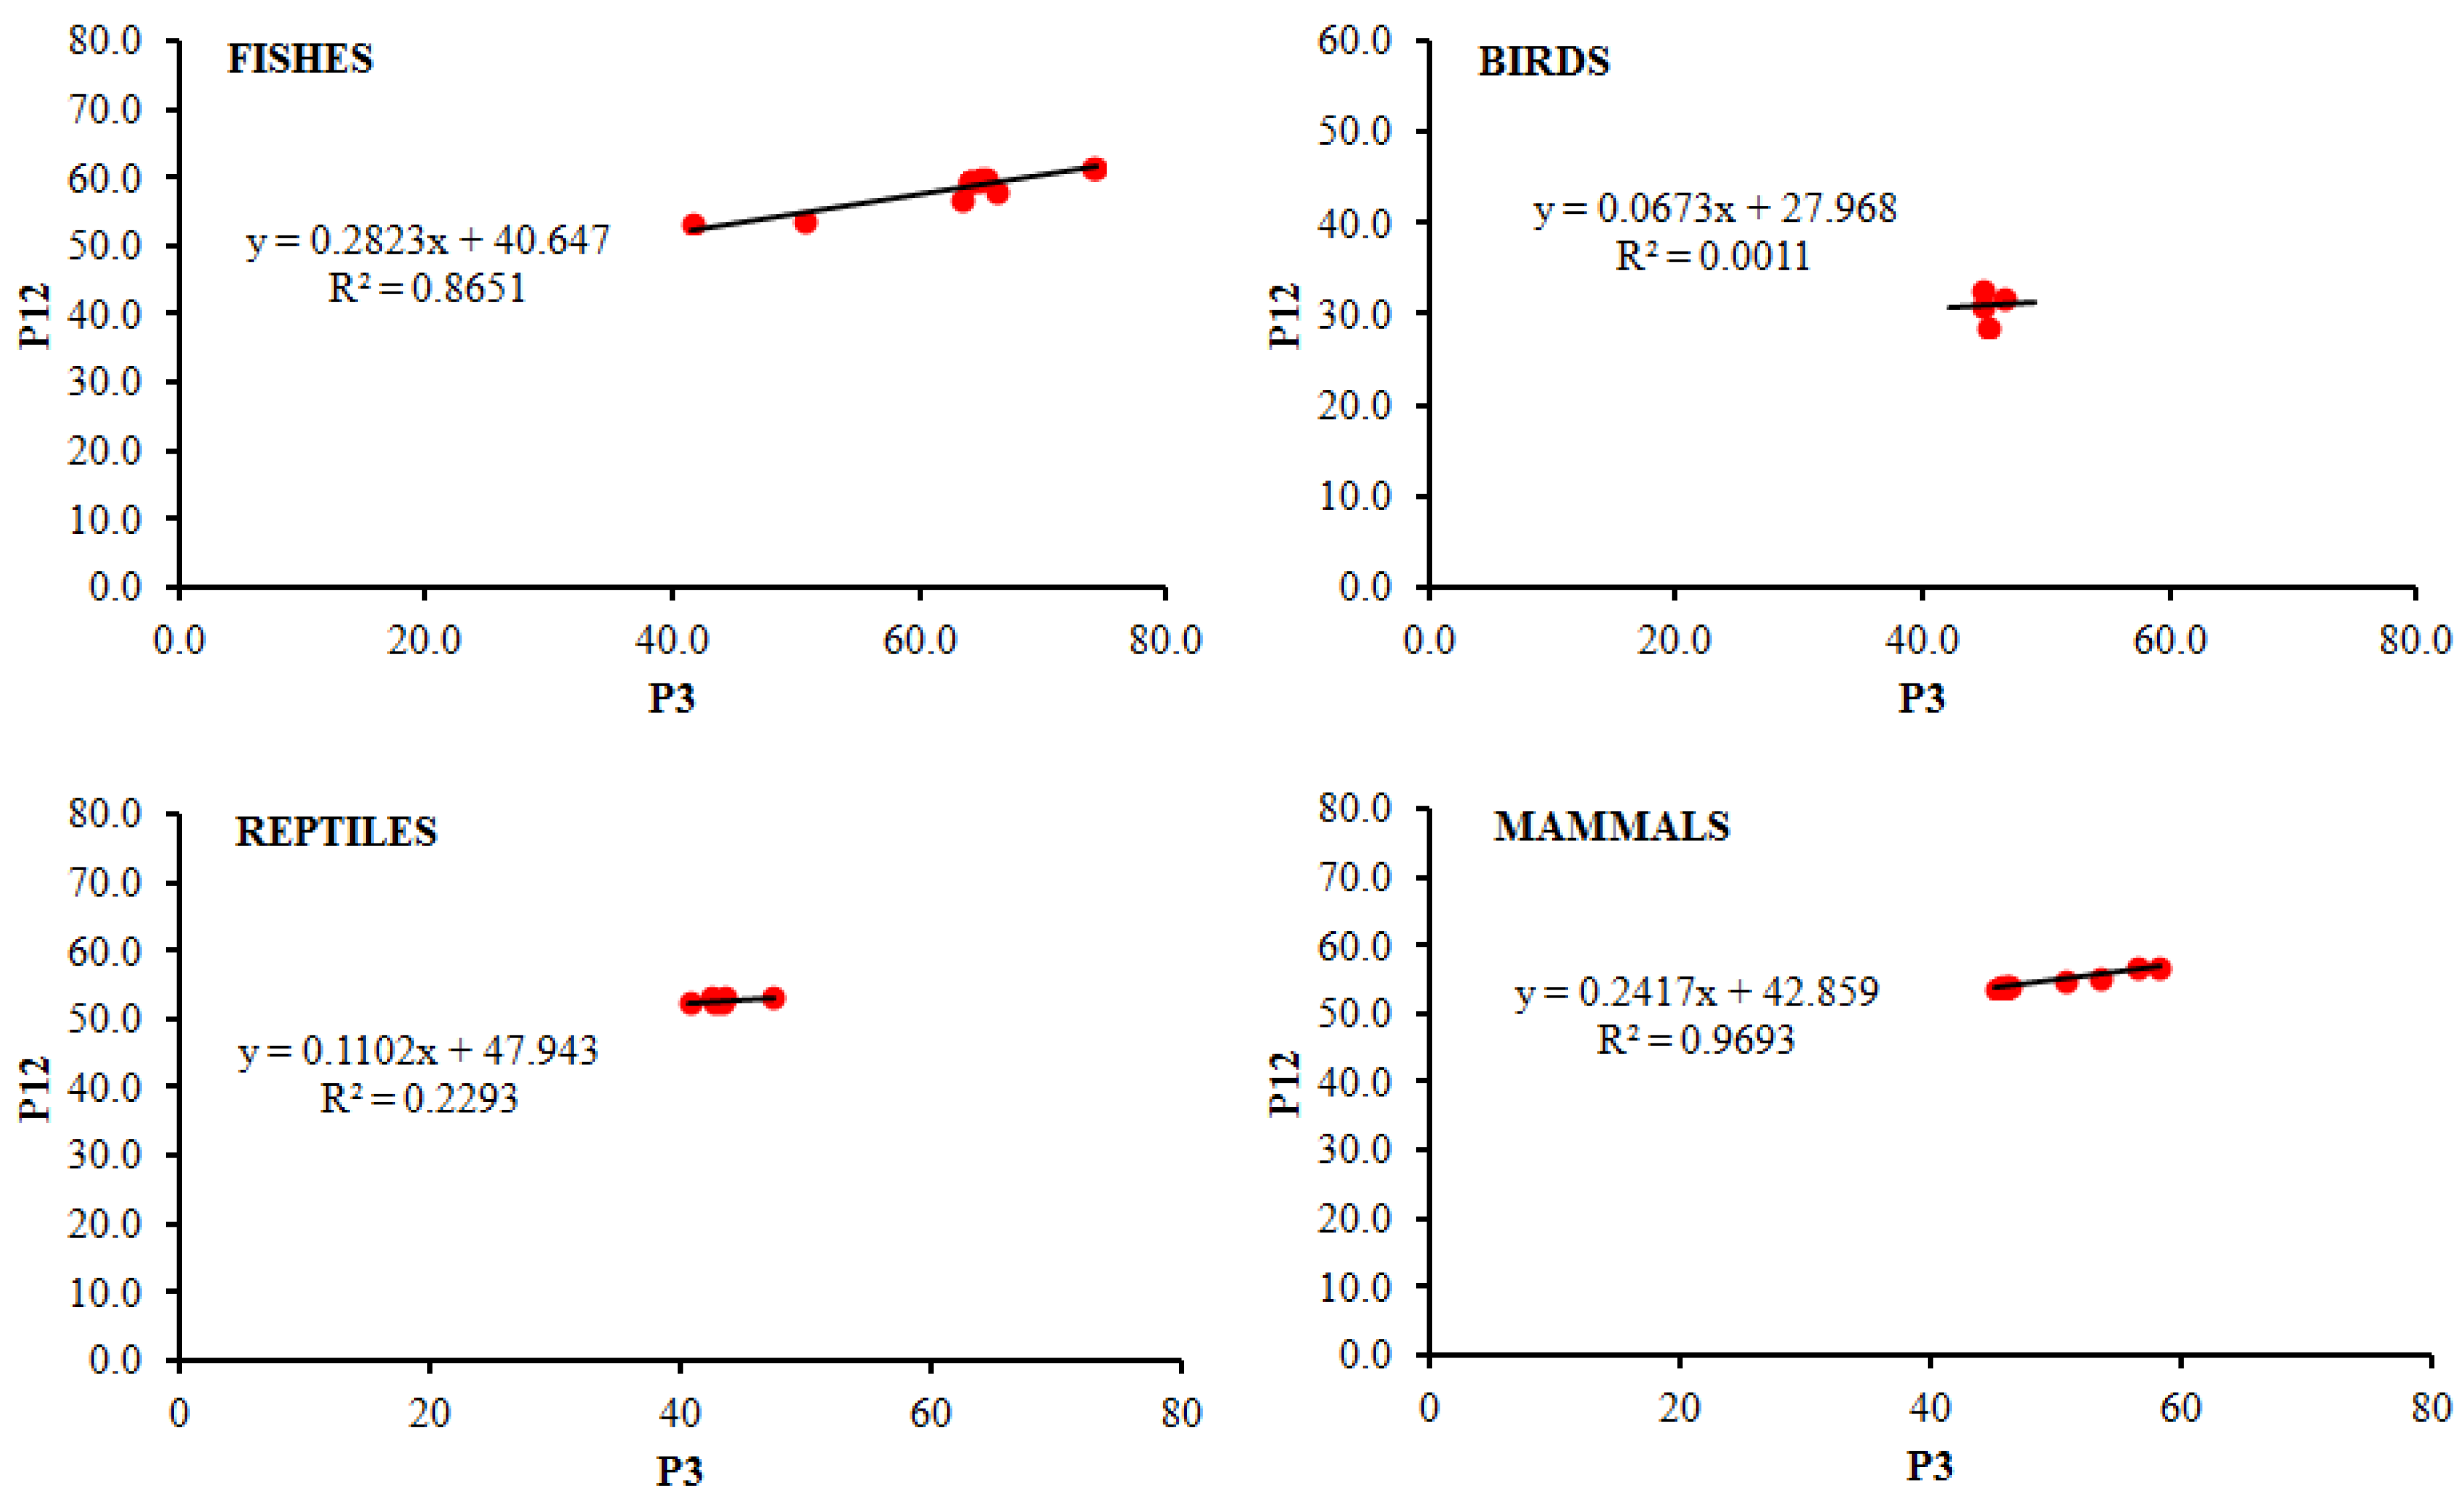
3.4. Analysis of Neutrality Plot

The neutrality plot depicts the influence of natural selection and mutation pressure on the codon bias of the gene by analyzing the correlation between P12 (the average of GC contents at positions P1 and P2) and P3 codon positions. The correlation coefficient (Figure 5) showed that a significant correlation between P12 and P3 for the FoxP2 gene among fishes (r = 0.830, p < 0.01), birds (r = 1.000, p < 0.01), and mammals (r = 0.919, p < 0.01), excluding reptiles (r = 0.232), indicated directional mutation pressure acting on all codon positions. Moreover, slopes of regression lines for fishes, reptiles, birds, and mammals were 0.2823, 0.1102, 0.0673, and 0.2417, respectively, i.e., close to zero, suggesting the role of natural selection was higher than mutation pressure in influencing the CUB for the FoxP2 gene among fishes, reptiles, birds, and mammals.

3.5. Correspondence Analysis

The correspondence analysis (CoA) depicts the extent of genes and their respective codons, unveiling major effects on CUB [53]. The CoA analysis on RSCU values of 59 synonymous codons in this study (Figure 6) showed that the plot of each organism differs for the FoxP2 gene, suggesting variation in the codon usage patterns. The major axis i.e., the first axis (f1) accounts for wide variations while the second axis (f2) accounts for narrow variation within the FoxP2 gene of fishes, birds, reptiles, and mammals. However, a majority of the codons were confined closer to the axis around the center of the plot, indicating underlying mutation bias on the composition of the nucleobase might affect the codon usage of the FoxP2 gene [54].

3.6. Analysis of Amino Acid Composition and Protein Properties

The amino acid compositions in the CDS of the FoxP2 gene among the various species of fishes, birds, reptiles, and mammals were calculated. The overall frequency of each of the amino acids in FoxP2 (Figure 7) revealed that Leucine, Glutamine, and Serine were predominant over other amino acids. The aromatic property of the amino acids (Phenylalanine, Tyrosine, and Tryptophan) present in the transcribed FoxP2 gene product (AROMATICITY) was 0.04 ± 0.001 (mean ± SD) while the property of hydrophobicity (GRAVY) was 0.70 ± 0.001 (mean ± SD). The GRAVY score value was negative, suggesting soluble properties of the protein product.

3.7. Phylogenetic Analysis

The neighbor-joining tree shows the same relationships between the FoxP2 genes obtained from different species (Figure 8). Two major clades were observed. Among the species Hipposideros armiger, FoxP2 genes have diverged from the rest of the mammalian FoxP2 gene sequence.

4. Discussion

The current study highlights the pattern of codon usage of the FoxP2 gene among fishes, reptiles, birds, and mammals. The study of the CUB of a gene is an important application in evolutionary biology and has been found in diverse groups of organisms, from unicellular prokaryotes to multicellular eukaryotes. The ’mutation-selection drift’ theory has been employed to depict the origin of codon usage bias (CUB) of a gene [55,56]. The theory explains that evolutionary forces such as the selection of compositional constraints, mutation pressure, along with genetic drift in a population might play an effective role in the usage of codon bias [57]. Earlier studies have reported that genes within a species exhibit similar patterns of codon usage [58,59].
Nucleotide composition plays an important role in influencing codon usage in genes as well as genomes. In our study of the FoxP2 gene, we found GC and P3 content was higher than 50% in fishes, while in reptiles, birds, and mammals, GC content was lower than 50%. Earlier reports suggested that genes with high GC content provide more targets for methylation [60]. High GC content might assist more complex gene regulation [61]. Since GC and P3 contents were high in the FoxP2 gene in fishes, they are more susceptible to mutation. This can be further supported by the neutrality plot, where mutational pressure is the highest in fish.
In the FoxP2 gene, the average ENC values in different species of fishes, reptiles, birds, and mammals were more than 50, which indicates CUB was low. Similar results were reported in the mitochondrial ND2 gene among fishes, birds, and mammals where the average ENC value was greater than 50, thereby supporting our results [62]. Low CUB might be beneficial for efficient replication in each cell, with potentially different codon preferences [63].
Two evolutionary forces such as natural selection and mutation pressure influenced CUB in the FoxP2 gene. We observed that the slope of the regression line was close to zero in all fishes, reptiles, birds, and mammals, which indicates the dominant role of natural selection rather than mutation pressure. Based on the regression coefficient, the role of mutation pressure was highest in fishes compared to reptiles, birds, and mammals. In ATP genes, the role of natural selection was higher than mutation pressure, and based on the regression coefficient, the role of mutation pressure was highest in fishes in compared to birds and mammals, supporting our results [64].
In summary, we found that codon usage bias in the coding sequences of the FoxP2 gene was relatively weak and influenced by natural selection along with nucleotide composition under mutation pressure. However, natural selection played a major role in comparison to mutation pressure in shaping the codon usage pattern, depicting weaker CUB. The over-represented codons (RSCU > 1.6, Table S3) in the coding sequences of the FoxP2 gene in fishes were AGA (R), CAG (Q), GGC (G), ATC (Ile), CTG (L), AGC (S), and GTG (V) while in birds the over-represented codons were GCA (A), AGA (R), GGA (G), TTT (F), CCA (P), and GTG (V). Similarly, the over-represented codons of FoxP2 genes in reptiles were GCA (A), AGA (R), GGA (G), and CCA (P), but in mammals, the over-represented codons of FoxP2 were CGA (R), GGA (G), and GTG (V). Moreover, it was observed that the most frequently used codons ended with C or G in fishes, whereas the codons ending with T or A were most frequently used in the genomes of birds, reptiles, and mammals. This study will help us to understand the CUB of the FoxP2 gene, which could further be used to explore their biology, particularly with regard to the mechanisms of communication among animals.

5. Conclusions

The codon usage bias in the FoxP2 gene among different species of fishes, birds, reptiles and mammals revealed that the most preferred codon used by fishes were either C or G-ending codons while in birds, reptiles and mammals the mostly used preferred codons were either ending with A or T. Apart from the nucleotide composition, natural selection and mutation pressure might influence the CUB. The ENC observed/ENC expected ratio demonstrated that mutation pressure influences FoxP2 codon usage patterns. Natural selection plays a major role over mutation pressure in the codon usage of FoxP2 gene. Besides, nucleotide composition under the influence of mutation bias also contributes the codon usage of FoxP2 gene and nature has favored nearly all the synonymous codons for encoding the corresponding amino acid.

Supplementary Materials

The following are available online at https://www.mdpi.com/article/10.3390/biology10111078/s1, Table S1: The accession number of the coding sequences of FoxP2 gene among different species of fishes, birds, reptiles, and mammals. Table S2: Composition of the nucleotide and ENC value along with the mean and standard deviation in the CDS of FoxP2 gene among different species of fish, birds, reptiles, and mammals. Table S3: The overall relative synonymous codon usage patterns (RSCU) in the coding sequences of FoxP2 gene among fishes, birds, reptiles, and mammals.

Author Contributions

Conceptualization, T.H.M.; methodology, T.H.M. and A.U.; software, T.H.M., A.M.A., T.A., T.B.E. and A.U.; validation, T.H.M., A.M.A., T.A., T.B.E. and A.U.; formal analysis T.H.M., T.B.E. and A.U.; investigation, T.H.M. and A.U.; resources, T.H.M., A.M.A., T.A., A.A.A., T.B.E. and A.U.; data curation, T.H.M. and A.U.; writing—original draft preparation, T.H.M. and A.U.; writing—review and editing, T.H.M., A.M.A., T.A., A.A.A., T.B.E. and A.U.; visualization, T.H.M., A.M.A., T.A., T.B.E. and A.U.; supervision, A.U.; project administration, T.H.M., A.M.A., T.A., T.B.E. and A.U.; funding acquisition, A.M.A., T.A., A.A.A., T.B.E. and A.U. All authors have read and agreed to the published version of the manuscript.

Funding

The authors are grateful to the Deanship of Scientific Research at King Khalid University for funding this study through the Small Research Group Project, under grant number GRP/340/42.

Institutional Review Board Statement

Not applicable.

Informed Consent Statement

Not applicable.

Data Availability Statement

Available data are presented in the manuscript and its Supplementary Materials.

Conflicts of Interest

The authors declare no conflict of interest for this article.

References

  1. Grantham, R.; Gautier, C.; Gouy, M. Codon frequencies in 119 individual genes confirm corsistent choices of degenerate bases according to genome type. Nucleic Acids Res. 1980, 8, 1893–1912. [Google Scholar] [CrossRef] [PubMed]
  2. Gouy, M.; Gautier, C. Codon usage in bacteria: Correlation with gene expressivity. Nucleic Acids Res. 1982, 10, 7055–7074. [Google Scholar] [CrossRef] [PubMed]
  3. Sharp, P.M.; Tuohy, T.M.F.; Mosurski, K.R. Codon usage in yeast: Cluster analysis clearly differentiates highly and lowly expressed genes. Nucleic Acids Res. 1986, 14, 5125–5143. [Google Scholar] [CrossRef] [PubMed]
  4. Sharp, P.; Li, W.-H. The codon adaptation index-a measure of directional synonymous codon usage bias, and its potential applications. Nucleic Acids Res. 1987, 15, 1281–1295. [Google Scholar] [CrossRef] [PubMed] [Green Version]
  5. Ma, J.; Campbell, A.; Karlin, S. Correlations between Shine-Dalgarno sequences and gene features such as predicted expression levels and operon structures. J. Bacteriol. 2002, 184, 5733–5745. [Google Scholar] [CrossRef] [Green Version]
  6. Osawa, S.; Ohama, T.; Yamao, F.; Muto, A.; Jukes, T.H.; Ozeki, H.; Umesono, K. Directional mutation pressure and transfer RNA in choice of the third nucleotide of synonymous two-codon sets. Proc. Natl. Acad. Sci. USA 1988, 85, 1124–1128. [Google Scholar] [CrossRef] [PubMed] [Green Version]
  7. D’Onofrio, G.; Mouchiroud, D.; Aïssani, B.; Gautier, C.; Bernardi, G. Correlations between the compositional properties of human genes, codon usage, and amino acid composition of proteins. J. Mol. Evol. 1991, 32, 504–510. [Google Scholar] [CrossRef] [PubMed]
  8. Lobry, J.; Gautier, C. Hydrophobicity, expressivity and aromaticity are the major trends of amino-acid usage in 999 Escherichia coli chromosome-encoded genes. Nucleic Acids Res. 1994, 22, 3174–3180. [Google Scholar] [CrossRef]
  9. Tao, X.; Dafu, D. The relationship between synonymous codon usage and protein structure. FEBS Lett. 1998, 434, 93–96. [Google Scholar] [CrossRef] [Green Version]
  10. D’Onofrio, G.; Ghosh, T.C.; Bernardi, G. The base composition of the genes is correlated with the secondary structures of the encoded proteins. Gene 2002, 300, 179–187. [Google Scholar] [CrossRef]
  11. Ikemura, T. Correlation between the abundance of Escherichia coli transfer RNAs and the occurrence of the respective codons in its protein genes: A proposal for a synonymous codon choice that is optimal for the E. coli translational system. J. Mol. Biol. 1981, 151, 389–409. [Google Scholar] [CrossRef]
  12. Ikemura, T. Correlation between the abundance of yeast transfer RNAs and the occurrence of the respective codons in protein genes: Differences in synonymous codon choice patterns of yeast and Escherichia coli with reference to the abundance of isoaccepting transfer RNAs. J. Mol. Biol. 1982, 158, 573–597. [Google Scholar]
  13. Bulmer, M. Coevolution of codon usage and transfer RNA abundance. Nat. Cell Biol. 1987, 325, 728–730. [Google Scholar] [CrossRef]
  14. Kanaya, S.; Yamada, Y.; Kudo, Y.; Ikemura, T. Studies of codon usage and tRNA genes of 18 unicellular organisms and quantification of Bacillus subtilis tRNAs: Gene expression level and species-specific diversity of codon usage based on multivariate analysis. Gene 1999, 238, 143–155. [Google Scholar] [CrossRef]
  15. Sueoka, N. Directional mutation pressure, selective constraints, and genetic equilibria. J. Mol. Evol. 1992, 34, 95–114. [Google Scholar] [CrossRef] [PubMed]
  16. Sueoka, N. Two Aspects of DNA Base Composition: G+C Content and Translation-Coupled Deviation from Intra-Strand Rule of A=T and G=C. J. Mol. Evol. 1999, 49, 49–62. [Google Scholar] [CrossRef] [PubMed]
  17. Sau, K.; Deb, A. Temperature Influences Synonymous Codon and Amino Acid Usage Biases in the Phages Infecting Extremely Thermophilic Prokaryotes. Silico Biol. 2009, 9, 1–9. [Google Scholar] [CrossRef]
  18. Bernardi, G.; Bernardi, G. Compositional constraints and genome evolution. J. Mol. Evol. 1986, 24, 1–11. [Google Scholar] [CrossRef] [PubMed]
  19. Karlin, S.; Mrázek, J. What Drives Codon Choices in Human Genes? J. Mol. Biol. 1996, 262, 459–472. [Google Scholar] [CrossRef]
  20. Antezana, M.A.; Kreitman, M. The Nonrandom Location of Synonymous Codons Suggests That Reading Frame-Independent Forces Have Patterned Codon Preferences. J. Mol. Evol. 1999, 49, 36–43. [Google Scholar] [CrossRef] [PubMed]
  21. Sueoka, N.; Kawanishi, Y. DNA G+C content of the third codon position and codon usage biases of human genes. Gene 2000, 261, 53–62. [Google Scholar] [CrossRef]
  22. Morton, B.R. The Role of Context-Dependent Mutations in Generating Compositional and Codon Usage Bias in Grass Chloroplast DNA. J. Mol. Evol. 2003, 56, 616–629. [Google Scholar] [CrossRef] [PubMed]
  23. Lai, C.S.L.; Fisher, S.; Hurst, J.A.; Vargha-Khadem, F.; Monaco, A. A forkhead-domain gene is mutated in a severe speech and language disorder. Nat. Cell Biol. 2001, 413, 519–523. [Google Scholar] [CrossRef] [PubMed]
  24. Pengra, I.G.; Marchaterre, M.A.; Bass, A.H. FoxP2 Expression in a Highly Vocal Teleost Fish with Comparisons to Tetrapods. Brain Behav. Evol. 2018, 91, 82–96. [Google Scholar] [CrossRef] [PubMed]
  25. Takahashi, K.; Liu, F.-C.; Oishi, T.; Mori, T.; Higo, N.; Hayashi, M.; Hirokawa, K.; Takahashi, H. Expression ofFOXP2in the developing monkey forebrain: Comparison with the expression of the genesFOXP1,PBX3, andMEIS2. J. Comp. Neurol. 2008, 509, 180–189. [Google Scholar] [CrossRef]
  26. Campbell, P.; Reep, R.L.; Stoll, M.L.; Ophir, A.G.; Phelps, S.M. Conservation and diversity of Foxp2 expression in muroid rodents: Functional implications. J. Comp. Neurol. 2009, 512, 84–100. [Google Scholar] [CrossRef] [Green Version]
  27. Mendoza, E.; Tokarev, K.; Düring, D.N.; Retamosa, E.C.; Weiss, M.; Arpenik, N.; Scharff, C. Differential coexpression of FoxP1, FoxP2, and FoxP4 in the Zebra Finch (Taeniopygia guttata) song system. J. Comp. Neurol. 2015, 523, 1318–1340. [Google Scholar] [CrossRef]
  28. Konopka, G.; Roberts, T.F. Insights into the Neural and Genetic Basis of Vocal Communication. Cell 2016, 164, 1269–1276. [Google Scholar] [CrossRef] [Green Version]
  29. Haesler, S.; Rochefort, C.; Georgi, B.; Licznerski, P.; Osten, P.; Scharff, C. Incomplete and Inaccurate Vocal Imitation after Knockdown of FoxP2 in Songbird Basal Ganglia Nucleus Area X. PLoS Biol. 2007, 5, e321. [Google Scholar] [CrossRef] [Green Version]
  30. Teramitsu, I.; Kudo, L.C.; London, S.E.; Geschwind, D.H.; White, S.A. Parallel FoxP1 and FoxP2 Expression in Songbird and Human Brain Predicts Functional Interaction. J. Neurosci. 2004, 24, 3152–3163. [Google Scholar] [CrossRef]
  31. Haesler, S.; Wada, K.; Nshdejan, A.; Morrisey, E.E.; Lints, T.; Jarvis, E.D.; Scharff, C. FoxP2 Expression in Avian Vocal Learners and Non-Learners. J. Neurosci. 2004, 24, 3164–3175. [Google Scholar] [CrossRef] [Green Version]
  32. Lai, C.S.L.; Gerrelli, D.; Monaco, A.P.; Fisher, S.E.; Copp, A.J. FOXP2 expression during brain development coincides with adult sites of pathology in a severe speech and language disorder. Brain 2003, 126, 2455–2462. [Google Scholar] [CrossRef] [PubMed]
  33. Itakura, T.; Chandra, A.; Yang, Z.; Xue, X.; Wang, B.; Kimura, W.; Hikosaka, K.; Inohaya, K.; Kudo, A.; Uezato, T.; et al. The Medaka FoxP2, a Homologue of Human Language Gene FOXP2, has a Diverged Structure and Function. J. Biochem. 2007, 143, 407–416. [Google Scholar] [CrossRef]
  34. Shah, R.; Medina-Martínez, O.; Chu, L.-F.; Samaco, R.C.; Jamrich, M. Expression of FoxP2 during zebrafish development and in the adult brain. Int. J. Dev. Biol. 2006, 50, 435–438. [Google Scholar] [CrossRef] [PubMed]
  35. Zhou, T.; Gu, W.; Ma, J.; Sun, X.; Lu, Z. Analysis of synonymous codon usage in H5N1 virus and other influenza A viruses. Biosystems 2005, 81, 77–86. [Google Scholar] [CrossRef]
  36. Wright, F. The ‘effective number of codons’ used in a gene. Gene 1990, 87, 23–29. [Google Scholar] [CrossRef]
  37. Wong, E.H.; Smith, D.K.; Rabadan, R.; Peiris, M.; Poon, L.L.M. Codon usage bias and the evolution of influenza A viruses. Codon Usage Biases of Influenza Virus. BMC Evol. Biol. 2010, 10, 253. [Google Scholar]
  38. Sueoka, N. Intrastrand parity rules of DNA base composition and usage biases of synonymous codons. J. Mol. Evol. 1996, 42, 323. [Google Scholar] [CrossRef] [Green Version]
  39. Perrière, G.; Thioulouse, J. Use and misuse of correspondence analysis in codon usage studies. Nucleic Acids Res. 2002, 30, 4548–4555. [Google Scholar] [CrossRef] [Green Version]
  40. Wang, H.C.; Hickey, D.A. Rapid divergence of codon usage patterns within the rice genome. BMC Evol. Biol. 2007, 7, 1–10. [Google Scholar] [CrossRef] [Green Version]
  41. Sueoka, N. Directional mutation pressure and neutral molecular evolution. Proc. Natl. Acad. Sci. USA 1988, 85, 2653–2657. [Google Scholar] [CrossRef] [Green Version]
  42. Satapathy, S.S.; Sahoo, A.K.; Ray, S.K.; Ghosh, T.C. Codon degeneracy and amino acid abundance influence the measures of codon usage bias: Improved Nc ( N ^ c ) and ENCprime ( N ^ c ) measures. Genes Cells 2017, 22, 277–283. [Google Scholar] [CrossRef] [PubMed] [Green Version]
  43. Tamura, K.; Stecher, G.; Peterson, D.; Filipski, A.; Kumar, S. MEGA6: Molecular evolutionary genetics analysis version 6.0. Mol. Biol. Evol. 2013, 30, 2725–2729. [Google Scholar] [CrossRef] [PubMed] [Green Version]
  44. Babicki, S.; Arndt, D.; Marcu, A.; Liang, Y.; Grant, J.R.; Maciejewski, A.; Wishart, D.S. Heatmapper: Web-enabled heat mapping for all. Nucleic Acids Res. 2016, 44, W147–W153. [Google Scholar] [CrossRef] [PubMed]
  45. Hammer, Ø.; Harper, D.A.; Ryan, P.D. PAST: Paleontological statistics software package for education and data analysis. Palaeontol. Electron. 2001, 4, 9. [Google Scholar]
  46. Afgan, E.; Baker, D.; Batut, B.; van den Beek, M.; Bouvier, D.; Čech, M.; Chilton, J.; Clements, D.; Coraor, N.; Grüning, B.A.; et al. The Galaxy platform for accessible, reproducible and collaborative biomedical analyses: 2018 update. Nucleic Acids Res. 2018, 46, W537–W544. [Google Scholar] [CrossRef] [Green Version]
  47. Zhang, R.; Zhang, L.; Wang, W.; Zhang, Z.; Du, H.; Qu, Z.; Li, X.-Q.; Xiang, H. Differences in Codon Usage Bias between Photosynthesis-Related Genes and Genetic System-Related Genes of Chloroplast Genomes in Cultivated and Wild Solanum Species. Int. J. Mol. Sci. 2018, 19, 3142. [Google Scholar] [CrossRef] [Green Version]
  48. Wei, L.; He, J.; Jia, X.; Qi, Q.; Liang, Z.; Zheng, H.; Ping, Y.; Liu, S.; Sun, J. Analysis of codon usage bias of mitochondrial genome in Bombyx mori and its relation to evolution. BMC Evol. Biol. 2014, 14, 262. [Google Scholar] [CrossRef] [PubMed] [Green Version]
  49. Kawabe, A.; Miyashita, N.T. Patterns of codon usage bias in three dicot and four monocot plant species. Genes Genet. Syst. 2003, 78, 343–352. [Google Scholar] [CrossRef] [Green Version]
  50. Li, X.; Song, H.; Kuang, Y.; Chen, S.; Tian, P.; Li, C.; Nan, Z. Genome-Wide Analysis of Codon Usage Bias in Epichloë festucae. Int. J. Mol. Sci. 2016, 17, 1138. [Google Scholar] [CrossRef] [Green Version]
  51. De Mandal, S.; Mazumder, T.H.; Panda, A.K.; Kumar, N.S.; Jin, F. Analysis of synonymous codon usage patterns of HPRT1 gene across twelve mammalian species. Genetics 2020, 112, 304–311. [Google Scholar] [CrossRef]
  52. Mazumder, T.H.; Chakraborty, S. Gaining insights into the codon usage patterns of TP53 gene across eight mammalian species. PLoS ONE 2015, 10, e0121709. [Google Scholar] [CrossRef] [PubMed] [Green Version]
  53. Romero, H.; Zavala, A.; Musto, H. Codon usage in Chlamydia trachomatis is the result of strand-specific mutational biases and a complex pattern of selective forces. Nucleic Acids Res. 2000, 28, 2084–2090. [Google Scholar] [CrossRef] [PubMed] [Green Version]
  54. Uddin, A.; Mazumder, T.H.; Chakraborty, S. Understanding molecular biology of codon usage in mitochondrial complex IV genes of electron transport system: Relevance to mitochondrial diseases. J. Cell. Physiol. 2019, 234, 6397–6413. [Google Scholar] [CrossRef] [PubMed]
  55. Bulmer, M. The selection-mutation-drift theory of synonymous codon usage. Genetics 1991, 129, 897–907. [Google Scholar] [CrossRef] [PubMed]
  56. Zalucki, Y.M.; Power, P.M.; Jennings, M.P. Selection for efficient translation initiation biases codon usage at second amino acid position in secretory proteins. Nucleic Acids Res. 2007, 35, 5748–5754. [Google Scholar] [CrossRef]
  57. Khan, M.S.; Guan, D.; Ma, L.; Xie, J.; Xu, S. Analysis of synonymous codon usage pattern of genes in unique non–blood-sucking leech Whitmania pigra. J. Cell. Biochem. 2019, 120, 9850–9858. [Google Scholar] [CrossRef] [PubMed]
  58. Supek, F.; Vlahoviček, K. Comparison of codon usage measures and their applicability in prediction of microbial gene expressivity. BMC Bioinform. 2005, 6, 182. [Google Scholar] [CrossRef] [PubMed] [Green Version]
  59. Behura, S.K.; Severson, D.W. Comparative Analysis of Codon Usage Bias and Codon Context Patterns between Dipteran and Hymenopteran Sequenced Genomes. PLoS ONE 2012, 7, e43111. [Google Scholar]
  60. Salinas, J.; Matassi, G.; Montero, L.M.; Bernardi, G. Compositional compartmentalization and compositional patterns in the nuclear genomes of plants. Nucleic Acids Res. 1988, 16, 4269–4285. [Google Scholar] [CrossRef] [Green Version]
  61. Šmarda, P.; Bureš, P.; Horová, L.; Leitch, I.J.; Mucina, L.; Pacini, E.; Tichý, L.; Grulich, V.; Rotreklová, O. Ecological and evolutionary significance of genomic GC content diversity in monocots. Proc. Natl. Acad. Sci. USA 2014, 111, E4096–E4102. [Google Scholar] [CrossRef] [Green Version]
  62. Uddin, A.; Mazumder, T.H.; Choudhury, M.N.; Chakraborty, S. Codon bias and gene expression of mitochondrial ND2 gene in chordates. Bioinformation 2015, 11, 407–412. [Google Scholar] [CrossRef] [PubMed] [Green Version]
  63. Jenkins, G.M.; Holmes, E.C. The extent of codon usage bias in human RNA viruses and its evolutionary origin. Virus Res. 2003, 92, 1–7. [Google Scholar] [CrossRef]
  64. Uddin, A.; Mazumder, T.H.; Barbhuiya, P.A.; Chakraborty, S. Similarities and dissimilarities of codon usage in mitochondrial ATP genes among fishes, aves, and mammals. IUBMB Life 2020, 72, 899–914. [Google Scholar] [CrossRef] [PubMed]
Figure 1. The correlation analysis between the mean value of GC contents and its different codon positions P1, P2, P3, and P12 for Foxp2 genes among fishes, birds, reptiles, and mammals. The dotted lines with asterisk (*) represents significant correlation while the line without dots represents no significant correlation detected in their Pairwise analysis. * p < 0.05 and ** p < 0.01.
Biology 10 01078 g001
Figure 2. The frequency distribution plot for effective number of codons ratio of observed ENC and expected ENC [(ENCexp-ENCobs)/ENCexp].
Biology 10 01078 g002
Figure 3. The correlation analysis between synonymous codon usage and GC3 values using a heatmap. The black fields represent stop codons (TAA, TAG, and TGA) and non-degenerate codons (ATG, TGG). Uniform usage codons (ATA, ATT, ATC, ACC, TTC, TGT, TGC, CTC, GAC, GTT, GGA, and GGG) were observed only among bird species and are represented as black color.
Biology 10 01078 g003
Figure 4. Parity plot analysis of Foxp2 gene among different species of fishes, reptiles, birds, and mammals showing mean values of both AT bias and GC bias were greater than 0.5, which indicates the preferential usage of purine over pyrimidine at the third-position codon. We have plotted the values of GC bias [G3/(G3 + C3)] along the X-axis and the values of AT [A3/(A3 + T3)] bias along the Y-axis.
Biology 10 01078 g004
Figure 5. Neutrality plot (P12 versus P3) in the coding sequence of Foxp2 gene among different species of fishes, birds, reptiles, and mammals. The values of P3 were plotted on X-axis and P12 (the average of P1 and P2) was plotted on Y-axis. Black line is the linear regression of P12 versus P3.
Biology 10 01078 g005
Figure 6. The correspondence analysis of RSCU values for Foxp2 gene in fishes, birds, reptiles, and mammals. In the plot, each of the points indicate the variation of genes corresponding to the coordinate of first (f1) and second (f2) axes of variation.
Biology 10 01078 g006
Figure 7. Overall frequency of amino acids used in the Foxp2 gene among various species of fishes, reptiles, birds, and mammals. The amino acids glutamine (Gln), leucine (Leu), and serine (Ser) were predominant over other amino acids.
Biology 10 01078 g007
Figure 8. Phylogenetic analysis based on the coding sequence of Foxp2 gene among fishes, birds, reptiles, and mammals (33 species). The tree was constructed using bootstrap analysis of 1000 replicates. Evolutionary analyses were conducted in MEGA6.
Biology 10 01078 g008
Table 1. Characteristics of FoxP2 gene among different groups of animals.
FishBirdsReptilesMammals
Lengthcds2228 ± 101.572118 ± 28.142153 ± 42.202134 ± 36.45
GCcds55.8 ± 4.0547.7 ± 0.4846.8 ± 0.7049.2 ± 1.98
P161.2 ± 1.6459.2 ± 0.1458.7 ± 0.6760.2 ± 0.45
P243.0 ± 2.3338.4 ± 0.6838.2 ± 0.2038.3 ± 0.72
P363.2 ± 8.9945.3 ± 0.8643.4 ± 2.0549.0 ± 4.86
P1252.1 ± 1.9231.6 ± 0.0748.4 ± 0.2849.3 ± 0.57
ENC52.22 ± 3.4753.05 ± 1.9554.65 ± 1.2354.63 ± 1.24
GRAVY−0.62 ± 0.04−0.74 ± 0.01−0.72 ± 0.04−0.74 ± 0.04
AROMATICITY0.04 ± 0.0010.01 ± 0.0010.04 ± 0.0010.04 ± 0.002
Lengthcds: Length of the coding sequences; GCcds: GC contents of the coding sequences; P1: GC content at the 1st codon position; P2: GC content at the 2nd codon position; P3: GC content at the third codon position; P12: The average of P1 and P2; ENC: Effective number of codons; GRAVY: Hydrophobicity of amino acid; AROMATICITY: Aromatic properties of amino acid.
Table 2. Correlation analysis between overall nucleotide and the corresponding nucleotide at the third codon position.
FISHA3%T3%G3%C3%GC3%
A%r = 0.966 **r = 0.912 **r = −0.931 **r = −0.946 **r = −0.945 **
T%r = 0.979 **r = 0.989 **r = −0.971 **r = −0.993 **r = −0.990 **
G%r = −0.952 **r = −0.892 **r = 0.915 **r = 0.929 **r = 0.928 **
C%r = −0.984 **r = −0.988 **r = 0.974 **r = 0.993 **r = 0.992 **
GC%r = −0.986 **r = −0.958 **r = 0.962 **r = 0.980 **r = 0.978 **
BIRDSA3%T3%G3%C3%GC3%
A%r = 0.980 *r = 0.898r = −0.893r = −0.983 *r = −0.983 *
T%r = 0.649r = 0.967 *r = −0.816r = −0.887r = −0.887
G%r = −0.835r = −0.865r = 0.700 *r = 0.941r = 0.929
C%r = −0.881r = −0.981r = 0.908r = 0.994 **r = 0.994 **
GC%r = −0.915r = −0.963 *r = 0.902r = 1.000 **r = 0.999 **
REPTILESA3%T3%G3%C3%GC3%
A%r = 0.967 **r = 0.299r = −0.879r = −0.452r = −0.957 **
T%r = −0.389 **r = 0.553r = 0.290r = −0.285r = 0.056
G%r = −0.944 **r = 0.222r = 0.958 **r = −0.111 **r = 0.684
C%r = 0.081r = −0.931 **r = −0.166r = 0.865 *r = 0.384
GC%r = −0.827 *r = −0.549r = 0.767r = 0.605r = 0.961 **
MAMMALSA3%T3%G3%C3%GC3%
A%r = 0.987 **r = 0.956 **r = −0.812 **r = −0.968 **r = −0.983 **
T%r = 0.954 **r = 0.998 **r = −0.913 **r = −0.893 **r = −0.983 **
G%r = −0.968 **r = −0.984 **r = 0.950 **r = 0.870 **r = 0.985
C%r = −0.972 **r = −0.931 **r = 0.739 **r = 0.990 **r = 0.964 **
GC%r = −0.989 **r = −0.980 **r = 0.858 **r = 0.953 **r = 0.995 **
** p < 0.01, * p < 0.05, Bold: negative correlation.
Table 3. Correlation analysis (Spearman rank) between overall ENC and P1, P2, P3, and P12 values of FoxP2 gene among fish, birds, reptiles, and mammals.
ENCP1P2P3P12
BIRDS−0.2000.8001.000 **0.949
FISH−0.742 **−0.505−0.938 **−0.754 **
REPTILES0.290−0.4930.5430.638
MAMMALS0.251−0.2570.305−0.046
Here, ** p < 0.01.
Publisher’s Note: MDPI stays neutral with regard to jurisdictional claims in published maps and institutional affiliations.

