
Oral Glucose Load and Human Cutaneous Microcirculation: An Insight into Flowmotion Assessed by Wavelet Transform


Abstract
:Simple Summary
Abstract
1. Introduction
2. Materials and Methods
2.1. Subjects
2.2. Procedure
2.3. Instruments
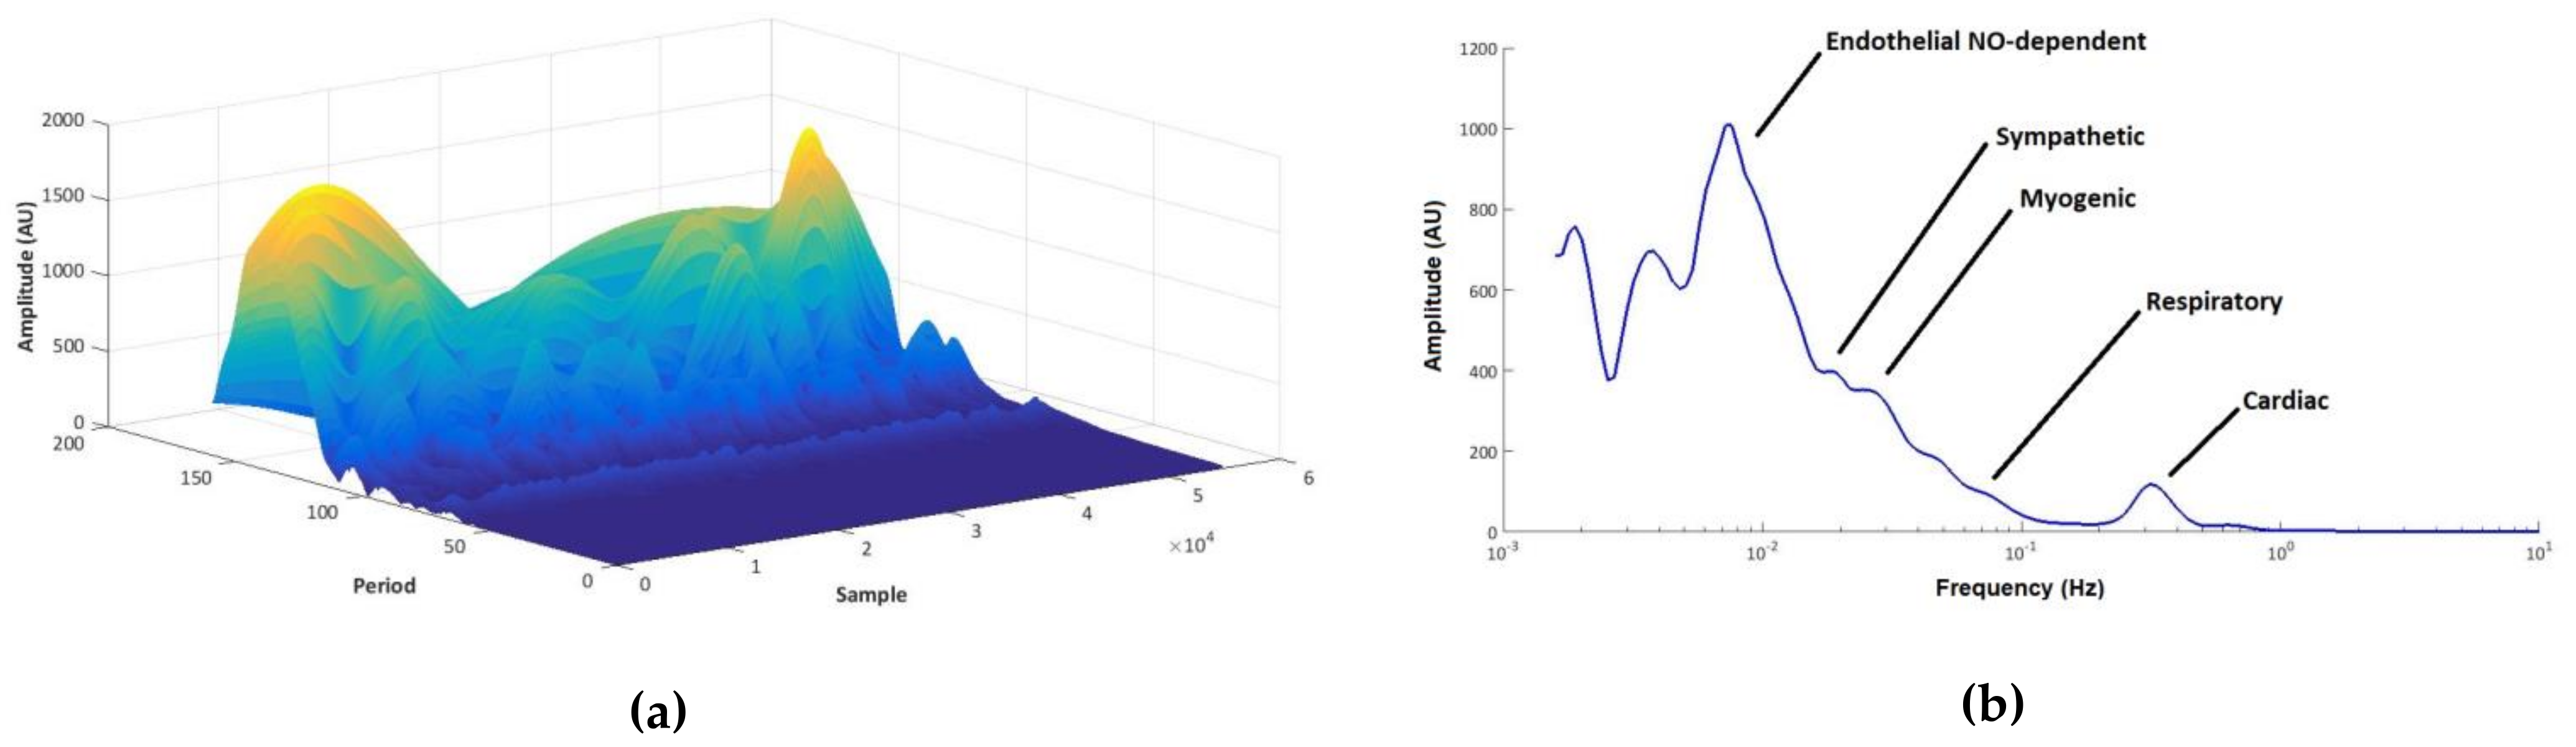
2.4. Analytical
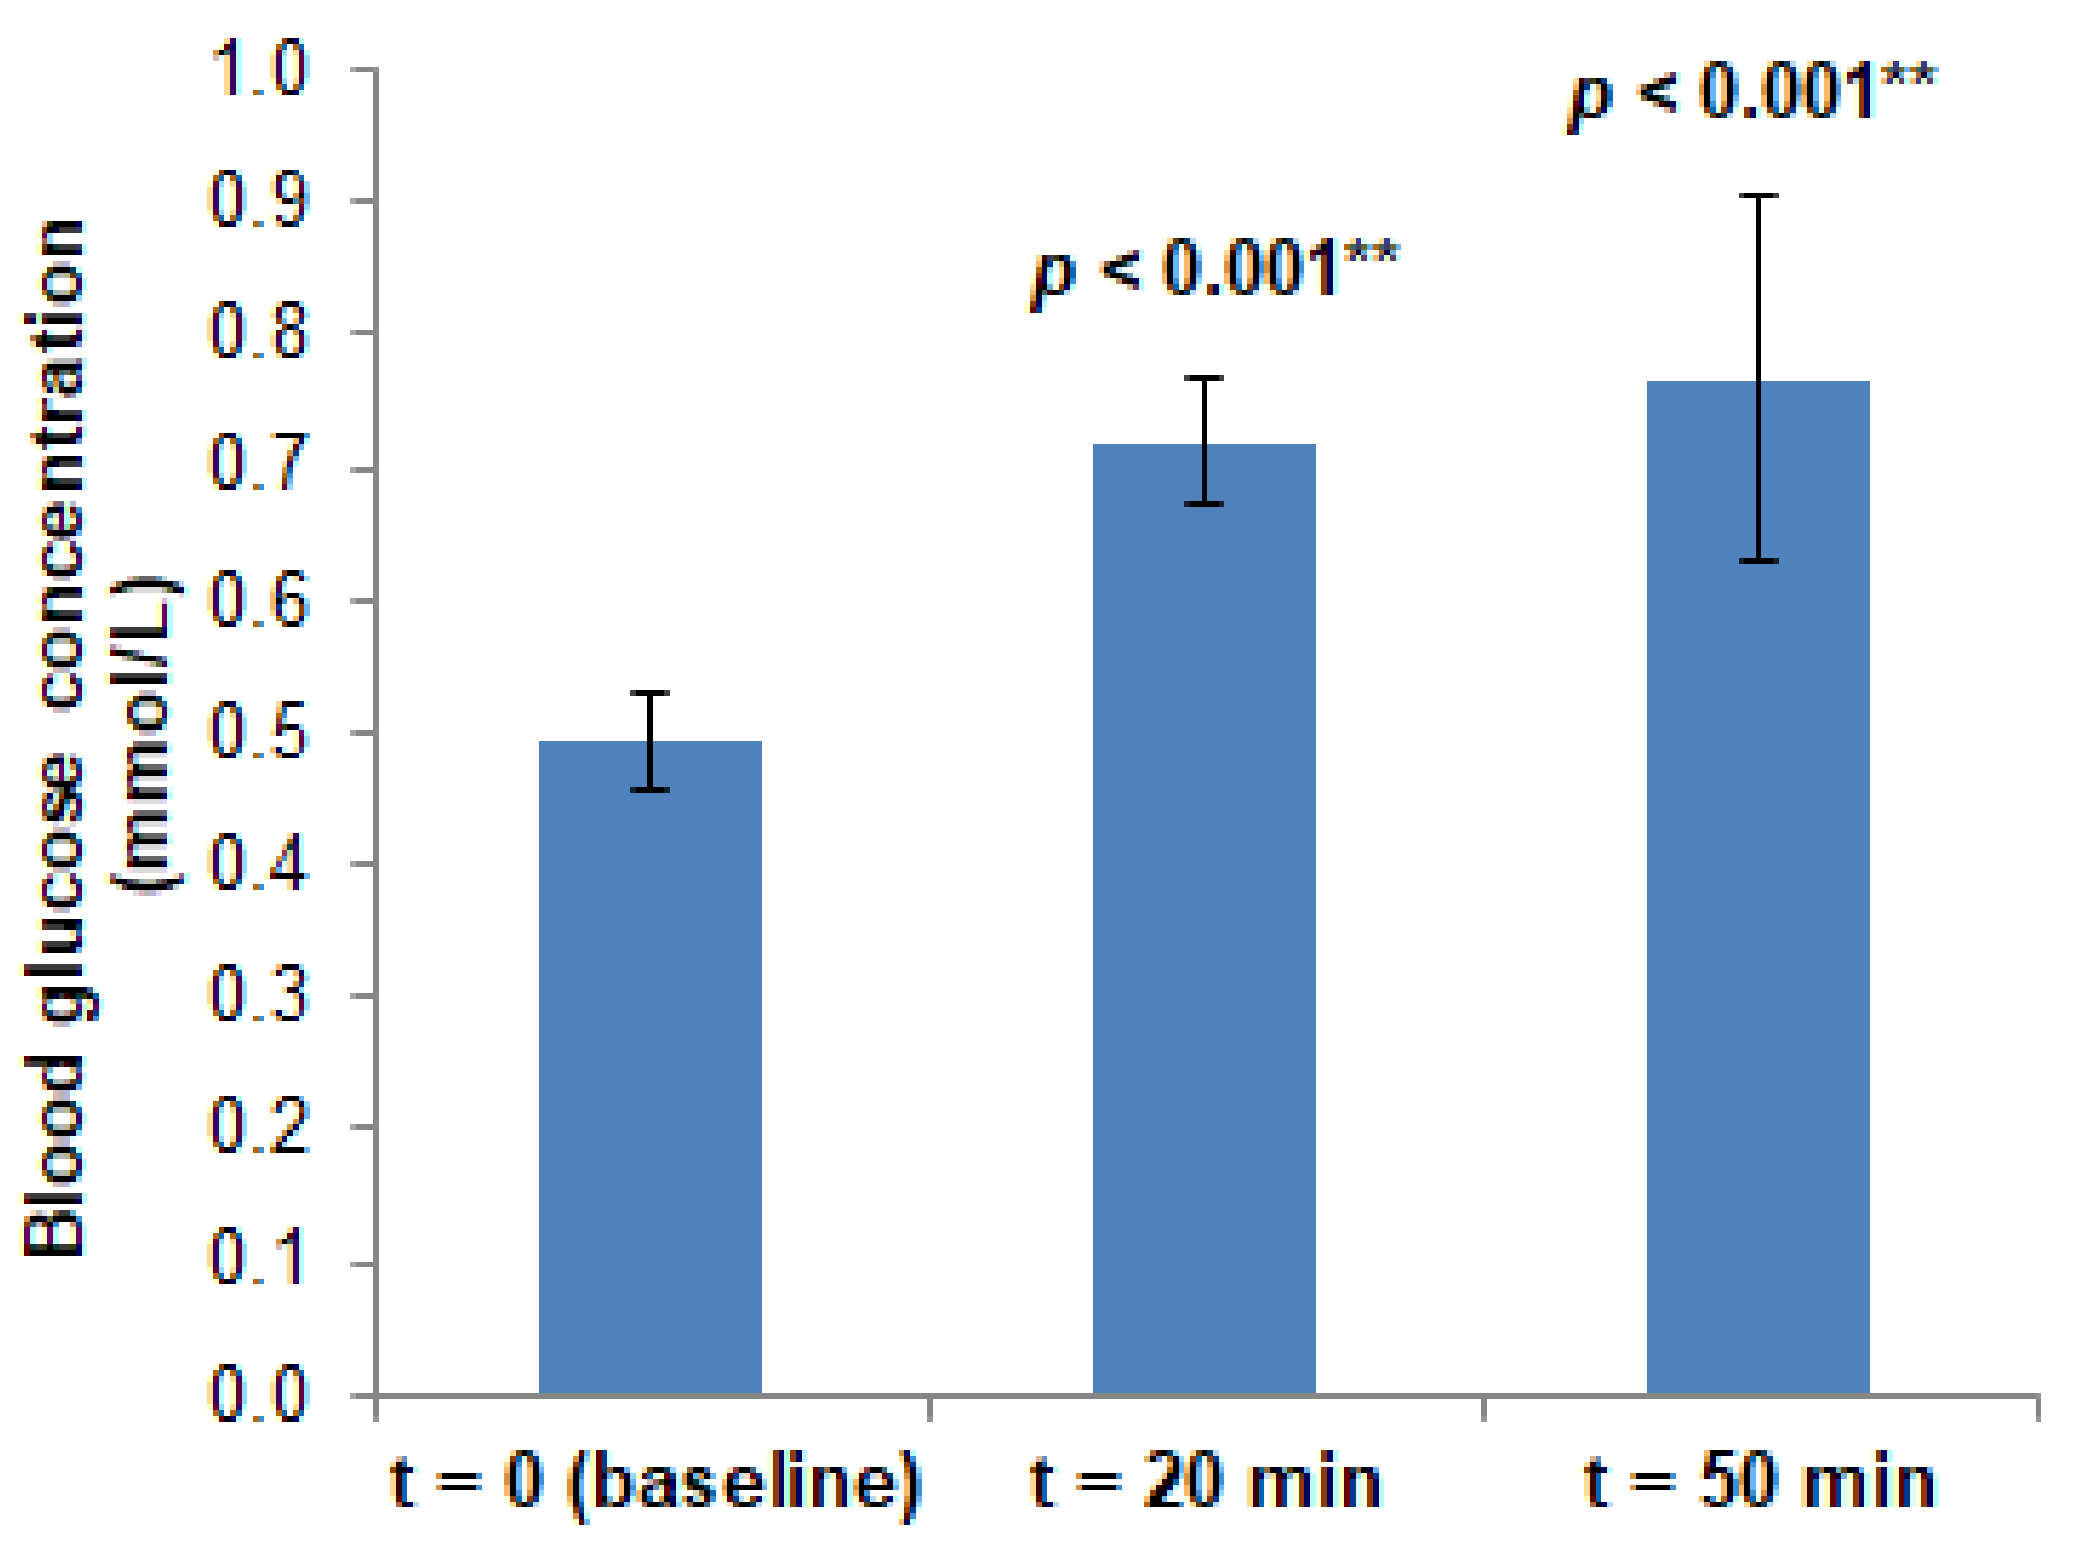
3. Results
3.1. Resting Blood Flow Recordings
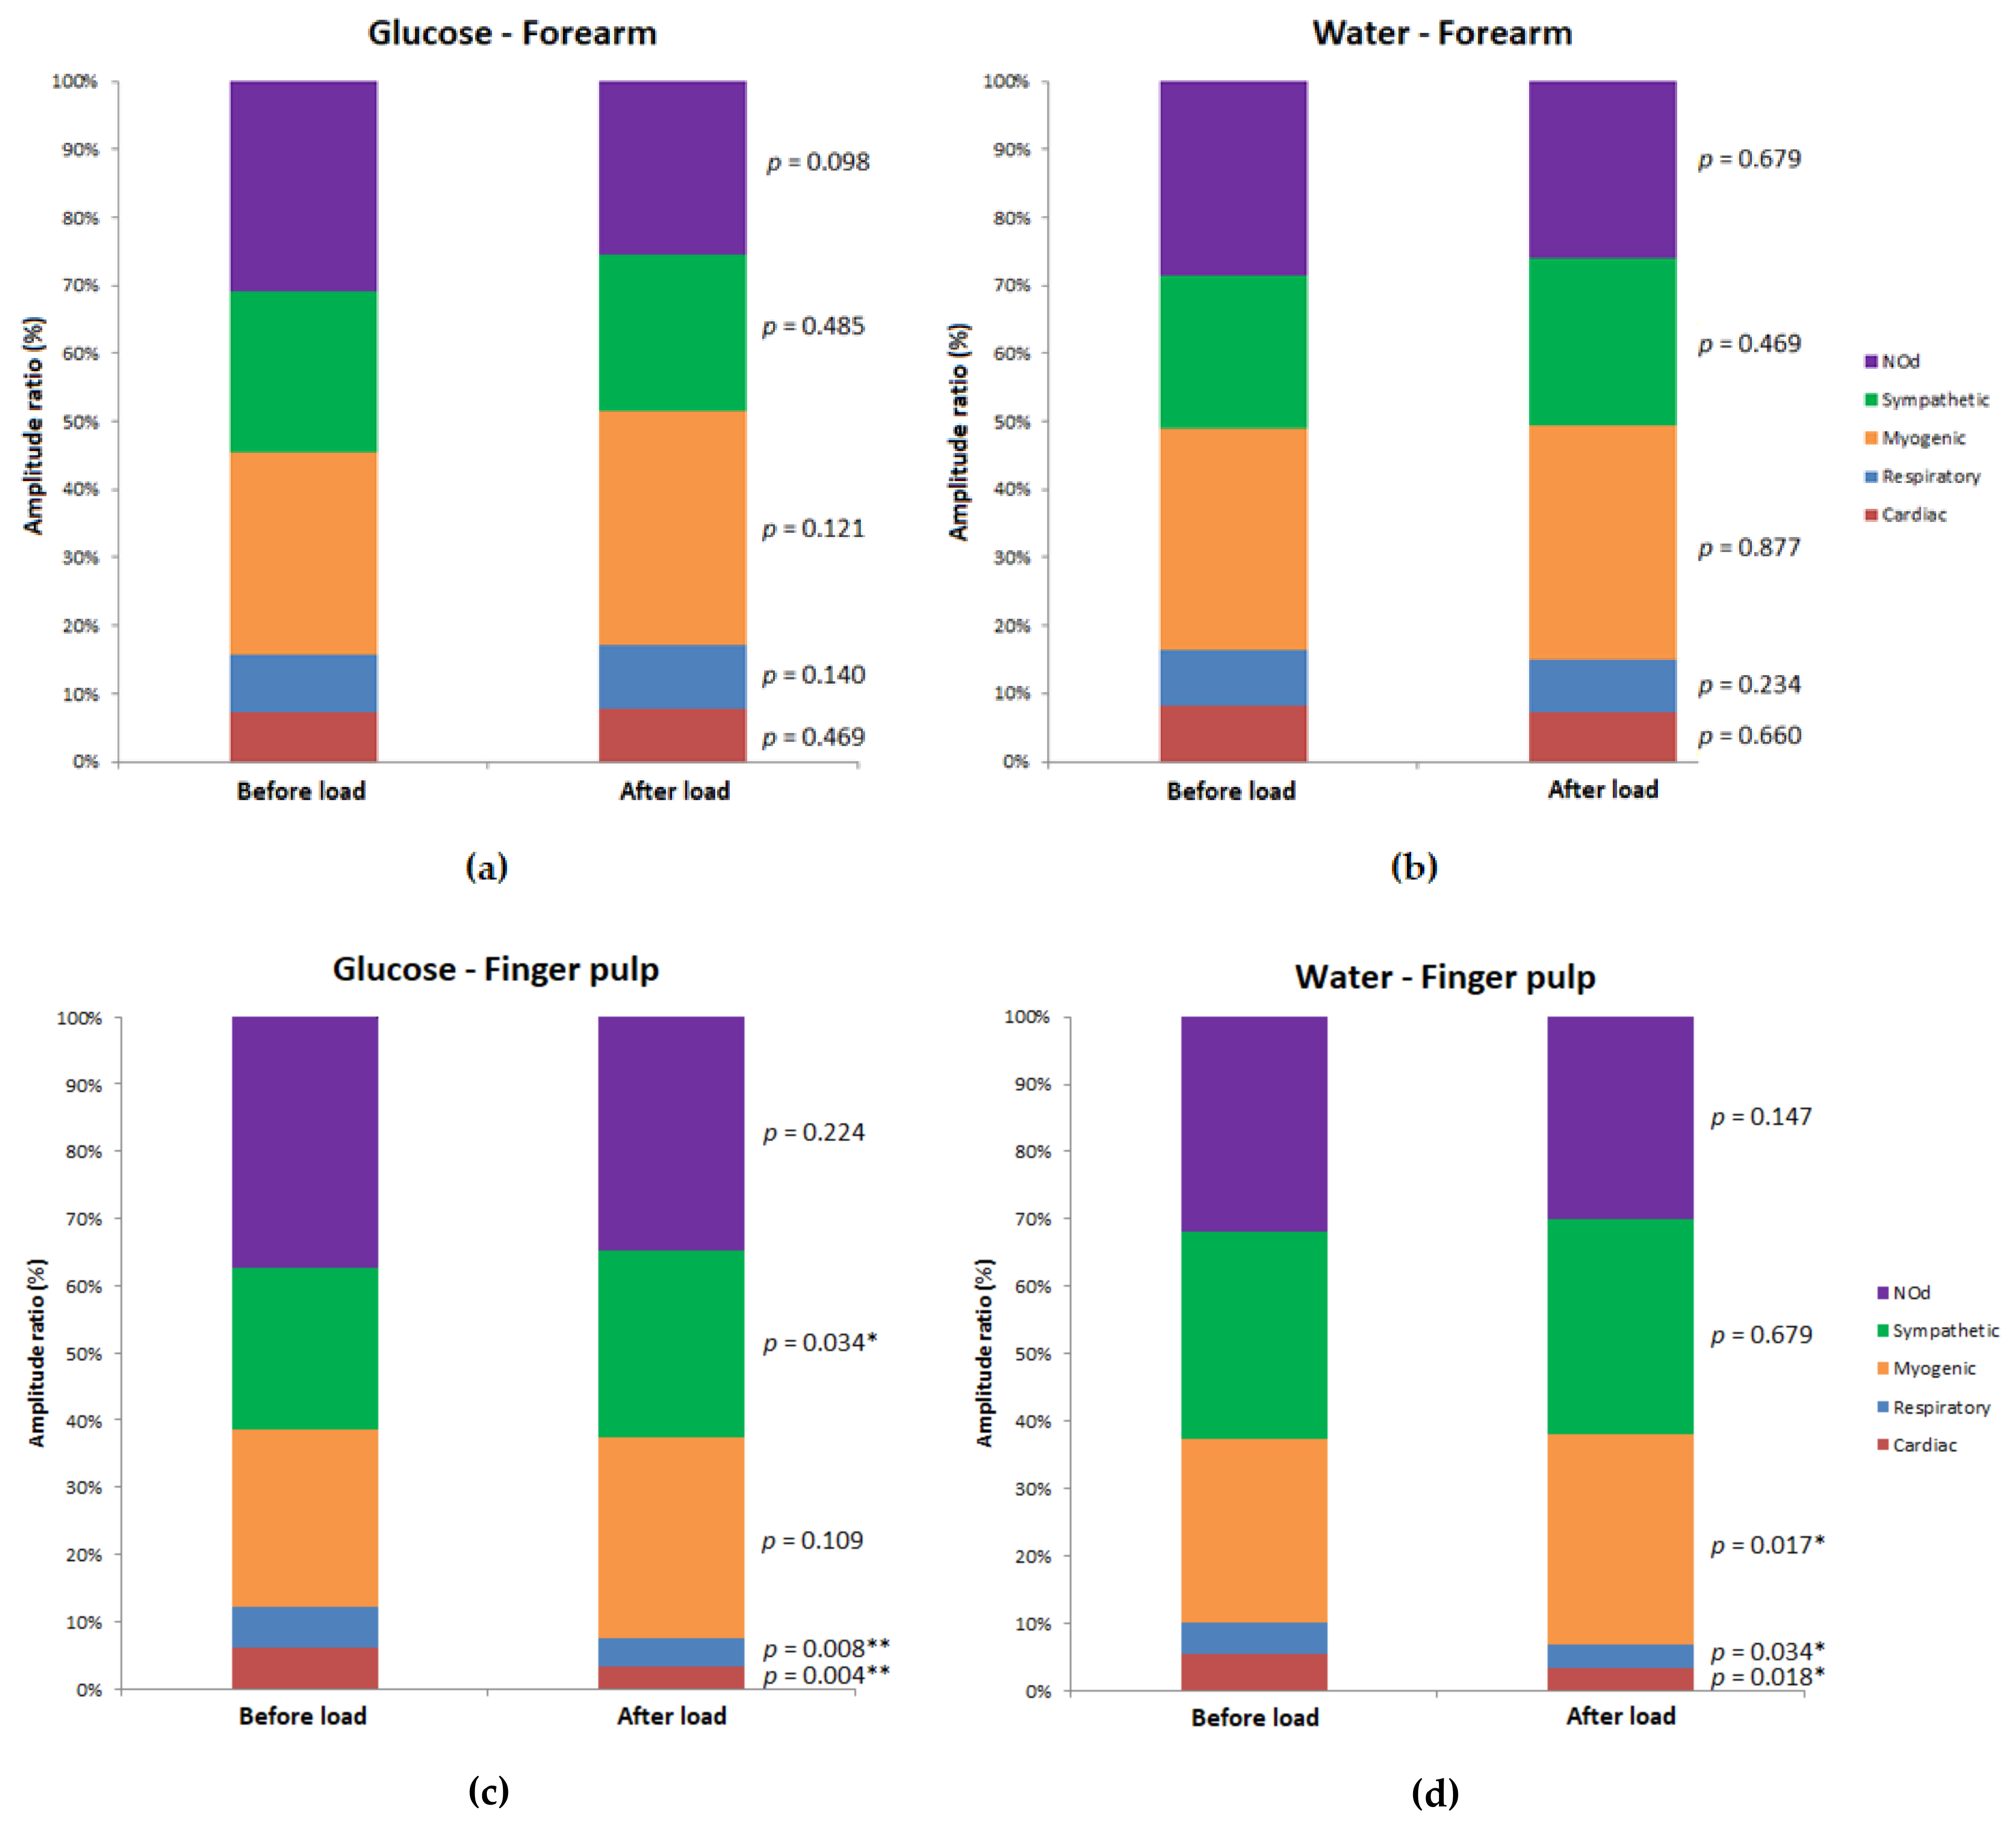
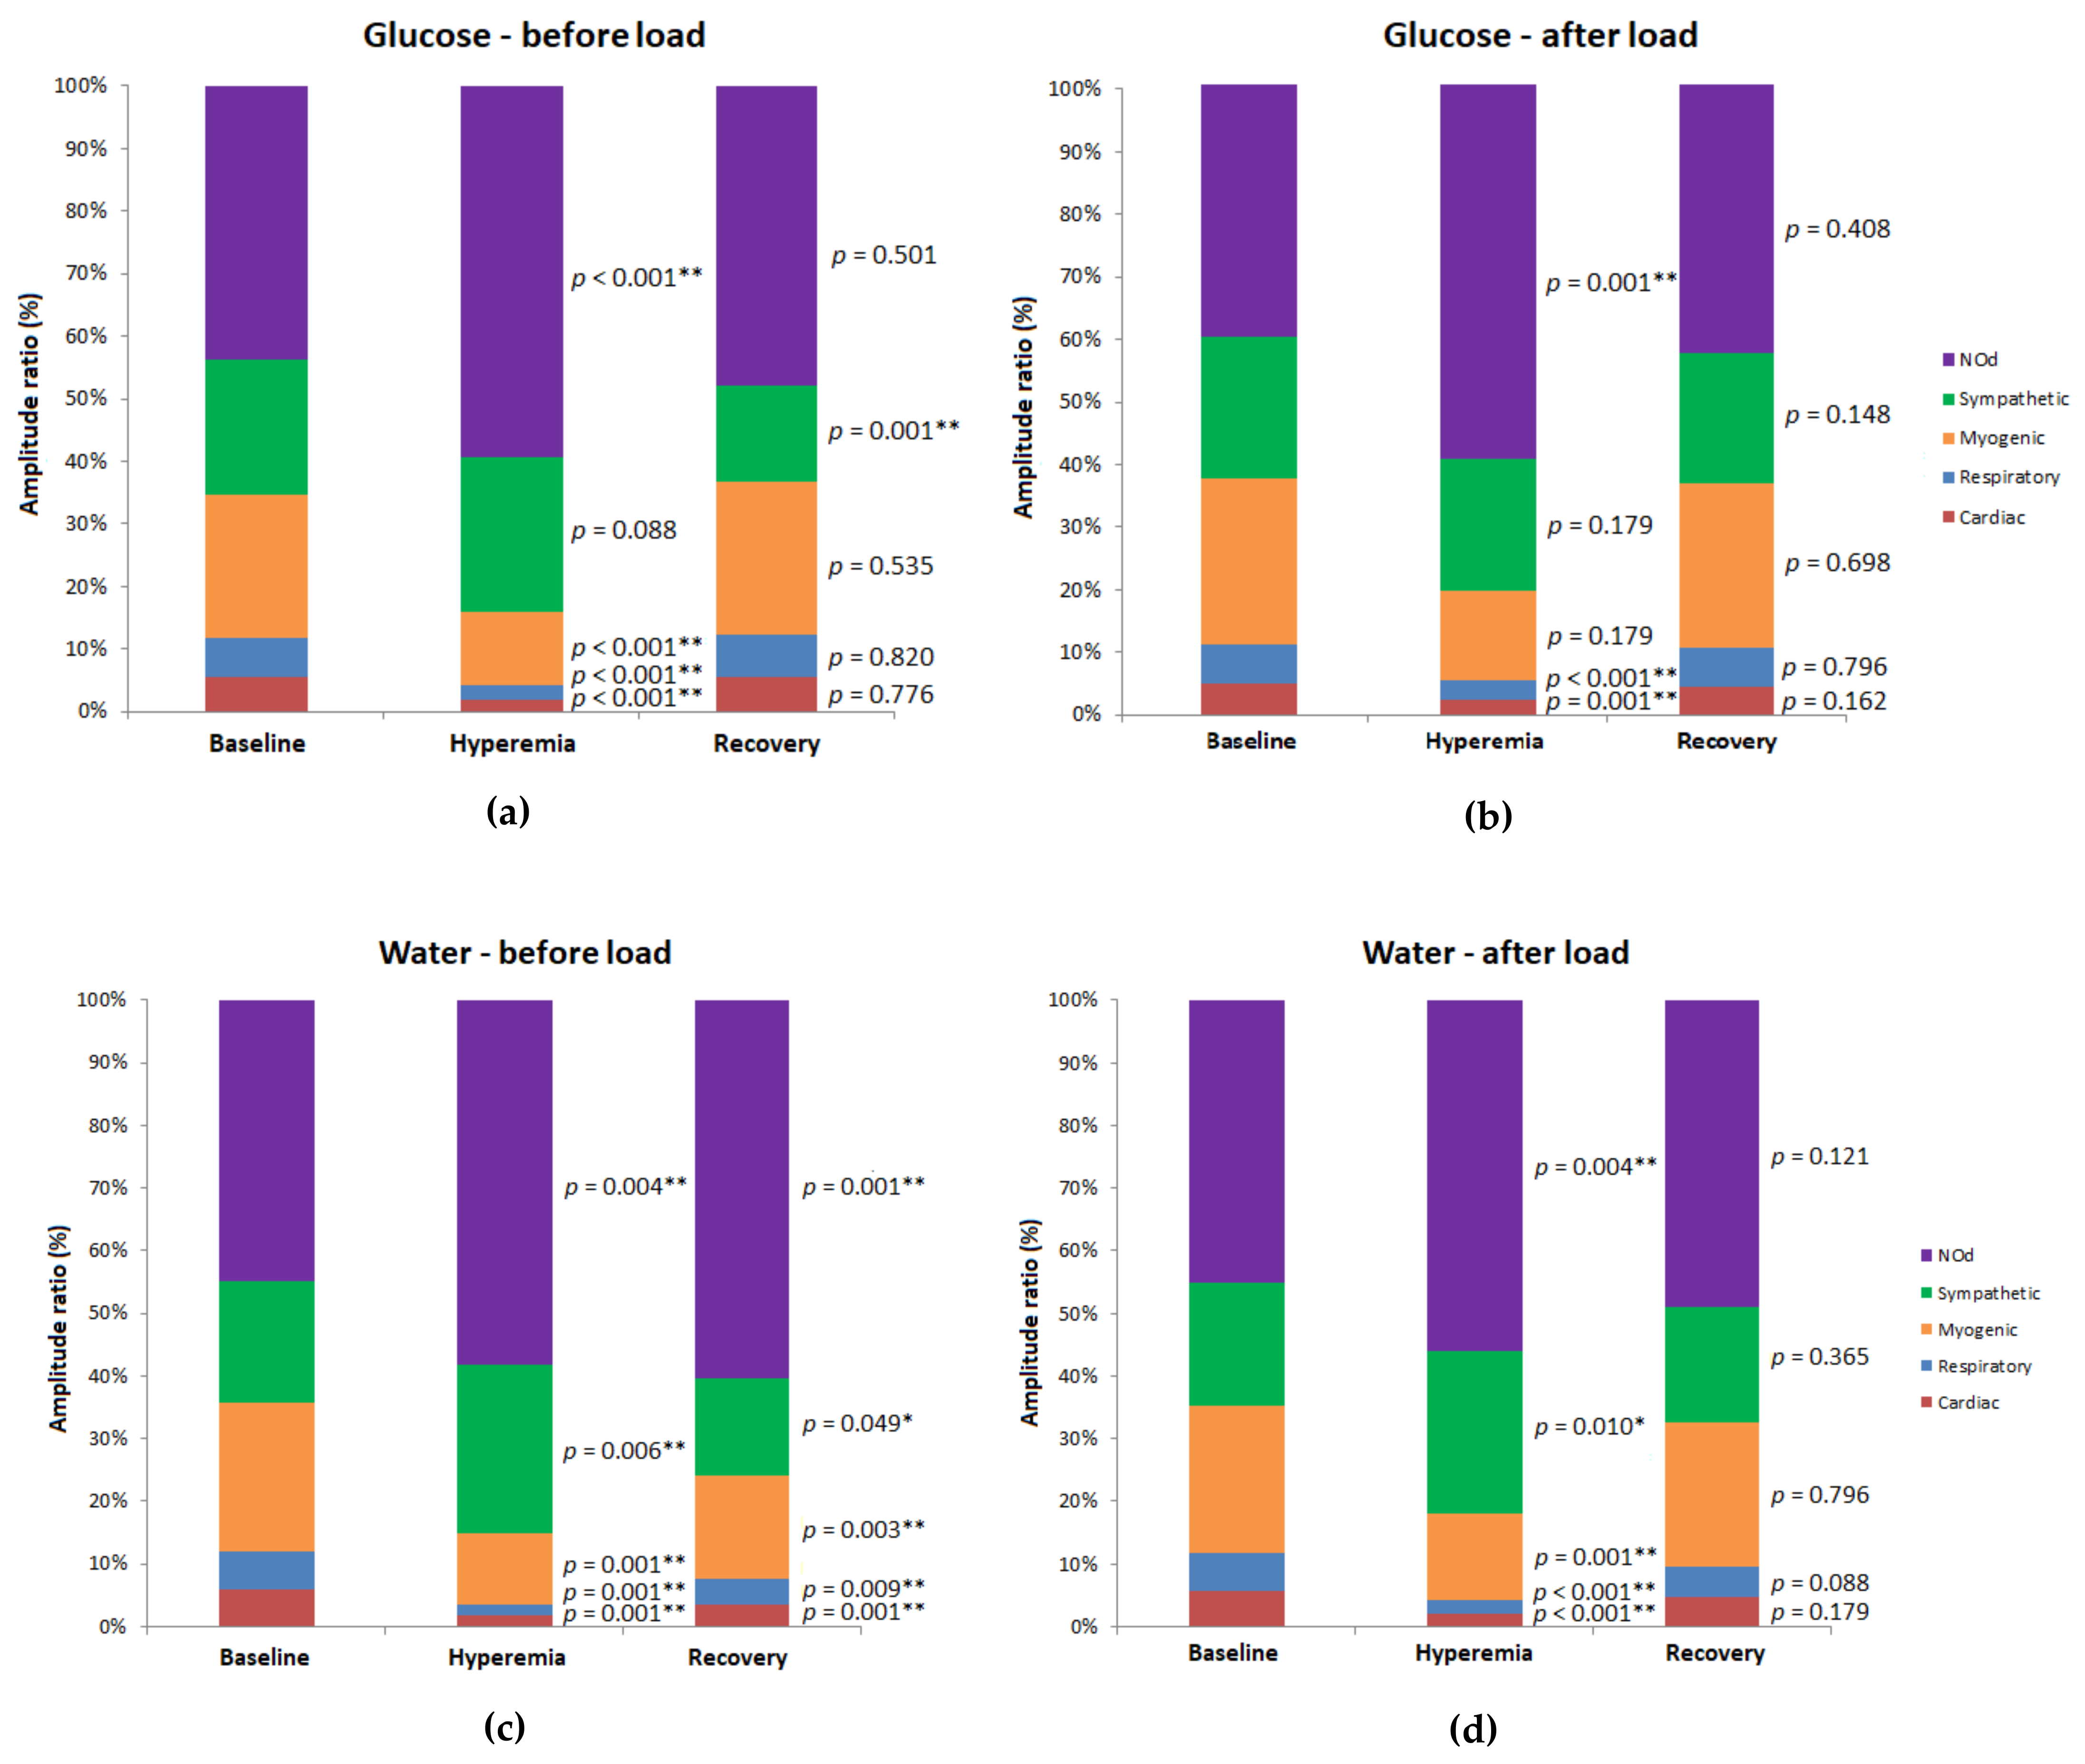
3.2. PORH Profile Recordings
3.2.1. Forearm
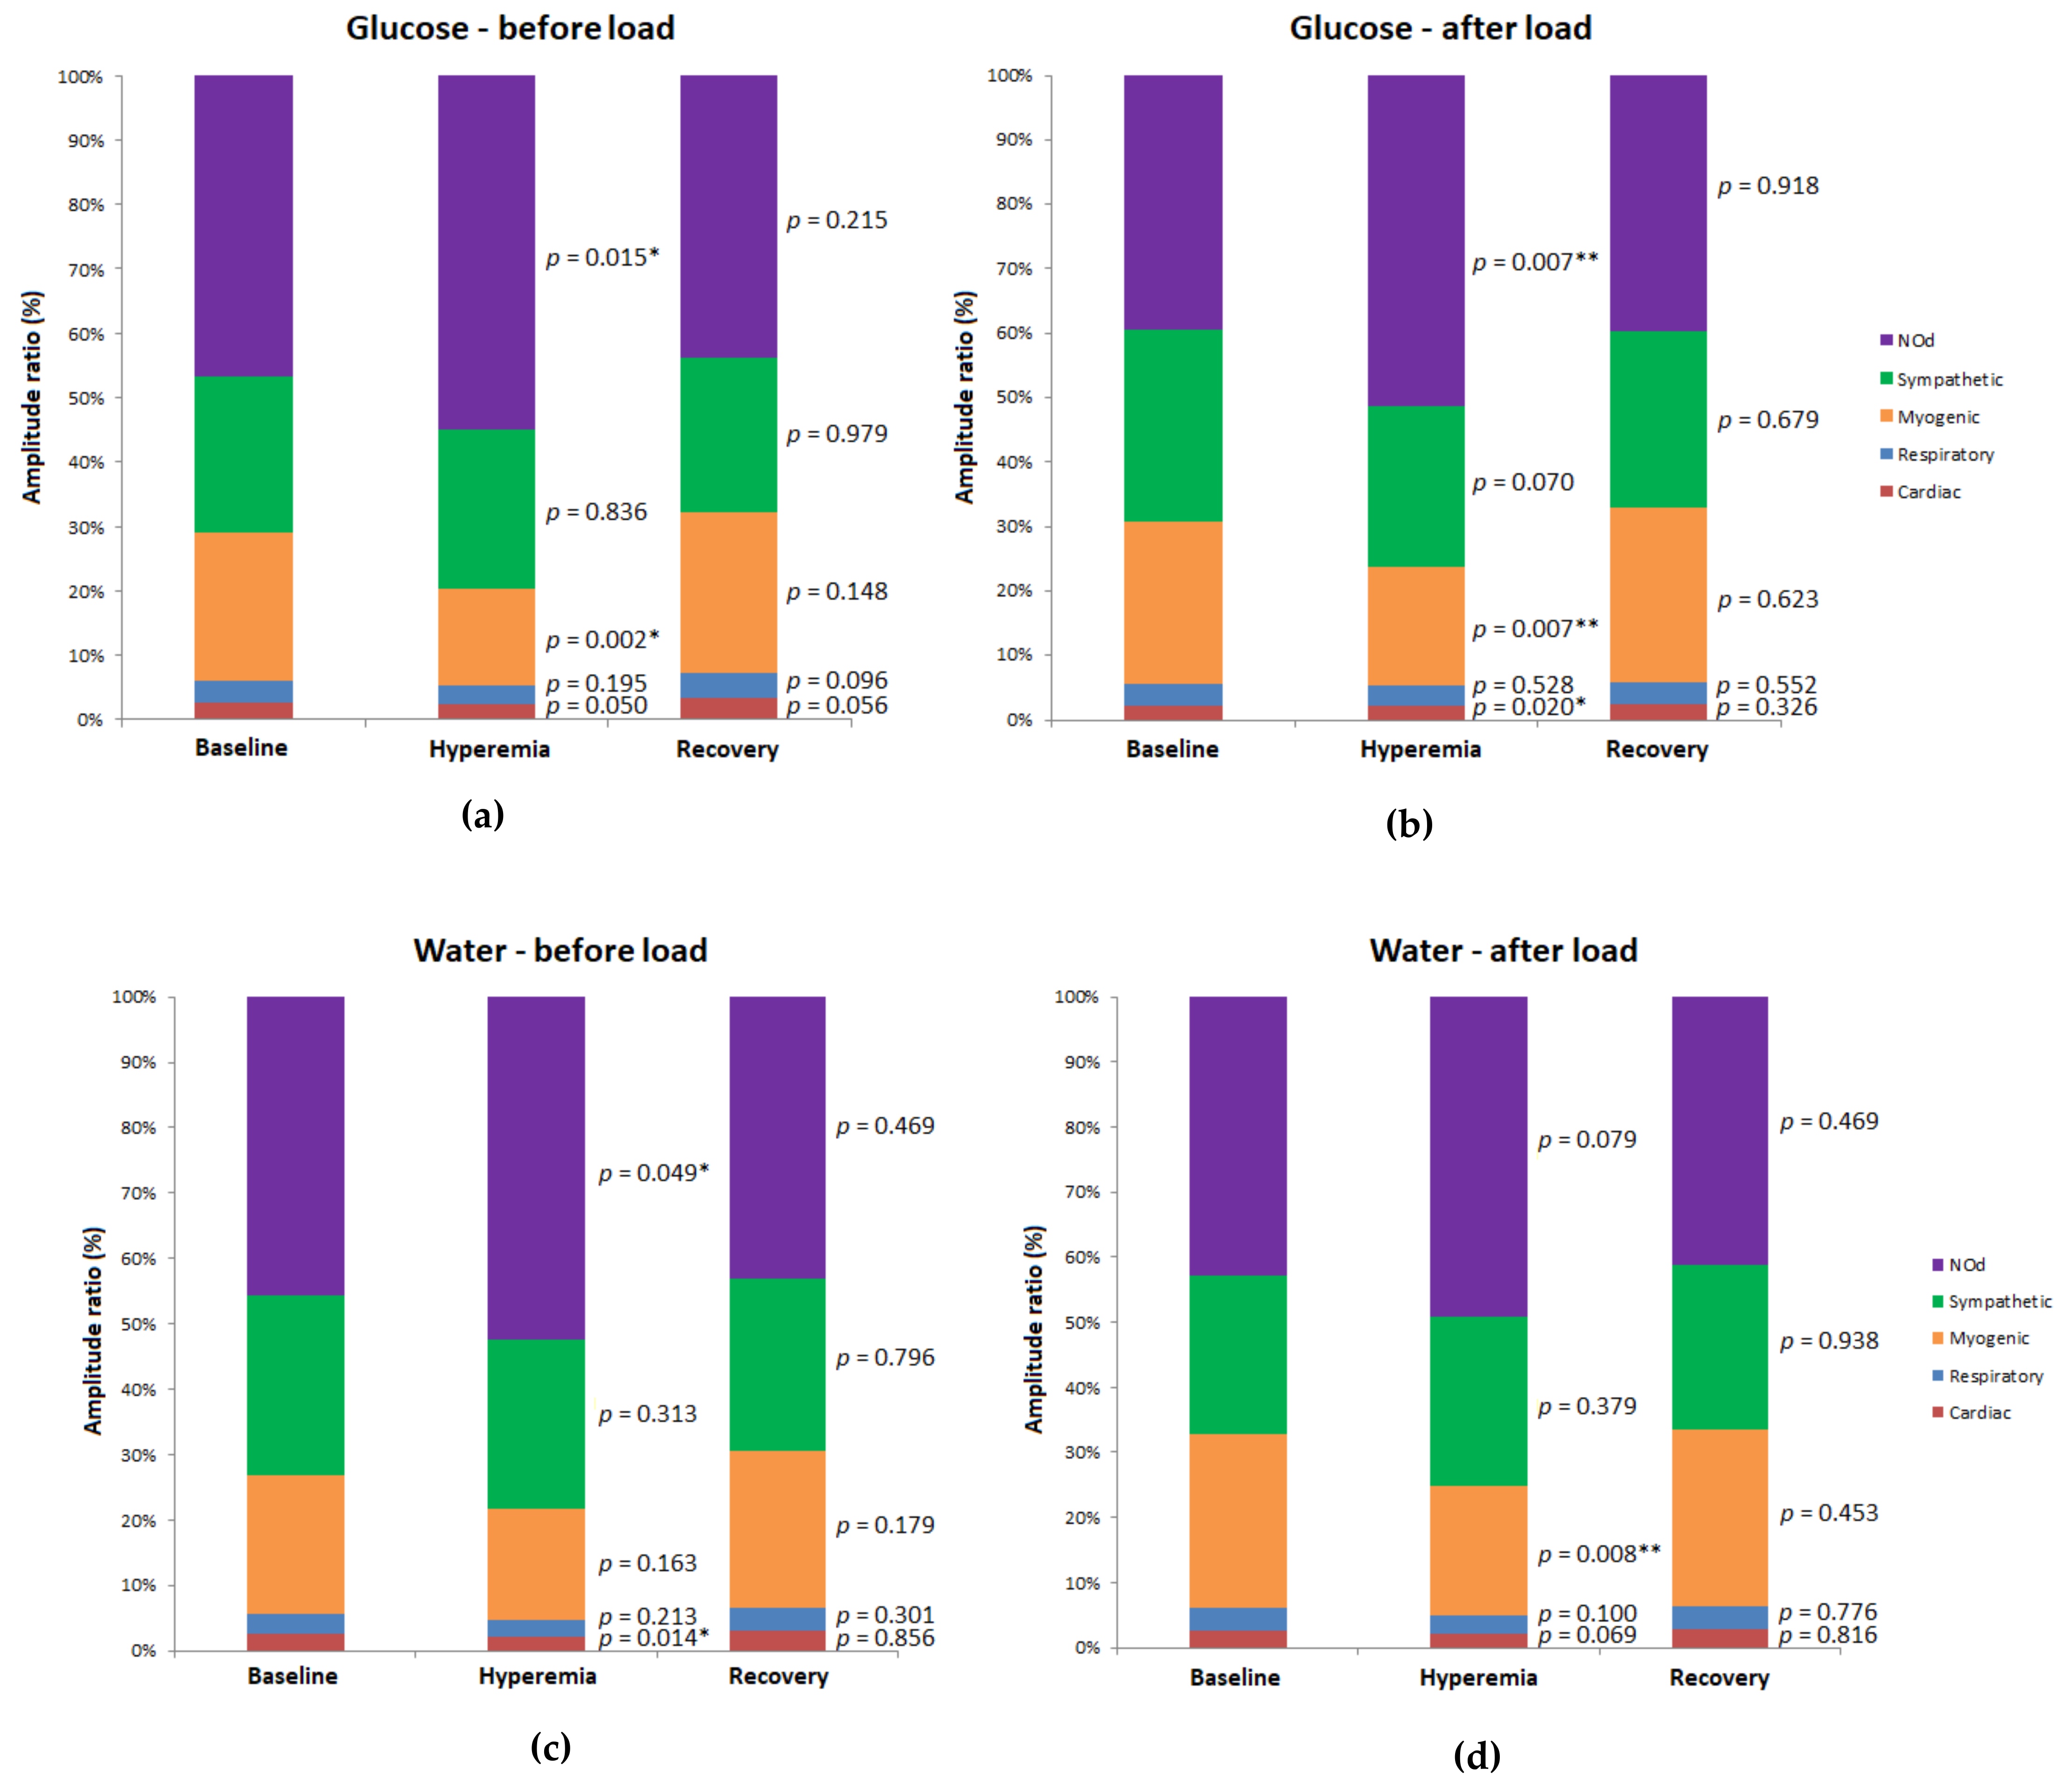
3.2.2. Finger Pulp
4. Discussion
5. Limitations
6. Conclusions
Author Contributions
Funding
Institutional Review Board Statement
Informed Consent Statement
Data Availability Statement
Acknowledgments
Conflicts of Interest
References
- Allen, J.; Howell, K. Microvascular imaging: Techniques and opportunities for clinical physiological measurements. Physiol. Meas. 2014, 35. [Google Scholar] [CrossRef]
- Iredahl, F.; Löfberg, A.; Sjöberg, F.; Farnebo, S.; Tesselaar, E. Non-invasive measurement of skin microvascular response during pharmacological and physiological provocations. PLoS ONE 2015, 10, 1–15. [Google Scholar] [CrossRef] [PubMed]
- Allen, J. Photoplethysmography and its application in clinical physiological measurement. Physiol. Meas. 2007, 28. [Google Scholar] [CrossRef] [Green Version]
- Fredriksson, I. Model-based quantitative laser Doppler flowmetry in skin. J. Biomed. Opt. 2010, 15, 057002. [Google Scholar] [CrossRef] [PubMed]
- Stefanovska, A.; Lotric, M.B.; Strle, S.; Haken, H. The cardiovascular system as coupled oscillators? Physiol. Meas. 2001, 22, 535–550. [Google Scholar] [CrossRef] [PubMed]
- Kvandal, P.; Aslak, S.; Bernjak, A.; Stefanovska, A.; Désirée, H.; Arvid, K. Low-frequency oscillations of the laser Doppler perfusion signal in human skin. Microvasc. Res. 2006, 72, 120–127. [Google Scholar] [CrossRef] [PubMed]
- Mizeva, I.; Di Maria, C.; Frick, P.; Podtaev, S.; Allen, J. Quantifying the correlation between photoplethysmography and laser Doppler flowmetry microvascular low-frequency oscillations. J. Biomed. Opt. 2015, 20. [Google Scholar] [CrossRef]
- Bernjak, A.; Stefanovska, A. Importance of wavelet analysis in laser Doppler flowmetry time series. In Proceedings of the 2007 29th Annual International Conference of the IEEE Engineering in Medicine and Biology Society, Lyon, France, 22–26 August 2007; pp. 4064–4067. [Google Scholar]
- Stefanovska, A.; Bracic, M.; Kvernmo, H.D. Wavelet analysis of oscillations in the peripheral blood circulation measured by laser Doppler technique. IEEE Trans. Biomed. Eng. 1999, 46, 1230–1239. [Google Scholar] [CrossRef]
- Astashev, M.E.; Serov, D.A.; Tankanag, A.V. Anesthesia effects on the low frequency blood flow oscillations in mouse skin. Ski. Res. Technol. 2019, 25, 40–46. [Google Scholar] [CrossRef]
- Silva, H.; Ferreira, H.A.; Silva, H.P.; Rodrigues, L.M. The Venoarteriolar Reflex Significantly Reduces Contralateral Perfusion as Part of the Lower Limb Circulatory Homeostasis in vivo. Front. Physiol. 2018, 9, 1–9. [Google Scholar] [CrossRef] [Green Version]
- Tóth-Szüki, V.; Bari, F.; Domoki, F. Stable laser-Doppler flow-motion patterns in the human cutaneous microcirculation: Implications for prospective geroscience studies. Physiol. Int. 2020, 107, 134–144. [Google Scholar] [CrossRef] [PubMed] [Green Version]
- Lemaster, K.; Jackson, D.; Goldman, D.; Frisbee, J.C. Insidious incrementalism: The silent failure of the microcirculation with increasing peripheral vascular disease risk. Microcirculation 2017, 24. [Google Scholar] [CrossRef] [PubMed]
- Mrowietz, C.; Franke, R.P.; Pindur, G.; Sternitzky, R.; Jung, F.; Wolf, U. Evaluation of Laser-Doppler-Fluxmetry for the diagnosis of microcirculatory disorders. Clin. Hemorheol. Microcirc. 2019, 71, 129–135. [Google Scholar] [CrossRef]
- Kulikov, D.; Glazkov, A.; Dreval, A.; Kovaleva, Y.; Rogatkin, D.; Kulikov, A.; Molochkov, A. Approaches to improve the predictive value of laser Doppler flowmetry in detection of microcirculation disorders in diabetes mellitus. Clin. Hemorheol. Microcirc. 2018, 70, 173–179. [Google Scholar] [CrossRef]
- Sorelli, M.; Francia, P.; Bocchi, L.; De Bellis, A.; Anichini, R. Assessment of cutaneous microcirculation by laser Doppler flowmetry in type 1 diabetes. Microvasc. Res. 2019, 124, 91–96. [Google Scholar] [CrossRef] [PubMed]
- Sifuzzaman, M.; Islam, M.R.; Ali, M.Z. Application of Wavelet Transform and its Advantages Compared to Fourier Transform. J. Phys. Sci. 2009, 13, 121–134. [Google Scholar]
- Gutterman, D.D.; Chabowski, D.S.; Kadlec, A.O.; Durand, M.J.; Freed, J.K.; Aissa, K.A.; Beyer, A.M. The Human Microcirculation-Regulation of flow and Beyond. Circ. Res. 2016, 118, 157–172. [Google Scholar] [CrossRef] [Green Version]
- Lenasi, H. Endothelial Dysfunction—Old Concepts and New Challenges; IntechOpen: London, UK, 2018. [Google Scholar]
- Stehouwer, C.D.A. Microvascular Dysfunction and Hyperglycemia: A Vicious Cycle with Widespread Consequences. Diabetes 2018, 67, 1729–1741. [Google Scholar] [CrossRef] [Green Version]
- Meyer, M.F.; Rose, C.J.; Hülsmann, J.O.; Schatz, H.; Pfohl, M. Impaired 0.1-Hz vasomotion assessed by laser Doppler anemometry as an early index of peripheral sympathetic neuropathy in diabetes. Microvasc. Res. 2003, 65, 88–95. [Google Scholar] [CrossRef]
- Hu, H.F.; Hsiu, H.; Sung, C.J.; Lee, C.H. Combining laser-Doppler flowmetry measurements with spectral analysis to study different microcirculatory effects in human prediabetic and diabetic subjects. Lasers Med. Sci. 2017, 32, 327–334. [Google Scholar] [CrossRef]
- Reynès, C.; Perez-Martin, A.; Ennaifer, H.; Silva, H.; Knapp, Y.; Vinet, A. Mechanisms of venoarteriolar reflex in type 2 diabetes with or without peripheral neuropathy. Biology 2021, 10, 333. [Google Scholar] [CrossRef] [PubMed]
- Foreman, Y.D.; Brouwers, M.C.G.J.; Berendschot, T.T.J.M.; Van Dongen, M.C.J.M.; Eussen, S.J.P.M.; Van Greevenbroek, M.M.J.; Henry, R.M.A.; Houben, A.J.H.M.; Van Der Kallen, C.J.H.; Kroon, A.A.; et al. The oral glucose tolerance test-derived incremental glucose peak is associated with greater arterial stiffness and maladaptive arterial remodeling: The Maastricht Study. Cardiovasc. Diabetol. 2019, 18, 1–12. [Google Scholar] [CrossRef] [PubMed]
- Loader, J.; Meziat, C.; Watts, R.; Lorenzen, C.; Sigaudo-Roussel, D.; Stewart, S.; Reboul, C.; Meyer, G.; Walther, G. Effects of Sugar-Sweetened Beverage Consumption on Microvascular and Macrovascular Function in a Healthy Population. Arterioscler. Thromb. Vasc. Biol. 2017, 37, 1250–1260. [Google Scholar] [CrossRef] [Green Version]
- Major-Pedersen, A.; Ihlemann, N.; Hermann, T.S.; Christiansen, B.; Dominguez, H.; Kveiborg, B.; Nielsen, D.B.; Svendsen, O.L.; Køber, L.; Torp-Pedersen, C. Effects of oral glucose load on endothelial function and on insulin and glucose fluctuations in healthy individuals. Exp. Diabetes Res. 2008, 2008, 672021. [Google Scholar] [CrossRef]
- Houben, A.J.; Schaper, N.; De Haan, C.H.; Huvers, F.C.; Slaaf, D.W.; De Leeuw, P.W.; Kruseman, C.N. Local 24-h hyperglycemia does not affect endothelium-dependent or -independent vasoreactivity in humans. Am. J. Physiol.-Hear. Circ. Physiol. 1996, 39. [Google Scholar] [CrossRef] [PubMed]
- Roustit, M.; Blaise, S.; Millet, C.; Cracowski, J.L. Reproducibility and methodological issues of skin post-occlusive and thermal hyperemia assessed by single-point laser Doppler flowmetry. Microvasc. Res. 2010, 79, 102–108. [Google Scholar] [CrossRef]
- Schoina, M.; Loutradis, C.; Memmos, E.; Triantafillidou, E.; Pagkopoulou, E.; Dimitroulas, T.; Garyfallos, A.; Papagianni, A.; Sarafidis, P. Nail Capillary Density During Postocclusive Reactive Hyperemia and Venous Congestion Is More Impaired in Diabetic Compared to Non-Diabetic Ckd Patients. J. Hypertens. 2021, 39, e328. [Google Scholar] [CrossRef]
- Lanting, S.M.; Barwick, A.L.; Twigg, S.M.; Johnson, N.A.; Baker, M.K.; Chiu, S.K.; Caterson, I.D.; Chuter, V.H. Post-occlusive reactive hyperaemia of skin microvasculature and foot complications in type 2 diabetes. J. Diabetes Complicat. 2017, 31, 1305–1310. [Google Scholar] [CrossRef]
- World Medical Association. World Medical Association Declaration of Helsinki: Ethical principles for medical research involving human subjects. JAMA 2013, 310, 2191–2194. [Google Scholar] [CrossRef] [Green Version]
- Centre N.O. A cross wavelet and wavelet coherence toolbox for MATLAB. Available online: https://noc.ac.uk/business/marine-data-products/cross-wavelet-wavelet-coherence-toolbox-matlab (accessed on 3 May 2021).
- Flavahan, N.A. A vascular mechanistic approach to understanding Raynaud phenomenon. Nat. Rev. Rheumatol. 2015, 11, 146–158. [Google Scholar] [CrossRef]
- Iwao, T.; Oho, K.; Nakano, R.; Yamawaki, M.; Sakai, T.; Sato, M.; Miyamoto, Y.; Toyonaga, A.; Tanikawa, K. Effect of meal induced splanchnic arterial vasodilatation on renal arterial haemodynamics in normal subjects and patients with cirrhosis. Gut 1998, 43, 843–848. [Google Scholar] [CrossRef] [PubMed] [Green Version]
- Muntzel, M.S.; Anderson, E.A.; Johnson, A.K.; Mark, A.L. Mechanisms of Insulin Action on Sympathetic Nerve Activity. Clin. Exp. Hypertens. 1995, 17, 39–50. [Google Scholar] [CrossRef] [PubMed] [Green Version]
- Landsverk, S.A.; Kvandal, P.; Bernjak, A.; Stefanovska, A.; Kirkeboen, K.A. The effects of general anesthesia on human skin microcirculation evaluated by wavelet transform. Anesth. Analg. 2007, 105, 1012–1019. [Google Scholar] [CrossRef]
- Stefanovska, A. Coupled Oscillators: Complex but Not Complicated Cardiovascular and Brain Interactions. IEEE Eng. Med. Biol. Mag. 2007, 26, 25–29. [Google Scholar] [CrossRef] [PubMed] [Green Version]
- Johnson, P.C. The Myogenic Response. Physiology 1991, 6, 41–42. [Google Scholar] [CrossRef]
- Soderstrom, T.; Svensson, H.; Koop, T.; Moller, K.O. Processing of laser-Doppler signals from free flaps. Technol. Heal. Care 1999, 7, 219–223. [Google Scholar] [CrossRef]
- Hegedüs, L.; Christensen, N.J.; Sestoft, L. Abnormal regulation of sympathetic nervous activity and heart rate after oral glucose in Type 1 (insulin-dependent) diabetic patients. Diabetologia 1983, 25, 242–246. [Google Scholar] [CrossRef]
- Scott, E.M.; Greenwood, J.P.; Gilbey, S.G.; Stoker, J.B.; Mary, D.A.S.G. Water ingestion increases sympathetic vasoconstrictor discharge in normal human subjects. Clin. Sci. 2001, 100, 335–342. [Google Scholar] [CrossRef]
- Nilsson, H.; Aalkjaer, C. Vasomotion: Mechanisms and physiological importance. Mol. Interv. 2003, 3, 79–89. [Google Scholar] [CrossRef]
- Rajapakse, N.W.; Chong, A.L.; Zhang, W.Z.; Kaye, D.M. Insulin-Mediated Activation of the L-Arginine Nitric Oxide Pathway in Man, and Its Impairment in Diabetes. PLoS ONE 2013, 8, 8–13. [Google Scholar] [CrossRef] [Green Version]
- Lenasi, H. Assessment of Human Skin Microcirculation and Its Endothelial Function Using Laser Doppler Flowmetry. Med. Imaging 2011. [CrossRef] [Green Version]
- Geraldes, P.; King, G.L. Activation of protein kinase C isoforms and its impact on diabetic complications. Circ. Res. 2010, 106, 1319–1331. [Google Scholar] [CrossRef] [Green Version]
- Breslin, J.W. Cellular Crosstalk, Inflammatory Signals, and Enhanced Microvascular Permeability. Microcirculation 2017, 24, e12368. [Google Scholar] [CrossRef] [PubMed]
- Rosenberry, R.; Nelson, M.D. Reactive hyperemia: A review of methods, mechanisms, and considerations. Am. J. Physiol.-Regul. Integr. Comp. Physiol. 2020, 318, R605–R618. [Google Scholar] [CrossRef] [PubMed]
- Raff, U.; Ott, C.; John, S.; Schmidt, B.M.W.; Fleischmann, E.H.; Schmieder, R.E. Nitric oxide and reactive hyperemia: Role of location and duration of Ischemia. Am. J. Hypertens. 2010, 23, 865–869. [Google Scholar] [CrossRef] [Green Version]
- Rossi, M.; Carpi, A.; Di Maria, C.; Franzoni, F.; Galetta, F.; Santoro, G. Post-ischaemic peak flow and myogenic flowmotion component are independent variables for skin post-ischaemic reactive hyperaemia in healthy subjects. Microvasc. Res. 2007, 74, 9–14. [Google Scholar] [CrossRef] [PubMed]

| Site | Group | Pre-Load | Post-Load | p Value (Post-Load vs. Pre-Load) | ||
|---|---|---|---|---|---|---|
| Forearm | Glucose (test) | Median | 5.6 | 6.0 | 0.660 | |
| 95% CI | Upper | 9.4 | 9.9 | |||
| Lower | 4.6 | 5.3 | ||||
| Water (control) | Median | 7.1 | 7.5 | 0.173 | ||
| 95% CI | Upper | 8.8 | 9.2 | |||
| Lower | 6.3 | 6.5 | ||||
| p value (G vs. W) | 0.138 | 0.254 | - | |||
| Finger pulp | Glucose (test) | Median | 260.1 | 221.9 | 0.004 ** | |
| 95% CI | Upper | 351.8 | 287.5 | |||
| Lower | 221.0 | 160.4 | ||||
| Water (control) | Median | 312.1 | 238.6 | 0.001 ** | ||
| 95% CI | Upper | 328.1 | 264.1 | |||
| Lower | 244.3 | 159.4 | ||||
| p value (G vs. W) | 0.616 | 0.985 | - | |||
| Before Load | After Load | ||||||||||||
|---|---|---|---|---|---|---|---|---|---|---|---|---|---|
| Site | Group | Parameter | Bas. | Hyper. | Rec. | p Value (Hyper. vs. Bas.) | p Value (Rec. vs. Bas.) | Bas. | Hyper. | Rec. | p Value (Hyper. vs. Bas.) | p Value (Rec. vs. Bas.) | |
| Forearm | glucose (test) | median | 6.0 | 12.8 | 6.2 | 0.001 ** | 0.027 * | 6.2 | 11.0 | 6.7 | < 0.001 ** | 0.244 | |
| 95% CI | upper | 8.3 | 17.3 | 8.2 | 9.5 | 8.9 | 9.7 | ||||||
| lower | 5.1 | 11.5 | 5.5 | 5.4 | 15.9 | 5.6 | |||||||
| water (control) | median | 7.5 | 11.5 | 7.9 | 0.004 ** | 0.001 ** | 7.4 | 19.3 | 8.3 | < 0.001 ** | 0.005 ** | ||
| 95% CI | upper | 9.0 | 18.8 | 10.7 | 9.3 | 24.4 | 10.0 | ||||||
| lower | 6.1 | 9.3 | 6.7 | 6.3 | 14.7 | 6.8 | |||||||
| p value (G vs. W) | 0.287 | 0.468 | 0.094 | - | - | 0.468 | 0.021 * | 0.224 | - | - | |||
| Finger pulp | glucose (test) | median | 249.2 | 288.7 | 228.8 | 0.013 * | 0.056 | 203.8 | 249.1 | 198.5 | 0.020 * | 0.326 | |
| 95% CI | upper | 333.3 | 373.7 | 321.1 | 281.6 | 303.0 | 281.3 | ||||||
| lower | 215.0 | 245.2 | 202.5 | 141.1 | 216.7 | 145.9 | |||||||
| water (control) | median | 313.8 | 325.8 | 306.8 | 0.006 ** | 0.408 | 257.4 | 295.6 | 269.2 | 0.004 ** | 0.301 | ||
| 95% CI | upper | 332.4 | 354.6 | 317.7 | 266.4 | 320.3 | 279.5 | ||||||
| lower | 223.7 | 266.8 | 214.2 | 155.9 | 242.6 | 178.4 | |||||||
| p value (G vs. W) | 0.539 | 0.468 | 0.468 | - | - | 0.642 | 0.287 | 0.361 | - | - | |||
| LDF Signal/LDF Components | LDF Signal Variation (Post-Load–Pre-Load) | ||||||||
|---|---|---|---|---|---|---|---|---|---|
| Forearm | Finger Pulp | ||||||||
| Baseline | Hyperemia | Recovery | Baseline | Hyperemia | Recovery | ||||
| Raw LDF signal | Glucose | median | 0.2 | −1.7 | 0.5 | −52.7 | −33.2 | −31.7 | |
| 95% CI | upper | 2.5 | 0.6 | 1.9 | −24.2 | −92.5 | −0.8 | ||
| lower | −1.1 | −4.7 | −0.4 | −101.5 | −6.8 | −95.7 | |||
| Water | median | 0.4 | 4.7 | 0.6 | −38.8 | −39.3 | −38.8 | ||
| 95% CI | upper | 1.0 | 9.7 | 1.0 | −21.8 | −3.2 | 6.8 | ||
| lower | −0.6 | 1.2 | −1.6 | −122.6 | −55.2 | −81.0 | |||
| p value (G vs. W) | 0.752 | 0.001 ** | 0.539 | 0.780 | 0.780 | 1.000 | |||
| Card | Glucose | median | −0.4 | 0.5 | −1.1 | −0.3 | 0.1 | −0.6 | |
| 95% CI | upper | 0.4 | 0.7 | −0.3 | 0.1 | 0.2 | −0.1 | ||
| lower | −1.3 | −0.2 | −1.8 | −1.0 | −0.5 | −1.5 | |||
| Water | median | −1.0 | 0.4 | 0.6 | −0.1 | −0.1 | −0.2 | ||
| 95% CI | upper | 1.6 | 1.2 | 2.1 | 0.5 | 0.3 | 0.6 | ||
| lower | −2.1 | −0.5 | 0.2 | −0.6 | −0.4 | −1.3 | |||
| p value (G vs. W) | 0.564 | 0.515 | 0.001 ** | 0.468 | 0.838 | 0.224 | |||
| Resp | Glucose | median | 0.6 | 0.3 | 0.5 | −0.3 | 0.4 | −0.4 | |
| 95% CI | upper | 1.4 | 1.3 | −0.1 | 1.7 | 1.2 | 1.8 | ||
| lower | −1.4 | −0.1 | −1.1 | −1.6 | −0.5 | 0.1 | |||
| Water | median | −0.3 | 0.5 | 1.3 | 0.3 | 0.1 | −0.1 | ||
| 95% CI | upper | 0.7 | 0.7 | 1.1 | 1.2 | 0.8 | 0.9 | ||
| lower | −0.5 | −0.3 | −2.1 | −0.2 | −0.3 | −0.8 | |||
| p value (G vs. W) | 0.445 | 0.838 | 0.138 | 0.381 | 0.956 | 0.160 | |||
| Myo | Glucose | median | 3.6 | 1.5 | 2.9 | 2.4 | 2.9 | 2.6 | |
| 95% CI | upper | 5.5 | 5.6 | 5.9 | 6.2 | 4.7 | 5.1 | ||
| lower | 0.7 | −0.3 | −2.4 | −1.6 | 1.5 | −1.0 | |||
| Water | median | −1.6 | 3.0 | 8.0 | 4.9 | 3.1 | 3.3 | ||
| 95% CI | upper | 4.8 | 6.1 | 10.7 | 9.2 | 6.2 | 7.7 | ||
| lower | −5.1 | −1.2 | 2.3 | 1.6 | −0.2 | −1.0 | |||
| p value (G vs. W) | 0.160 | 0.724 | 0.094 | 0.224 | 0.752 | 0.696 | |||
| Symp | Glucose | median | 2.7 | −4.3 | 5.9 | 3.2 | 1.2 | 3.7 | |
| 95% CI | upper | 3.7 | 0.9 | 8.2 | 9.8 | 3.1 | 7.5 | ||
| lower | −1.6 | −9.9 | 1.6 | 0.9 | −2.4 | −0.5 | |||
| Water | median | 0.0 | −3.4 | 1.9 | −3.7 | −0.3 | 0.6 | ||
| 95% CI | upper | 3.9 | 4.6 | 6.8 | 0.2 | 4.5 | 2.7 | ||
| lower | −3.5 | −6.1 | −1.0 | −6.6 | −4.4 | −5.5 | |||
| p value (G vs. W) | 0.305 | 0.564 | 0.110 | 0.003 ** | 0.724 | 0.080 | |||
| NOd | Glucose | median | −6.4 | −1.8 | −6.8 | −7.3 | −4.4 | −2.7 | |
| 95% CI | upper | 0.1 | 4.5 | −0.7 | −0.7 | 0.3 | 0.8 | ||
| lower | −7.6 | −6.4 | −9.7 | −13.8 | −7.4 | −9.2 | |||
| Water | median | 2.5 | 0.2 | −11.8 | −3.5 | −3.6 | −1.3 | ||
| 95% CI | upper | 6.4 | 5.6 | −4.1 | 3.0 | 3.6 | 3.6 | ||
| lower | −6.1 | −10.4 | −18.9 | −8.3 | −10.1 | −6.9 | |||
| p value (G vs. W) | 0.119 | 0.780 | 0.110 | 0.171 | 0.539 | 0.669 | |||
Publisher’s Note: MDPI stays neutral with regard to jurisdictional claims in published maps and institutional affiliations. |
© 2021 by the authors. Licensee MDPI, Basel, Switzerland. This article is an open access article distributed under the terms and conditions of the Creative Commons Attribution (CC BY) license (https://creativecommons.org/licenses/by/4.0/).
Share and Cite
Silva, H.; Šorli, J.; Lenasi, H. Oral Glucose Load and Human Cutaneous Microcirculation: An Insight into Flowmotion Assessed by Wavelet Transform. Biology 2021, 10, 953. https://doi.org/10.3390/biology10100953
Silva H, Šorli J, Lenasi H. Oral Glucose Load and Human Cutaneous Microcirculation: An Insight into Flowmotion Assessed by Wavelet Transform. Biology. 2021; 10(10):953. https://doi.org/10.3390/biology10100953
Chicago/Turabian StyleSilva, Henrique, Jernej Šorli, and Helena Lenasi. 2021. "Oral Glucose Load and Human Cutaneous Microcirculation: An Insight into Flowmotion Assessed by Wavelet Transform" Biology 10, no. 10: 953. https://doi.org/10.3390/biology10100953
APA StyleSilva, H., Šorli, J., & Lenasi, H. (2021). Oral Glucose Load and Human Cutaneous Microcirculation: An Insight into Flowmotion Assessed by Wavelet Transform. Biology, 10(10), 953. https://doi.org/10.3390/biology10100953