
Orchestrating an Optimized Next-Generation Sequencing-Based Cloud Workflow for Robust Viral Identification during Pandemics


Abstract
:Simple Summary
Abstract
1. Introduction
2. Materials and Methods
2.1. Cloud Platform
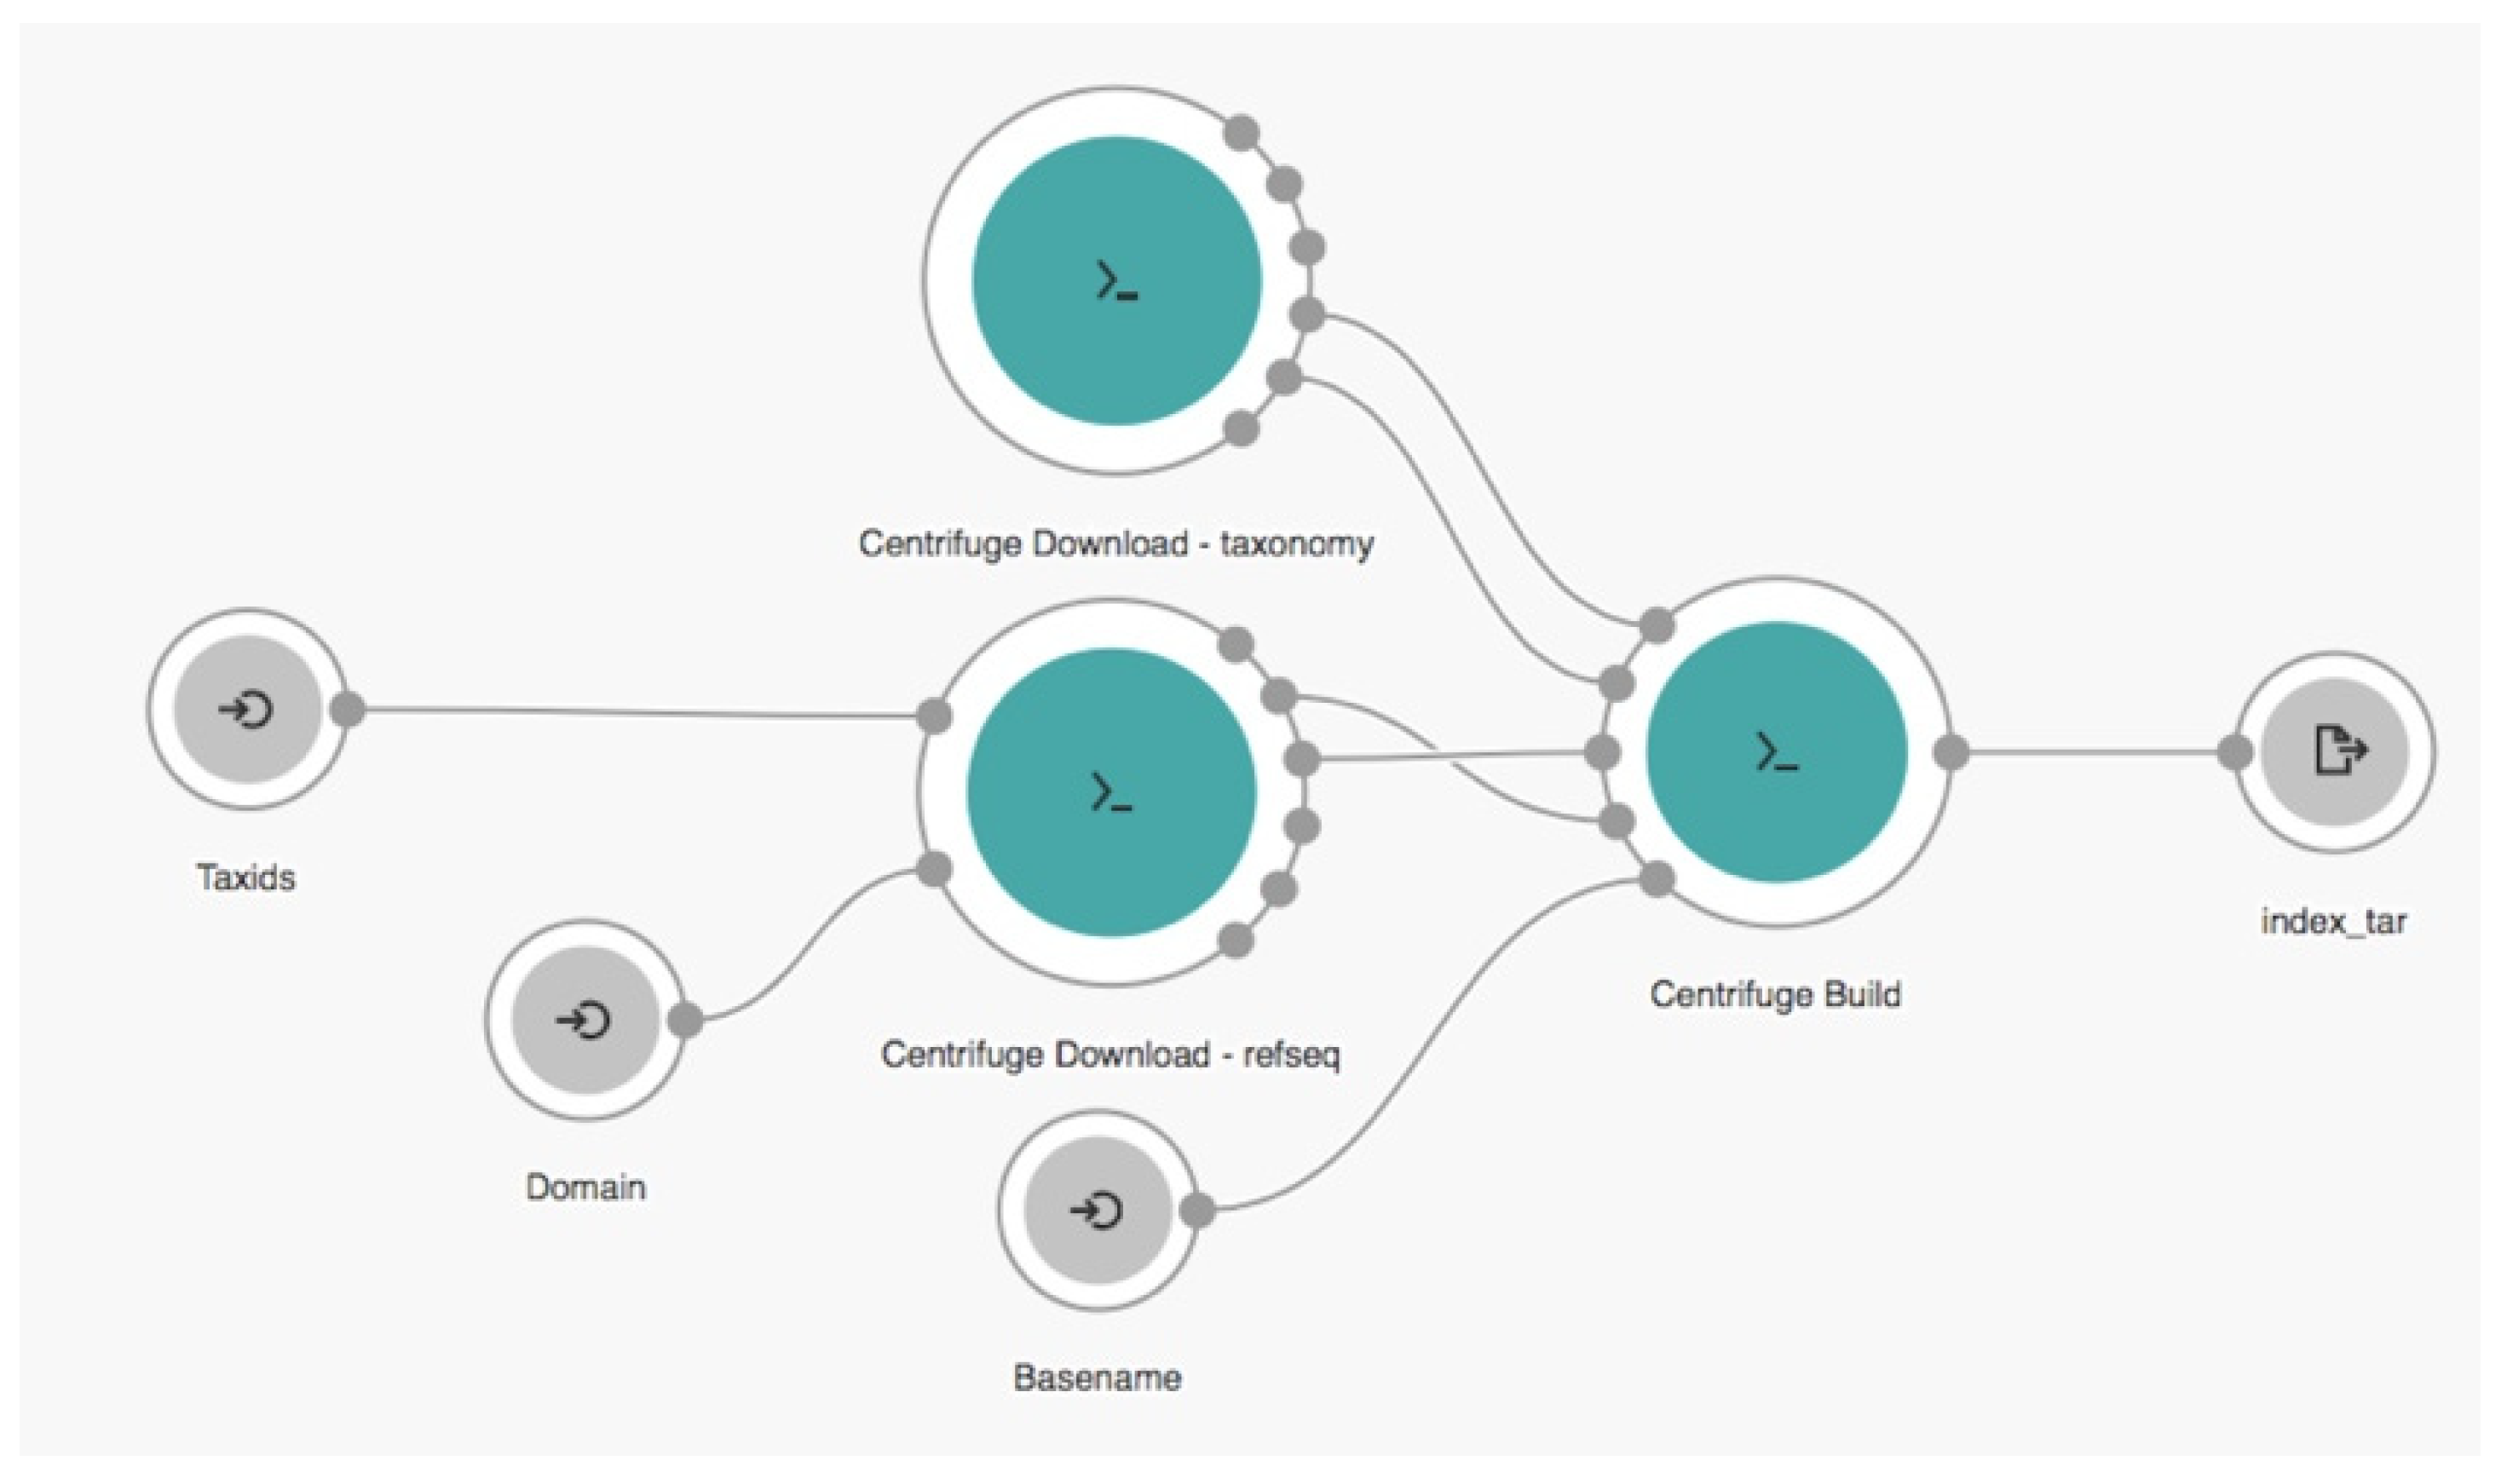
2.2. Cloud Workflow
 ,
,  , and
, and  represent the input, tool, and output nodes, respectively.
2.3. Experimental Setup
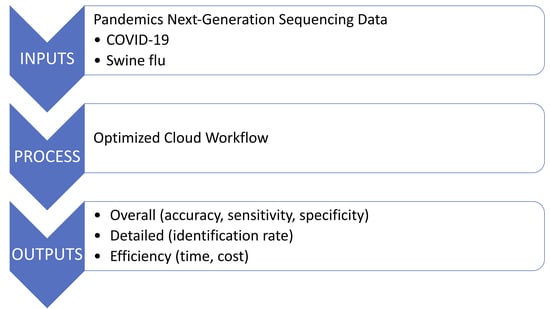
2.3.1. Datasets
2.3.2. Parameterization
2.3.3. Evaluation Criteria
3. Results
4. Discussion
4.1. Principal Results
4.2. Limitations
4.3. Species Identification at a Lower Taxonomy Level
4.4. Comparison with Prior Work
5. Conclusions
Supplementary Materials
Author Contributions
Funding
Institutional Review Board Statement
Informed Consent Statement
Data Availability Statement
Acknowledgments
Conflicts of Interest
References
- Dong, E.; Du, H.; Gardner, L. An interactive web-based dashboard to track COVID-19 in real time. Lancet Infect. Dis. 2020, 20, 533–534. [Google Scholar] [CrossRef]
- Wu, F.; Zhao, S.; Yu, B.; Chen, Y.M.; Wang, W.; Song, Z.G.; Hu, Y.; Tao, Z.W.; Tian, J.H.; Pei, Y.Y.; et al. A new coronavirus associated with human respiratory disease in China. Nature 2020, 579, 265–269. [Google Scholar] [CrossRef] [Green Version]
- Dawood, F.S.; Iuliano, A.D.; Reed, C.; Meltzer, M.I.; Shay, D.K.; Cheng, P.Y.; Bandaranayake, D.; Breiman, R.F.; Brooks, W.A.; Buchy, P.; et al. Estimated global mortality associated with the first 12 months of 2009 pandemic influenza A H1N1 virus circulation: A modelling study. Lancet Infect. Dis. 2012, 12, 687–695. [Google Scholar] [CrossRef] [Green Version]
- Corman, V.M.; Landt, O.; Kaiser, M.; Molenkamp, R.; Meijer, A.; Chu, D.K.; Bleicker, T.; Brunink, S.; Schneider, J.; Schmidt, M.L.; et al. Detection of 2019 novel coronavirus (2019-nCoV) by real-time RT-PCR. Eurosurveillance 2020, 25, 2000045. [Google Scholar] [CrossRef] [PubMed] [Green Version]
- Coronaviridae Study Group of the International Committee on Taxonomy of Viruses. The species Severe acute respiratory syndrome-related coronavirus: Classifying 2019-nCoV and naming it SARS-CoV-2. Nat. Microbiol. 2020, 5, 536–544. [Google Scholar] [CrossRef] [PubMed] [Green Version]
- Vemula, S.V.; Zhao, J.; Liu, J.; Wang, X.; Biswas, S.; Hewlett, I. Current Approaches for Diagnosis of Influenza Virus Infections in Humans. Viruses 2016, 8, 96. [Google Scholar] [CrossRef] [Green Version]
- Klein, D. Quantification using real-time PCR technology: Applications and limitations. Trends Mol. Med. 2002, 8, 257–260. [Google Scholar] [CrossRef]
- Xiao, A.T.; Tong, Y.X.; Zhang, S. False negative of RT-PCR and prolonged nucleic acid conversion in COVID-19: Rather than recurrence. J. Med. Virol. 2020, 92, 1755–1756. [Google Scholar] [CrossRef] [Green Version]
- Parrish, C.R.; Holmes, E.C.; Morens, D.M.; Park, E.C.; Burke, D.S.; Calisher, C.H.; Laughlin, C.A.; Saif, L.J.; Daszak, P. Cross-species virus transmission and the emergence of new epidemic diseases. Microbiol. Mol. Biol. Rev. 2008, 72, 457–470. [Google Scholar] [CrossRef] [Green Version]
- Rodrigues, J.; Barrera-Vilarmau, S.; Teixeira, J.M.C.; Sorokina, M.; Seckel, E.; Kastritis, P.L.; Levitt, M. Insights on cross-species transmission of SARS-CoV-2 from structural modeling. PLoS Comput. Biol. 2020, 16, e1008449. [Google Scholar] [CrossRef]
- Singh, D.; Yi, S.V. On the origin and evolution of SARS-CoV-2. Exp. Mol. Med. 2021, 53, 537–547. [Google Scholar] [CrossRef] [PubMed]
- Chiara, M.; D’Erchia, A.M.; Gissi, C.; Manzari, C.; Parisi, A.; Resta, N.; Zambelli, F.; Picardi, E.; Pavesi, G.; Horner, D.S.; et al. Next generation sequencing of SARS-CoV-2 genomes: Challenges, applications and opportunities. Brief. Bioinform. 2021, 22, 616–630. [Google Scholar] [CrossRef]
- Udugama, B.; Kadhiresan, P.; Kozlowski, H.N.; Malekjahani, A.; Osborne, M.; Li, V.Y.C.; Chen, H.; Mubareka, S.; Gubbay, J.B.; Chan, W.C.W. Diagnosing COVID-19: The Disease and Tools for Detection. ACS Nano 2020, 14, 3822–3835. [Google Scholar] [CrossRef] [PubMed] [Green Version]
- John, G.; Sahajpal, N.S.; Mondal, A.K.; Ananth, S.; Williams, C.; Chaubey, A.; Rojiani, A.M.; Kolhe, R. Next-Generation Sequencing (NGS) in COVID-19: A Tool for SARS-CoV-2 Diagnosis, Monitoring New Strains and Phylodynamic Modeling in Molecular Epidemiology. Curr. Issues Mol. Biol. 2021, 43, 61. [Google Scholar] [CrossRef]
- Tang, P.; Chiu, C. Metagenomics for the discovery of novel human viruses. Future Microbiol. 2010, 5, 177–189. [Google Scholar] [CrossRef] [Green Version]
- Breitwieser, F.P.; Lu, J.; Salzberg, S.L. A review of methods and databases for metagenomic classification and assembly. Brief. Bioinform. 2019, 20, 1125–1136. [Google Scholar] [CrossRef]
- Morgulis, A.; Coulouris, G.; Raytselis, Y.; Madden, T.L.; Agarwala, R.; Schaffer, A.A. Database indexing for production MegaBLAST searches. Bioinformatics 2008, 24, 1757–1764. [Google Scholar] [CrossRef] [PubMed]
- Wood, D.E.; Salzberg, S.L. Kraken: Ultrafast metagenomic sequence classification using exact alignments. Genome Biol. 2014, 15, R46. [Google Scholar] [CrossRef] [Green Version]
- Kim, D.; Song, L.; Breitwieser, F.P.; Salzberg, S.L. Centrifuge: Rapid and sensitive classification of metagenomic sequences. Genome Res. 2016, 26, 1721–1729. [Google Scholar] [CrossRef] [Green Version]
- Langmead, B.; Nellore, A. Cloud computing for genomic data analysis and collaboration. Nat. Rev. Genet. 2018, 19, 208–219. [Google Scholar] [CrossRef]
- Zhou, J.; Sun, C.; Fu, W.; Liu, J.; Jia, L.; Tan, H. Modeling, Design, and Implementation of a Cloud Workflow Engine Based on Aneka. J. Appl. Math. 2014, 2014, 512476. [Google Scholar] [CrossRef]
- Dai, L.; Gao, X.; Guo, Y.; Xiao, J.; Zhang, Z. Bioinformatics clouds for big data manipulation. Biol. Direct 2012, 7, 43, discussion 43. [Google Scholar] [CrossRef] [PubMed] [Green Version]
- Lau, J.W.; Lehnert, E.; Sethi, A.; Malhotra, R.; Kaushik, G.; Onder, Z.; Groves-Kirkby, N.; Mihajlovic, A.; DiGiovanna, J.; Srdic, M.; et al. The Cancer Genomics Cloud: Collaborative, Reproducible, and Democratized-A New Paradigm in Large-Scale Computational Research. Cancer Res. 2017, 77, e3–e6. [Google Scholar] [CrossRef] [Green Version]
- Navale, V.; Bourne, P.E. Cloud computing applications for biomedical science: A perspective. PLoS Comput. Biol. 2018, 14, e1006144. [Google Scholar] [CrossRef]
- Burrows, M.; Wheeler, D.J. A block-sorting lossless data compression algorithm. In Technical Report 124; Digital Equipment Corporation: Palo Alto, CA, USA, 1994. [Google Scholar]
- Ferragina, P.; Manzini, G. Opportunistic data structures with applications. In Proceedings of the 41st Annual Symposium on Foundations of Computer Science, Redondo Beach, CA, USA, 12–14 November 2000; p. 390. [Google Scholar]
- Kaushik, G.; Ivkovic, S.; Simonovic, J.; Tijanic, N.; Davis-Dusenbery, B.; Kural, D. Rabix: An Open-Source Workflow Executor Supporting Recomputability and Interoperability of Workflow Descriptions. Pac. Symp. Biocomput. 2017, 22, 154–165. [Google Scholar] [CrossRef] [Green Version]
- Peter, A.; Michael, R.C.; Nebojša, T.; Brad, C.; John, C.; Michael, H.; Andrey, K.; Dan, L.; Hervé, M.; Nedeljkovich, M.; et al. Common Workflow Language, v1.0. Figshare 2016. [CrossRef]
- Federhen, S. The NCBI Taxonomy database. Nucleic Acids Res. 2012, 40, D136–D143. [Google Scholar] [CrossRef] [Green Version]
- O’Leary, N.A.; Wright, M.W.; Brister, J.R.; Ciufo, S.; Haddad, D.; McVeigh, R.; Rajput, B.; Robbertse, B.; Smith-White, B.; Ako-Adjei, D.; et al. Reference sequence (RefSeq) database at NCBI: Current status, taxonomic expansion, and functional annotation. Nucleic Acids Res. 2016, 44, D733–D745. [Google Scholar] [CrossRef] [Green Version]
- Barrett, T.; Clark, K.; Gevorgyan, R.; Gorelenkov, V.; Gribov, E.; Karsch-Mizrachi, I.; Kimelman, M.; Pruitt, K.D.; Resenchuk, S.; Tatusova, T.; et al. BioProject and BioSample databases at NCBI: Facilitating capture and organization of metadata. Nucleic Acids Res. 2012, 40, D57–D63. [Google Scholar] [CrossRef] [PubMed]
- Leinonen, R.; Sugawara, H.; Shumway, M.; International Nucleotide Sequence Database, C. The sequence read archive. Nucleic Acids Res. 2011, 39, D19–D21. [Google Scholar] [CrossRef] [PubMed] [Green Version]
- Kim, H.; Kang, N.; An, K.; Kim, D.; Koo, J.; Kim, M.S. MRPrimerV: A database of PCR primers for RNA virus detection. Nucleic Acids Res. 2017, 45, D475–D481. [Google Scholar] [CrossRef] [PubMed] [Green Version]
- Taubenberger, J.K.; Morens, D.M. The pathology of influenza virus infections. Annu. Rev. Pathol. 2008, 3, 499–522. [Google Scholar] [CrossRef] [PubMed]
- Ounit, R.; Wanamaker, S.; Close, T.J.; Lonardi, S. CLARK: Fast and accurate classification of metagenomic and genomic sequences using discriminative k-mers. BMC Genom. 2015, 16, 236. [Google Scholar] [CrossRef] [PubMed] [Green Version]
- Liu, X.; Yu, Y.; Liu, J.; Elliott, C.F.; Qian, C.; Liu, J. A novel data structure to support ultra-fast taxonomic classification of metagenomic sequences with k-mer signatures. Bioinformatics 2018, 34, 171–178. [Google Scholar] [CrossRef] [PubMed]
- Corvelo, A.; Clarke, W.E.; Robine, N.; Zody, M.C. taxMaps: Comprehensive and highly accurate taxonomic classification of short-read data in reasonable time. Genome Res. 2018, 28, 751–758. [Google Scholar] [CrossRef] [PubMed] [Green Version]
- Walker, M.A.; Pedamallu, C.S.; Ojesina, A.I.; Bullman, S.; Sharpe, T.; Whelan, C.W.; Meyerson, M. GATK PathSeq: A customizable computational tool for the discovery and identification of microbial sequences in libraries from eukaryotic hosts. Bioinformatics 2018, 34, 4287–4289. [Google Scholar] [CrossRef] [Green Version]
- Ye, S.H.; Siddle, K.J.; Park, D.J.; Sabeti, P.C. Benchmarking Metagenomics Tools for Taxonomic Classification. Cell 2019, 178, 779–794. [Google Scholar] [CrossRef]
- Wilkinson, M.D.; Dumontier, M.; Aalbersberg, I.J.; Appleton, G.; Axton, M.; Baak, A.; Blomberg, N.; Boiten, J.W.; da Silva Santos, L.B.; Bourne, P.E.; et al. The FAIR Guiding Principles for scientific data management and stewardship. Sci. Data 2016, 3, 160018. [Google Scholar] [CrossRef] [Green Version]
- Kotliar, M.; Kartashov, A.V.; Barski, A. CWL-Airflow: A lightweight pipeline manager supporting Common Workflow Language. Gigascience 2019, 8, giz084. [Google Scholar] [CrossRef]
- Wong, A.C.P.; Li, X.; Lau, S.K.P.; Woo, P.C.Y. Global Epidemiology of Bat Coronaviruses. Viruses 2019, 11, 174. [Google Scholar] [CrossRef] [Green Version]
- Zumla, A.; Hui, D.S.; Perlman, S. Middle East respiratory syndrome. Lancet 2015, 386, 995–1007. [Google Scholar] [CrossRef] [Green Version]
- de Groot, R.J.; Baker, S.C.; Baric, R.S.; Brown, C.S.; Drosten, C.; Enjuanes, L.; Fouchier, R.A.; Galiano, M.; Gorbalenya, A.E.; Memish, Z.A.; et al. Middle East respiratory syndrome coronavirus (MERS-CoV): Announcement of the Coronavirus Study Group. J. Virol. 2013, 87, 7790–7792. [Google Scholar] [CrossRef] [PubMed] [Green Version]
- Morgan, X.C.; Huttenhower, C. Chapter 12: Human microbiome analysis. PLoS Comput. Biol. 2012, 8, e1002808. [Google Scholar] [CrossRef] [PubMed] [Green Version]
- Ranjan, R.; Rani, A.; Metwally, A.; McGee, H.S.; Perkins, D.L. Analysis of the microbiome: Advantages of whole genome shotgun versus 16S amplicon sequencing. Biochem. Biophys. Res. Commun. 2016, 469, 967–977. [Google Scholar] [CrossRef] [PubMed] [Green Version]


| Dataset | Reads | File Size (in Megabyte) | ||||||
|---|---|---|---|---|---|---|---|---|
| Total | Minimum | Maximum | Average | Total | Minimum | Maximum | Average | |
| COVID-19 | 42,210,829 | 27,707 | 1,208,398 | 458,813 | 16,621 | 7 | 587 | 181 |
| Swine flu | 23,733,795 | 95,755 | 633,535 | 263,709 | 12,715 | 49 | 357 | 141 |
| Metric | Index | |
|---|---|---|
| SARS-CoV-2 | H1N1 | |
| True positives | 42,210,734 | 21,341,623 |
| False positives | 967 | 0 |
| True negatives | 23,732,828 | 42,210,829 |
| False negatives | 95 | 2,392,172 |
| % Accuracy | 99.9984 | 96.372 |
| % Sensitivity | 99.9998 | 89.921 |
| % Specificity | 99.9959 | 100.000 |
| % IR range (cases) | 99.999–100 | 37–98 |
| % IR range (controls) | 0–0.033 | 0 |
| Total | Minimum | Maximum | Average | |
|---|---|---|---|---|
| Reads | 8,883,737 | 570,733 | 3,141,921 | 1,110,467 |
| File size (in megabyte) | 5713 | 370 | 2000 | 714 |
| Workflow (Index Used) | Time (min) | Time Efficiency | Cost (USD) | Cost Efficiency |
|---|---|---|---|---|
| Original workflow (SARS-CoV-2) | 35 (2 + 33) | 71% | 0.33 (0.02 + 0.31) | 76% |
| Our workflow (SARS-CoV-2) | 10 | 0.08 | ||
| Original workflow (H1N1) | 49 (2 + 47) | 82% | 0.45 (0.02 + 0.43) | 84% |
| Our workflow (H1N1) | 9 | 0.07 |
Publisher’s Note: MDPI stays neutral with regard to jurisdictional claims in published maps and institutional affiliations. |
© 2021 by the authors. Licensee MDPI, Basel, Switzerland. This article is an open access article distributed under the terms and conditions of the Creative Commons Attribution (CC BY) license (https://creativecommons.org/licenses/by/4.0/).
Share and Cite
Lim, H.G.-M.; Hsiao, S.-H.; Lee, Y.-C.G. Orchestrating an Optimized Next-Generation Sequencing-Based Cloud Workflow for Robust Viral Identification during Pandemics. Biology 2021, 10, 1023. https://doi.org/10.3390/biology10101023
Lim HG-M, Hsiao S-H, Lee Y-CG. Orchestrating an Optimized Next-Generation Sequencing-Based Cloud Workflow for Robust Viral Identification during Pandemics. Biology. 2021; 10(10):1023. https://doi.org/10.3390/biology10101023
Chicago/Turabian StyleLim, Hendrick Gao-Min, Shih-Hsin Hsiao, and Yuan-Chii Gladys Lee. 2021. "Orchestrating an Optimized Next-Generation Sequencing-Based Cloud Workflow for Robust Viral Identification during Pandemics" Biology 10, no. 10: 1023. https://doi.org/10.3390/biology10101023
APA StyleLim, H. G.-M., Hsiao, S.-H., & Lee, Y.-C. G. (2021). Orchestrating an Optimized Next-Generation Sequencing-Based Cloud Workflow for Robust Viral Identification during Pandemics. Biology, 10(10), 1023. https://doi.org/10.3390/biology10101023