Article

Dyeing to Know: Harmonizing Nile Red Staining Protocols for Microplastic Identification

1
Department of Mechanical Engineering and Applied Mechanics, University of Pennsylvania, Philadelphia, PA 19103, USA
2
Department of Biological Systems Engineering, University of Wisconsin-Madison, Madison, WI 53706, USA
3
Sciences & Mathematics Division, School of Interdisciplinary Arts & Sciences, University of Washington Tacoma, Tacoma, WA 98402, USA
*
Author to whom correspondence should be addressed.
Colorants 2025, 4(2), 20; https://doi.org/10.3390/colorants4020020
Submission received: 1 March 2025 / Revised: 17 April 2025 / Accepted: 29 May 2025 / Published: 3 June 2025
(This article belongs to the Special Issue Feature Papers in Colorant Chemistry)

Abstract

:
The increasing prevalence of microplastic (MP) pollution and the labor-intensive nature of existing identification methods necessitate improved large-scale detection approaches. Nile Red (NR) fluorescence, which varies with polarity, offers a potential classification method, but standardization of carrier solvents and fluorescence differentiation techniques remains lacking. This study evaluated eight NR-carrier solvents (n-hexane, chloroform, acetone, methanol, ethanol, acetone/hexane, acetone/ethanol, and acetone/water) across ten common MP polymers (HDPE, LDPE, PP, EPS, PS, PC, ABS, PVC, PET, and PA). Fluorescence intensity, Stokes shift, and solvent-induced polymer degradation were analyzed. The study also assessed HSV (Hue/Saturation/Value) color spaces for Stokes shift representation and MP differentiation. Fenton oxidation effectively quenched fluorescence in natural organic matter (e.g., eggshells, fingernails, wood, cotton) while preserving NR-stained MPs. Acetone/water [25% (v/v)] emerged as the optimal solvent, balancing fluorescence performance and minimal degradation.

1. Introduction

The usage of plastic products has skyrocketed, climbing from 2 million tons in the 1950s to a staggering 450 million tons over 70 years [1]. This surge, notably accelerated by the COVID-19 pandemic, resulted in an estimated 8.4 ± 1.4 million tons of pandemic-associated plastic waste generated globally in 2021 [2]. This influx equates to approximately 2000 garbage trucks’ worth of plastics dumped into the world’s oceans daily [3]. Unfortunately, the chemical resilience that makes plastics so popular inadvertently means they do not biodegrade. Instead, they fragment through processes like UV oxidation, mechanical breakdown, and biological degradation [4,5,6,7]. This fragmentation leads to smaller pieces known as microplastics (<5 mm) and eventually nanoplastics (<1 µm).
The tiny size and omnipresence of these microplastics (MPs) enable their global transport through air and water, leading to startling discoveries in remote locations such as the Arctic ice [8], uninhabited caves [9], the highest peak of Mount Everest [10], and even the deepest parts of the Mariana Trench [11]. This increased prevalence of MPs holds profound implications for both the flora [12,13] and fauna [14] residing in these environments. Moreover, their small size leads animals to mistake them for food, causing adverse effects such as oxidative stress, neuro- and reproductive toxicity, and carcinogenicity [15]. Recent discoveries of microplastics in our food sources—like fruits and vegetables [16], seafood [17], salt [18], water bottles [19] and food packaging [20], and their accumulation in placenta [21] and blood [22] of healthy humans—have raised concerns. With limited understanding of their profound effects on human health and projections indicating a potential doubling of microplastics in oceans within the next 30 years from 2020 levels [23], there is an urgent need for inexpensive, standardized monitoring approaches capable of handling large sample numbers and volumes within short periods to study spatial and temporal distribution of MPs [24]. Such approaches are critical for comprehensive assessments, comparison, and integration of research on microplastic presence across diverse environments.
The most commonly used methods for detecting and identifying MPs rely on visual assessment with the naked eye, cameras, or microscopes, followed by spectroscopic validation using techniques such as Fourier-transform infrared (FTIR) or Raman spectroscopy [25,26]. While widely adopted, these approaches face significant limitations: they are labor-intensive, time-consuming, and prone to a high rate of false positives due to subjective operator selection criteria during MPs analysis [27,28]. For instance, relying on distinct visual features such as color and surface structure (i.e., sharp geometrical shapes, shiny surfaces, and fibers with consistent widths) often leads to the underestimation of less visually obvious plastics, such as clear, black, white, brown fragments [29]. This subjective, label-free selection process frequently results in misidentification rates ranging from 20 to 70% [30]. Alternative methods, such as thermal analysis techniques (e.g., thermogravimetric analysis (TGA), thermal extraction desorption (TED), and pyrolysis-gas chromatography/mass spectrometry (PY-GC/MS)), have been proposed for MPs identification [31]. However, these approaches have significant drawbacks. They cannot determine the number, type, or morphology of MPs, and are unsuitable for analyzing large samples due to overlapping polymer signal peaks and lengthy analysis times (e.g., approximately 70 min per sample with PY-GC/MS) [25,31,32]. Therefore, it is critical to develop faster, more accurate, and objective methods for MPs detection and identification that are accessible to laboratories worldwide. Such advancements will improve the reliability and scalability of MPs research and monitoring efforts.
To address these challenges, researchers have turned to fluorescent labelling methods, including but not limited to DANS, methylene blue, Evans blue and DAPI, and Nile Red (NR) [29]. Among these options, NR was selected due to its widespread adoption across international laboratories, as well as its exceptional selectivity and minimal interference in the infrared spectral region, which enables subsequent spectroscopic identification via FTIR [29]. NR fluoresces selectively, preferentially binding onto hydrophobic materials, like lipids and plastics, in polar environments, rather than inorganic materials, like sand [29]. Importantly, its fluorescence behavior varies in the physiochemical properties of the plastics, suggesting the potential to differentiate MPs based on their polarity-dependent fluorescence behaviors [33,34,35].
However, applying NR requires a carrier solvent to effectively disperse the dye onto MPs. Various solvents, including N-hexane, chloroform, methanol, ethanol, DMSO, Tween 20, acetone/ethanol, and acetonitrile/methanol, have been explored to optimize NR fluorescence while minimizing adverse effects, such as plastic dissolution or swelling [29]. Despite these efforts, the absence of a standardized solvent has hindered progress in the field of MPs research, leading to inconsistent results, such as the underestimation of low-fluorescing MPs, overestimation of the MPs particle count due to false positives of natural organic matter (NOM), inaccurate particle size determination due to swelling, and lack of cross-study comparability [36].
To address these inconsistencies, researchers have attempted to investigate the underlying mechanism regarding NR partitioning onto MPs within a multiphasic system. Shim et al. (2016) proposed that non-polar solutions like n-hexane facilitate improved partitioning of NR fluorophores onto MPs, thereby enhancing the fluorescence of MPs [37]. Conversely, Tamminga et al. (2017) found that more polar solvents, such as chloroform, produced higher fluorescence in NR-stained PE and PP compared to n-hexane [38]. This apparent contradiction highlights the complexity of the underlying mechanism governing NR partitioning onto MPs and fluorescence behavior in a multiphasic system. As a result, developing a standardized solvent for NR staining remains a challenge, compounded by the diverse fluorescence and degradation tendencies of plastic types in different solvents.
In addition to solvent challenges, methods used to quantify and differentiate the fluorescent behavior of MPs are inadequate. Imaging devices, such as cameras, cannot capture fluorescence at discrete wavelengths (nm); instead, they interpret the perceived fluorescence as a permutation of red, green, and blue (R/G/B) channels. This limitation complicates the direct identification of MPs based on their fluorescence behavior. As a workaround, researchers commonly convert fluorescent images to monochrome and apply greyscale thresholding based on pixel brightness to isolate particles with fluorescent intensity (FI—%) above a certain threshold. While this approach enables an approximate differentiation of MPs by their crystallinity—since FI decreases with polymer crystallinity [34,39,40]—it is prone to false positives. For instance, NOM, such as wood and chitin [40], often exhibit a higher FI than highly crystalline plastics—polyvinylchloride (PVC) and polyethylene terephthalate (PET) [40].
To improve MP differentiation, researchers have explored RGB-based interpretation of fluorescence, developing formulaic representations of RGB, (Red + Green/Red), (Red-Blue/Red + Blue), or even their layered combinations to create proxy “polarity index” fingerprints [34,35,38]. However, these RGB-based approaches have shown limited success in reliably correlating solvent polarity with the Stokes shift in fluorescence, reducing their effectiveness in classifying MPs based on their fluorescence behavior. Without a more robust digital representation of polarity-induced Stokes shift of fluorescence, fluorescence imaging analyses remain susceptible to false positives and cannot accurately classify MPs by their fluorescent behavior.
This study seeks to address these challenges by evaluating the efficacy of the most common carrier solvents used for NR staining in accurately identifying 10 types of MPs (high-density polyethylene (HDPE), low-density polyethylene (LDPE), polypropylene (PP), polystyrene (PS), expanded polystyrene (EPS), acrylonitrile butadiene styrene (ABS), polycarbonate (PC), PVC, PET, polyamide (PA)) based on their fluorescence behavior (FI and Stokes shift). Additionally, a rapid, simple, and cost-effective staining protocol applicable to environmental samples was developed, integrating Fenton oxidation and NR staining. This protocol, combined with the application of a more appropriate Hue/Saturation/Value (HSV) color space for fluorescence representation, was assessed for its ability to differentiate MPs based on polarity-induced fluorescence.

2. Materials and Methods

2.1. Sample Collection for Staining Experiments

Ten non-colored polymer types (HDPE, LDPE, PP, PS, EPS, ABS, PC, PVC, PET, PA) were investigated. Non-colored HDPE, LDPE, PP, and ABS virgin pellets were obtained from LNS technologies (Yucaipa, CA, USA), PS was obtained from Sigma Aldrich (#331651) (St. Louis, MI, USA), and PA was obtained from GUM Waxed floss (Schaumburg, IL, USA). The other plastics (EPS, PC, PVC, PET) were obtained from post-consumer products in the form of packing peanuts, acrylic glass sheets, PVC pipes, and Dawn Ultra dish soap bottles. All-purpose cotton thread was obtained from Coats & Clark (Charlotte, NC, USA), chitin was sourced from eggshells and fingernails, and wood shavings were procured from Jack pine softwood. Due to the irregular shapes of the prepared MPs from post-consumer goods, the dimensions of the particles ranged from as thin as 0.96 mm to as long as 2.09 cm, such as in the case of PA thread. However, the average between the minimum width and maximum length of the MPs studied ranged from ABS (3.14 mm) to PET (5.42 mm) except for PA (10.93 mm) due to the high length/breath ratio of its thread.

2.2. Staining Dye Solution

The five most used solvents by researchers, namely n-hexane (Hex), chloroform (Chl), acetone (Ac), ethanol (Eth), and methanol (Met), were investigated. Additionally, three equal-part solvent mixtures of acetone with n-hexane (Ac-Hex), with ethanol (Ac-Eth), and with water (Ac-W) were used to prepare NR stock solutions of 10 µg/mL. These NR-carrier solvents (Hex, Chl, Ac, Met, Eth, Ac/Hex, Ac/Eth, and Ac/W) were applied to nine different types of MPs (HDPE, LDPE, PP, PS, PC, ABS, PVC, PET, and PA) to assess their ability to stain MPs with NR for fluorescence imaging. The inclusion of pure water was disregarded since NR was demonstrated to be insoluble in water. Nile Red (7385-67-3) was obtained from Santa Cruz Biotechnology (Dallas, TX, USA). N-hexane (110-54-3), chloroform (67-66-3), acetone (67-64-1), ethanol (64-17-5), and methanol (67-56-1) were obtained from Fischer Scientific company LLC. Ultrapure (Type 1) water was obtained from Synergy UV water purification system (18.2 MΩ.cm @25 °C).

2.3. Fenton Oxidation Pretreatment

Of the several pretreatment methods available, including acid, alkali, oxidase, and enzymatic treatments, Fenton oxidation was chosen. Acid and alkali pretreatments have been shown to cause degradation and yellowing of the polymer [41], respectively. Additionally, enzymatic pretreatment requires a lengthy digestion period [41]. As such, we adapted the Fenton oxidation pretreatment from Masura et al. (2015) [42], excluding the density separation with a salt solution to ensure the inclusion of MPs of all densities. Ferrous sulfate heptahydrate (FeSO4·7H2O) (7782-63-0), concentrated sulfuric acid (H2SO4) (7664-93-9), and Whatman 47 mm 2.5 µm Grade 42 filter paper were obtained from Fischer Scientific company LLC. Hydrogen peroxide (H2O2) 30% (v/v) (7732-18-5) was obtained from Santa Cruz Biotechnology. The Fe(II) stock solution was prepared by adding 7.5 g of FeSO4·7H2O to 500 mL of water and 3 mL of concentrated sulfuric acid [42]. To prepare the samples for Fenton oxidation, 2 mL Fe(II) stock was added to 2 mL H2O2 to a test tube with 3 pieces of MPs and immersed in a water bath set at 70 °C for 30 min in a fume hood, with periodic agitation every 10 min to ensure mixing. MPs were then filtered out of the Fenton solution onto the 47 mm filter paper with a membrane vacuum filtration apparatus.

2.4. NR Staining of MPs

In total, 15 mL of NR solution was added to the test tube and placed into a water bath (70 °C) for 30 min in a fume hood, with periodic agitation every 10 min to ensure even staining. Plastics stained with Chl were treated at room temperature in a fume hood and covered with aluminum foil for 24 h. Subsequently, one of each of the plastic particles was selected and positioned on the 47 mm filter paper and arranged in order of their supposed polarity. To evaluate the accuracy of the segmentation of non-overlapping particles, the particles were arranged with tweezers on a 47 mm filter paper for fluorescence imaging. Additional experimental protocols regarding the fluorescence imaging instrumentation, quantitative fluorescence behavior analysis, FTIR validation of pretreated MPs, and QA/QC procedures are provided in Supplementary Materials (Sections S1.1–S1.5).

3. Results

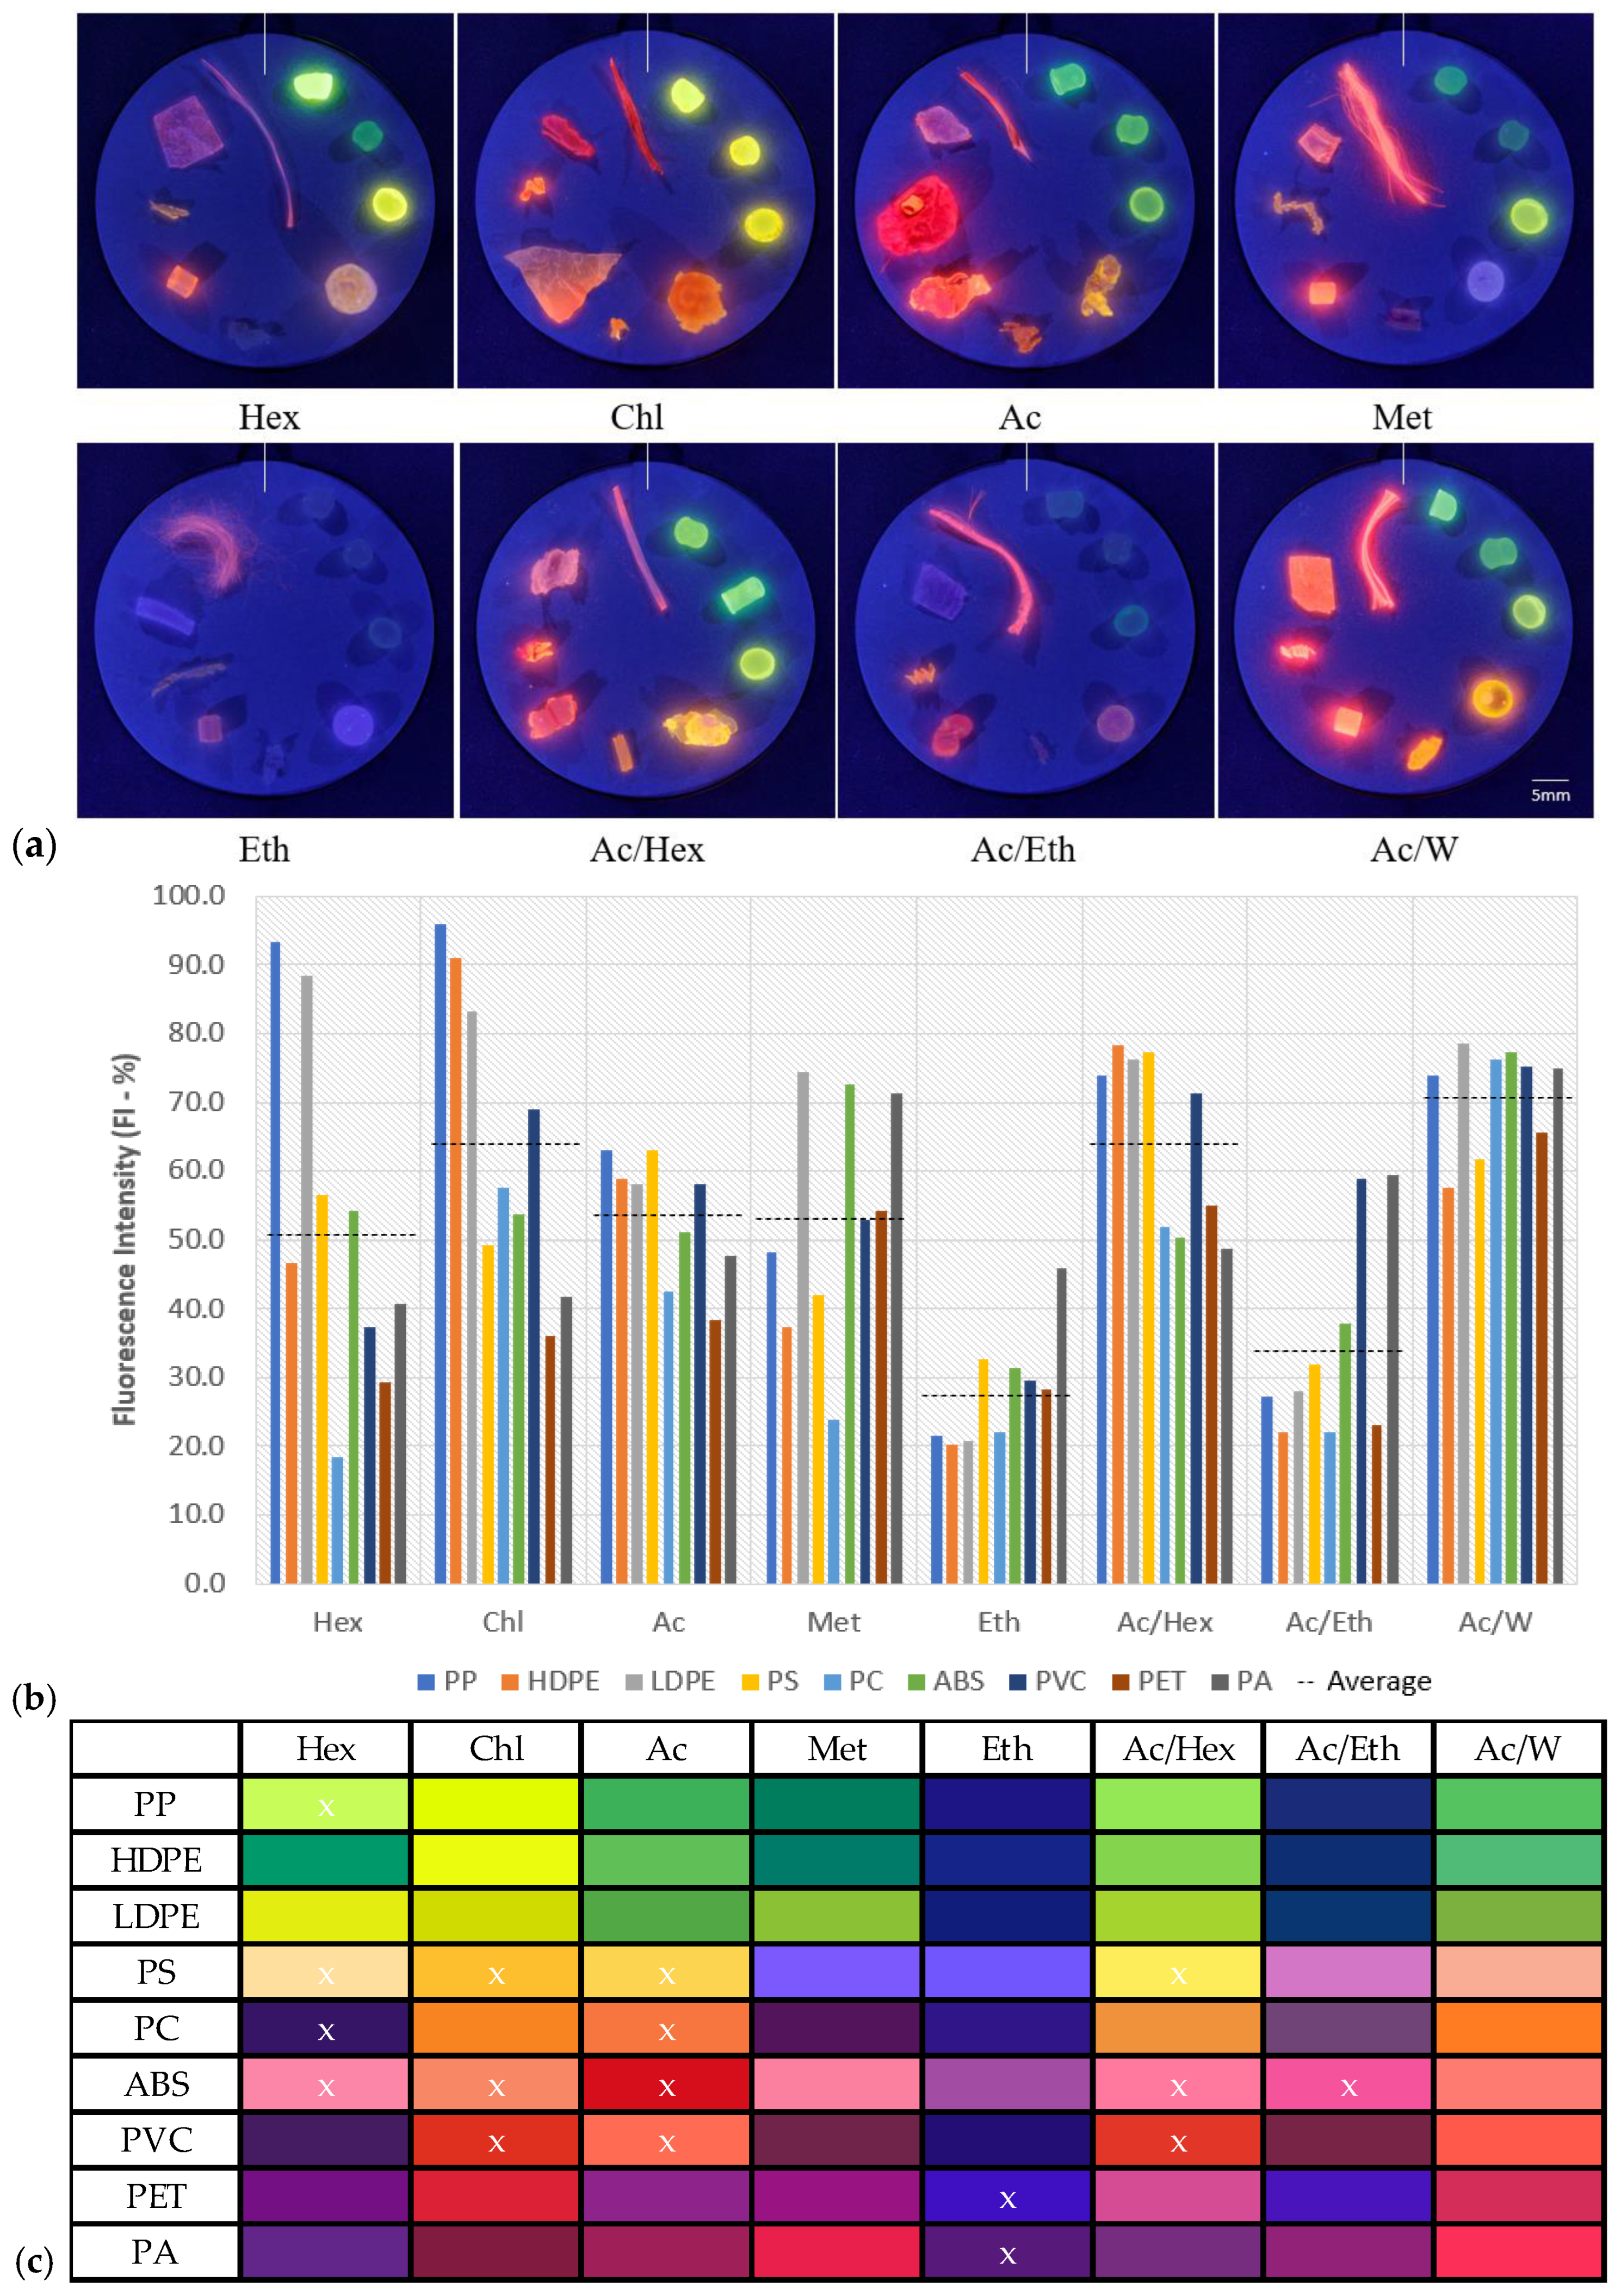
3.1. Effects of Solvent on Fluorescence Behavior

To assess NR-carrier solvent effectiveness, MPs stained with each (Hex, Chl, Ac, Met, Eth, Ac/Hex, Ac/Eth, and Ac/W) were arranged clockwise (see Figure 1a), starting with PP (top, right of line), followed by HDPE, LDPE, PS, PC, ABS, PVC, PET, and PA (top, left of line). The optimal NR carrier solvents were evaluated on their ability to (i) elicit strong FI across all the MPs studied, (ii) minimize polymer degradation, and (iii) reflect the polarity-induced Stokes shift of MPs.
Among the pure solvents studied, Chl exhibited the highest average FI for the nine plastics (FI: 64.2%), followed by Ac (53.4%), Met (53.0%), Hex (51.7%), and Eth (28.1%), as shown by the dashed lines in Figure 1b. This order deviates from the expected trend based on solvent polarity, where non-polar solvents were expected to enhance NR partitioning onto the MPs, thus supposedly increasing fluorescence (e.g., Hex > Chl > Ac > Met > Eth). The unexpected trend suggests that specific molecular interactions—such as the influence of Chl’s electronegative chlorine atoms or Ac’s carbonyl group—may play a more dominant role than bulk solvent polarity in governing NR fluorescence behavior.
Within individual solvents, the FI of the MPs varies depending on their molecular interactions with the solvent. In Hex, aliphatic MPs (e.g., PP (93.3%) and LDPE (83.3%), except for HDPE (46.7%) due to its high crystallinity) exhibit stronger FI than the other MPs, especially PC (18.3%). However, some MPs in Hex, such as PP and PS, swell due to polymer matrix expansion, making them appear larger. In Chl, most MPs exhibit strong fluorescence, with PET showing the lowest FI of 36.0%. Despite the promotion of FI of all MPs, Chl induces adverse degradation in many MPs, particularly causing complete dissolution of those with aromatic groups (PS, ABS, and PC), swelling certain MPs like PET and PVC. Ac, like Chl, induces strong FI across all MPs, but also degrades MPs with aromatic groups (PS, ABS, PVC) and causes swelling in PC and PET. In Met, most MPs elicit fluorescence greater than 37.3%, except for PC (24%), whereas in Eth, the MPs (PP, HDPE, LDPE, PC) barely elicit fluorescence, with some plastics, PS, ABS, PET, only visible due to their autofluorescence.
The disparity in FI (Met: 53.0% and Eth: 28.1%) is notable considering that these alcohols, Met and Eth, share a similar hydroxyl functional group, which is known to quench fluorescence [43], yet exhibit significantly different FI. This FI difference may stem from Met’s smaller molecular size (3.80 Å [44] vs. Eth’s (4.14 Å) [45]), enabling better NR absorption into the polymer matrix. Unlike Met, which does not result in any observable degradation, Eth-stained PET and PA appear to swell and unravel, respectively. The filter’s FI (20%) makes some MPs, such as PC (18.3%) in Hex, PC (24%) in Met, and PP (21.7%), HDPE (20.3%), LDPE (20.7%), PC (22%) in Eth, indistinguishable by standard greyscale thresholding techniques.
In addition to concerns of FI and polymer degradation, it is crucial to consider how accurately fluorescence reflects the polarity-induced Stokes shift of the plastic. Figure 1c provides insight into this Stokes shift, presenting the average color samples of the plastics (Figure 1a) arranged in ascending polarity. Utilizing the HSV (Hue/Saturation/Value) color space, primary colors—red (0°), green (120°), and blue (240°)—can help us better understand the effects of polarity-induced Stokes shift. It is expected that MPs with higher polarity exhibit a more significant red shift (counter-clockwise degree shift). Analyzing the solvents with a strong, consistent FI, it was found that Ac and Chl are the only two solvents reflecting the anticipated evolution of red shift in polarity from PP to PA (refer to Figure 1c and Table S1). The PP to PA shifts from green (154°) to red (339°) in Ac, and yellow (73°) to red (351°) in Chl, resulting in a spectrum shift of 82° and 175°, respectively. This difference in spectrum range is attributed to the solvent-dependent polarity shift of Chl, making all MPs, especially aliphatic ones (PP, HDPE, LDPE), appear more red-shifted. For instance, compared to PP in other solvents (Hex’s 91°, Ac’s 154°, and Met’s 180°), which appears green, PP in Chl experiences a red shift, appearing yellow (73°).
In summary, each pure solvent has distinct advantages and drawbacks as an NR carrier solvent for MPs. Hex, despite being the most non-polar solvent, falls short in yielding the strongest FI and induces adverse swelling in some plastics. Chl exhibits the strongest FI for all MPs but causes complete deformation in plastics with styrene groups (PS and ABS) and PVC. Alcohols (Met and Eth) show limited degradation but poor fluorescence across most polymers. Although not as bright as Chl and with some dissolution of the polymer structure, Ac has been proven to induce fluorescence in all nine MPs studied. Furthermore, the extended color spectrum of Ac makes it more suitable for clearly distinguishing between plastics. To enhance the applicability of solvents to a broader range of polymers while mitigating adverse effects, the mixing of Ac with other solvents was explored to enhance NR staining and the fluorescence of MPs.

3.2. Solvent Mixtures

Ac was combined with three solvents possessing distinct polarity: (i) the non-polar solvent Hex, (ii) the highly polar solvent water, and (iii) the moderately polar Eth [46]. These combinations were designed to assess the synergistic properties of each solvent pair to enhance NR partitioning or reduce polymer degradation. To interpret the solubility interactions, the TEAs graph was used. This triangular plot decomposes solubility behavior into three interaction forces—hydrogen bonding force (fh), polar forces (fp), and dispersion force (fd)—which together approximate the total Hildebrand solubility parameter [47]. The TEAs framework enables qualitative prediction and formulation of solvent compatibility and interaction strength with polymers through interpolation between solvents [47].
The adapted TEAs graph [47] (see Figure 2) categorizes solvents and polymers into empirically derived regions or “polymer solubility windows”, each shaded to represent a solvent class: alcohols (blue), ketones (yellow), amines (red), aliphatic (grey), chlorine (green), aromatics (purple), and esters (pink). Solvents (circles) and polymers of interest (squares) were positioned onto the TEAs graph based on their known solubility characteristics (refer to Table S2) [48]. Proximity between a polymer and a solvent region indicates potential compatibility and a higher likelihood of swelling and dissolution. For example, polymers such as ABS, PS, PVC, PET, and PE lie close to the green “Chl” region, which correlates with their observed dissolution and deformation in chlorinated solvents (see Figure 1a).
It is important to note that the TEAs graph primarily reflects interactions in the amorphous domains of the polymer and may not fully account for the differences in crystallinity (i.e., HDPE vs. LDPE) or the resistance conferred by chemically inert polymers such as PE and PP, which lack functional groups reactive with solvents. Furthermore, while the TEAs graph is a useful visual tool, it is a simplified two-dimensional model that does not incorporate important variables such as temperature (>25 °C), concentration of solvents (>10%), and exposure time [47].
Among the solvent mixtures, Ac/Hex demonstrated notable improvements in FI, with an average of 64.8% across multiple MPs, including PC (52.0%), PVC (71.3%), and HDPE (78.3%). The enhancement observed in highly crystalline HDPE is likely due to Ac’s smaller molecular size (4.19 Å) [45] compared to Hex (10.3 Å) [49], which may facilitate deeper penetration into the polymer matrix and improved interaction with embedded NR dye. However, this Ac/Hex mixture also induced swelling of HDPE and dissolution in PS, ABS, PVC, and PET (See Figure 1a). These more pronounced adverse effects can be explained by the mixture’s proximity on the TEAs graph to majority of the polymers studied, indicating strong chemical compatibility and high solubilization potential.
The Ac/Eth mixture yielded moderate improvements in FI (average: 27.3%) over Eth alone, particularly PS (32.0%), ABS (38.0%), PVC (59.0%), PA (59.3%), and to a limited degree PP (27.3%), LDPE (28.0%), PC (22.0%), and PET (23.0%). While Eth’ known fluorescence-quenching effects limited the overall enhancement, the mixture minimized polymer dissolution and preserved the surface wax layer of the PA fibers.
Lastly, the Ac/W mixture achieved the highest overall FI (average: 71.3%) across all nine MPs tested. Notably, PS, PC, and PET exhibited strong fluorescence responses. Furthermore, the Ac/W blend reduced degradation in PS, ABS, PC, and PVC, likely due to the mixture’s position on the TEAs graph being further from these polymers. Despite water’s strong hydrogen bonding and quenching potential, its smaller molecular size (1.62 Å) compared to Eth (4.14 Å) and Ac (4.19 Å) [45] likely facilitated deeper NR penetration into the polymer matrix, enhancing fluorescence. In summary, among the tested acetone-based mixtures, Ac/W offers the optimal balance of strong fluorescence and minimal polymer degradation.

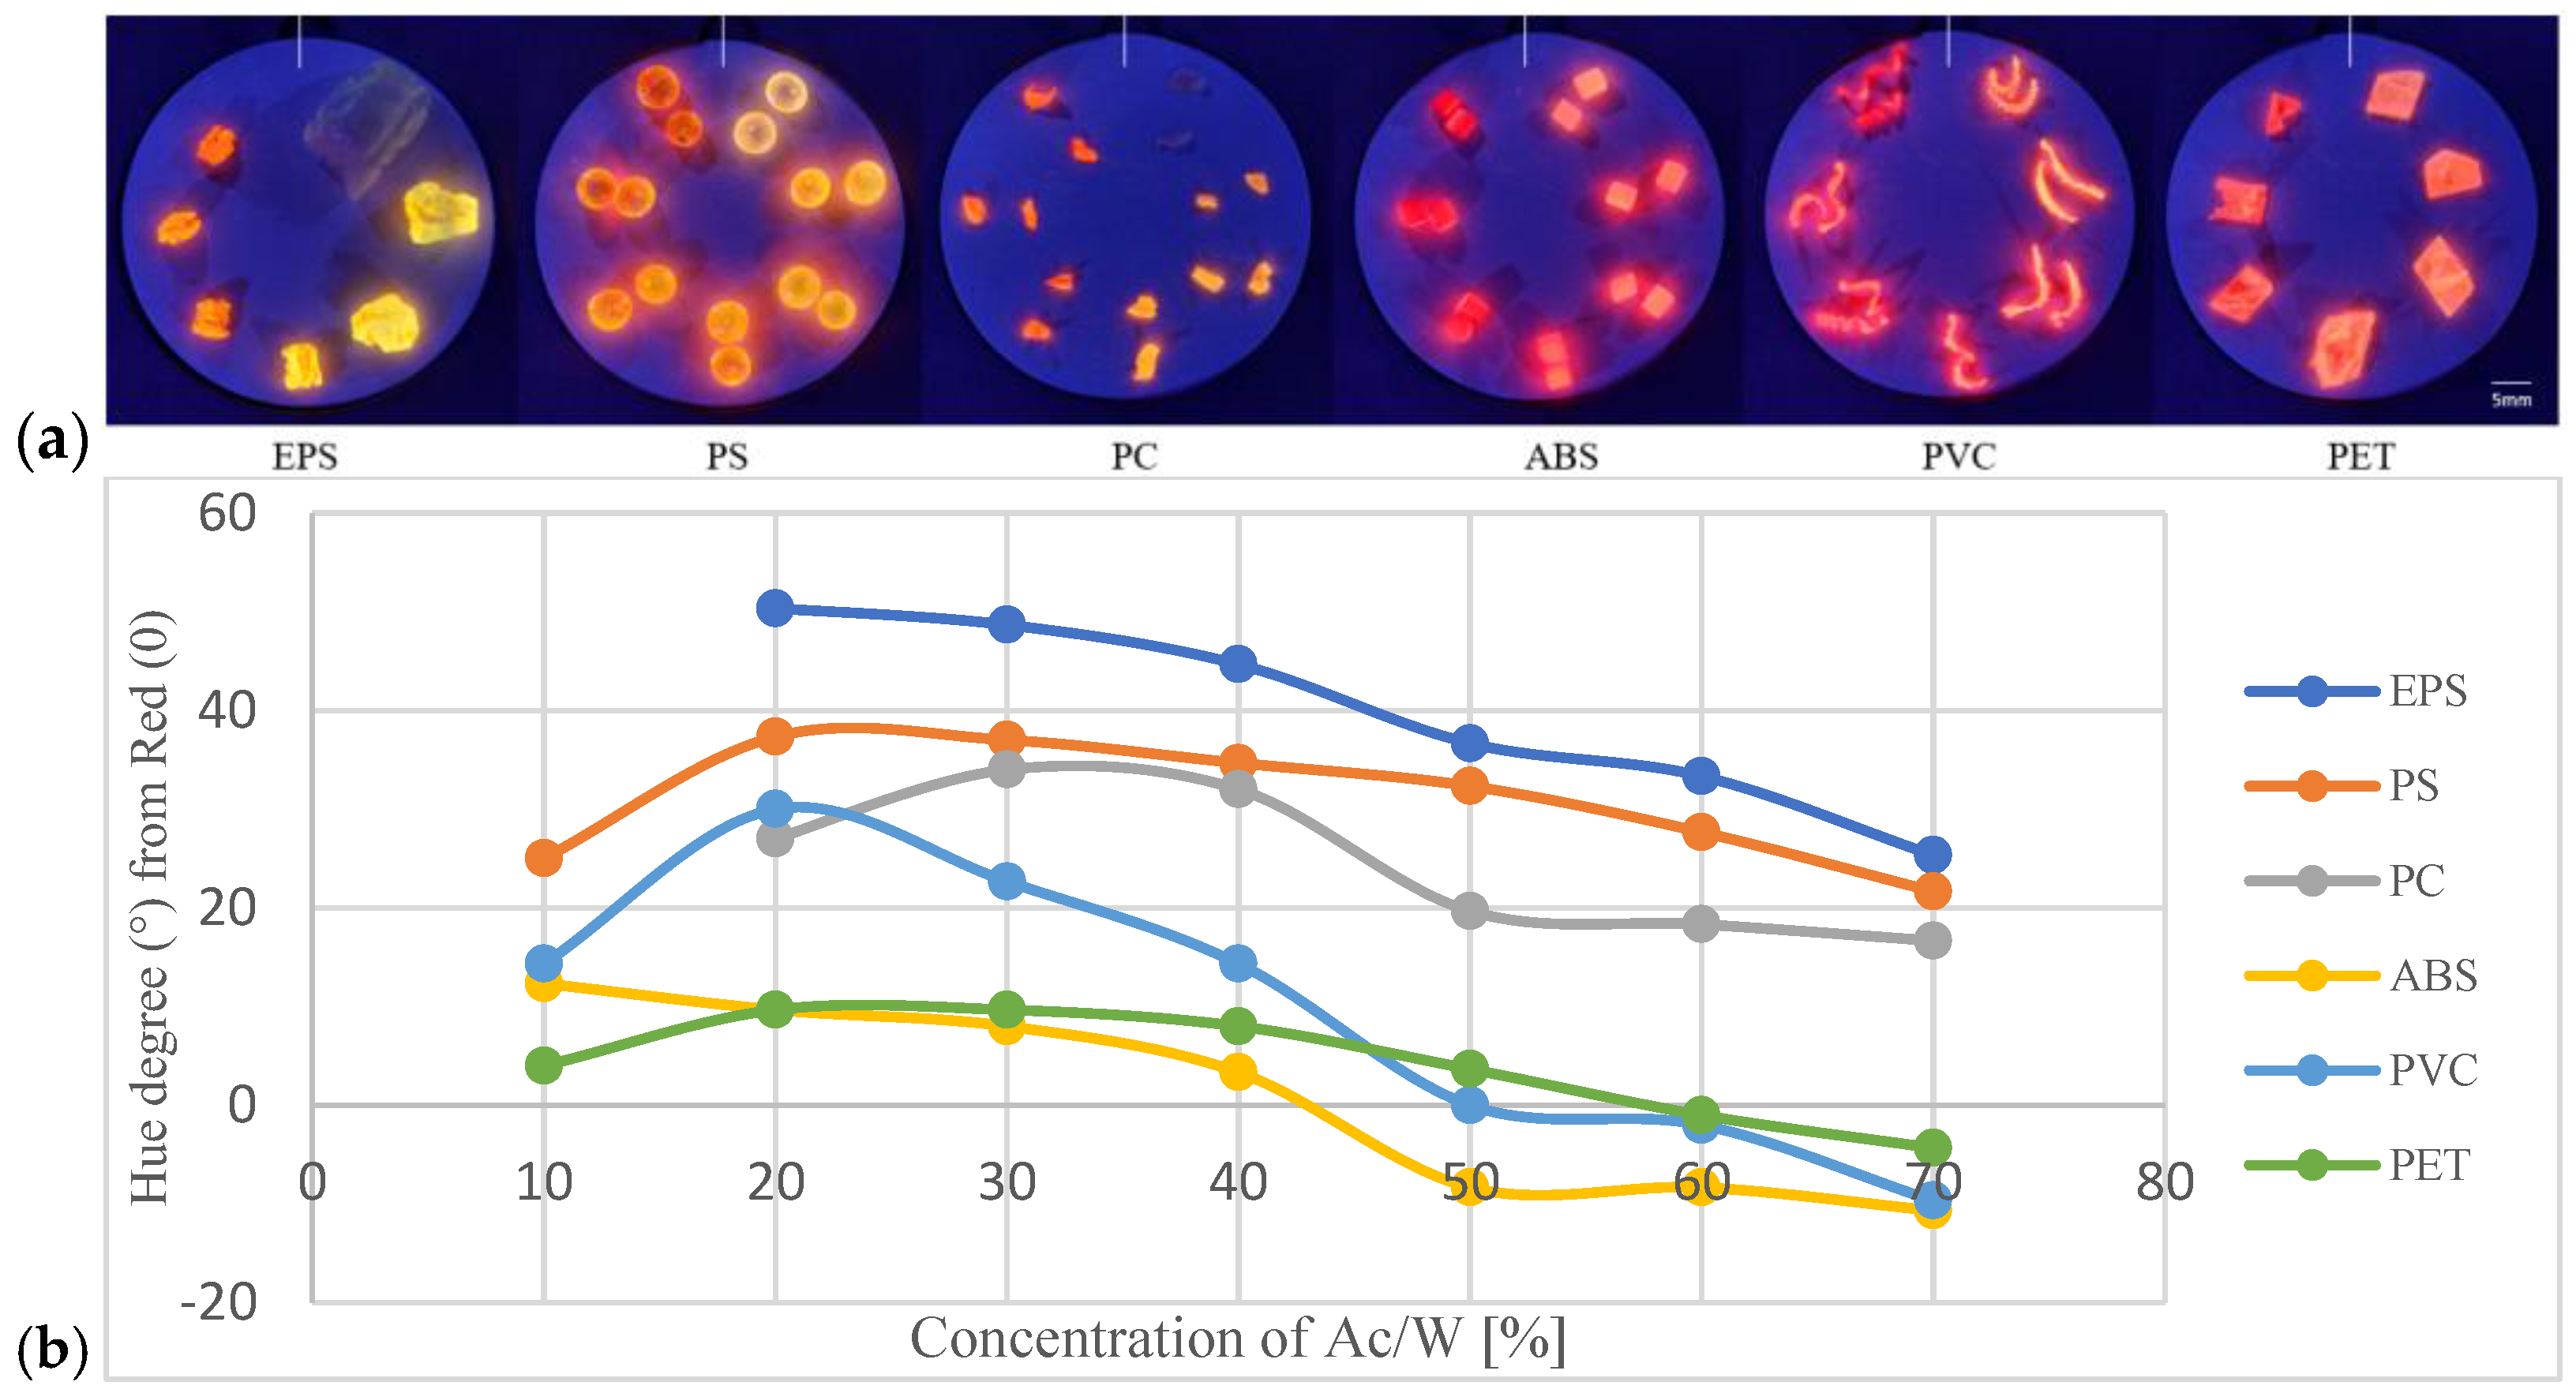
3.3. Optimizing Ac/W Mixtures

To determine the optimal Ac/W ratio for NR staining, mixtures ranging from 10 to 70% Ac were tested on degradation-sensitive MPs-PS, PC, ABS, PVC, and PET and expanded PS (EPS) to account for crystallinity differences (see Figure 3). MPs were arranged clockwise from 10% (top, right of line) to 70% (top, left of line). At 10%, EPS and PC showed weak fluorescence. As Ac concentration increased, a red shift in NR fluorescence was observed, peaking at 70%. However, higher concentration of Ac also caused deformation: EPS shrank in size, PS fused (Ac > 30%), ABS deformed (Ac > 40%), and PET warped (Ac > 60%).
To investigate how the color of the MPs changes with Ac/W concentration, a graph (Figure 3b) displaying the deviation of dominant hues (°) of the 6 MPs from red (0/360°) against increasing concentrations of Ac/W (ranging from 10% to 70%) was plotted. Here, negative y-axis values indicate hue values smaller than 360°, while positive values indicate values above 0°. Data points of EPS (−63°) and PC (−65°) of Ac/W at 10% were excluded due to their lack of fluorescence. In Figure 3b, it was found that certain plastics exhibited distinct hue peaks, such as PS (25%), PVC (20%), PET (25%), and PC (30%), indicating dominant hues before a red shift (decreasing hue) occurred with increasing solvent polarity. Considering the range of dominant hue peaks and the tendency for solubilization at higher concentrations of Ac, it appears that an Ac/W mixture between 20 and 30% is suitable. Therefore, a compromise of 25% as concentration of Ac/W was deemed to be the most optimal solution for reflecting polarity-induced fluorescence.

3.4. Classification Using Polarity-Induced Fluorescence

Polarity, defined as the imbalance in electronegativity among molecules and atoms, can be assessed through physical surface properties like water contact angle (WCA) and dielectric charge, or approximated using chemical properties such as partitioning coefficients, as summarized in Table 1. WCA measurements below 90° indicate hydrophilic characteristics, while values above 90° suggest hydrophobicity [50]. Dielectric constant (DE) measures the material’s ability to polarize under an electric field, with higher DE indicating greater polarity [51]. Molecular-level indicators like partitioning coefficients between octanol and water (log Kow) also inform polarity, with computational models offering reliable estimates [52].
To evaluate environmental relevance of polarity-driven fluorescence, 10 types of MPs (PP, HDPE, LDPE, EPS, PS, PC, ABS, PVC, PET, and PA) were subjected to Fenton oxidation pretreatment and stained with a 25% Ac/W mixture. The MPs were then arranged in a clockwise fashion based on their hue (see Figure 4a). A simplified 2D representation of the 3D HSV color space of the MPs was created, illustrating the angular position of Hue (360°) of the color wheel, with the outward radial axis representing saturation (%) (without the dimension of Value), as shown in Figure 4b. The plastics are labelled according to their increasing red shift in dominant wavelength, ranging from green to red—#1. PP, #2. HDPE, #3. LDPE, #4. PS + EPS, #5. PC, #6. ABS, #7. PVC, #8. PET, #9. PA. A clear trend in the red shift of the fluorescence of MPs is evident in the counterclockwise progression of the dominant hue (°), from green PP (#1) to red PA (#9), as depicted in Figure 4b.

3.5. Evaluating the Classification Ability of MPs

To assess the classification potential of NR staining, expression E = H 2 + S 2 + V 2 [53] was used to calculate the difference between two colors by assessing variations in their Hue, Saturation, and Value components among the 10 Fenton-oxidized NR-stained MPs (Table 2). This ∆E value facilitates precise evaluation of color dissimilarity, with fluorescence yielding larger ∆E values more easily distinguishable due to greater color disparity. The minimal detectable difference of colors is a ∆E of one. Values between 3 and 6 indicate noticeable differences, a range of 6–10 suggests clearly perceptible distinctions, and values above 10 represent substantial and significant differences [54,55]. It is important to note that ∆E is particularly adept at discriminating between colors rather than matching them. It was observed that the majority of the 10 MPs can be easily distinguished from one another (∆E >10). Notably, there is a moderate capability to differentiate between PA and PVC (∆E: 9.5), while the ability to distinguish PVC and ABS is diminished (∆E: 5.4), as well as that of PVC and PA (∆E: 4.7).
To assess the impact of Fenton oxidation on the fluorescence of MPs and NOM, ten different MPs and common NOM sources—derived from chitin (eggshells and fingernails), wood shavings, and cotton—were examined. NR staining was compared with and without pre-treatment, and particles were arranged clockwise to avoid overlap (refer to Figure S1). The resulting ∆E values between untreated (control) and Fenton-treated samples are summarized in Table S3. It was observed that Fenton oxidation caused minimal changes in NR-stained MPs, with ∆E values ranging from 2.5 (PA) to 9.8 (ABS) (refer to Table S3). In contrast, most NOMs experienced substantial fluorescence reduction: fingernail chitin (∆E = 38.0), eggshell chitin (∆E = 59.0), and wood (∆E = 60.5) showed nearly complete quenching of fluorescence. Cotton exhibited a smaller reduction (∆E = 11.9) but retained detectable fluorescence after. Notably, cotton’s purple hue (254°) remained easily distinguishable from NR-stained MPs (352–87°, red to green).
Despite slight reductions in FI, all MPs retained their dominant fluorescent hues. FTIR spectra were collected for three conditions: untreated control group (without Fenton oxidation or staining), NR-stained MPs (without Fenton oxidation), and NR-stained MPs subjected to Fenton oxidation (see Figure S2). Among the 10 MPs, minor changes were observed in the FTIR spectrum of PVC, specifically a shift in the carbonyl stretching at 1700 cm−1, while a new peak emerged in PET, corresponding to hydroxyl stretching at 2900 cm−1, following NR staining and Fenton oxidation. These oxidation-related peaks suggest that Fenton oxidation may induce a greater degree of red shift in certain polymers. However, these shifts did not significantly affect fluorescence hue (∆E <6), suggesting Fenton oxidation preserves MP fluorescence (∆E >10) while suppressing NOM fluorescence. This makes Fenton oxidation a promising strategy to minimize false positives from NR-stained NOM in environmental applications without deforming the polymer structure.

3.6. Spectral Behavior of NR-Stained MPs

MP color perception arises from a broad spectrum of fluorescence wavelengths condensed into a single representative color. This can lead to spectral overlap, making it challenging to distinguish MPs under certain lighting conditions—a phenomenon known as metamerism [56]. To address this, Cokin optical transmission filters (green, yellow, orange, and red) were used to isolate specific spectral regions. These filters work by blocking specific wavelengths while allowing those longer than their respective cutoff points to pass through. FI was measured through each filter and plotted to generate a spectral profile, as shown in Figure 5. It was observed that the green filter was the lowest due to wavelength blocking between its two transmission peaks. Additionally, variations in particle shape, thickness, and opacity contributed to larger standard deviations in FI measurements. Notably, PS, PET, and PC exhibited more intense fluorescence at their edges compared to their interiors. The use of isolated spectral profiles improves MP differentiation by highlighting fluorescence signatures that would otherwise be obscured by metameric overlap.

4. Discussion

This study evaluated eight different carrier solvents for NR staining of MPs. Previously advocated solvents, such as Chl [38] and Hex [37], caused significant polymer degradation to certain MP types. Solvent mixtures, such as Ac/ Eth [46], reduced degradation but resulted in limited FI. In contrast, the proposed Ac/W mixture (25% (v/v) acetone) successfully mitigated polymer degradation while achieving the highest FI and optimal Stokes shift across the MPs. Notably, this study demonstrated that NR fluorescence is influenced more by the functional groups than by solvent polarity, challenging prior claims by Shim et al. (2016) [37]. This enhanced FI likely arises from Ac’s electronegative carbonyl group, which strongly affects NR fluorescence. Water’s small molecular size may further enhance dye uptake by aiding solvent penetration into the polymer matrix. This synergistic combination distinguishes Ac/W from both non-polar solvents (e.g., Hex) and highly polar solvents (e.g., Met, Ac), which either degrades the polymer structure or poorly induces strong NR–polymer interaction.
Polarity measures, like WCA, DE, and log Kow, approximate polymer polarity and distinguish polar (PA/PET) from non-polar (PE/PP) plastics [57]. However, discrepancies with hue-based results (i.e., ABS and PVC) arise due to limitations in accounting for specific effects of molecular groups, such as π-π bonding and hydrogen bonding [49,50]. WCA, a surface-specific measure of hydrophobicity, is influenced by factors such as surface roughness, chemical composition, and the presence of additives or contaminants. For example, PVC’s high plasticizer content (15–50%) [58] alters its surface wettability and thereby its WCA. In contrast, DE reflects bulk molecular polarizability and is less responsive to symmetric aromatic structures than to polar functional groups, like hydroxyl or carbonyl groups [59]. This reduced sensitivity results from the electron delocalization in aromatic rings, limiting DE’s ability to account for π-π interactions, as seen with ABS [60]. It is to be noted that log Kow data for ABS were unavailable but appear to exhibit trends similar to DE.
Despite the limitations in accounting for π-π interactions, DE and log Kow can serve as a more accurate approximation for polarity than WCA, which is more sensitive to ambient humidity during measurement [61], biofouling [62], and photo-oxidation [57]. In contrast, DE and log Kow are based on molecular properties, rather than superficial surface wettability; they are more appropriate for studying NR molecular interactions. Between the two measures, log Kow may be more practical for creating a polarity catalog of MPs. DE is influenced by the frequency of the applied electric field, sample properties like geometry and thickness [59,63,64,65], and surrounding environmental conditions [66], leading to variability across datasets. Conversely, log Kow values are derived from molecular dynamic simulation that account for surface area, enabling standardized comparison [52]. With data available for over 110 polymers—including various branching patters and chemistries— the log Kow offers a robust basis for understanding polymer–NR interactions.
Fenton oxidation effectively eliminates the fluorescence of NOM while minimally altering the fluorescent hues and chemical properties of the MPs. This critical pretreatment step enhances the specificity of NR-based imaging by reducing interference of NOM such as wood, chitin, and cotton. The observed fluorescence quenching is likely due to the presence of Fe(II) in the Fenton reagent, as metal ions are known quenchers of fluorescence [67]. It is hypothesized that partially digested NOM retains surface-bound Fe(II), which suppresses NR fluorescence, thereby reducing false positives and improving MP detection in complex environmental samples.
Following solvent optimization for appropriate polarity-induced fluorescence, the weighted HSV color space was introduced to improve data interpretation. Unlike the interdependent RGB color model, which requires complex formulaic transformations to derive a proxy “polarity index” [34,35,38], the hue-dominant HSV model offers a direct correlation between hue (in degrees) and Stokes shift. This simplifies fluorescence analysis, especially for environmental weathered MPs, which often exhibit fluorescence hue-based red shifts over time due to weathering [52,68]. The intuitive representation can enhance machine learning (ML) performance by reducing input noise, overfitting and avoiding arbitrary proxies, unlike prior approaches employed by Meyer et al. (2022) [69], who used decision trees to classify MPs by their individual R/G/B channels. Consequently, ML models using HSV-based inputs demonstrate improved robustness and applicability to environmental samples and large datasets.
To further enhance MP differentiation, selective bandpass filters were employed to isolate fluorescence across specific wavelength bands. Each polymer type displayed a unique spectral profile [70] (Figure 5), supporting classification based on spectral shape and intensity. This approach is especially beneficial for distinguishing challenging MPs —such as ABS, PVC, and PA—that displayed visual similarity under unfiltered conditions. By isolating material-specific emission wavelengths, the filters improve classification accuracy. Although higher-order statistical comparisons are beyond the scope of this study, future use of multivariate statistical models in the HSV space could further refine the accuracy and specificity of MP differentiation. Moreover, integrating multiple excitation sources with selective bandpass filters could pave the way for the development of an advanced multispectral imaging platform for precise polymer identification.
As NR staining gains international traction for MP analysis [24], standardizing the NR carrier solvent and demonstrating consistent performance across polymer types is key to achieving interlaboratory harmonization. When combined with multispectral fluorescence imaging, this approach offers a low-cost, high-specificity method for identifying MPs based on physicochemical properties. With advancements such as super-resolution fluorescence imaging, there is a potential to extend this method to nanoplastics [71]. However, further research is needed to address the influence of weathering, pigments, and additives on NR fluorescence behavior. Overcoming these challenges is essential for establishing NR fluorescence imaging as a robust, standalone tool for MP identification in environmental samples.

5. Conclusions

In conclusion, this study systematically evaluated eight different carrier solvents for NR staining of MPs (PP, HDPE, LDPE, PS, EPS, ABS, PC, PVC, PET, PA), identifying Ac/W [25%] as the optimal solvent for enhancing fluorescence while preserving polymer integrity. Fenton oxidation confirmed the method’s robustness, with significant fluorescence quenching in NOMs (eggshells, fingernails, wood, and cotton) but minimal changes observed in the NR-stained MPs. The HSV color space was introduced for improved visualization of NR fluorescence, and comparisons of different polarity measures (WCA, DE, and Log Kow) with the observed Stokes shift provided insight into polarity–fluorescence relationships. Most MPs were readily distinguishable when combined with bandpass filters due to their material-dependent spectral characteristics. It is suggested that combining multiple excitation wavelengths and selective transmission filters, powered by machine learning, could overcome spectral overlaps and mitigate issues such as metamerism. With these advancements, this approach shows strong potential to establish NR fluorescence imaging as a standalone method for accurate MP identification in large-scale environmental monitoring.

Supplementary Materials

The following supporting information can be downloaded at: https://www.mdpi.com/article/10.3390/colorants4020020/s1, Table S1: Average HSV representation of NR-stained MPs used for Table 1 arranged by polarity; Table S2: Fractional solubility parameters of plastic and solvents for Teas graph (data for Figure 2); Figure S1: Comparison between NR-stained MPs and NOM, control without pretreatment (left) and Fenton-oxidized (right). From left (clockwise): #1-HDPE, #2-LDPE, #3-PP, #4-PS, #5-EPS, #6-ABS, #7-PC, #8-PVC, #9-PET, #10-PA, #11-fingernail, #12-eggshell, #13-wood, and #14-cotton; Table S3: ∆E of NR-stained materials (without pretreatment) vs. MPs with Fenton oxidation of Figure S1; Figure S2: FTIR spectrum of 10 MPs (PP, LDPE, HDPE, PS, EPS, ABS, PC, PVC, PET, PA), comparing virgin MPs (without pretreatment or staining) (top), NR stained MPs w/o Fenton oxidation (middle) and NR stained MPs with Fenton oxidation (bottom).

Author Contributions

Conceptualization, D.H.; methodology, D.H. and J.M.; validation, D.H. and J.M.; formal analysis, D.H.; investigation, D.H.; data curation, D.H.; writing—original draft preparation, D.H.; writing—review and editing, D.H. and J.M.; visualization, D.H.; supervision, D.H. and J.M.; All authors have read and agreed to the published version of the manuscript.

Funding

This work was supported by the USDA NIFA Hatch Formula Funds (Project # WIS03059).

Institutional Review Board Statement

Not applicable.

Informed Consent Statement

Not applicable.

Data Availability Statement

The authors confirm that the data supporting the findings of this study are available within the article [and/or] its Supplementary Materials.

Acknowledgments

We thank K.G. Karthikeyan for securing the funding for this project and Majid Sarmadi for his expertise in color theory and polymer science.

Conflicts of Interest

The authors declare no conflicts of interest.

Abbreviations

The following abbreviations are used in this manuscript:
HDPEHigh-density polyethylene
LDPE Low-density polyethylene
PPPolypropylene
PSPolystyrene
EPSExpanded polystyrene
ABSAcrylonitrile butadiene styrene
PCPolycarbonate
PVCPolyvinylchloride
PETPolyethylene terephthalate
PAPolyamide
Hexn-Hexane
ChlChloroform
AcAcetone
EthEthanol
MetMethanol
Ac-HexAcetone with n-hexane
Ac-EthAcetone with ethanol
Ac-WAcetone with water
NRNile Red
MPsMicroplastics
FIFluorescence intensity
NOM Natural organic matter
MLMachine Learning

References

  1. Ritchie, H.; Samborska, V.; Roser, M. Plastic Pollution. Our World in Data, November 2023. Available online: https://ourworldindata.org/plastic-pollution (accessed on 7 December 2023).
  2. Peng, Y.; Wu, P.; Schartup, A.T.; Zhang, Y. Plastic waste release caused by COVID-19 and its fate in the global ocean. Proc. Natl. Acad. Sci. USA 2021, 118, e2111530118. [Google Scholar] [CrossRef] [PubMed]
  3. UN. Environment. Plastic Pollution. UNEP—UN Environment Programme. Available online: http://www.unep.org/plastic-pollution (accessed on 7 December 2023).
  4. Cai, L.; Wang, J.; Peng, J.; Wu, Z.; Tan, X. Observation of the degradation of three types of plastic pellets exposed to UV irradiation in three different environments. Sci. Total Environ. 2018, 628, 740–747. [Google Scholar] [CrossRef] [PubMed]
  5. Paluselli, A.; Fauvelle, V.; Galgani, F.; Sempéré, R. Phthalate Release from Plastic Fragments and Degradation in Seawater. Environ. Sci. Technol. 2019, 53, 166–175. [Google Scholar] [CrossRef]
  6. Song, Y.K.; Hong, S.H.; Jang, M.; Han, G.M.; Jung, S.W.; Shim, W.J. Combined effects of UV exposure duration and mechanical abrasion on microplastic fragmentation by polymer type. Environ. Sci. Technol. 2017, 51, 4368–4376. [Google Scholar] [CrossRef]
  7. Du, H.; Xie, Y.; Wang, J. Microplastic degradation methods and corresponding degradation mechanism: Research status and future perspectives. J. Hazard. Mater. 2021, 418, 126377. [Google Scholar] [CrossRef]
  8. Peeken, I.; Primpke, S.; Beyer, B.; Gütermann, J.; Katlein, C.; Krumpen, T.; Bergmann, M.; Hehemann, L.; Gerdts, G. Arctic sea ice is an important temporal sink and means of transport for microplastic. Nat. Commun. 2018, 9, 1505. [Google Scholar] [CrossRef]
  9. Hasenmueller, E.A.; Baraza, T.; Hernandez, N.F.; Finegan, C.R. Cave sediment sequesters anthropogenic microparticles (including microplastics and modified cellulose) in subsurface environments. Sci. Total Environ. 2023, 893, 164690. [Google Scholar] [CrossRef]
  10. Napper, I.E.; Davies, B.F.R.; Clifford, H.; Elvin, S.; Koldewey, H.J.; Mayewski, P.A.; Miner, K.R.; Potocki, M.; Elmore, A.C.; Gajurel, A.P.; et al. Reaching New Heights in Plastic Pollution—Preliminary Findings of Microplastics on Mount Everest. One Earth 2020, 3, 621–630. [Google Scholar] [CrossRef]
  11. Jamieson, A.J.; Brooks, L.S.R.; Reid, W.D.K.; Piertney, S.B.; Narayanaswamy, B.E.; Linley, T.D. Microplastics and synthetic particles ingested by deep-sea amphipods in six of the deepest marine ecosystems on Earth. R. Soc. Open Sci. 2019, 6, 180667. [Google Scholar] [CrossRef]
  12. Boots, B.; Russell, C.W.; Green, D.S. Effects of Microplastics in Soil Ecosystems: Above and Below Ground. Environ. Sci. Technol. 2019, 53, 11496–11506. [Google Scholar] [CrossRef]
  13. Wan, Y.; Wu, C.; Xue, Q.; Hui, X. Effects of plastic contamination on water evaporation and desiccation cracking in soil. Sci. Total Environ. 2019, 654, 576–582. [Google Scholar] [CrossRef] [PubMed]
  14. Menéndez-Pedriza, A.; Jaumot, J. Interaction of Environmental Pollutants with Microplastics: A Critical Review of Sorption Factors, Bioaccumulation and Ecotoxicological Effects. Toxics 2020, 8, 40. [Google Scholar] [CrossRef]
  15. Lee, Y.; Cho, J.; Sohn, J.; Kim, C. Health Effects of Microplastic Exposures: Current Issues and Perspectives in South Korea. Yonsei Med. J. 2023, 64, 301–308. [Google Scholar] [CrossRef]
  16. Conti, G.O.; Ferrante, M.; Banni, M.; Favara, C.; Nicolosi, I.; Cristaldi, A.; Fiore, M.; Zuccarello, P. Micro-and nano-plastics in edible fruit and vegetables. The first diet risks assessment for the general population. Environ. Res. 2020, 187, 109677. [Google Scholar] [CrossRef]
  17. Dehaut, A.; Cassone, A.-L.; Frère, L.; Hermabessiere, L.; Himber, C.; Rinnert, E.; Rivière, G.; Lambert, C.; Soudant, P.; Huvet, A.; et al. Microplastics in seafood: Benchmark protocol for their extraction and characterization. Environ. Pollut. 2016, 215, 223–233. [Google Scholar] [CrossRef] [PubMed]
  18. Lee, H.; Kunz, A.; Shim, W.J.; Walther, B.A. Microplastic contamination of table salts from Taiwan, including a global review. Sci. Rep. 2019, 9, 10145. [Google Scholar] [CrossRef]
  19. Scircle, A.; Cizdziel, J.V. Detecting and Quantifying Microplastics in Bottled Water using Fluorescence Microscopy: A New Experiment for Instrumental Analysis and Environmental Chemistry Courses. J. Chem. Educ. 2020, 97, 234–238. [Google Scholar] [CrossRef]
  20. Kedzierski, M.; Lechat, B.; Sire, O.; Le Maguer, G.; Le Tilly, V.; Bruzaud, S. Microplastic contamination of packaged meat: Occurrence and associated risks. Food Packag. Shelf Life 2020, 24, 100489. [Google Scholar] [CrossRef]
  21. Ragusa, A.; Svelato, A.; Santacroce, C.; Catalano, P.; Notarstefano, V.; Carnevali, O.; Papa, F.; Rongioletti, M.C.A.; Baiocco, F.; Draghi, S.; et al. Plasticenta: First evidence of microplastics in human placenta. Environ. Int. 2021, 146, 106274. [Google Scholar] [CrossRef]
  22. Leslie, H.A.; van Velzen, M.J.M.; Brandsma, S.H.; Vethaak, A.D.; Garcia-Vallejo, J.J.; Lamoree, M.H. Discovery and quantification of plastic particle pollution in human blood. Environ. Int. 2022, 163, 107199. [Google Scholar] [CrossRef]
  23. Lebreton, L.; Egger, M.; Slat, B. A global mass budget for positively buoyant macroplastic debris in the ocean. Sci. Rep. 2019, 9, 12922. [Google Scholar] [CrossRef]
  24. Bakir, A.; McGoran, A.R.; Silburn, B.; Russell, J.; Nel, H.; Lusher, A.L.; Amos, R.; Shadrack, R.S.; Arnold, S.J.; Castillo, C.; et al. Creation of an international laboratory network towards global microplastics monitoring harmonisation. Sci. Rep. 2024, 14, 12714. [Google Scholar] [CrossRef] [PubMed]
  25. Xu, J.-L.; Thomas, K.V.; Luo, Z.; Gowen, A.A. FTIR and Raman imaging for microplastics analysis: State of the art, challenges and prospects. TrAC Trends Anal. Chem. 2019, 119, 115629. [Google Scholar] [CrossRef]
  26. Schwaferts, C.; Niessner, R.; Elsner, M.; Ivleva, N.P. Methods for the analysis of submicrometer- and nanoplastic particles in the environment. TrAC Trends Anal. Chem. 2019, 112, 52–65. [Google Scholar] [CrossRef]
  27. Fries, E.; Dekiff, J.H.; Willmeyer, J.; Nuelle, M.-T.; Ebert, M.; Remy, D. Identification of polymer types and additives in marine microplastic particles using pyrolysis-GC/MS and scanning electron microscopy. Environ. Sci. Process. Impacts 2013, 15, 1949. [Google Scholar] [CrossRef]
  28. Shim, W.J.; Hong, S.H.; Eo, S.E. Identification methods in microplastic analysis: A review. Anal. Methods 2017, 9, 1384–1391. [Google Scholar] [CrossRef]
  29. Ho, D.; Liu, S.; Wei, H. The glowing potential of Nile red for microplastics Identification: Science and mechanism of fluorescence staining. Microchem. J. 2023, 197, 109708. [Google Scholar] [CrossRef]
  30. Kalaronis, D.; Ainali, N.M.; Evgenidou, E.; Kyzas, G.Z.; Yang, X.; Bikiaris, D.N.; Lambropoulou, D.A. Microscopic techniques as means for the determination of microplastics and nanoplastics in the aquatic environment: A concise review. Green Anal. Chem. 2022, 3, 100036. [Google Scholar] [CrossRef]
  31. Singh, B.; Kumar, A. Advances in microplastics detection: A comprehensive review of methodologies and their effectiveness. TrAC Trends Anal. Chem. 2024, 170, 117440. [Google Scholar] [CrossRef]
  32. Silva, A.B.; Bastos, A.S.; Justino, C.I.; da Costa, J.P.; Duarte, A.C.; Rocha-Santos, T.A. Microplastics in the environment: Challenges in analytical chemistry—A review. Anal. Chim. Acta 2018, 1017, 1–19. [Google Scholar] [CrossRef]
  33. Rumin, J.; Bonnefond, H.; Saint-Jean, B.; Rouxel, C.; Sciandra, A.; Bernard, O.; Cadoret, J.-P.; Bougaran, G. The use of fluorescent Nile red and BODIPY for lipid measurement in microalgae. Biotechnol. Biofuels 2015, 8, 42. [Google Scholar] [CrossRef] [PubMed]
  34. Wang, C.; Jiang, L.; Liu, R.; He, M.; Cui, X.; Wang, C. Comprehensive assessment of factors influencing Nile red staining: Eliciting solutions for efficient microplastics analysis. Mar. Pollut. Bull. 2021, 171, 112698. [Google Scholar] [CrossRef]
  35. Maes, T.; Jessop, R.; Wellner, N.; Haupt, K.; Mayes, A.G. A rapid-screening approach to detect and quantify microplastics based on fluorescent tagging with Nile Red. Sci. Rep. 2017, 7, 44501. [Google Scholar] [CrossRef] [PubMed]
  36. Sturm, M.T.; Horn, H.; Schuhen, K. The potential of fluorescent dyes—Comparative study of Nile red and three derivatives for the detection of microplastics. Anal. Bioanal. Chem. 2021, 413, 1059–1071. [Google Scholar] [CrossRef]
  37. Shim, W.J.; Song, Y.K.; Hong, S.H.; Jang, M. Identification and quantification of microplastics using Nile Red staining. Mar. Pollut. Bull. 2016, 113, 469–476. [Google Scholar] [CrossRef]
  38. Tamminga, M.; Hengstmann, E.; Fischer, E. Nile Red Staining as a Subsidiary Method for Microplastic Quantification: A Comparison of Three Solvents and Factors Influencing Application Reliability. J. Earth Sci. Environ. Stud. 2017, 2, 1–8. [Google Scholar]
  39. Erni-Cassola, G.; Gibson, M.I.; Thompson, R.C.; Christie-Oleza, J.A. Lost, but Found with Nile Red: A Novel Method for Detecting and Quantifying Small Microplastics (1 mm to 20 μm) in Environmental Samples. Environ. Sci. Technol. 2017, 51, 13641–13648. [Google Scholar] [CrossRef]
  40. Nel, H.A.; Chetwynd, A.J.; Kelleher, L.; Lynch, I.; Mansfield, I.; Margenat, H.; Onoja, S.; Goldberg Oppenheimer, P.; Sambrook Smith, G.H.; Krause, S. Detection limits are central to improve reporting standards when using Nile red for microplastic quantification. Chemosphere 2021, 263, 127953. [Google Scholar] [CrossRef]
  41. Campanale, C.; Savino, I.; Pojar, I.; Massarelli, C.; Uricchio, V.F. A Practical Overview of Methodologies for Sampling and Analysis of Microplastics in Riverine Environments. Sustainability 2020, 12, 6755. [Google Scholar] [CrossRef]
  42. Masura, J.; Baker, J.; Foster, G.; Arthur, C. Laboratory Methods for the Analysis of Microplastics in the Marine Environment: Recommendations for Quantifying Synthetic Particles in Waters and Sediments; NOAA Marine Debris Division, Report; NOAA: Washington, DC, USA, 2015. [CrossRef]
  43. Sebők-Nagy, K.; Biczók, L. Effect of hydrogen-bonding on the fluorescent properties of Nile Red and N-(4-pyridyl)-1,2-naphthalimide. Magy. Kem. F. Kem. Kozlemenyek 2004, 109–110, 29–33. [Google Scholar]
  44. Ikeda, A.; Abe, C.; Matsuura, W.; Hasegawa, Y. Development of Methanol Permselective FAU-Type Zeolite Membranes and Their Permeation and Separation Performances. Membranes 2021, 11, 627. [Google Scholar] [CrossRef]
  45. Ghobadi, E.; Marquardt, A.; Zirdehi, E.M.; Neuking, K.; Varnik, F.; Eggeler, G.; Steeb, H. The Influence of Water and Solvent Uptake on Functional Properties of Shape-Memory Polymers. Int. J. Polym. Sci. 2018, 2018, e7819353. [Google Scholar] [CrossRef]
  46. Konde, S.; Ornik, J.; Prume, J.A.; Taiber, J.; Koch, M. Exploring the potential of photoluminescence spectroscopy in combination with Nile Red staining for microplastic detection. Mar. Pollut. Bull. 2020, 159, 111475. [Google Scholar] [CrossRef] [PubMed]
  47. Burke, J. Solubility Parameters: Theory and Application. Available online: https://cool.culturalheritage.org/coolaic/sg/bpg/annual/v03/bp03-04.html (accessed on 8 October 2022).
  48. Surface Free Energy Components by Polar/Dispersion and Acid—Base Analyses; and Hansen Solubility Parameters for Various Polymers. Available online: https://www.accudynetest.com/polytable_02.html (accessed on 1 December 2023).
  49. (PDF) Reverse Shape Selectivity of Hexane Isomer in Ligand Inserted MOF-74. ResearchGate. Available online: https://www.researchgate.net/publication/342173219_Reverse_shape_selectivity_of_hexane_isomer_in_ligand_inserted_MOF-74 (accessed on 11 April 2025).
  50. Critical Surface Tension and Contact Angle with Water for Various Polymers (Sort by Contact Angle). Available online: https://www.accudynetest.com/polytable_03.html?sortby=contact_angle (accessed on 1 December 2023).
  51. Zedníček, T. What Is a Dielectric Constant of Plastic Materials? Passive Components Blog. Available online: https://passive-components.eu/what-is-dielectric-constant-of-plastic-materials/ (accessed on 1 December 2023).
  52. Min, K.; Cuiffi, J.D.; Mathers, R.T. Ranking environmental degradation trends of plastic marine debris based on physical properties and molecular structure. Nat. Commun. 2020, 11, 727. [Google Scholar] [CrossRef]
  53. Farnand, S.P. Using ΔE metrics for measuring color difference in hard copy pictorial images. In Proceedings of the Color Imaging VIII: Processing, Hardcopy, and Applications, SPIE. Santa Clara, CA, USA, 21–24 January 2003; pp. 109–118. [Google Scholar]
  54. Delta E ≤ 2 Color Accuracy. Available online: https://www.viewsonic.com/colorpro/articles/detail/deltae2color-accuracy_3 (accessed on 5 December 2023).
  55. Hoekstra, S. How Do You Measure Color Accuracy? Nix Sensor Ltd. Available online: https://www.nixsensor.com/blog/measure-color-accuracy/ (accessed on 5 December 2023).
  56. Best, J. Colour Design: Theories and Applications; Woodhead Publishing: Sawston, UK, 2017. [Google Scholar]
  57. Lin, J.; Yan, D.; Fu, J.; Chen, Y.; Ou, H. Ultraviolet-C and vacuum ultraviolet inducing surface degradation of microplastics. Water Res. 2020, 186, 116360. [Google Scholar] [CrossRef]
  58. Chaudhary, B.I.; Liotta, C.L.; Cogen, J.M.; Gilbert, M. Plasticized PVC. In Reference Module in Materials Science and Materials Engineering; Elsevier: Amsterdam, The Netherlands, 2016. [Google Scholar] [CrossRef]
  59. Ahmad, Z.; Ahmad, Z. Polymer Dielectric Materials; IntechOpen: London, UK, 2012. [Google Scholar] [CrossRef]
  60. Delocalization of Electrons. Chemistry LibreTexts. Available online: https://chem.libretexts.org/Bookshelves/Physical_and_Theoretical_Chemistry_Textbook_Maps/Supplemental_Modules_(Physical_and_Theoretical_Chemistry)/Chemical_Bonding/Valence_Bond_Theory/Delocalization_of_Electrons (accessed on 14 February 2024).
  61. Yasuda, T.; Okuno, T.; Yasuda, H. Contact Angle of Water on Polymer Surfaces. Langmuir 1994, 10, 2435–2439. [Google Scholar] [CrossRef]
  62. Van Melkebeke, M.; Janssen, C.; De Meester, S. Characteristics and Sinking Behavior of Typical Microplastics Including the Potential Effect of Biofouling: Implications for Remediation. Environ. Sci. Technol. 2020, 54, 8668–8680. [Google Scholar] [CrossRef]
  63. Rayssi, C.; El Kossi, S.; Dhahri, J.; Khirouni, K. Frequency and temperature-dependence of dielectric permittivity and electric modulus studies of the solid solution Ca0.85Er0.1Ti1−xCo4x/3O3 (0 ≤ x ≤ 0.1). RSC Adv. 2018, 8, 17139–17150. [Google Scholar] [CrossRef]
  64. Dielectric Properties. Available online: https://polymerdatabase.com/polymer%20physics/Permitivity.html (accessed on 8 October 2022).
  65. Dielectric Constant: Definition, Units, Formula, Plastic Values &Material List. Available online: https://omnexus.specialchem.com/polymer-properties/properties/dielectric-constant (accessed on 25 November 2022).
  66. La Mantia, F.P.; Schifani, R. Natural weathering of low density polyethylene: Part 2—Dielectric properties. Polym. Degrad. Stab. 1985, 10, 67–78. [Google Scholar] [CrossRef]
  67. Lakowicz, J.R. Topics in Fluorescence Spectroscopy: Principles; Springer Science & Business Media: Berlin/Heidelberg, Germany, 2006. [Google Scholar]
  68. Fotopoulou, K.N.; Karapanagioti, H.K. Degradation of Various Plastics in the Environment. In Hazardous Chemicals Associated with Plastics in the Marine Environment; Takada, H., Karapanagioti, H.K., Eds.; The Handbook of Environmental Chemistry; Springer International Publishing: Cham, Switzerland, 2019; pp. 71–92. [Google Scholar] [CrossRef]
  69. Meyers, N.; Catarino, A.I.; Declercq, A.M.; Brenan, A.; Devriese, L.; Vandegehuchte, M.; De Witte, B.; Janssen, C.; Everaert, G. Microplastic detection and identification by Nile red staining: Towards a semi-automated, cost- and time-effective technique. Sci. Total Environ. 2022, 823, 153441. [Google Scholar] [CrossRef]
  70. Prasad, S.; Bennett, A.; Triantafyllou, M. Characterization of Nile Red-Stained Microplastics through Fluorescence Spectroscopy. J. Mar. Sci. Eng. 2024, 12, 1403. [Google Scholar] [CrossRef]
  71. Fang, C.; Luo, Y.; Naidu, R. Microplastics and nanoplastics analysis: Options, imaging, advancements and challenges. TrAC Trends Anal. Chem. 2023, 166, 117158. [Google Scholar] [CrossRef]
Figure 1. (a) NR-stained MPs in different carrier solvents—Hex, Chl, Ac, Met, Eth, Ac/Hex, Ac/Eth, Ac/W (MPs arranged clockwise, starting from the top right of the white line: PP, HDPE, LDPE, PS, PC, ABS, PVC, PET, PA); (b) Fluorescence intensity (FI—%) of NR-stained MPs (a) in different solvents. Dotted line indicates the average FI (%) across all MPs of the carrier solvent; (c) HSV color representation of NR-stained MPs in (a) arranged by polarity. A cross symbol (x) was used to signify any degradation by the solvent (HSV values found in Table S1).
Colorants 04 00020 g001
Figure 2. TEAs graph illustrates solvent class and its polymer solubility windows. Solubility windows are indicated in color shaded circles (blue—alcohols, yellow—ketones, red—amines, gray- aliphatic, green—chlorine, purple—aromatics, pink—esters), solvents are represented by the lettered circles (Ac, Chl, Hex, Met, Eth, W, Ac/W, Ac/Eth, Ac/Hex), and plastics are represented in numbered squares (1—PE, 2—PP, 3—PS, 4—ABS, 5—PC, 6—PVC, 7—PET, and 8—PA).
Colorants 04 00020 g002
Figure 3. (a) Ac/W mixture of 10–70% for EPS, PS, PC, ABS, PVC, and PET (topmost (clockwise): 10, 20, 30, 40, 50, 60, 70% Ac/W mix). (b) Comparison of the deviation of dominant hues (°) of EPS (dark blue), PS (orange), PC (gray), ABS (yellow), PVC (blue), and PET (green) across Ac/W mixture of 10–70%. Points below the horizontal axis reflect hue values below 360°, whereas any values above indicate values greater than 0°.
Colorants 04 00020 g003
Figure 4. (a): A total of 10 MPs stained with NR [10 µg/mL] dissolved in Ac/W mixture of 25% at 70 °C for 30 min, captured at absolute exposure value of EV 1 ± 1 and luminous exposure value of 4.5 lx.s. (from top, clockwise—1. PP, 2. HDPE, 3. LDPE, 4. EPS & PS, 5. PC, 6. ABS, 7. PVC, 8. PET, 9. PA); (b) Simplified two-dimensional HSV color wheel (Hue (360°) and Saturation (radial axis—%) without Value projections) of NR-stained MPs labeled in (a). As the polarity of MPs increases, the Hue of the MPs is red-shifted counter-clockwise. Plastics with higher saturation (%)appear further away from the center of the color wheel (from rightmost, anti-clockwise—1. PP, 2. HDPE, 3. LDPE, 4. EPS & PS, 5. PC, 6. ABS, 7. PVC, 8. PET, 9. PA).
Colorants 04 00020 g004
Figure 5. (a) Fluorescence imaging of 10 MPs (PP, HDPE, LDPE, EPS, PS, PC, ABS, PVC, PET, and PA) excited at 310 nm across five optical filters conditions (none, green, yellow, orange, and red) in color and greyscale. (b) Fluorescence intensity of greyscale values (%) of MPs across the filter conditions in (a).
Colorants 04 00020 g005
Table 1. Measure of polarity: water contact angle (WCA), dielectric constant (DE), and partitioning coefficient (log Kow) with increasing degrees of polarity.
WCA [50]DE [51]log Kow [52]
PP (102.1°)PP (2.3)PP (23.7)
PE (96.0°)PE (2.3)PE (23.6)
PS (87.4°)PS (2.55)PS (22.9)
PVC (85.6°)ABS (2.95)-
PC (82.0°)PC (3.3)PC (21.3)
ABS (80. 9°)PVC (3.55)PVC (16.2)
PET (72.5°)PET (3.5)PET (8.1)
PA (68.3°)PA (4.5)PA (4.5)
Table 2. Comparison of ∆E between MPs investigated.
∆E of MPs PPHDPELDPEEPSPSPCABSPVCPETPA
PP 17.337.757.661.274.290.390.188.191.8
HDPE 29.546.651.763.880.480.774.982.4
LDPE 20.524.237.155.556.555.259.2
EPS 10.118.839.742.138.345.5
PS 13.332.234.035.537.5
PC 22.025.426.629.5
ABS 5.422.19.5
PVC 24.34.7
PET 24.7
PA
Grey (∆E: 0) No color difference, as it is compared with the same material. Red (∆E: 3–6) = Noticeable differences in color. Orange (∆E: 6–10) = Moderate color differences that are readily noticeable by most people. No color (∆E > 10) = Substantial differences and considered easily distinguishable.
Disclaimer/Publisher’s Note: The statements, opinions and data contained in all publications are solely those of the individual author(s) and contributor(s) and not of MDPI and/or the editor(s). MDPI and/or the editor(s) disclaim responsibility for any injury to people or property resulting from any ideas, methods, instructions or products referred to in the content.

