
Assessment of the Effect of Zn Co-Doping on Fe/TiO2 Supports in the Preparation of Catalysts by Wet Impregnation for Photodegradation Reactions of Food Coloring Effluents

 ,
,  ,
,  ,
,  , , and
Abstract
1. Introduction
2. Materials and Methods
2.1. Materials
2.2. Synthesis and Preparation of Zn/Fe/TiO2 Catalysts
2.3. Characterization of Zn/Fe/TiO2 Catalysts
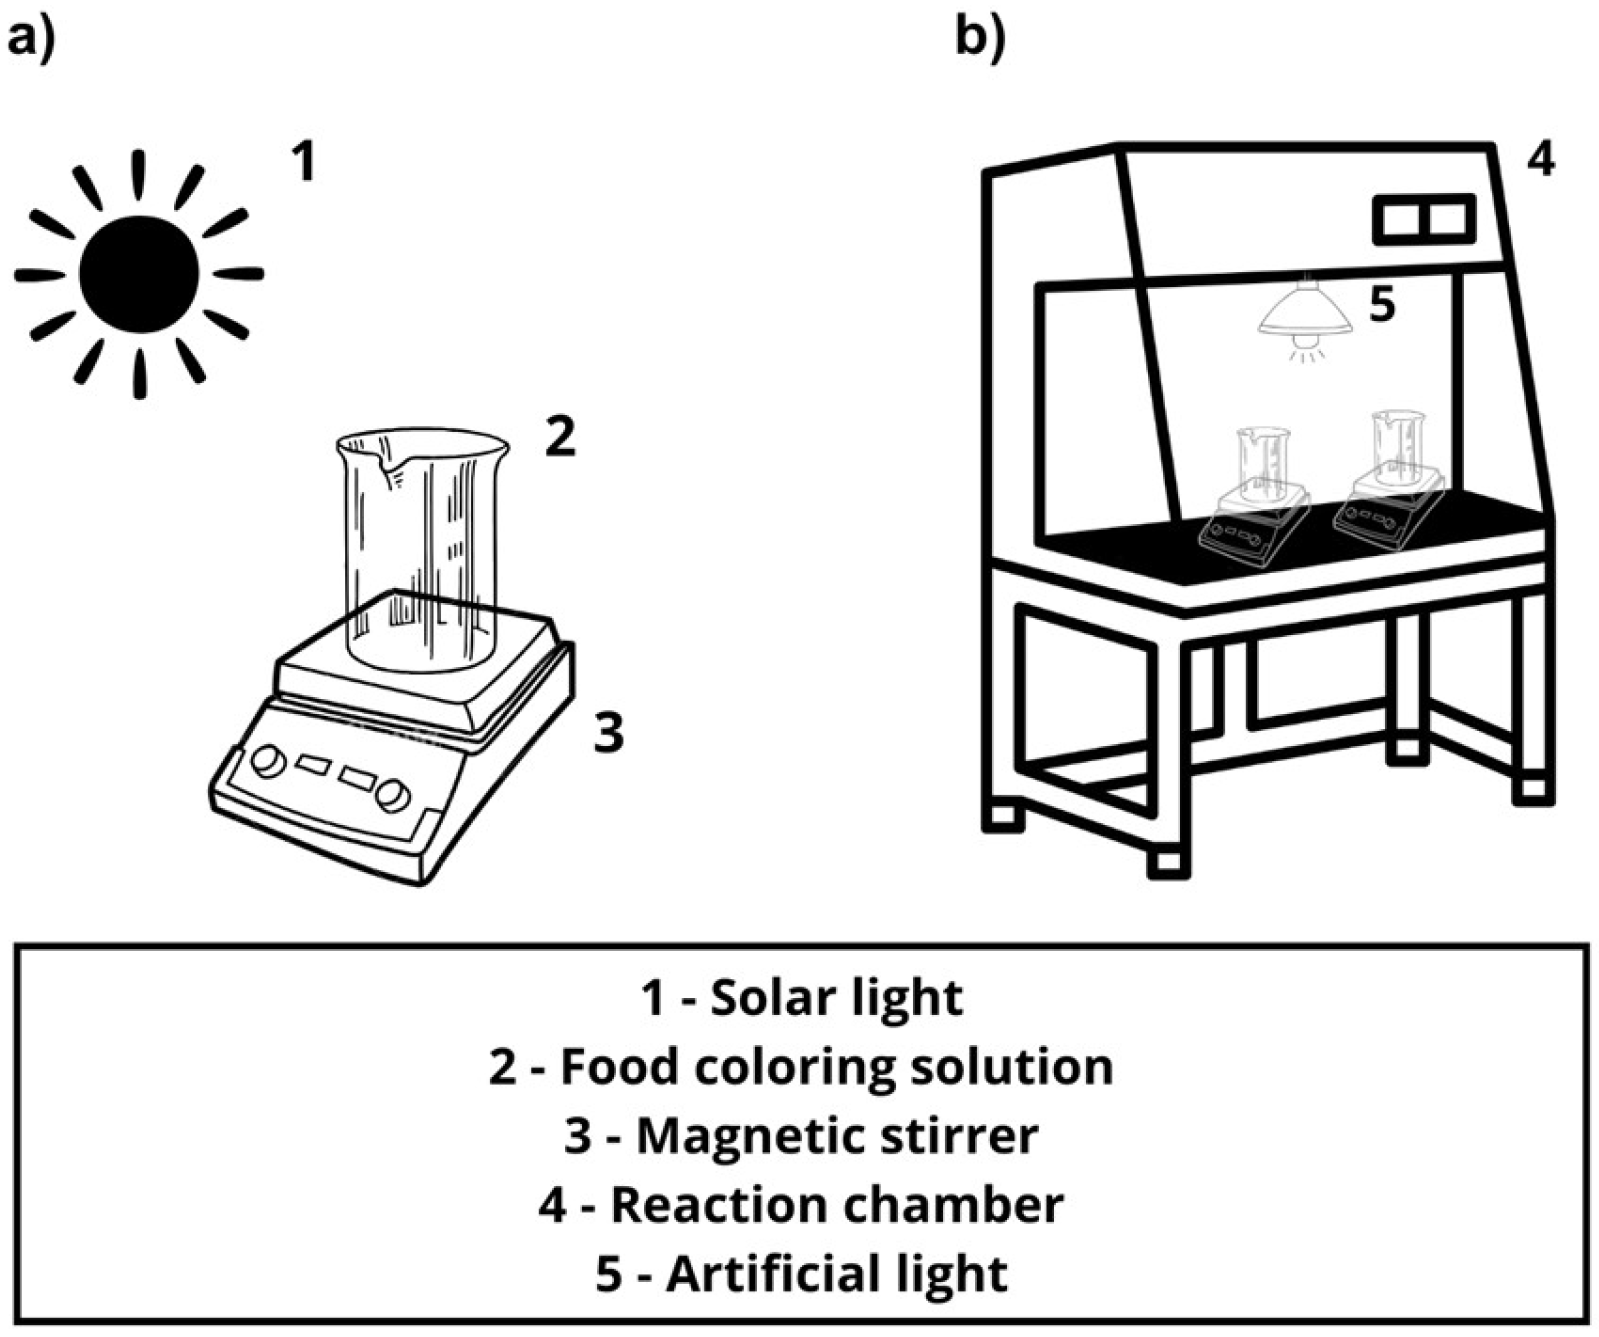
2.4. Photocatalytic Assay
2.5. Photodiscoloration Kinetics
2.6. Photodegradation Assessment
2.7. Catalyst Reusability Test
2.8. Statistical Analysis
3. Results and Discussion
3.1. Catalyst Characterization
3.2. Photocatalytic Tests
3.2.1. Adsorption and Photolysis Tests
3.2.2. Food Coloring Photodiscoloration Under Sunlight
3.2.3. Kinetic Modeling of Photodiscoloration Process Under Sunlight
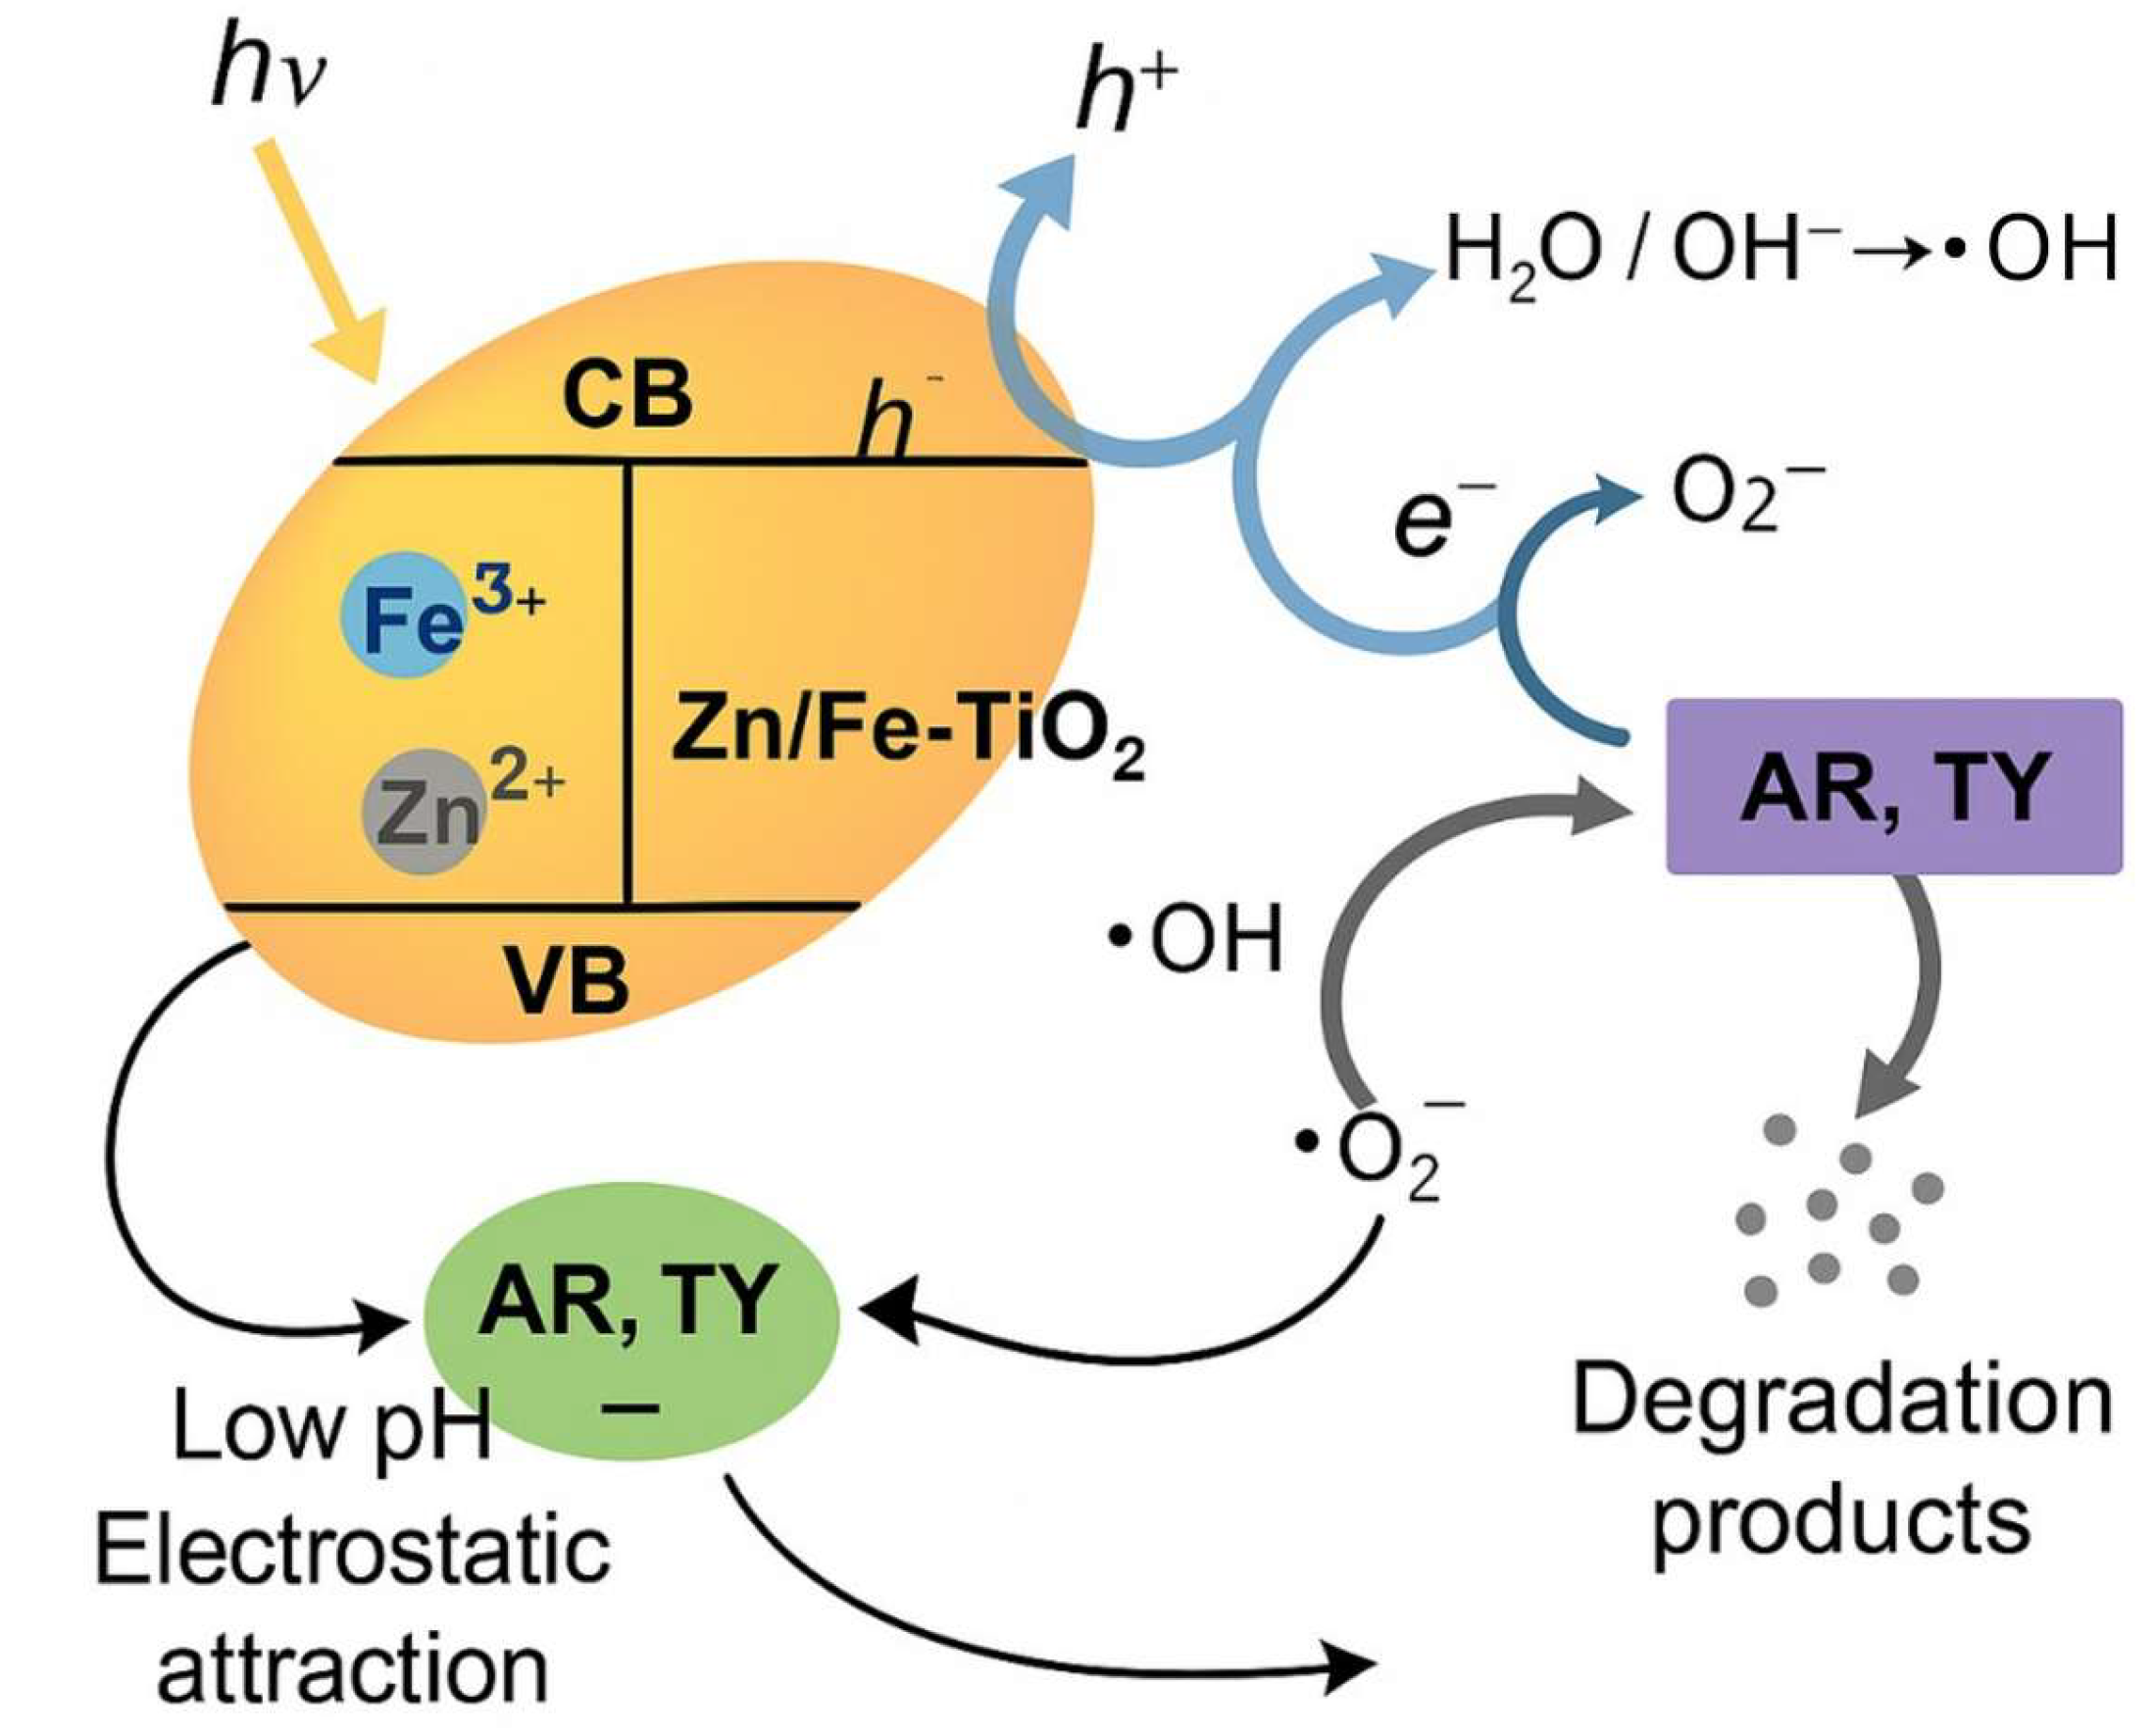
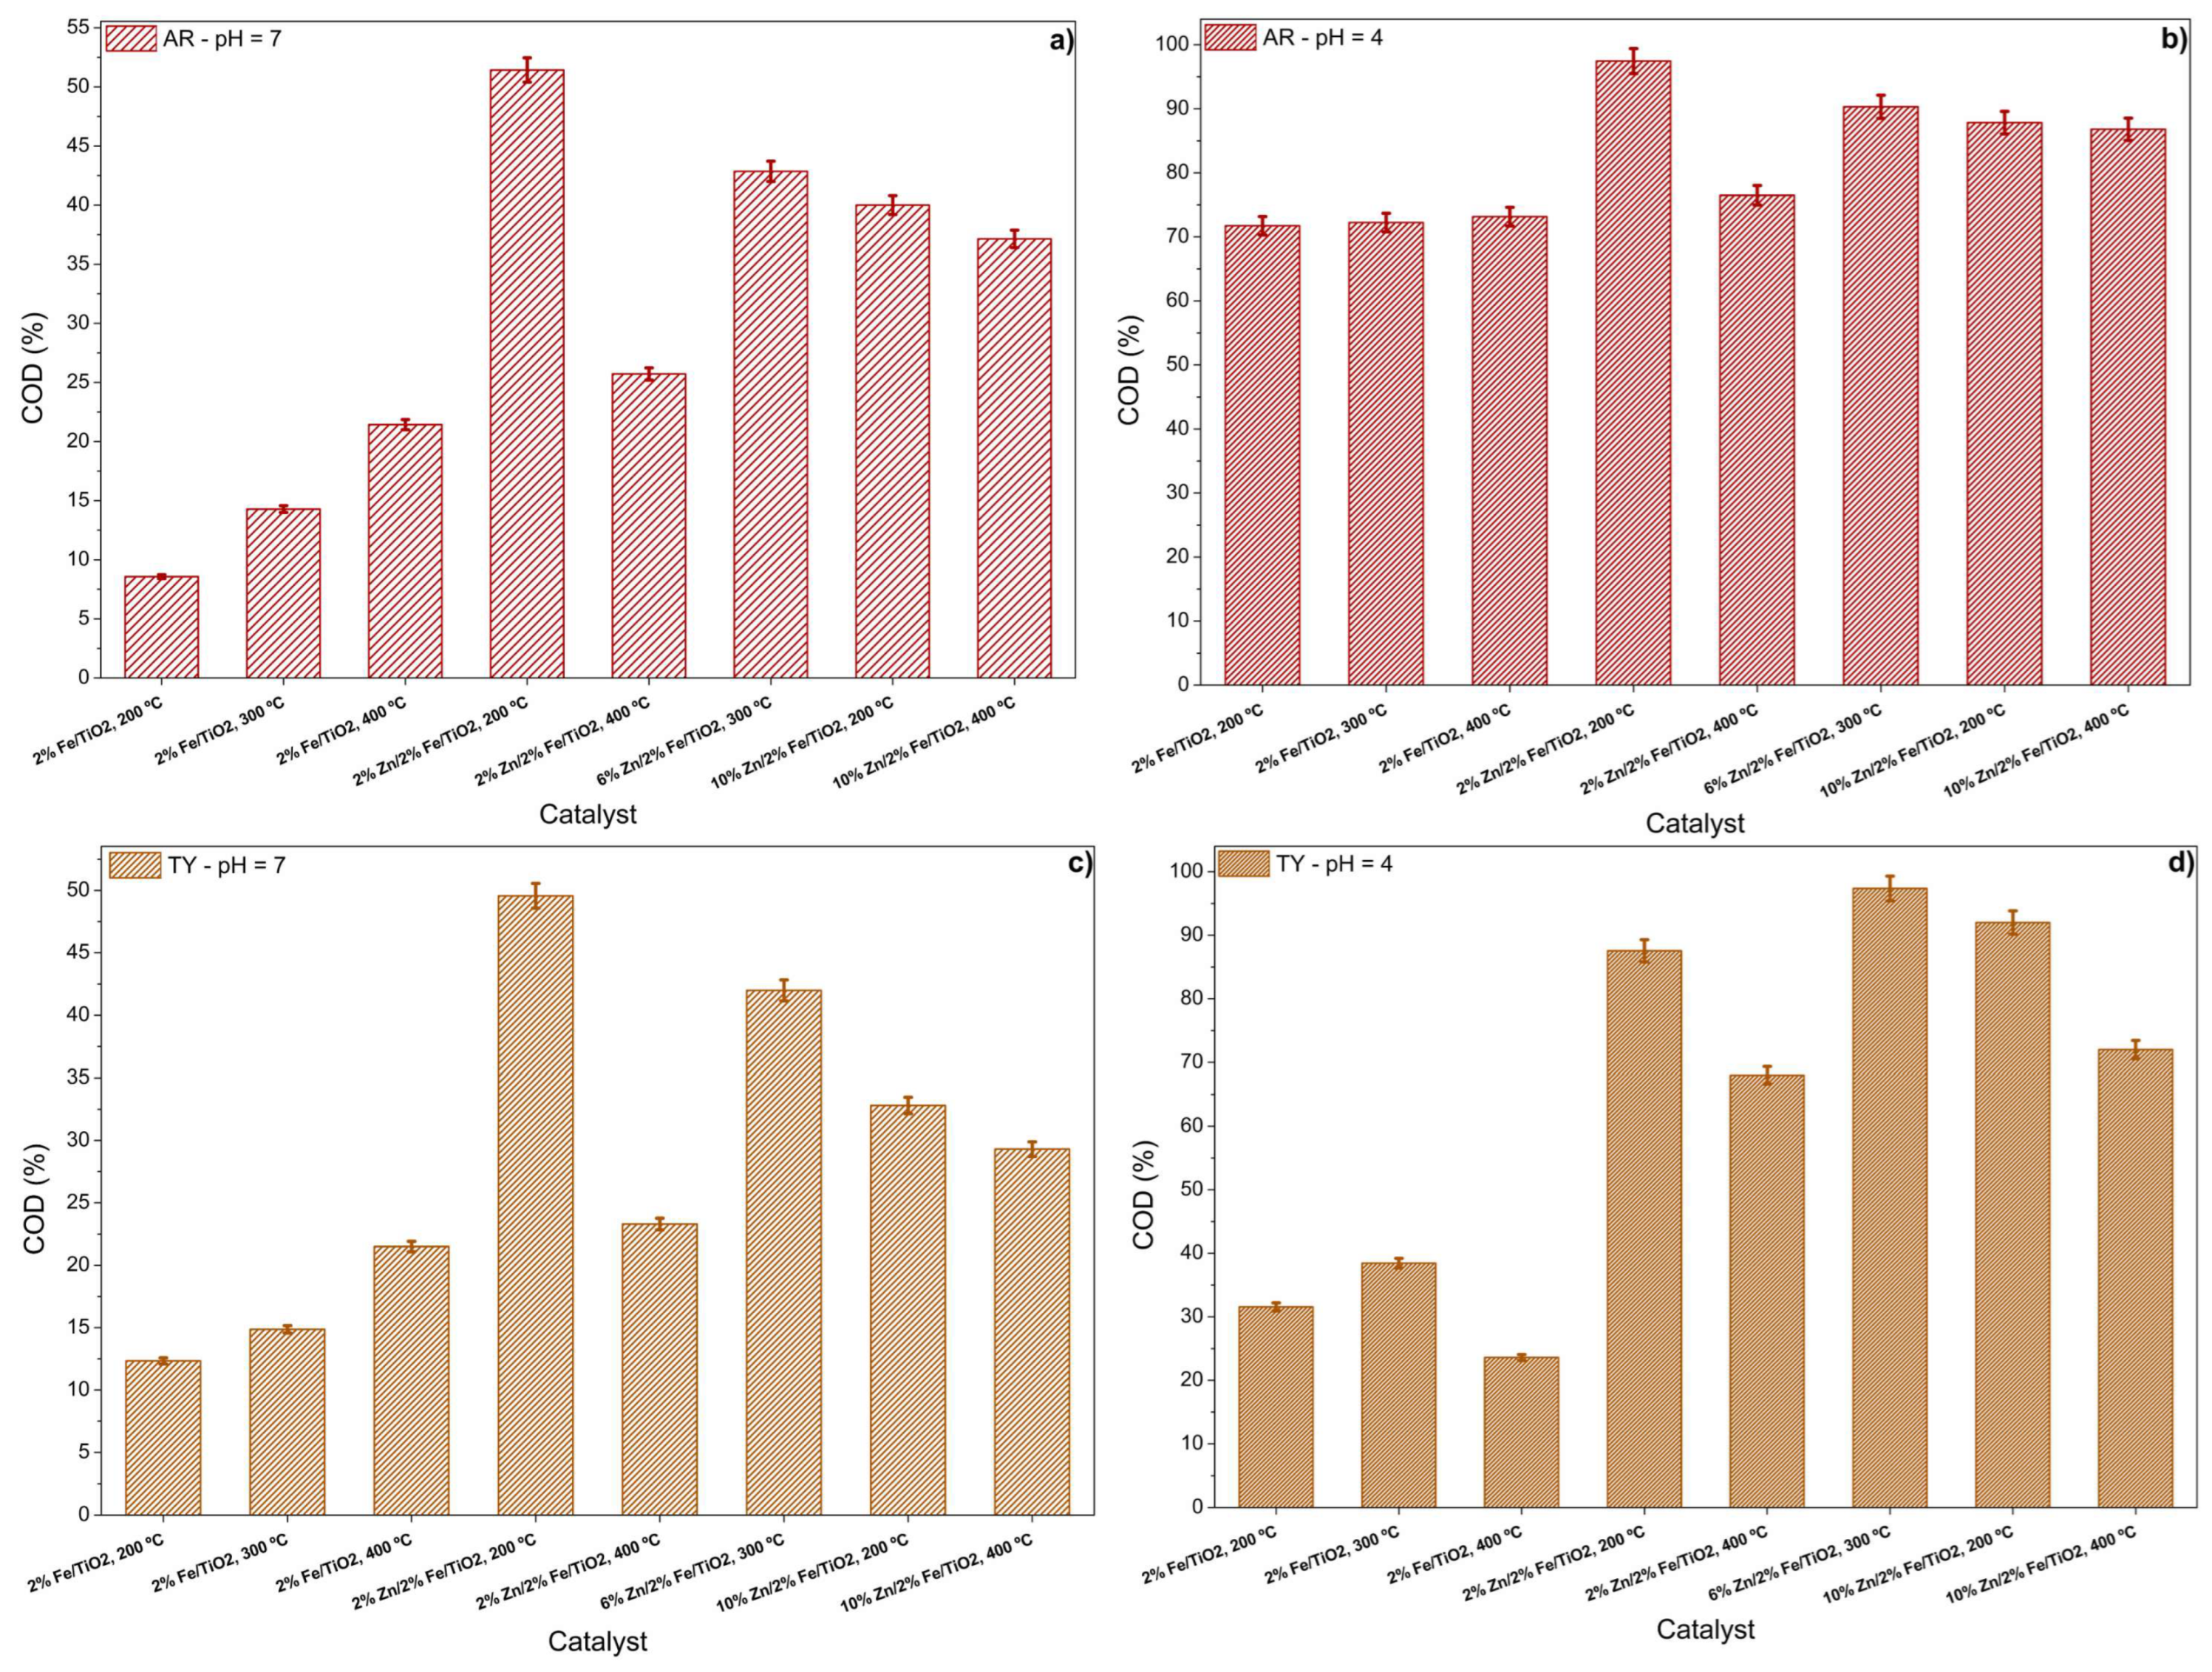
3.2.4. Food Coloring Photodegradation Assessment
3.2.5. Catalyst Reusability Assessment
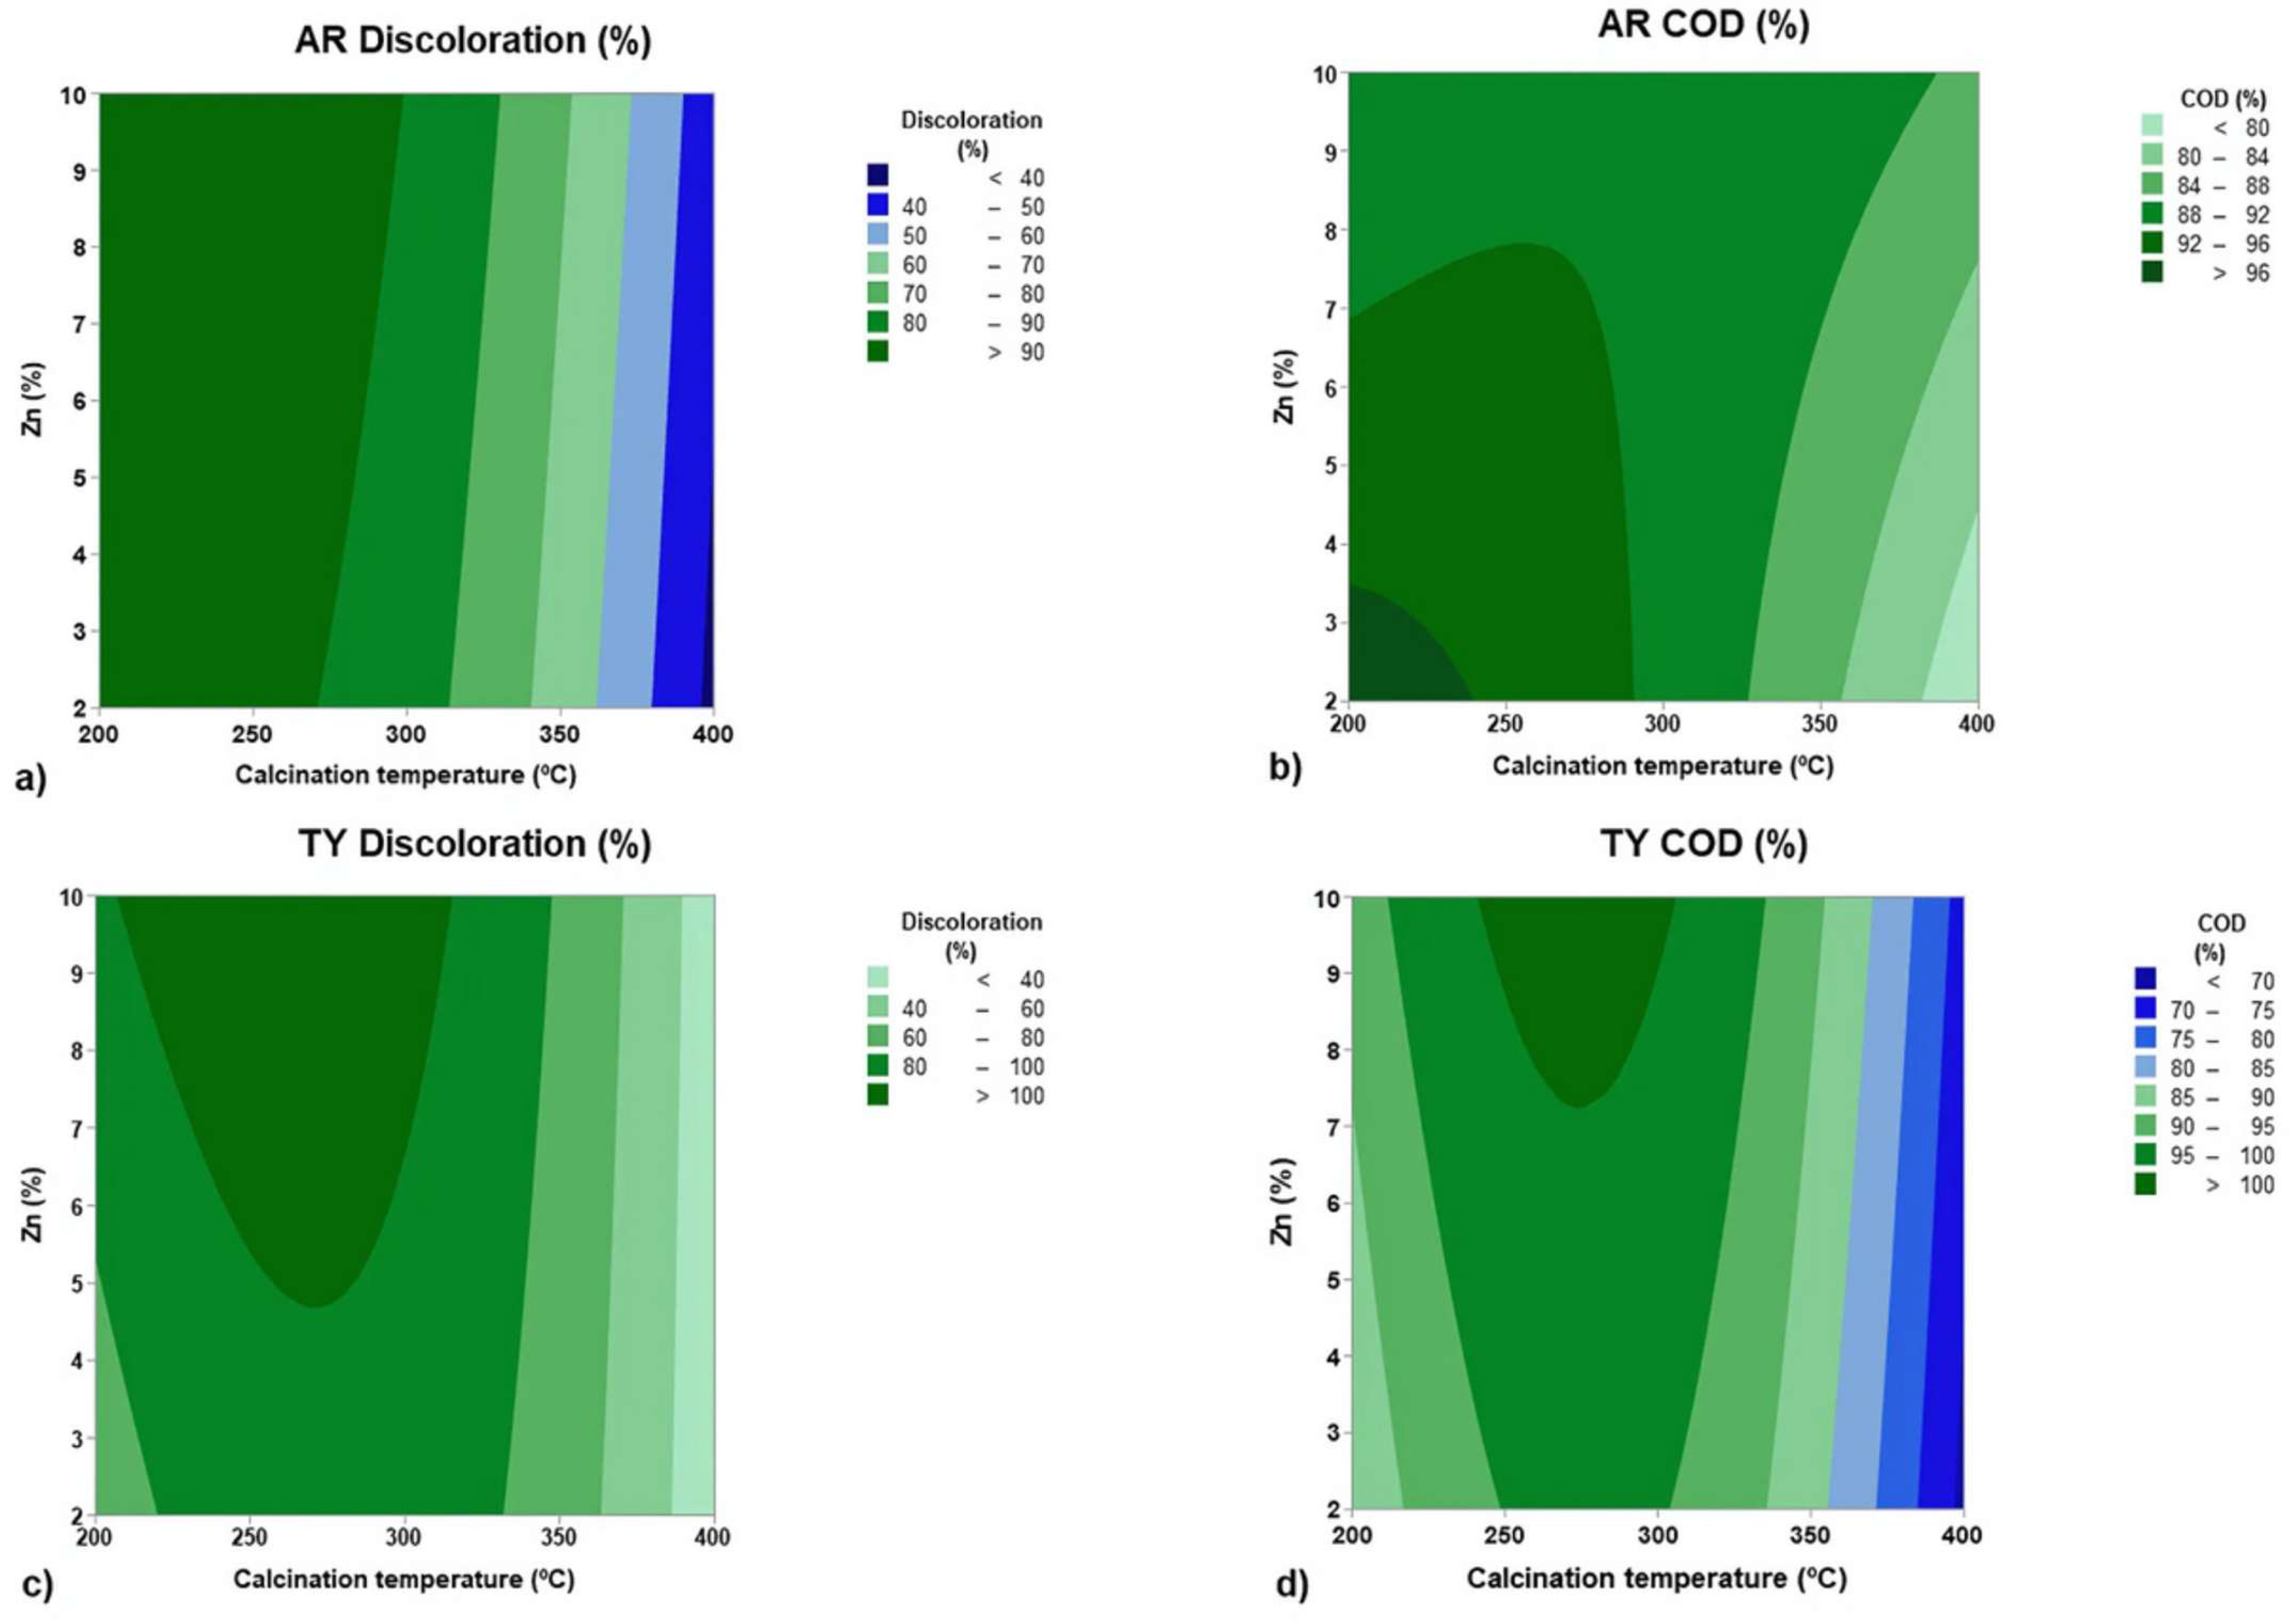
3.3. Statistical Analysis and Optimization
- AR discoloration: T = 236 °C, Zn % = 10, with 97.9% discoloration;
- AR COD reduction: T = 200 °C, Zn % = 2, with 97.8% COD reduction;
- TY discoloration: T = 261 °C, Zn % = 10, with 100% discoloration;
- TY COD reduction: T = 273 °C, Zn % = 10, with 100% COD reduction.
4. Conclusions
Author Contributions
Funding
Institutional Review Board Statement
Informed Consent Statement
Data Availability Statement
Conflicts of Interest
References
- Amchova, P.; Siska, F.; Ruda-Kucerova, J. Food Safety and Health Concerns of Synthetic Food Colors: An Update. Toxics 2024, 12, 466. [Google Scholar] [CrossRef] [PubMed]
- Nippes, R.P.; Macruz, P.D.; Molina, L.C.A.; Scaliante, M.H.N.O. Solar-Fenton Heterogeneous for Removal of Tartrazine Yellow Dye Using Zeolite Y-Fe as Catalyst. Int. J. Environ. Sci. Technol. 2024, 21, 3675–3688. [Google Scholar] [CrossRef]
- El Messaoudi, N.; Miyah, Y.; Singh, N.; Gubernat, S.; Fatima, R.; Georgin, J.; El Mouden, A.; Saghir, S.; Knani, S.; Hwang, Y. A Critical Review of Allura Red Removal from Water: Advancements in Adsorption and Photocatalytic Degradation Technologies, and Future Perspectives. J. Environ. Chem. Eng. 2024, 12, 114843. [Google Scholar] [CrossRef]
- Alegbe, E.O.; Uthman, T.O. A Review of History, Properties, Classification, Applications and Challenges of Natural and Synthetic Dyes. Heliyon 2024, 10, e33646. [Google Scholar] [CrossRef]
- Castro, T.A.; Leite, B.S.; Assunção, L.S.; de Jesus Freitas, T.; Colauto, N.B.; Linde, G.A.; Otero, D.M.; Machado, B.A.S.; Ferreira Ribeiro, C.D. Red Tomato Products as an Alternative to Reduce Synthetic Dyes in the Food Industry: A Review. Molecules 2021, 26, 7125. [Google Scholar] [CrossRef]
- Castro, L.E.N.; Meira, A.H.; Almeida, L.N.B.; Lenzi, G.G.; Colpini, L.M.S. Experimental Design and Optimization of Textile Dye Photodiscoloration Using Zn/TiO2 Catalysts. Desalination Water Treat. 2022, 266, 173–185. [Google Scholar] [CrossRef]
- de Castro, L.E.N.; Meurer, E.C.; Alves, H.J.; dos Santos, M.A.R.; de Castro Vasques, E.; Colpini, L.M.S. Photocatalytic Degradation of Textile Dye Orange-122 Via Electrospray Mass Spectrometry. Braz. Arch. Biol. Technol. 2020, 63, e20180573. [Google Scholar] [CrossRef]
- Castro, L.E.N.; Matheus, L.R.; Albuquerque, L.J.C.; Gasparini, L.J.; Fagnani, K.C.; Alves, H.J.; Colpini, L.M.S. Production of Nanostructured Crystalline Composite Using Residual Ashes from Flocculated Sludge Burning Process in a Poultry Slaughterhouse Wastewater Treatment System. Cerâmica 2022, 68, 427–440. [Google Scholar] [CrossRef]
- Fagnani, K.C.; Alves, H.J.; de Castro, L.E.N.; Kunh, S.S.; Colpini, L.M.S. An Alternative for the Energetic Exploitation of Sludge Generated in the Physico-Chemical Effluent Treatment from Poultry Slaughter and Processing in Brazilian Industries. J. Environ. Chem. Eng. 2019, 7, 102996. [Google Scholar] [CrossRef]
- de Castro, L.E.N.; Battocchio, D.A.J.; Ribeiro, L.F.; Colpini, L.M.S. Development of Adsorbent Materials Using Residue from Coffee Industry and Application in Food Dye Adsorption Processes. Braz. Arch. Biol. Technol. 2023, 66, e23210125. [Google Scholar] [CrossRef]
- Castro, L.E.N.; Mançano, R.R.; Battocchio, D.A.J.; Colpini, L.M.S. Adsorption of Food Dye Using Activated Carbon from Brewers’ Spent Grains. Acta Scientiarum. Technol. 2022, 45, e60443. [Google Scholar] [CrossRef]
- Su, R.; Zhu, Y.; Gao, B.; Li, Q. Progress on Mechanism and Efficacy of Heterogeneous Photocatalysis Coupled Oxidant Activation as an Advanced Oxidation Process for Water Decontamination. Water Res. 2024, 251, 121119. [Google Scholar] [CrossRef]
- Iyyappan, J.; Gaddala, B.; Gnanasekaran, R.; Gopinath, M.; Yuvaraj, D.; Kumar, V. Critical Review on Wastewater Treatment Using Photo Catalytic Advanced Oxidation Process: Role of Photocatalytic Materials, Reactor Design and Kinetics. Case Stud. Chem. Environ. Eng. 2024, 9, 100599. [Google Scholar] [CrossRef]
- Eghbali, P.; Hassani, A.; Wacławek, S.; Andrew Lin, K.-Y.; Sayyar, Z.; Ghanbari, F. Recent Advances in Design and Engineering of MXene-Based Catalysts for Photocatalysis and Persulfate-Based Advanced Oxidation Processes: A State-of-the-Art Review. Chem. Eng. J. 2024, 480, 147920. [Google Scholar] [CrossRef]
- Tanos, F.; Razzouk, A.; Lesage, G.; Cretin, M.; Bechelany, M. A Comprehensive Review on Modification of Titanium Dioxide-Based Catalysts in Advanced Oxidation Processes for Water Treatment. ChemSusChem 2024, 17, e202301139. [Google Scholar] [CrossRef]
- Khader, E.H.; Muslim, S.A.; Saady, N.M.C.; Ali, N.S.; Salih, I.K.; Mohammed, T.J.; Albayati, T.M.; Zendehboudi, S. Recent Advances in Photocatalytic Advanced Oxidation Processes for Organic Compound Degradation: A Review. Desalination Water Treat. 2024, 318, 100384. [Google Scholar] [CrossRef]
- Thaha, S.K.S.M.; Pugazhenthiran, N.; Sathishkumar, P.; Govinda raj, M.; Perarasu, V.T.; Kumaresan, R.; Assiri, M.A.; Selvaraj, M. Peroxymonosulphate Activation by Ultra-Small Ni@NiFe2O4/ZnO Magnetic Nanocomposites for Solar Photocatalytic Degradation of β-Lactam Antibiotic-Cefadroxil. Ceram. Int. 2024, 50, 36050–36061. [Google Scholar] [CrossRef]
- Verma, A.; Priyadarshini, U.; Remya, N. Solar Photocatalytic Degradation of Ciprofloxacin Using Biochar Supported Zinc Oxide- Tungsten Oxide Photocatalyst. Environ. Sci. Pollut. Res. 2024, 32, 9412–9428. [Google Scholar] [CrossRef] [PubMed]
- Lanjwani, M.F.; Tuzen, M.; Khuhawar, M.Y.; Saleh, T.A. Trends in Photocatalytic Degradation of Organic Dye Pollutants Using Nanoparticles: A Review. Inorg. Chem. Commun. 2024, 159, 111613. [Google Scholar] [CrossRef]
- Kuruva, H.; Khavala, V.B.; Mishra, B.R.; Murugan, K.; Thomas, T.; Murty, B.S. Solar-Photocatalytic Treatment of Industrial Wastewater Using Mechanically Doped CNS-TiO2 and Synergistic TiO2 Incorporation: A Promising Cost-Effective Approach for Industrial Wastewater Treatment. Mater. Res. Bull. 2024, 177, 112825. [Google Scholar] [CrossRef]
- Wu, Y.; Zhou, W.; Dong, Z.; Wu, Y.; Liu, J.; Huang, J.; Zheng, Z.; Zhang, Z.; Xu, L.; Cao, X.; et al. Tuning the Heterostructure of Zn–Fe–O Nanoparticles for Highly Efficient Photocatalytic Removal of U(vi) under Different Light Intensities. Environ. Sci. Nano 2024, 11, 3346–3358. [Google Scholar] [CrossRef]
- Hemanathan, G.; Karthikeyan, S.; Kathirvel, R. Comparative Study on Solar Photocatalytic Degradation of Naproxen Using Nitrogen Doped ZnO and Nitrogen Doped TiO2: Kinetics and Intermediates Analysis. Desalination Water Treat. 2024, 320, 100675. [Google Scholar] [CrossRef]
- Sukhadeve, G.K.; Gedam, R.S. Visible Light Assisted Photocatalytic Degradation of Mixture of Reactive Ternary Dye Solution by Zn–Fe Co-Doped TiO2 Nanoparticles. Chemosphere 2023, 341, 139990. [Google Scholar] [CrossRef] [PubMed]
- Castro-Rojas, J.; Rao, M.A.; Berruti, I.; Mora, M.L.; Garrido-Ramírez, E.; Polo-López, M.I. Assessment of Solar Photocatalytic Wastewater Disinfection and Microcontaminants Removal by Modified-Allophane Nanoclays Based on TiO2, Fe and ZnO at Laboratory and Pilot Scale. Chem. Eng. J. 2025, 503, 157894. [Google Scholar] [CrossRef]
- Yuliasari, N.; Wijaya, A.; Mohadi, R.; Elfita, E.; Lesbani, A. Photocatalytic Degradation of Malachite Green by Layered Double Hydroxide Based Composites. Bull. Chem. React. Eng. Catal. 2022, 17, 240–249. [Google Scholar] [CrossRef]
- Ali, F.; Moin-ud-Din, G.; Iqbal, M.; Nazir, A.; Altaf, I.; Alwadai, N.; Siddiqua, U.H.; Younas, U.; Ali, A.; Kausar, A.; et al. Ag and Zn Doped TiO2 Nano-Catalyst Synthesis via a Facile Green Route and Their Catalytic Activity for the Remediation of Dyes. J. Mater. Res. Technol. 2023, 23, 3626–3637. [Google Scholar] [CrossRef]
- Kirk, R.E.; Othmer, D.F. Encyclopedia of Chemical Technology; Wiley: Hoboken, NJ, USA, 2005; ISBN 9780471485087. [Google Scholar]
- Muhammad, W.; Khan, A.; Hussain, S.; Khan, H.; Abumousa, R.A.; Bououdina, M.; Khan, I.; Iqbal, S.; Humayun, M. Enhanced Light Absorption and Charge Carrier’s Separation in g-C3N4-Based Double Z-Scheme Heterostructure Photocatalyst for Efficient Degradation of Navy-Blue Dye. Green Chem. Lett. Rev. 2024, 17, 2381591. [Google Scholar] [CrossRef]
- Li, Y.; Cheng, H. Chemical Kinetic Modeling of Organic Pollutant Degradation in Fenton and Solar Photo-Fenton Processes. J. Taiwan Inst. Chem. Eng. 2021, 123, 175–184. [Google Scholar] [CrossRef]
- Rice, E.W.; Baird, R.B.; Eaton, A.D.; Clesceri, L.S.; Association, A.P.H.; Association, A.W.W.; Federation, W.E. Standard Methods for Examination of Water and Wastewater 2012; American Public Health Association: Washington, DC, USA, 2012; ISBN 9780875530130. [Google Scholar]
- ALOthman, Z. A Review: Fundamental Aspects of Silicate Mesoporous Materials. Materials 2012, 5, 2874–2902. [Google Scholar] [CrossRef]
- Bingel, L.W.; Walton, K.S. Surprising Use of the Business Innovation Bass Diffusion Model to Accurately Describe Adsorption Isotherm Types I, III, and V. Langmuir 2023, 39, 4475–4482. [Google Scholar] [CrossRef]
- Castro, L.E.N.; Santos, J.V.F.; Fagnani, K.C.; Alves, H.J.; Colpini, L.M.S. Evaluation of the Effect of Different Treatment Methods on Sugarcane Vinasse Remediation. J. Environ. Sci. Health B 2019, 54, 791–800. [Google Scholar] [CrossRef] [PubMed]
- Colpini, L.M.S.; Lenzi, G.G.; Urio, M.B.; Kochepka, D.M.; Alves, H.J. Photodiscoloration of Textile Reactive Dyes on Ni/TiO2 Prepared by the Impregnation Method: Effect of Calcination Temperature. J. Environ. Chem. Eng. 2014, 2, 2365–2371. [Google Scholar] [CrossRef]
- Colpini, L.M.S.; Lenzi, G.G.; de Souza, R.C.T.; Urio, M.B.; Kochepka, D.M.; Santos, M.A.R.; Vasques, E.C.; Alves, H.J. Photodiscoloration Processes of Dyes Reactive Using Radiation and Fe/TiO2. Int. J. Mater. Eng. Technol. 2017, 15, 189–204. [Google Scholar] [CrossRef]
- Lenzi, G.G.; Evangelista, R.F.; Duarte, E.R.; Colpini, L.M.S.; Fornari, A.C.; Menechini Neto, R.; Jorge, L.M.M.; Santos, O.A.A. Photocatalytic Degradation of Textile Reactive Dye Using Artificial Neural Network Modeling Approach. Desalination Water Treat. 2015, 57, 14132–14144. [Google Scholar] [CrossRef]
- Deshmane, V.G.; Owen, S.L.; Abrokwah, R.Y.; Kuila, D. Mesoporous Nanocrystalline TiO2 Supported Metal (Cu, Co, Ni, Pd, Zn, and Sn) Catalysts: Effect of Metal-Support Interactions on Steam Reforming of Methanol. J. Mol. Catal. A Chem. 2015, 408, 202–213. [Google Scholar] [CrossRef]
- Deng, J.; Wang, M.; Fang, J.; Song, X.; Yang, Z.; Yuan, Z. Synthesis of Zn-Doped TiO2 Nano-Particles Using Metal Ti and Zn as Raw Materials and Application in Quantum Dot Sensitized Solar Cells. J. Alloys Compd. 2019, 791, 371–379. [Google Scholar] [CrossRef]
- Nair, R.G.; Mazumdar, S.; Modak, B.; Bapat, R.; Ayyub, P.; Bhattacharyya, K. The Role of Surface O-Vacancies in the Photocatalytic Oxidation of Methylene Blue by Zn-Doped TiO2: A Mechanistic Approach. J. Photochem. Photobiol. A Chem. 2017, 345, 36–53. [Google Scholar] [CrossRef]
- Zhang, Y.-H.; Chan, C.K.; Porter, J.F.; Guo, W. Micro-Raman Spectroscopic Characterization of Nanosized TiO2 Powders Prepared by Vapor Hydrolysis. J. Mater. Res. 1998, 13, 2602–2609. [Google Scholar] [CrossRef]
- Castro, L.E.N.; Matheus, L.R.; Sganzerla, W.G.; Colpini, L.M.S. Valorization of Residual Ashes from Boiler Combustion Process into Activated Carbon for Adsorption of Food Industry Wastewater. Int. J. Environ. Sci. Technol. 2024, 22, 5341–5362. [Google Scholar] [CrossRef]
- Chen, Y.; Cui, K.; Liu, T.; Cui, M.; Ding, Y.; Chen, Y.; Chen, X.; Li, W.-W.; Li, C.-X. Enhanced Degradation of Sulfamethoxazole by Non-Radical-Dominated Peroxymonosulfate Activation with Co/Zn Co-Doped Carbonaceous Catalyst: Synergy between Co and Zn. Sci. Total Environ. 2022, 850, 158055. [Google Scholar] [CrossRef]
- Li, S.; Li, A.; Krishnamoorthy, S.; Iglesia, E. Effects of Zn, Cu, and K Promoters on the Structure and on the Reduction, Carburization, and Catalytic Behavior of Iron-Based Fischer–Tropsch Synthesis Catalysts. Catal Lett. 2001, 77, 197–205. [Google Scholar] [CrossRef]
- Lin, C.-Y.; Tseng, S.-L. Heterogeneous Catalyst Characteristics of TiO2 Nanoparticles Impregnated with Alkaline CH3ONa for Use in Transesterification Process. Processes 2024, 12, 1584. [Google Scholar] [CrossRef]
- Valarmathy, C.; Sudhaparimala, S. Photodiscoloration of Malachite Green Dye Using Nitrogen Self-Doped Graphene Oxide from Moringa Oleifera Leaves. J. Water Environ. Nanotechnol. 2025, 10, 71–84. [Google Scholar] [CrossRef]
- Imessaoudene, A.; Mechraoui, O.; Aberkane, B.; Benabbas, A.; Manseri, A.; Moussaoui, Y.; Bollinger, J.-C.; Amrane, A.; Zoukel, A.; Mouni, L. Synthesis of a TiO2/Zeolite Composite: Evaluation of Adsorption-Photodegradation Synergy for the Removal of Malachite Green. Nano-Struct. Nano-Objects 2024, 38, 101191. [Google Scholar] [CrossRef]
- Modirshahla, N.; Abdoli, M.; Behnajady, M.; Vahid, B. Decolourization of Tartrazine from Aqueous Solutions by Coupling Electrocoagulation with ZnO Photocatalyst. Environ. Prot. Eng. 2013, 39, 59–73. [Google Scholar] [CrossRef]
- Gupta, V.K.; Jain, R.; Nayak, A.; Agarwal, S.; Shrivastava, M. Removal of the Hazardous Dye—Tartrazine by Photodegradation on Titanium Dioxide Surface. Mater. Sci. Eng. C 2011, 31, 1062–1067. [Google Scholar] [CrossRef]


| Experiment | Codified Variables | Non-Codified Variables | ||
|---|---|---|---|---|
| X1 | X2 | Calcination Temperature (°C) | Zn (%) | |
| 1 | −1 | −1 | 200 | 2 |
| 2 | +1 | −1 | 400 | 2 |
| 3 | −1 | +1 | 200 | 10 |
| 4 | +1 | +1 | 400 | 10 |
| 5 | 0 | 0 | 300 | 6 |
| 6 | 0 | 0 | 300 | 6 |
| 7 | 0 | 0 | 300 | 6 |
| Food Coloring | C.I. Number | Molecular Formula | λmax (nm) | Solubility (g L−1) | pKa | Chemical Structure |
|---|---|---|---|---|---|---|
| Allura Red AC | 16035 | C18H14N2Na2O8S2 | 504.0 | ~180.0 | 10.5 | 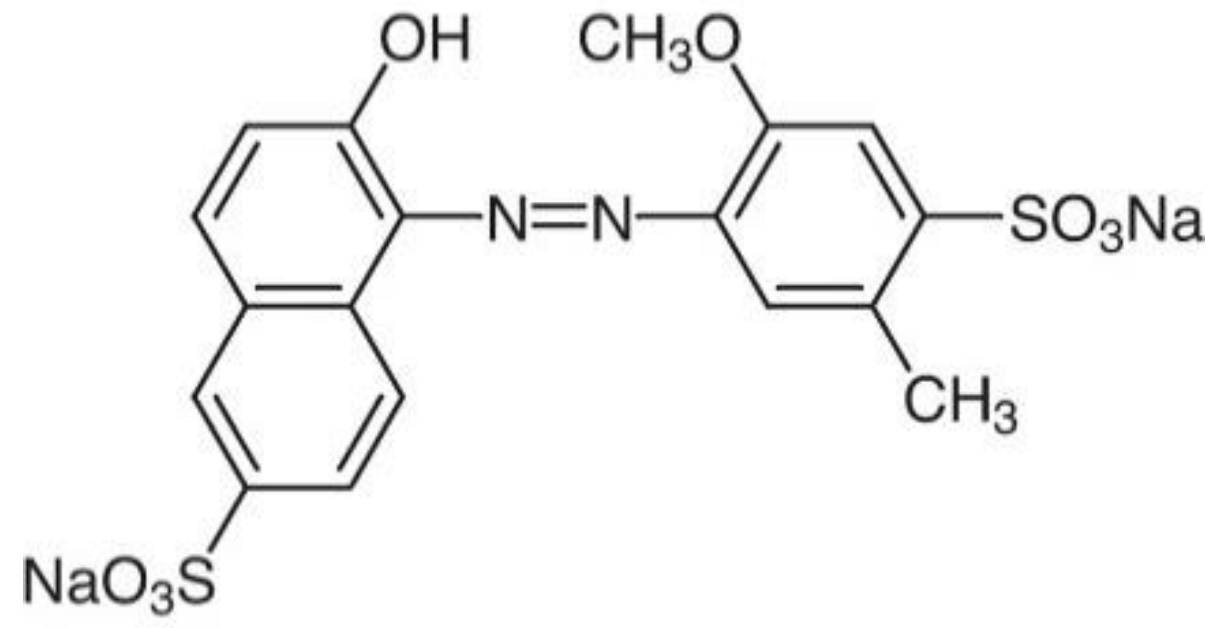 |
| Tartrazine Yellow | 19140 | C16H9N4Na3O9S2 | 427.0 | ~20.0 | 4.0 | 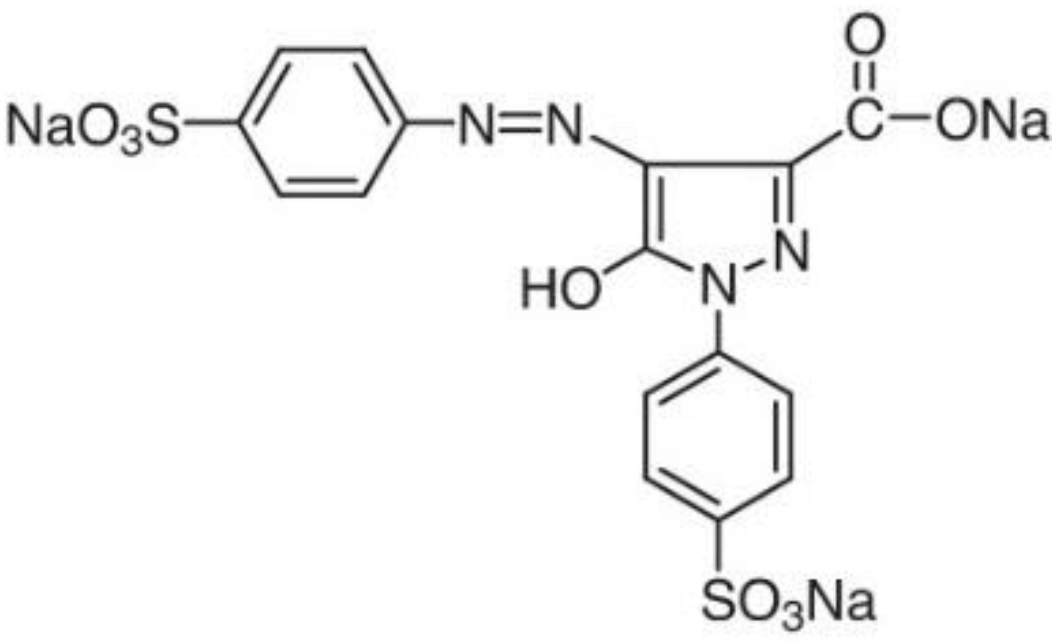 |
| Kinetic Model | Equation | Reference |
|---|---|---|
| Pseudo-first order | Equation (2) | [28] |
| Pseudo-second order | Equation (3) | |
| BMG | Equation (4) | [29] |
| Catalyst | Calcination Temperature (°C) | So (m2 g−1) | Vp (cm3 g−1) | dp (Å) |
|---|---|---|---|---|
| 2%Fe/TiO2 | non-calcined | 15.56 | 0.0152 | 27.76 |
| 200 | 11.36 | 0.0159 | 28.56 | |
| 300 | 11.12 | 0.0163 | 28.61 | |
| 400 | 10.98 | 0.0217 | 28.76 | |
| 2%Zn/2%Fe/TiO2 | non-calcined | 12.59 | 0.0134 | 21.28 |
| 200 | 11.98 | 0.0154 | 25.76 | |
| 400 | 11.90 | 0.0167 | 28.00 | |
| 6%Zn/2%Fe/TiO2 | non-calcined | 9.43 | 0.0391 | 85.82 |
| 300 | 9.10 | 0.0416 | 88.29 | |
| 10%Zn/2%Fe/TiO2 | non-calcined | 7.56 | 0.0276 | 73.12 |
| 200 | 6.62 | 0.0218 | 66.12 | |
| 400 | 6.37 | 0.0306 | 89.62 | |
| Elemental analysis | ||||
| Catalyst | Zn (%) | Fe (%) | ||
| 2%Fe/TiO2 | - | 1.91 | ||
| 2%Zn/2%Fe/TiO2 | 1.90 | 1.86 | ||
| 6%Zn/2%Fe/TiO2 | 5.74 | 1.74 | ||
| 10%Zn/2%Fe/TiO2 | 9.21 | 1.83 | ||
| Catalyst | Calcination Temperature | Adsorption Assay | Photolysis Assay | ||||||
|---|---|---|---|---|---|---|---|---|---|
| Allura Red | Tartrazine Yellow | Allura Red | Tartrazine Yellow | ||||||
| pH 7 | pH 4 | pH 7 | pH 4 | pH 7 | pH 4 | pH 7 | pH 4 | ||
| Discoloration (%) | Discoloration (%) | ||||||||
| 2%Fe/TiO2 | 200 °C | 5.70 | 8.75 | 2.16 | 8.74 | 0.15 | 3.50 | 0.10 | 1.05 |
| 300 °C | 6.55 | 9.54 | 1.08 | 6.08 | |||||
| 400 °C | 6.77 | 7.55 | 3.86 | 7.35 | |||||
| 2%Zn/2%Fe/TiO2 | 200 °C | 7.01 | 9.77 | 7.74 | 9.24 | ||||
| 400 °C | 8.79 | 9.23 | 8.33 | 10.38 | |||||
| 6%Zn/2%Fe/TiO2 | 300 °C | 8.14 | 10.03 | 2.25 | 9.99 | ||||
| 10%Zn/2%Fe/TiO2 | 200 °C | 5.93 | 8.88 | 6.16 | 8.74 | ||||
| 400 °C | 4.44 | 7.54 | 7.35 | 9.66 | |||||
| Food Coloring | Model | Parameters | Catalysts | |||||||
|---|---|---|---|---|---|---|---|---|---|---|
| 2%Fe/TiO2 | 2%Zn/2%Fe/TiO2 | 6%Zn/2%Fe/TiO2 | 10%Zn/2%Fe/TiO2 | |||||||
| Calcination Temperature (°C) | ||||||||||
| 200 | 300 | 400 | 200 | 400 | 300 | 200 | 400 | |||
| AR (pH 7) | PFO | k1 (10−3 min−1) | 0.85 | 1.32 | 1.66 | 8.74 | 2.3 | 7.29 | 5.31 | 2.09 |
| R2adj | 0.635 | 0.906 | 0.960 | 0.907 | 0.834 | 0.867 | 0.971 | 0.817 | ||
| SD (mg L−1) | 0.194 | 0.163 | 0.131 | 0.727 | 0.436 | 0.738 | 0.316 | 0.326 | ||
| PSO | k2 (10−4 L mg−1 min−1) | 0.89 | 1.42 | 1.81 | 13.10 | 2.57 | 10.40 | 6.77 | 2.35 | |
| R2adj | 0.658 | 0.918 | 0.973 | 0.942 | 0.820 | 0.942 | 0.963 | 0.855 | ||
| SD (mg L−1) | 0.188 | 0.153 | 0.108 | 0.573 | 0.455 | 0.487 | 0.360 | 0.290 | ||
| BMG | m (dimensionless) | 214.8 | 440.5 | 375.9 | 63.78 | 347.9 | 51.88 | 151.0 | 165.4 | |
| b (dimensionless) | 11.00 | 3.81 | 2.89 | 1.16 | 1.22 | 1.565 | 1.33 | 3.91 | ||
| R2adj | 0.991 | 0.938 | 0.999 | 0.928 | 0.915 | 0.984 | 0.950 | 0.994 | ||
| SD (mg L−1) | 0.030 | 0.133 | 0.024 | 0.642 | 0.142 | 0.251 | 0.419 | 0.06 | ||
| AR (pH 4) | PFO | k1 (10−3 min−1) | 3.75 | 3.66 | 3.71 | 13.79 | 4.93 | 21.77 | 47.86 | 4.59 |
| R2adj | 0.913 | 0.858 | 0.772 | 0.958 | 0.787 | 0.980 | 0.977 | 0.989 | ||
| SD (mg L−1) | 0.405 | 0.465 | 0.580 | 0.680 | 0.700 | 0.506 | 0.603 | 0.174 | ||
| PSO | k2 (10−4 L mg−1 min−1) | 4.52 | 4.44 | 45.20 | 23.50 | 6.40 | 43.90 | 133.0 | 5.68 | |
| R2adj | 0.941 | 0.912 | 0.836 | 0.926 | 0.872 | 0.990 | 0.999 | 0.983 | ||
| SD (mg L−1) | 0.332 | 0.366 | 0.492 | 0.899 | 0.543 | 0.355 | 0.143 | 0.215 | ||
| BMG | m (dimensionless) | 163.3 | 108.8 | 73.38 | 42.87 | 59.30 | 23.68 | 7.16 | 174.5 | |
| b (dimensionless) | 1.65 | 2.35 | 2.75 | 1.33 | 2.19 | 1.47 | 1.00 | 1.96 | ||
| R2adj | 0.946 | 0.998 | 0.974 | 0.901 | 0.997 | 0.986 | 0.998 | 0.977 | ||
| SD (mg L−1) | 0.320 | 0.059 | 0.196 | 0.993 | 0.087 | 0.420 | 0.163 | 0.248 | ||
| TY (pH 7) | PFO | k1 (10−4 min−1) | 3.07 | 16.80 | 27.10 | 46.10 | 15.40 | 34.70 | 32.80 | 14.20 |
| R2adj | 0.548 | 0.748 | 0.473 | 0.586 | 0.815 | 0.593 | 0.923 | 0.898 | ||
| SD (mg L−1) | 0.432 | 0.309 | 0.667 | 0.911 | 0.247 | 0.730 | 0.369 | 0.177 | ||
| PSO | k2 (10−4 L mg−1 min−1) | 1.95 | 1.85 | 3.16 | 5.95 | 1.67 | 4.21 | 3.85 | 1.53 | |
| R2adj | 0.600 | 0.782 | 0.555 | 0.700 | 0.843 | 0.673 | 0.930 | 0.912 | ||
| SD (mg L−1) | 0.398 | 0.287 | 0.613 | 0.775 | 0.227 | 0.654 | 0.351 | 0.163 | ||
| BMG | m (dimensionless) | 72.10 | 155.2 | 28.68 | 26.29 | 223.5 | 35.24 | 245.9 | 346.8 | |
| b (dimensionless) | 6.07 | 5.33 | 4.43 | 2.77 | 5.13 | 3.45 | 1.15 | 4.30 | ||
| R2adj | 0.991 | 0.971 | 0.995 | 0.993 | 0.991 | 0.953 | 0.907 | 0.958 | ||
| SD (mg L−1) | 0.059 | 0.105 | 0.065 | 0.119 | 0.055 | 0.247 | 0.403 | 0.113 | ||
| TY (pH 4) | PFO | k1 (10−3 min−1) | 5.27 | 4.41 | 3.88 | 11.73 | 2.66 | 23.56 | 47.86 | 3.12 |
| R2adj | 0.744 | 0.975 | 0.673 | 0.953 | 0.798 | 0.971 | 0.977 | 0.595 | ||
| SD (mg L−1) | 0.811 | 0.241 | 0.711 | 0.594 | 0.425 | 0.635 | 0.603 | 0.666 | ||
| PSO | k2 (10−4 L mg−1 min−1) | 6.98 | 5.45 | 4.80 | 19.30 | 3.06 | 51.10 | 133.0 | 3.71 | |
| R2adj | 0.844 | 0.984 | 0.760 | 0.995 | 0.836 | 0.967 | 0.999 | 0.668 | ||
| SD (mg L−1) | 0.633 | 0.194 | 0.609 | 0.187 | 0.383 | 0.675 | 0.144 | 0.603 | ||
| BMG | m (dimensionless) | 51.97 | 178.3 | 48.08 | 47.07 | 123.4 | 21.20 | 7.16 | 40.84 | |
| b (dimensionless) | 2.13 | 1.06 | 2.93 | 1.06 | 3.32 | 1.63 | 1.01 | 3.74 | ||
| R2adj | 0.983 | 0.979 | 0.993 | 0.995 | 0.931 | 0.954 | 0.998 | 0.958 | ||
| SD (mg L−1) | 0.206 | 0.223 | 0.104 | 0.187 | 0.248 | 0.797 | 0.163 | 0.215 | ||
| Source | df | AR Discoloration (%) | AR COD (%) | TY Discoloration (%) | TY COD (%) | ||||||||||||
|---|---|---|---|---|---|---|---|---|---|---|---|---|---|---|---|---|---|
| SS | MS | f-Value | p-Value | SS | MS | f-Value | p-Value | SS | MS | f-Value | p-Value | SS | MS | f-Value | p-Value | ||
| A | 1 | 5451.2 | 5451.2 | 2050.6 | 0.001 | 244.01 | 244.01 | 590.1 | 0.001 | 6168.8 | 6168.8 | 5928.9 | 0.001 | 678.8 | 678.8 | 520.8 | 0.001 |
| B | 1 | 65.84 | 65.84 | 24.77 | 0.003 | 0.15 | 0.15 | 0.36 | 0.571 | 459.5 | 459.5 | 441.6 | 0.001 | 56.13 | 56.13 | 43.07 | 0.001 |
| A2 | 1 | 909.4 | 909.4 | 342.1 | 0.001 | 30.30 | 30.30 | 73.24 | 0.001 | 4249.1 | 4249.1 | 4083.8 | 0.001 | 715.1 | 715.1 | 548.7 | 0.001 |
| A × B | 1 | 0.81 | 0.81 | 0.31 | 0.600 | 192.8 | 192.8 | 466.0 | 0.001 | 347.6 | 347.6 | 334.0 | 0.001 | 1.93 | 1.93 | 1.48 | 0.269 |
| Error | 6 | 15.95 | 2.66 | 2.48 | 0.41 | 6.20 | 1.04 | 7.82 | 1.30 | ||||||||
| Lack of fit | 3 | 10.63 | 3.54 | 2.00 | 0.26 | 1.65 | 0.55 | 1.83 | 0.20 | 4.10 | 1.37 | 1.96 | 0.27 | 5.22 | 1.74 | 2.02 | 0.25 |
| Total | 10 | 6443.2 | 469.8 | 11,231.2 | 1459.8 | ||||||||||||
Disclaimer/Publisher’s Note: The statements, opinions and data contained in all publications are solely those of the individual author(s) and contributor(s) and not of MDPI and/or the editor(s). MDPI and/or the editor(s) disclaim responsibility for any injury to people or property resulting from any ideas, methods, instructions or products referred to in the content. |
© 2025 by the authors. Licensee MDPI, Basel, Switzerland. This article is an open access article distributed under the terms and conditions of the Creative Commons Attribution (CC BY) license (https://creativecommons.org/licenses/by/4.0/).
Share and Cite
Castro, L.E.N.; Matheus, L.R.; Lenzi, G.G.; Arantes, M.K.; Almeida, L.N.B.; Brackmann, R.; Colpini, L.M.S. Assessment of the Effect of Zn Co-Doping on Fe/TiO2 Supports in the Preparation of Catalysts by Wet Impregnation for Photodegradation Reactions of Food Coloring Effluents. Colorants 2025, 4, 17. https://doi.org/10.3390/colorants4020017
Castro LEN, Matheus LR, Lenzi GG, Arantes MK, Almeida LNB, Brackmann R, Colpini LMS. Assessment of the Effect of Zn Co-Doping on Fe/TiO2 Supports in the Preparation of Catalysts by Wet Impregnation for Photodegradation Reactions of Food Coloring Effluents. Colorants. 2025; 4(2):17. https://doi.org/10.3390/colorants4020017
Chicago/Turabian StyleCastro, Luiz Eduardo Nochi, Larissa Resende Matheus, Giane Gonçalves Lenzi, Mabel Karina Arantes, Lariana Negrão Beraldo Almeida, Rodrigo Brackmann, and Leda Maria Saragiotto Colpini. 2025. "Assessment of the Effect of Zn Co-Doping on Fe/TiO2 Supports in the Preparation of Catalysts by Wet Impregnation for Photodegradation Reactions of Food Coloring Effluents" Colorants 4, no. 2: 17. https://doi.org/10.3390/colorants4020017
APA StyleCastro, L. E. N., Matheus, L. R., Lenzi, G. G., Arantes, M. K., Almeida, L. N. B., Brackmann, R., & Colpini, L. M. S. (2025). Assessment of the Effect of Zn Co-Doping on Fe/TiO2 Supports in the Preparation of Catalysts by Wet Impregnation for Photodegradation Reactions of Food Coloring Effluents. Colorants, 4(2), 17. https://doi.org/10.3390/colorants4020017