Article

Methylene Blue as a Sensitizing Dye: Enhancement of the Photocatalytic Performance of a Peroxide-Functionalized Iron Molybdate by the Antenna Effect

by
José Balena G. Filho
1,2,*,
Clóvis G. Vieira
3,
Daniel B. de Jesus
3,
Henrique F. V. Victória
3,4,
Edmar A. Soares
3,
Klaus Krambrock
3,
Márcio César Pereira
5 and
Luiz Carlos A. Oliveira
1
1
Department of Chemistry, Federal University of Minas Gerais (UFMG), Belo Horizonte 31270-901, MG, Brazil
2
Embrapa Instrumentation, Rua XV de novembro, 1452, São Carlos 13560-970, SP, Brazil
3
Department of Physics, Federal University of Minas Gerais (UFMG), Belo Horizonte 31270-901, MG, Brazil
4
Institute of Pure and Applied Sciences, Federal University of Itajubá (UNIFEI), Itabira 35903-087, MG, Brazil
5
Institute of Science, Engineering and Technology, Federal University of Jequitinhonha and Mucuri (UFVJM), Teófilo Otoni 39803-371, MG, Brazil
*
Author to whom correspondence should be addressed.
Colorants 2025, 4(2), 14; https://doi.org/10.3390/colorants4020014
Submission received: 28 February 2025 / Revised: 24 March 2025 / Accepted: 27 March 2025 / Published: 3 April 2025

Abstract

:
The use of dyes as sensitizing agents to increase semiconductor activity is a strategy already adopted in the field of heterogeneous photocatalysis, but the compounds applied are noble metal-based and sometimes difficult to synthesize, which make it more expensive. In this work, it was discovered that methylene blue can perform such an effect on an iron molybdate functionalized with peroxo groups on the surface. This material, called MoOxoFe, was tested together with its analogue MoFe (produced without H2O2 in the synthesis) in the degradation of methylene blue. The rapid degradation of the dye led to the hypothesis of sensitization, which was investigated and proven by additional photocatalytic tests with sensitized material, MoOxoFe-MB, and spectroscopies, such as EPR and XPS.

1. Introduction

Heterogeneous photocatalysis has garnered significant attention for its potential in environmental and energy applications. One of its primary advantages is its eco-friendliness; photocatalysis often operates under mild conditions (ambient temperature and pressure) and the possibility of utilizing sunlight, a renewable energy source, as the energy input [1,2,3]. This phenomenon occurs in a solid semiconductor, which interacts with reactants in a different phase, usually liquid or gas. The mechanism starts with the absorption of light energy with sufficient photon energy (equal to or greater than the bandgap of the semiconductor), which excites electrons from the valence band (VB) to the conduction band (CB), creating electron–hole pairs (e/h+) [4,5]. These charge carriers migrate to the surface of the photocatalyst, where they react with adsorbed species. The photogenerated h+ can oxidize electron donors, while the e are transferred to electron acceptors, producing radicals most of the time. Such reactive species direct sophisticated chemical transformations and can even skip laborious steps that are mandatory in classical organic synthesis routes [6,7,8,9].
Photocatalytic efficiency relies largely on semiconductor properties, and the development of visible light-efficient photocatalysts is essential to harvest a major part of sunlight, as only a small fraction of solar radiation falls within the ultraviolet range, which conventional photocatalysts like titanium dioxide primarily utilize [10]. To improve photocatalytic activity under visible light, some strategies have been employed, including doping with metal or non-metal elements to narrow the bandgap and enhance light absorption, as well as the introduction of defects in the crystal lattice to create localized states that facilitate charge separation [11]. Sensitization with dyes is another effective approach, where dyes are adsorbed onto the photocatalyst surface, acting as antennae to harvest visible photons [12,13,14,15]. This system promotes a constant charge exchange between the semiconductor–dye, offering the possibility of driving reactions by light utilization. Such advancements are critical for increasing efficiency and expanding the applications of photocatalysis.
The use of organic dye sensitizers not only enhances visible light absorption but also opens innovative pathways for sustainable waste management. By leveraging dyes from textile wastewater as a sensitizer, these otherwise pollutants can become functional components that activate photocatalysts under sunlight, enabling simultaneous energy utilization and waste remediation or producing value-added products. This approach allows the degradation of the dye itself while driving secondary reactions. This dual-purpose strategy exemplifies a circular economy concept, turning waste into a resource and addressing multiple environmental challenges simultaneously.
Iron molybdates have been studied as potential photocatalysts due to their suitable band gap for visible light [16,17]. However, their standalone photoactivity is generally limited, as they exhibit poor charge separation performance, the reason why iron molybdates are often coupled with other photocatalysts to form heterojunctions [18]. In this study, the authors present an unprecedented hydrogen peroxide-modified iron molybdate photocatalyst. This novel material was employed in a dual-functional photocatalytic system, using methylene blue (MB) as a sensitizing agent to remove quinoline and achieve H2 evolution. Ethanol was introduced as a sacrificial agent to facilitate the hydrogen production process, demonstrating the material’s versatile and enhanced activity in visible light-driven applications. Moreover, this sensitization was confirmed by EPR tests using the spin trapping technique and XPS.

2. Experimental

2.1. Synthesis

Two photocatalysts were synthesized. The so-called MoOxoFe was synthesized by dissolving 4 g of ammonium heptamolybdate in 50 mL of deionized water under constant stirring. After complete dissolution, 4 mL of hydrogen peroxide (30%) was added, yielding a bright-yellow solution (peroxo-molybdate complex). Finally, 10 mL of a 0.1 M solution of ferric nitrate was added dropwise, resulting in a yellow precipitate that was filtered, washed, and dried at 50 °C for 24 h. For comparative reasons, a material similar to MoOxoFe was synthesized, though without hydrogen peroxide addition. This solid was called MoFe.

2.2. Characterizations

The molar ratio Mo/Fe of the photocatalysts was investigated with an atomic absorption spectrometer Varian AA240FS (USA) equipped with 248.3 nm (iron) and 313.3 nm (molybdenum) hollow cathode lamps. The spectroscopic vibrational transitions were characterized by Raman spectroscopy on a Bruker Senterra Raman spectrometer (Germany) using a laser line at wavelength 532 nm, and Fourier-transform infrared spectroscopy (FTIR-ATR) in the wavenumber range from 400 to 1000 cm−1 was performed on a Shimadzu Prestige 21 spectrophotometer (Japan) coupled to an attenuated total reflection accessory (Krs-5 micro-crystal). Thermal behavior was investigated by thermogravimetry (TG) and differential thermal analysis (DTA), carried out in a Shimadzu DTG-60H thermal analyzer (Japan). The diffuse reflectance data were obtained on a Shimadzu UV-Vis spectrophotometer (Model 3550, Japan) in the wavelength from 800 to 200 nm, using BaSO4 as a reference. The Mössbauer spectra for 57Fe were obtained on a conventional CMTE model MA250 spectrometer (Germany) operating at 298 K at constant acceleration, with 57Co inserted in a Rh crystalline matrix as the γ-ray-emitting source. Temperature-programmed reduction (TPR) analyses were performed on a Chem BET 3000 equipment (USA) using 5% H2 in N2 as the reducing gas. Heating started at 25 °C and finished at 900 °C at a rate of 10 °C.min−1, and the signal was normalized by mass. The surface chemical analysis was characterized by X-ray photoelectron spectroscopy (XPS) using a CTX 400-PSP aluminum electron gun anode and a hemispherical analyzer PHOIBOS 100 SPECS (Germany). The textural and morphological aspects of the photocatalysts were investigated using the following techniques: N2 adsorption/desorption at 77 K (Autosorb iQ2 Quantachrome, USA), determining the surface area using the Brunauer–mmett–Teller (BET) method; scanning electron microscopy (SEM) on an FEG Quanta 200 FEI microscope (USA); and transmission electron microscopy (HR-TEM) on a Tecnai G2-20 SuperTwin FEI 200 kV microscope (USA). The crystallinity of compounds was evaluated using X-ray diffraction (XRD), carried out on a Shimadzu XRD-7000 diffractometer (Japan) working with Cu Kα radiation (2θ from 10 to 70).

2.3. Photocatalysis

2.3.1. MB Test

Initially, 15 mg of each material was weighed and placed in a beaker with 100 mL of 25 mg·L−1 MB aqueous solution. This suspension was stirred for one hour in the absence of light in order to establish the adsorption equilibrium (60 min). Afterwards, the MB absorbance spectra were recorded on a UV-Vis Shimadzu UV-1601PC spectrophotometer at 664 nm. A white LED source (Stella STH7805/27, 350 mL·W−1 and 5 W·m−1) was then switched on, and the system was subjected to two hours of visible light radiation. At the end, the MB absorbance was checked again. Percent removal by adsorption was subtracted from the total dye removal, resulting in the photodegradation percentage (value that was used to compare the photocatalytic efficiency of the materials).
The most active photocatalyst was then studied by collecting aliquots every 30 min throughout the process for 3 h, and the absorbance spectra were recorded to evaluate the time-dependent photocatalysis. For information about the degradation/oxidation process, samples (in main stages) were collected from the photocatalytic test and analyzed by ESI-MS (Thermo LCQ FLEET mass spectrometer).

2.3.2. Quinoline Test

To investigate the effect of dye sensitization of the photocatalyst, a second removal test was performed. For that, a 50 mg·L−1 quinoline aqueous solution was used together with 15 mg of MoOxoFe or sensitized MoOxoFe-MB photocatalyst. Aliquots were extracted after three hours under visible light and diluted 10×, and their absorbance spectra were recorded. An experiment in the absence of light was also performed to evaluate the quinoline adsorption process.

2.3.3. Hydrogen Evolution Test

The hydrogen evolution test was performed using 15 mL of a 50% ethanol–water solution in a 20 mL vial (leaving 5 mL of headspace) sealed with a rubber septum. In this reaction vessel, 50 mg of photocatalyst was inserted, and the system was subjected to 24 h of visible illumination (the same light source used in the other tests). At the end of this period, a 100 μL aliquot was extracted and injected into the Shimadzu gas chromatograph using a barrier ionization discharge detector (GC-BID), and the chromatographic conditions were: SHINCARBON ST column (2.0 m × 1.0 mm and 80–100 mesh range), helium pressure of 300 kPa, and split ratio of 5:1. The injector temperature was set at 100 °C, and the chromatographic run started with the column at 35 °C and was heated up to 80 °C at a ramp of 2 °C.min−1.

2.3.4. Reactive Species Test

Further, to evaluate photocatalytic generation of radicals under visible light, electron paramagnetic spin resonance allied with the spin trapping technique was performed using a 100 mM ethanol/water solution of N-tert-Butyl-α-phenylnitrone (PBN) as a spin trap molecule. Also, disodium 4,5-dihydroxybenzene-1,3-disulfonate (Tiron) was added as an electron scavenger. Typically, 10 mg of photocatalyst was added to 1 mL of solution; in the case of Tiron, the final concentration was 1% w/w. The same light source used in the photocatalytic process was applied in the spin trapping tests. EPR data were collected on a Magnettech Miniscope 400 spectrometer at room temperature. Typical parameters were: central field 337 mT, 10 mW microwave power, 100 kHz modulation, modulation Amplitude 0.2 mT, microwave frequency ~9.4 GHz, scan time 60 s, and 3 scans. The data were simulated using EasySpin toolbox (Matlab, version 6.0.2), applying the garlic routine for the purpose [19].

3. Results and Discussion

Characterization

Table S1 lists the molybdenum–iron molar ratio (Mo/Fe), as well as the specific surface area calculated by the BET method (SBET) for MoFe and MoOxoFe. Both of them showed similar values for the Mo/Fe ratio (~1.0) and SBET. The X-ray diffraction patterns indicated that these materials lacked long-range crystalline ordering, as shown in Figure 1a. The Raman spectra (Figure 1b) showed that MoFe and MoOxoFe did not have a marked difference. The most intense band of the spectrum, around 780 cm−1, was due to the Mo-O-Mo vibration of the molybdenum near the iron [20,21]. The band close to 820 cm−1 was generally attributed to the same vibration but further away from iron atoms [21]. The bands in the ranges of 310–370 cm−1 and 900–1000 cm−1 corresponded to the bending and stretching vibrations of Mo=O groups, respectively [20,21,22]. Furthermore, the absence of the band at 1045 cm−1 indicates that there was no ferric nitrate remaining on the surface of the iron molybdates [20,21].
The FTIR-ATR, shown in Figure 1c, of iron molybdates showed a strong absorption band at 545 cm−1, which was associated with the stretching mode of molybdates, where Mo-O was in octahedral symmetry [23]. Conversely, the week shoulder at 850 cm−1 and the medium intense band at 690 cm−1 were characteristic of the Mo-O stretching mode in a tetrahedral coordination [23,24]. The bands related to the octahedral Fe-O stretching mode had a lower intensity and can be seen around 410 cm−1 and 630 cm−1, while the Fe-O-Mo stretching mode was represented by a weak shoulder at 960 cm−1 [23,25]. For MoOxoFe, which was subjected to hydrogen peroxide during the synthesis process, its FTIR spectrum showed a splitting in the range of 650–760 cm−1 (highlighted in Figure 1c), which can probably be associated with the distortion of the iron molybdate structure caused by peroxo groups [26,27,28].
The Mössbauer spectra, as well as the fitted lines, can be observed in Figure S1, and the parameters of the fitted lines and their relative area (%) are available in Table S2. Even though all lines had a practically equal isomer shift (IS), with 0.40 mm.s−1 indicating high-spin octahedral Fe3+ [29,30], they had different quadrupole splitting components (QS), i.e., Fe in different coordinated environments. These different iron species were fitted as Spc1, Spc2, and Spc3. The Spc1 presented QS referring to the almost perfect octahedral Fe, while the Spc3 had its QS referring to the quite distorted octahedral symmetry; Spc2 was the medium term between them. Analyzing these spectra and percentages in Table S2, it was observed that MoOxoFe (Figure S1b) had larger fractions of lines 2 and 3, compared to MoFe (Figure S1a), components which referred to a lower symmetry. These more distorted coordination environments may be the result of the peroxide treatment in its synthesis, a fact that is in agreement with the FTIR-ATR spectral data. As MoFe and MoOxoFe are non-organized materials, their Mössbauer spectra differed significantly from commercial crystalline iron molybdate, which exhibits a single resonant transition, indicating perfect octahedral symmetry [31,32,33].
Figure 1d presents the results of thermogravimetric analyses (TG). During heating, two major weight loss events occurred in the TG curves. The first one began near room temperature for MoFe and MoOxoFe and stopped around 300 °C. The second one started at a distinct temperature for each iron molybdate: for MoOxoFe, it was over 650 °C, while in the case of MoFe, it was over 750 °C. The first kind of weight loss is normally attributed to the volatilization of physiosorbed water and surface dehydration. Observing the DTA plot (Figure S2a), it showed that the hydrogen peroxide-treated material had two endothermic minima until 100 °C, while MoFe presented only one. The additional minima for MoOxoFe probably refers to peroxo decomposition, since these groups have low thermal stability [34,35,36,37]. Also, only the MoFe sample presented a large exothermic event above 300 °C, which could be attributed to the solid structural organization, forming Fe2O3 and MoO3 phases that will react with each other to yield Fe2(MoO4)3 at high temperatures [38,39,40,41,42]. This result can be related to the huge difference in thermal stability post 650 °C. It was assumed that in contrast to the MoFe compound, MoOxoFe did not present an efficient structural rearrangement during the heating process, due to its distorted structures. Hence, molybdenum oxide was segregated and sublimated quickly [22,40], the reason why it lost almost all of its mass at the end of the TG test.
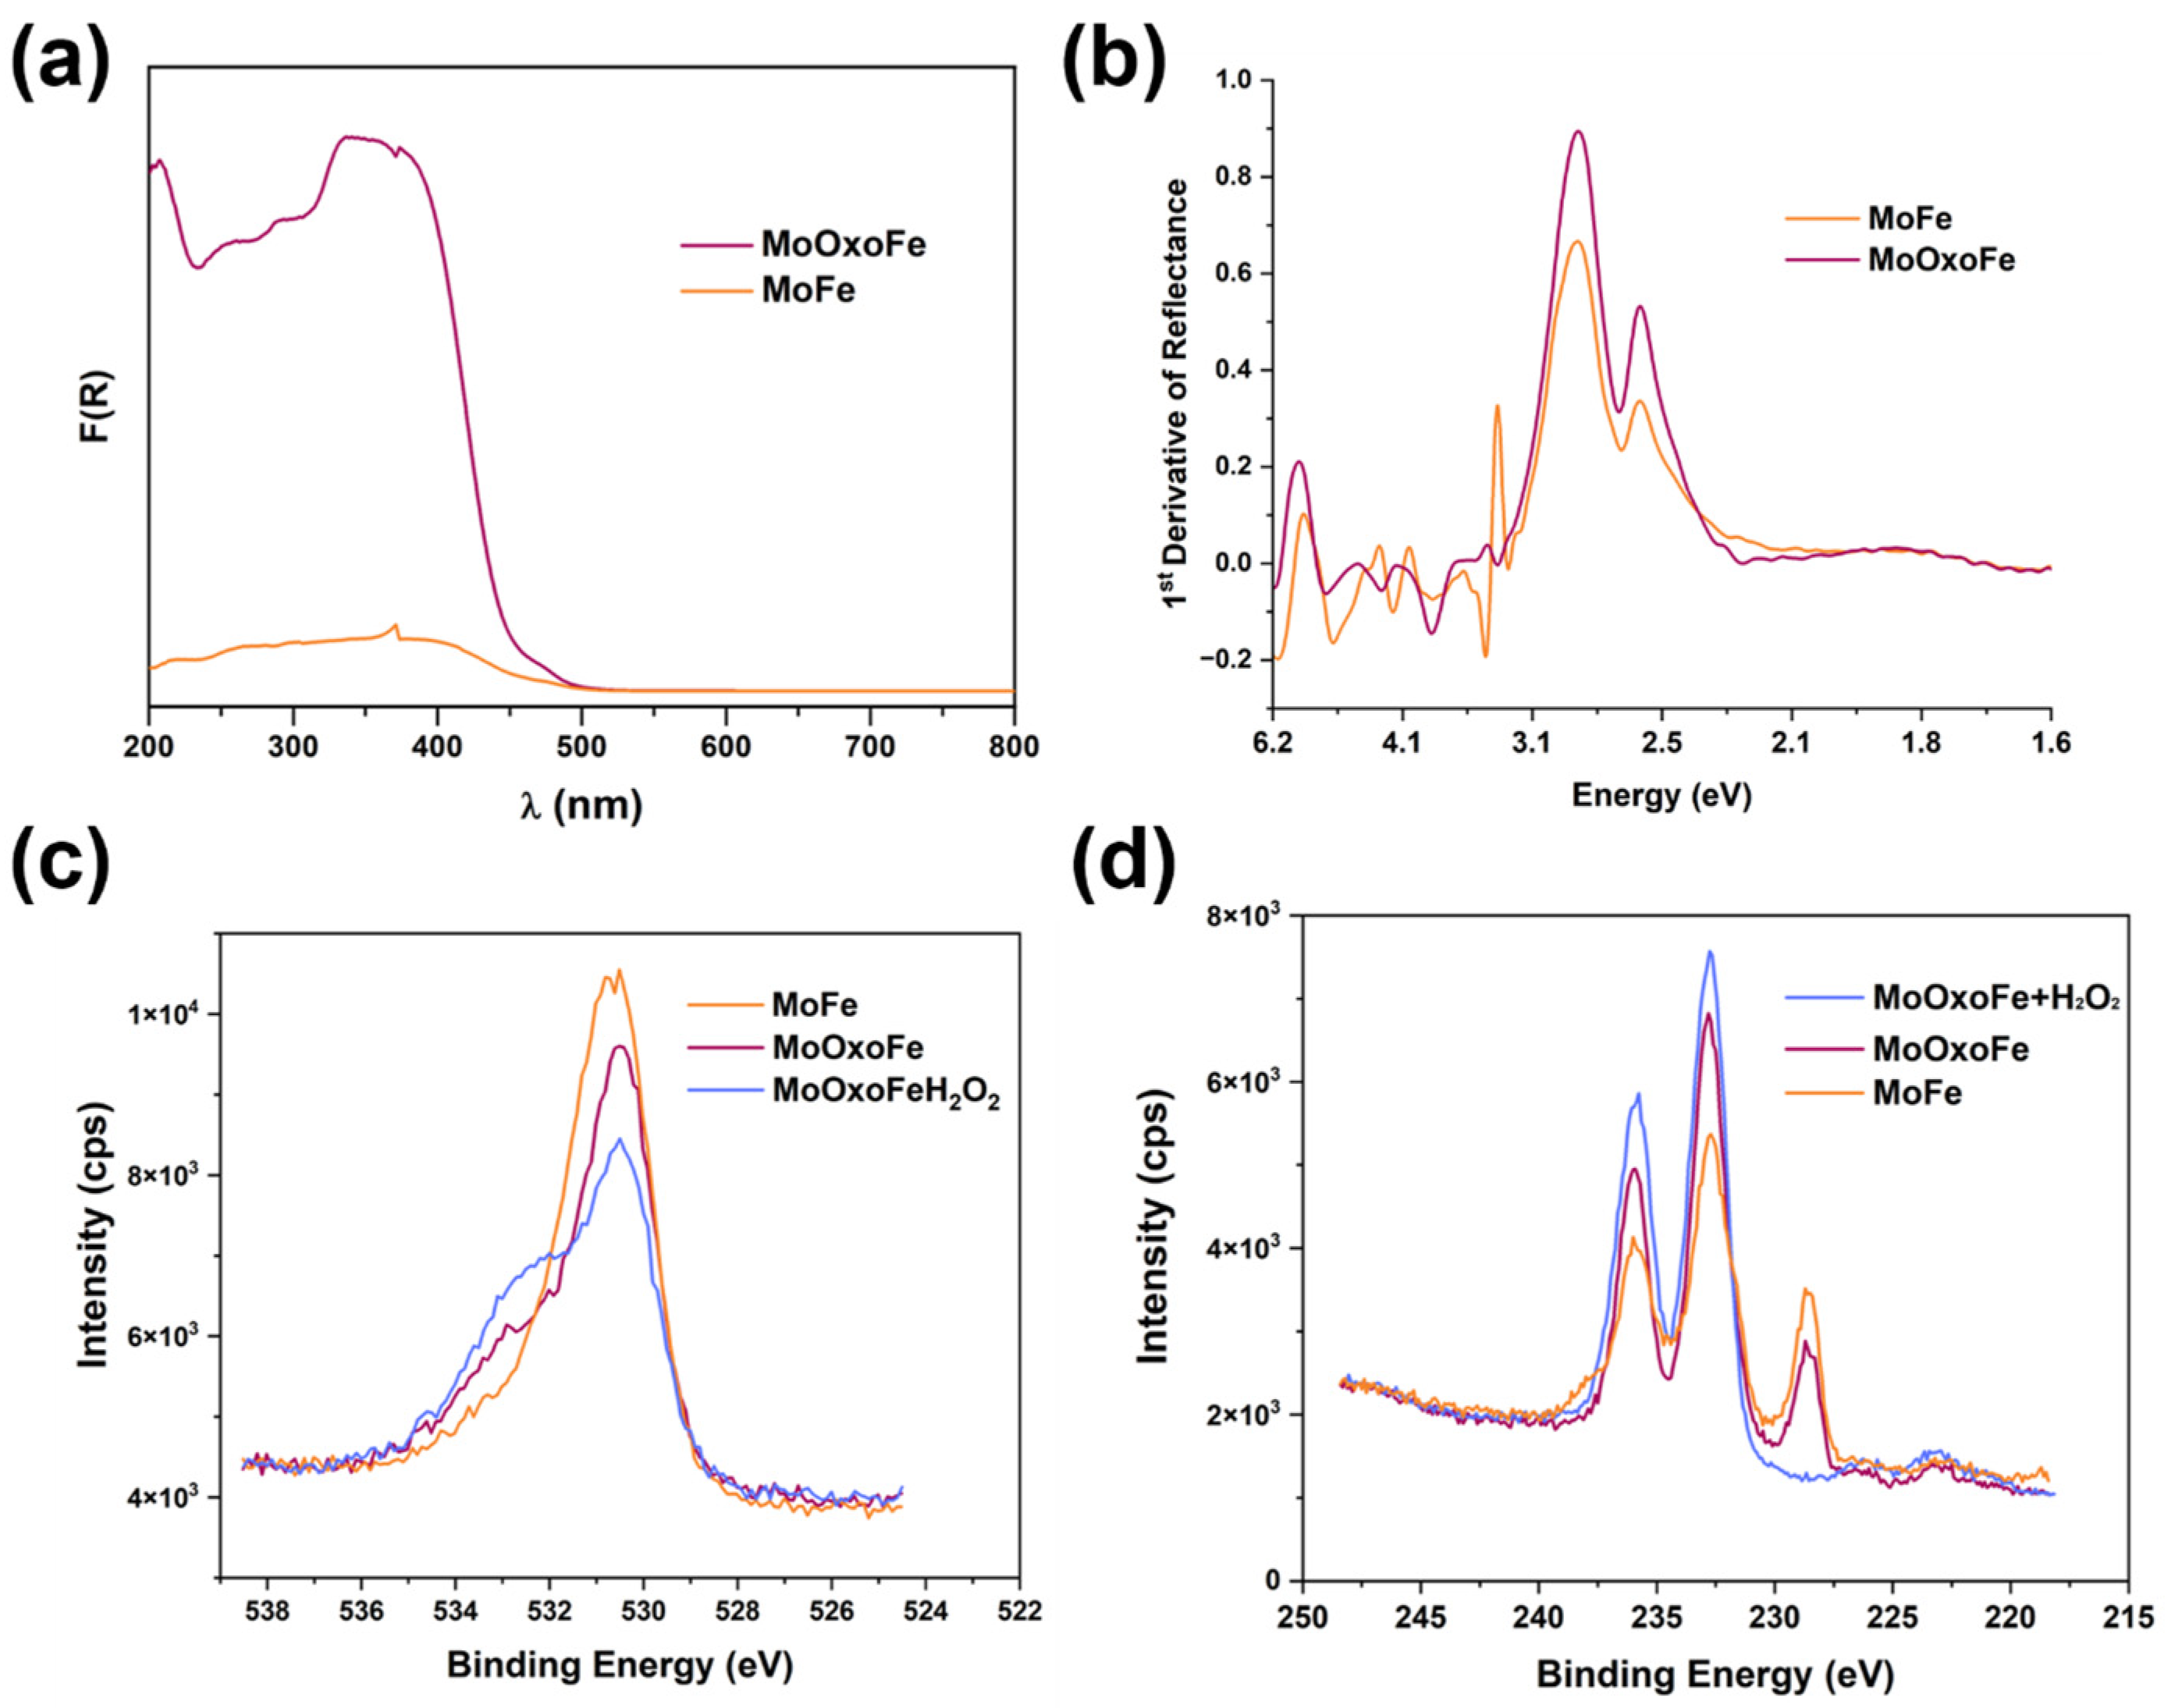
Figure 2a presents the Kulbelka–Munk function, the F(R) from the diffuse reflectance spectra (DRS) of the studied compounds. As the materials were normalized by mass, it was observed that MoOxoFe can harvest more light than MoFe. Analyzing the first derivative curve, as shown in Figure 2b, both presented a cause that came from intra-gap defects that promoted absorption at longer wavelengths of the visible spectrum (2.57 eV), but its band gap was close to 2.86 eV, characteristic of its yellow color. The scanning electron microscopy (SEM) images (Figure S3) indicated that the introduction of H2O2 in the synthesis caused a decrease in aggregates for MoOxoFe, as shown in (a,c), in relation to MoFe (b,d). These characteristics were also evidenced by transmission electron microscopy (TEM), which showed that MoFe was chunky, Figure 3b,d, while MoOxoFe was formed by nanometric particles, as shown in Figure 3a,c. The EDS spectrum was exactly the same for both iron molybdates, as shown in Figure S2b,c, for MoFe and MoOxoFe, respectively, highlighting the presence of Fe and Mo in the samples. A temperature-programmed reduction (TPR, Figure S2d) analysis was performed for these semiconductors, and they presented the same profile but with a higher hydrogen absorption for MoOxoFe, corroborating a greater penetration of this gas in the sample due to its smaller particle size.
For insights about the chemical nature of iron molybdates’ surface, the X-ray photoelectron spectroscopy (XPS) technique was used to study them. Taking a look at MoFe vs MoOxoFe, it was possible to observe a shoulder at 532.5 eV in the high-resolution spectrum for the O 1 s binding energy range, as shown in Figure 2c, for MoOxoFe, which was probably associated with the peroxo groups formed with molybdenum [43]. To determine whether this shoulder really belonged to the mentioned functional group, an additional treatment of H2O2 5% vol (50 mL suspension with 50 mg of material) was performed on MoOxoFe, and XPS analysis was performed on this new sample, confirming the increase of this signal. The Mo 3d spectra, shown in Figure 2d, evidenced the doublets belonging to Mo6+ and a lower energy signal at 228.7 eV. The latter disappeared after the extra H2O2 load, leading to the conclusion that it originated from surface defects that induced the formation of a molybdenum oxidation state with a reduced oxidation state [44,45].
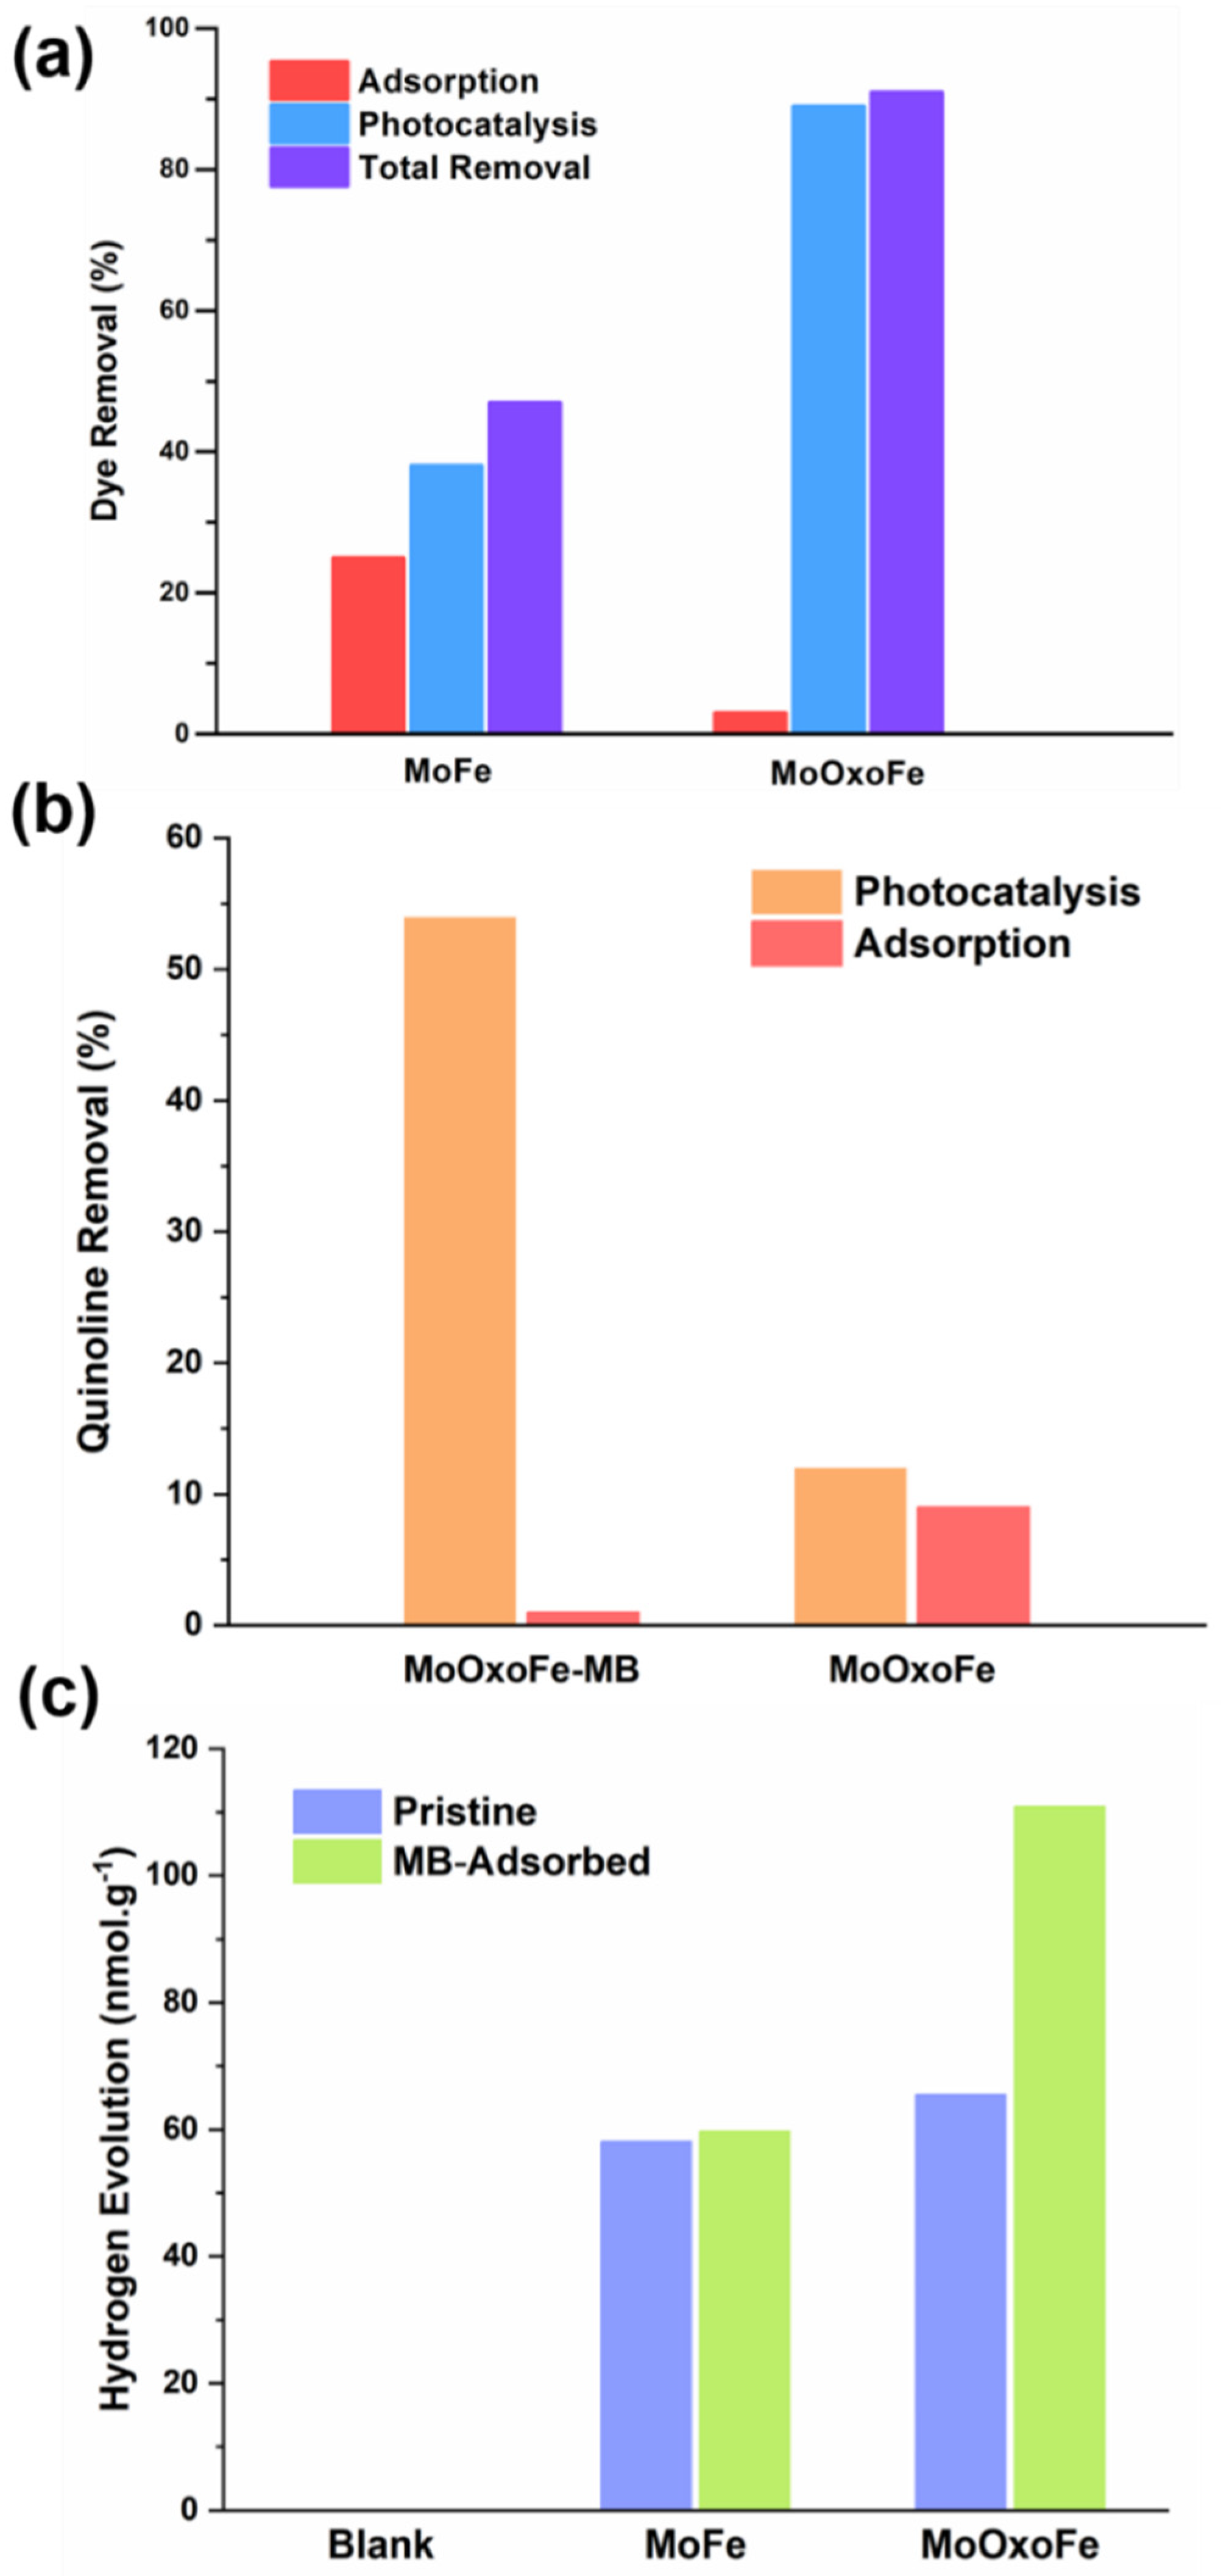
Figure 4a shows the MB dye removal results. The adsorption values of MB for MoFe and MoOxoFe were low, due to their low surface area. On the other hand, these materials showed photocatalytic activity under visible light. The MoOxoFe photocatalyst presented a far better removal capacity than MoFe (89% vs 38%, respectively) after 2 h of white LED exposure. Oxidation by both materials originated from CB and the production of ●O2, since iron molybdate does not have VB with such a positive potential to generate ●OH directly from water [17,46]. The time-dependent dye removal was investigated in more detail for the MoOxoFe. Figure S4a shows the absorption spectra of aliquots after different illuminating times, revealing the two strongest electronic transition bands of MB at 664 nm and 612 nm. According to this time-dependent spectra, in 1 h of reaction, practically 70% of the methylene blue was degraded.
The activity of MoOxoFe, even with such a low adsorption capacity, aroused curiosity, so an ESI-MS assay was performed to observe its behavior during adsorption and illumination (Figure S4b). It was observed that during adsorption, there was a very small degradation; in addition to the MB molecular ion, a compound with m/z = 301 was detected in the mass spectrometer, which was MB (m/z = 284) itself but with a hydroxyl (m/z = 17) added to its structure [47]. The formation of this hydroxyl in the dark perhaps came from peroxo groups on the surface of the material. When the light was activated after adsorption, a lot of degradation products were generated, which indicates that the dye was severely oxidized into molecules that only slightly resembled the phenothiazine structure of MB [48,49]. The rapid decrease in absorbance within the first thirty minutes after reaching adsorption equilibrium, as well as the large amount of degradation products showed by ESI-MS, pointed out a kind of synergism between the catalyst particles and the MB dye molecule, perhaps a sensitization.
To investigate the supposed sensitization effect, a new photocatalytic test was performed with aqueous quinoline solution (carcinogenic contaminant from fossil resources) with pure MoOxoFe and the same material after one hour of adsorption (MB-adsorbed MoOxoFe, called MoOxoFe-MB). Figure 4b shows the quinolone removal after 30 min of adsorption and 60 min of photocatalysis in the presence of MoOxoFe and MoOxoFe sensitized with MB. As observed, the MoOxoFe-MB compound showed a much better photocatalytic efficiency by visible light, removing almost five times more quinoline via photocatalysis than pristine MoOxoFe. On the other hand, the MoOxoFe-MB adsorbed less quinoline (~1%), which is reasonable because its surface was covered by MB dye molecules. This result shows that the adsorption of methylene blue dye on the catalyst surface promotes surface sensitization, making the catalyst more efficient in photocatalytic processes to degrade different types of molecules.
Furthermore, in order to advance in the sensitization investigation, a H2 evolution test was also performed using ethanol as a hole scavenger, as shown in Figure 4c. In this test, the sensitized MoFe version, called MoFe-MB (with MB adsorbed at the same time as MoOxoFe-MB), was also applied. Production was evaluated in 24 h to accumulate H2 in the reactor headspace. Comparing the photocatalysts with their directly sensitized analogues, it was possible to infer that the hypothesized phenomenon did not occur with MoFe, since their hydrogen evolution values were practically identical with the pristine MoFe. On the other hand, for MoOxoFe, this value almost doubled, reinforcing the proposed synergistic effect. In Figure S4, it is possible to observe the vials used for MoOxoFe and MoOxoFe-MB (left-yellow and right-green, respectively). The green suspension was stable, indicating that the dye was strongly attached to the surface of the iron molybdate, since it was not removed, even in the presence of ethanol.
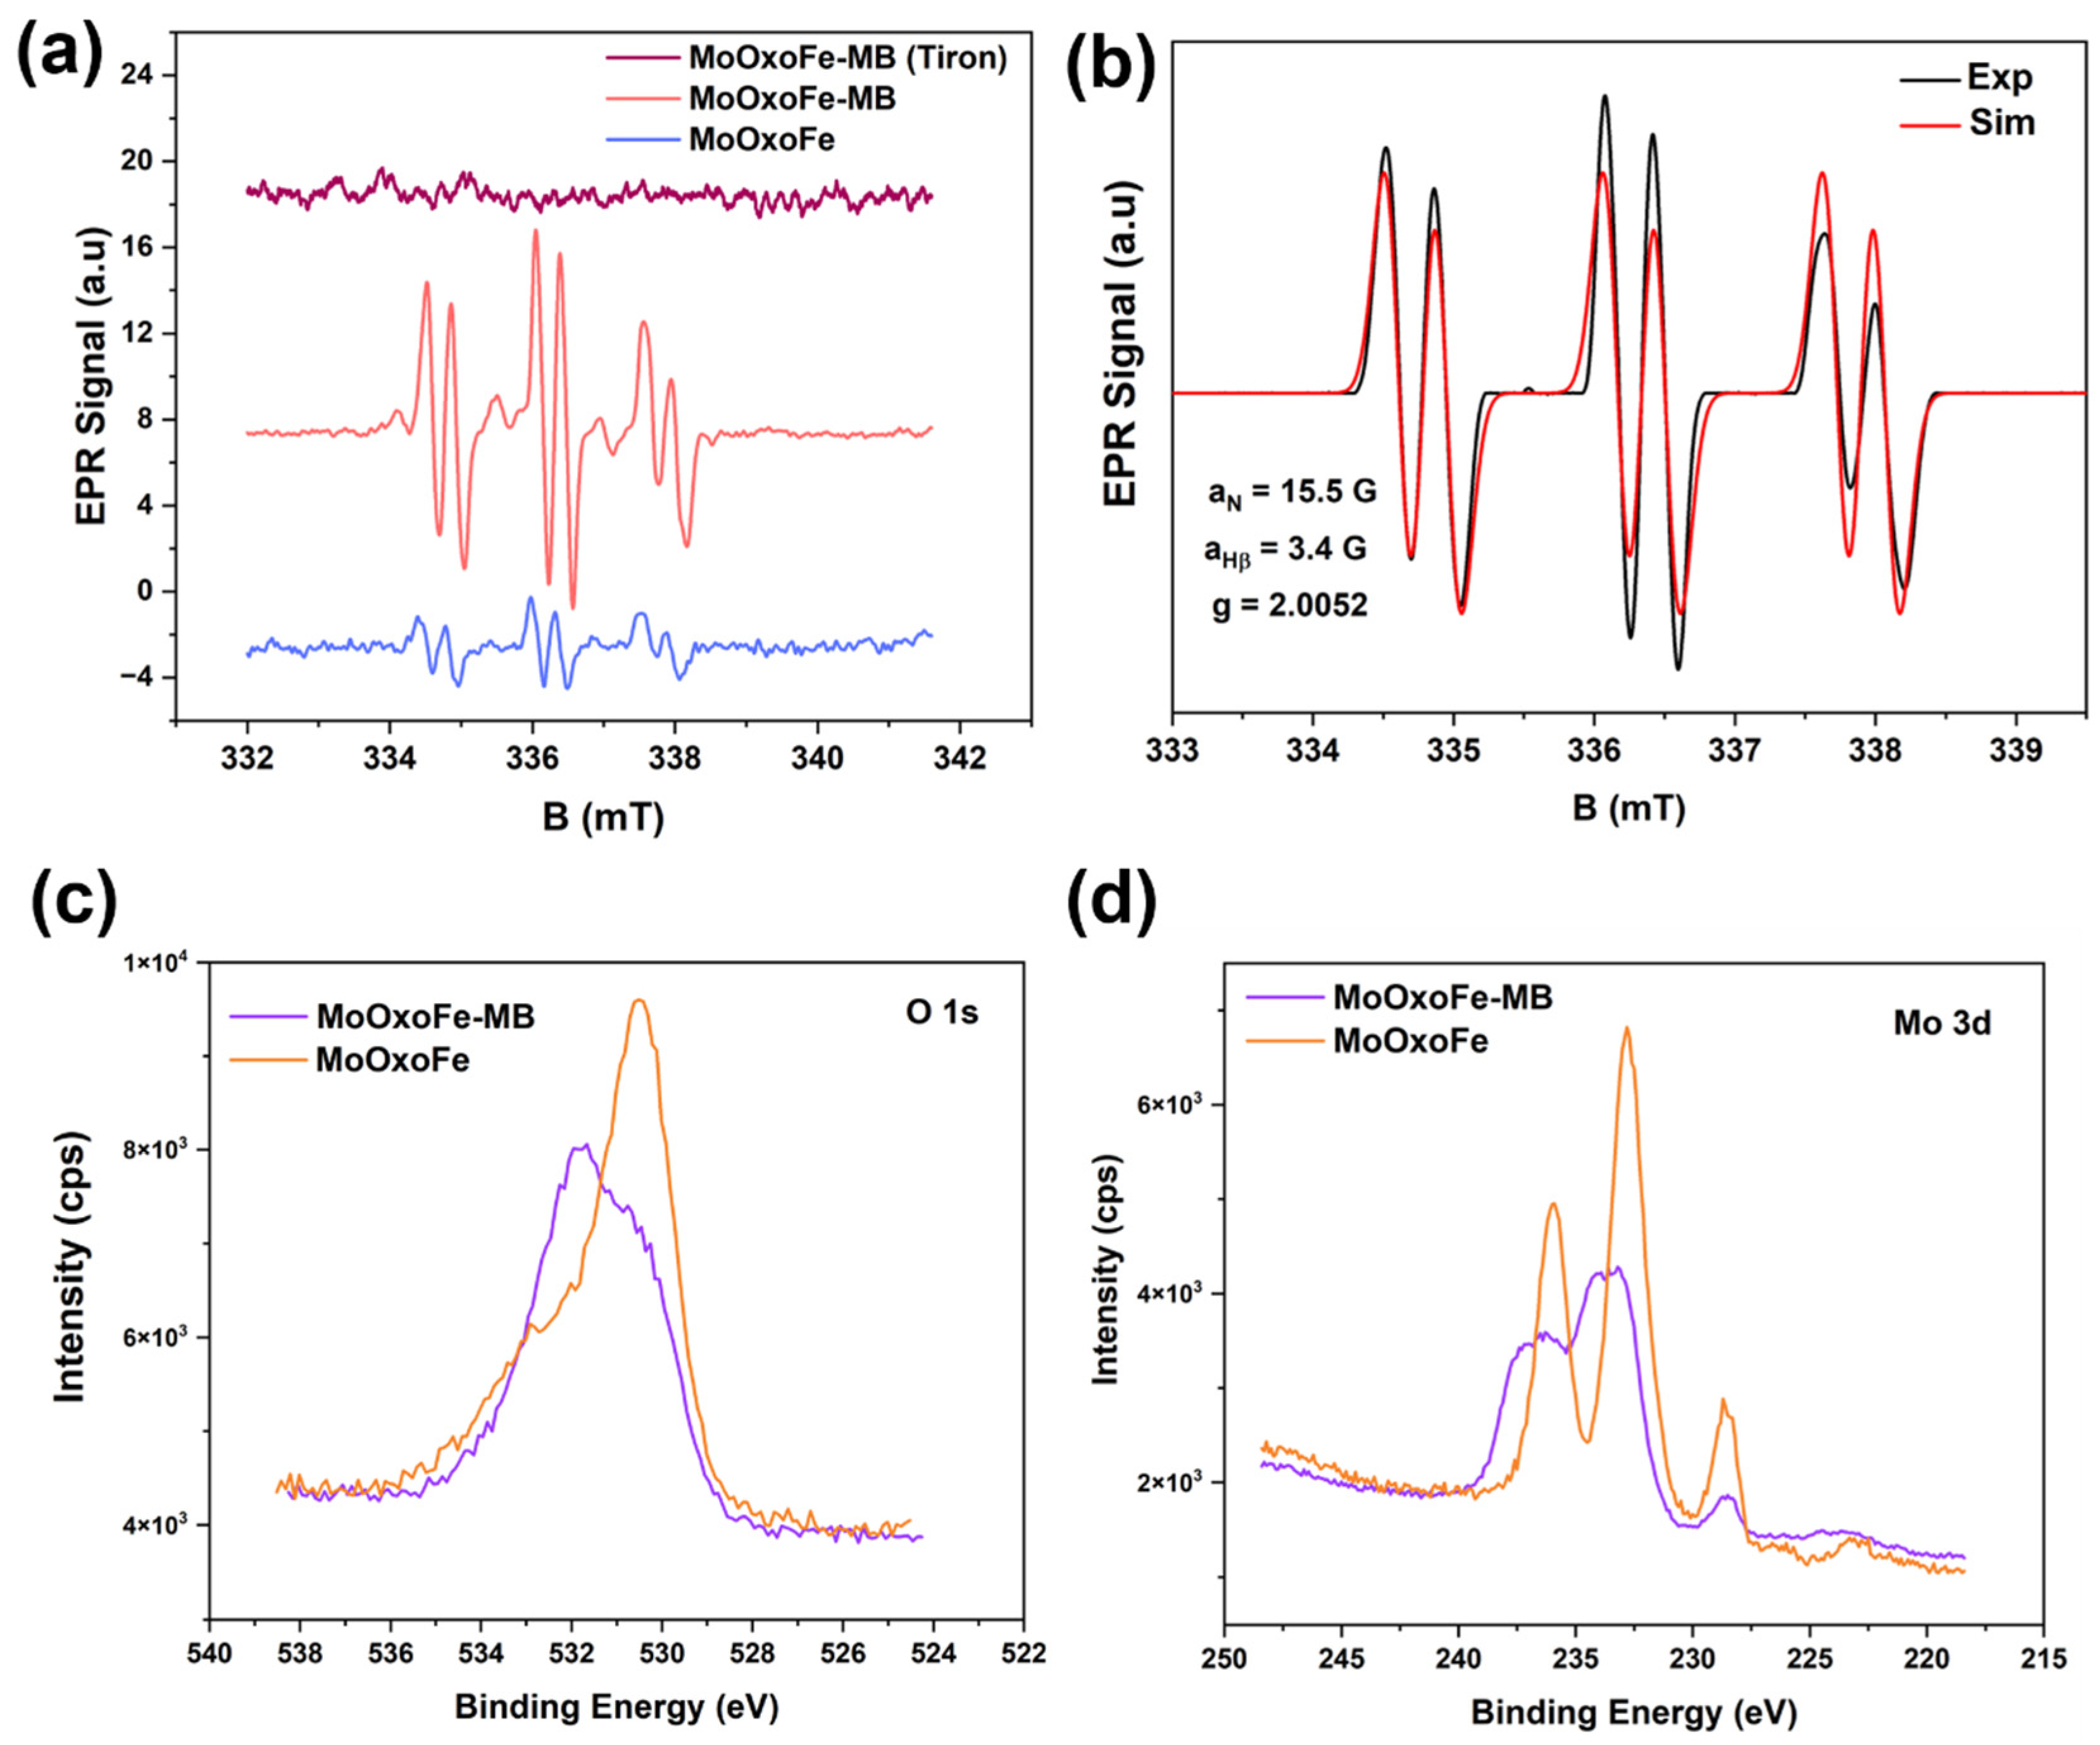
Electron paramagnetic resonance (EPR) measurements associated with the spin trapping methodology were conducted to investigate paramagnetic species produced in the photocatalytic process. The EPR spectra using PBN as the spin trapping agent revealed that the production of paramagnetic species was higher when MB was adsorbed on the surface of the material, as shown in Figure 5a. These radicals were identified through simulation and refer to α-hydroxyethyl [50,51] (hyperfine parameters of aN = 15.5 G and aH = 3.4 G), as shown in Figure 5b. Since the production of α-hydroxyethyl radicals is related to processes involving photogenerated holes [52,53,54] (see Figure 6 to view the process), the increase in signals due to MB suggests that this dye acts by inhibiting charge recombination. The photocatalyst oxidized ethanol to the respective radical, and the reaction released a proton into the medium; these protons were reduced by the electrons present in the semiconductor’s conduction band, forming hydrogen gas. Connecting these data with the results of hydrogen production, as well as photodegradation, there was probably an electron trapping cycle between the semiconductor CB and MB, keeping the holes free to oxidize the organic compounds while the electrons remained long enough to be transferred to O2 and H+ instead of simply recombining. To investigate the hypothesis about the decrease in the recombination rate, Tiron was used as an electron scavenger [55]. As no resonant transition lines were observed in EPR spectrum, the idea was confirmed.
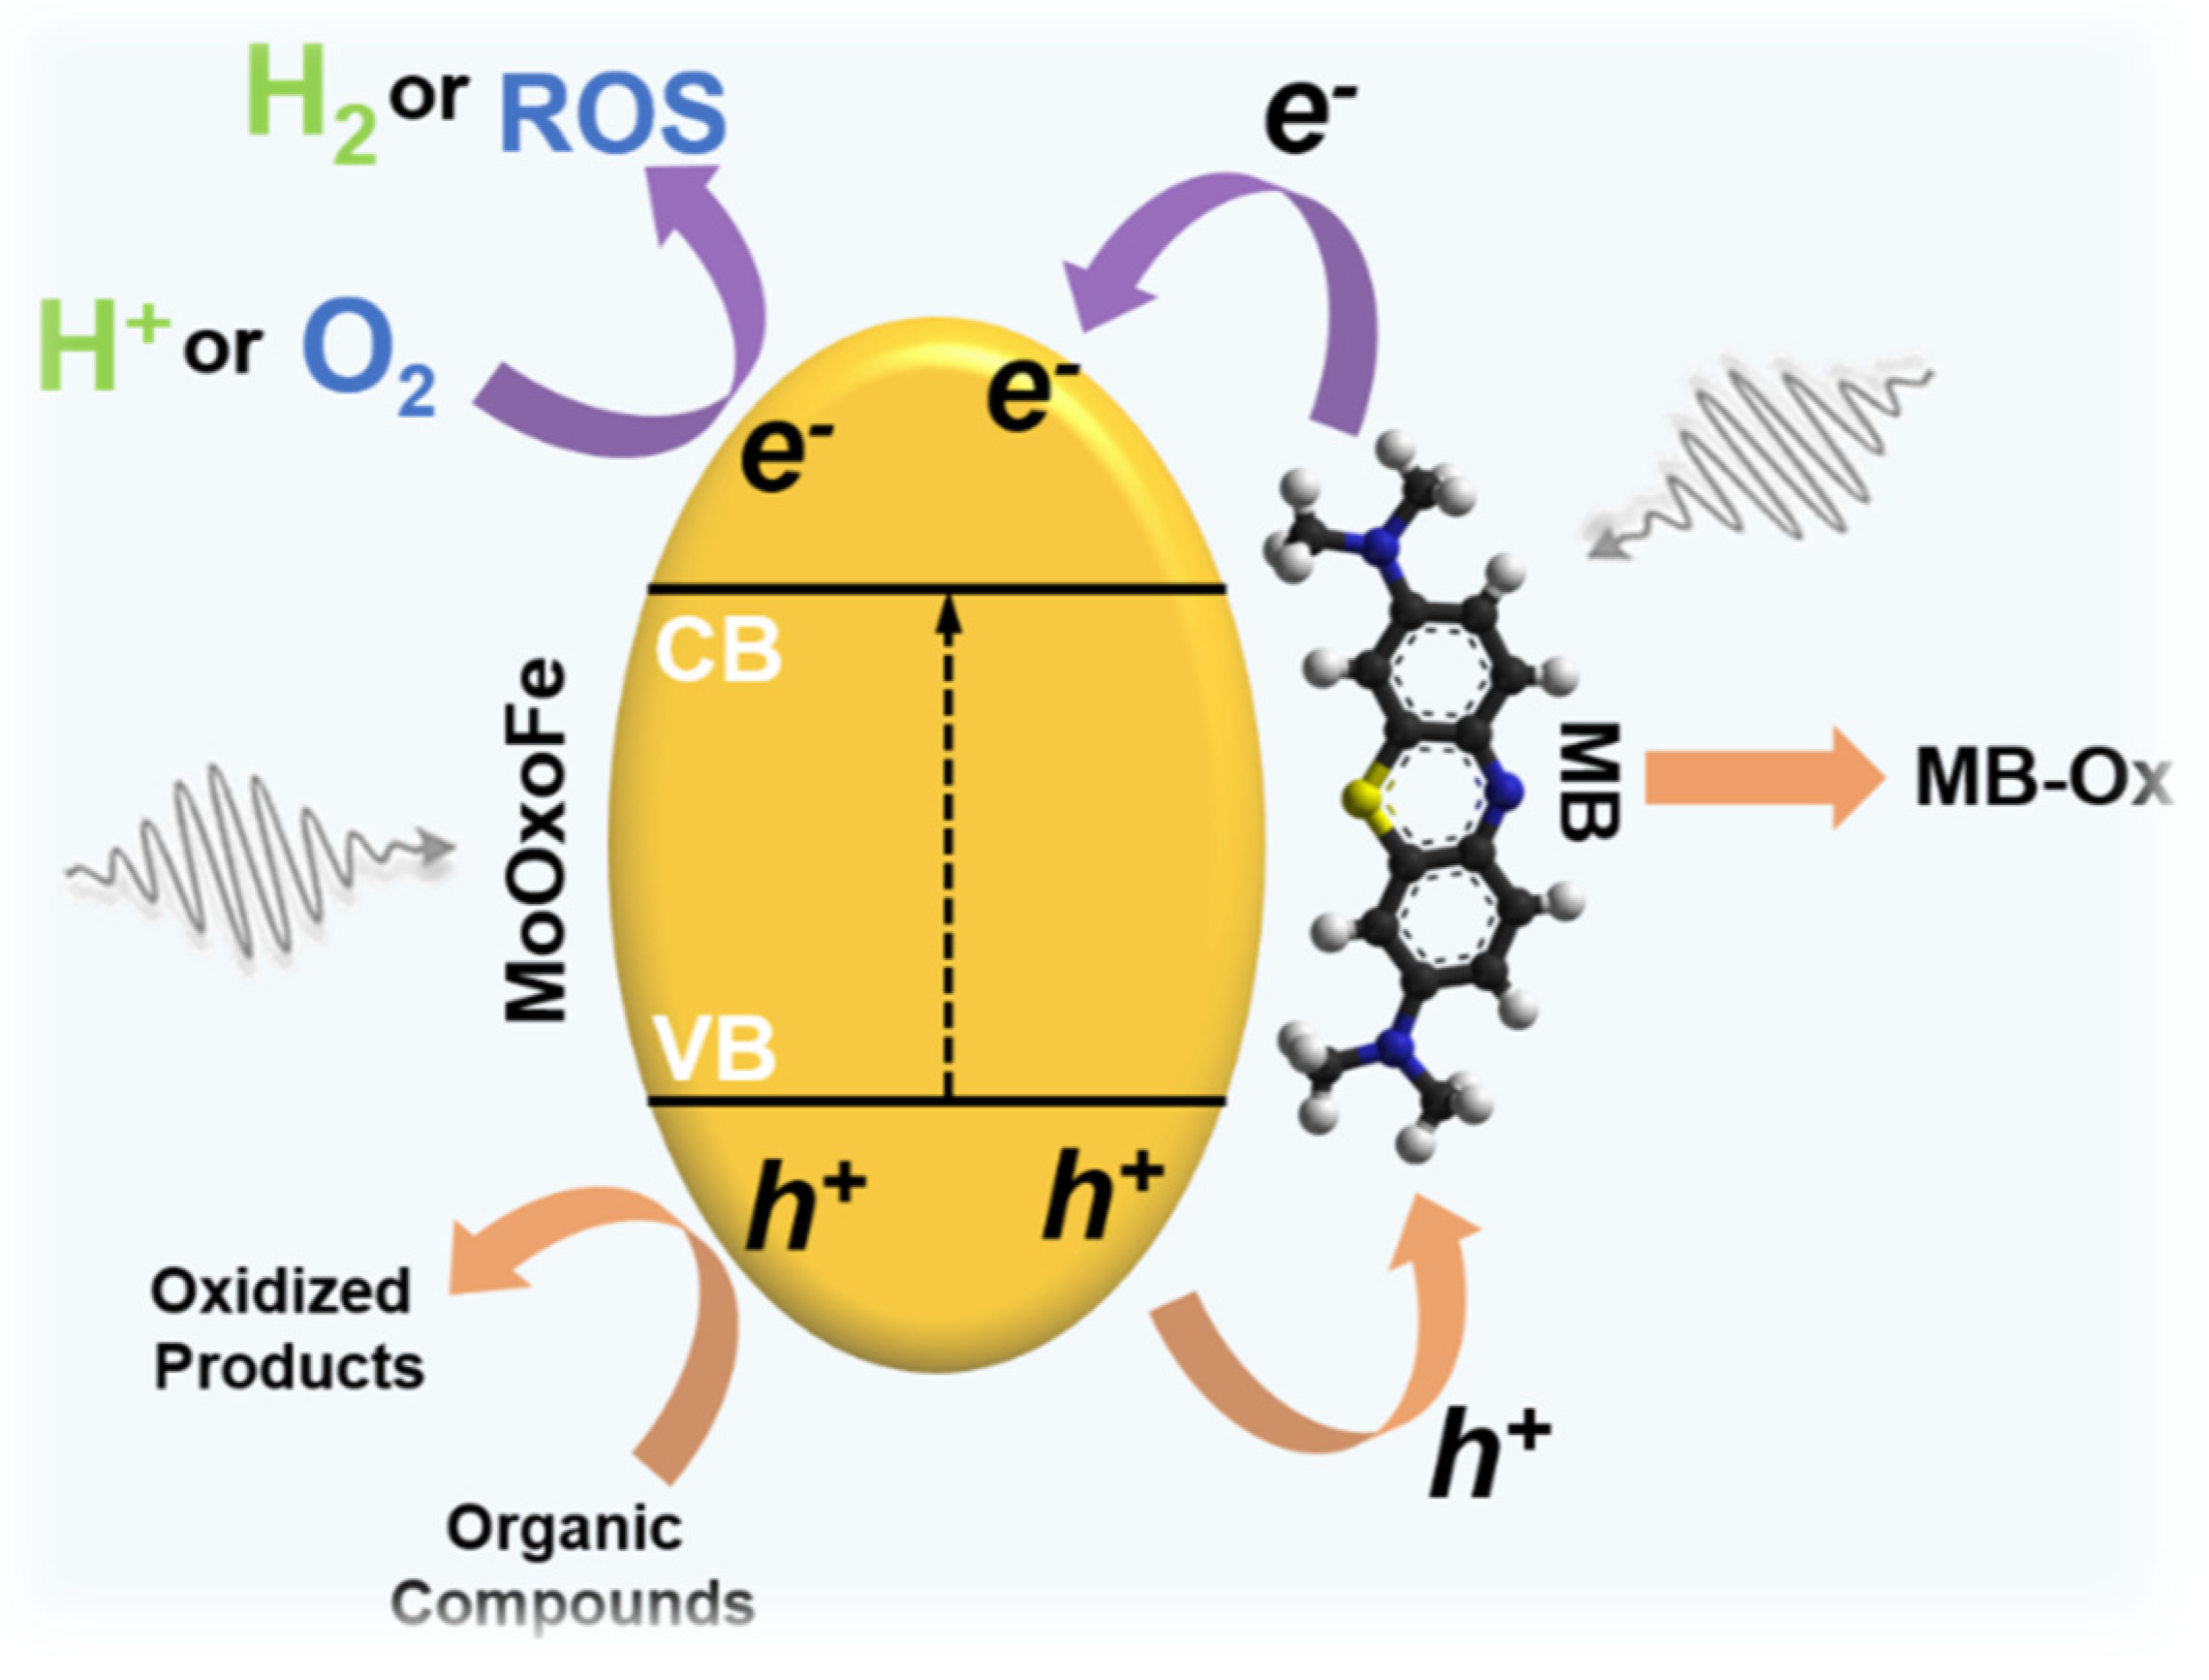
Further details were investigated on the interaction between MoOxoFe and MB using XPS again; this was accomplished by looking to MoOxoFe and MoOxoFe-MB (Figure 5c,d), using O 1s and the Mo 3d XPS spectra. First of all, these samples had different intensities, which was reasonable, since the presence of the adsorbed dye reduced the photoelectron emissions emitted by the surface atoms of the material. In other words, the dye molecules were diluting the amount of the ejected electrons of MoOxoFe. In addition, there was a shift towards higher binding energies when MB was present. For the characteristic doublet of Mo6+, 232.8 eV (3d5/2) and 235.9eV (3d3/2), there was a variation of 0.8 eV from one sample to another, suggesting that sensitization affected Mo6+ by withdrawing its electron density, thus increasing the photoejection energy. In the case of oxygen, the same effect existed, and there was an inversion in the intensity profile. The dominant peak for MoOxoFe was at 530.5 eV, and for MoOxoFe-MB, it shifted to 532 eV, which was just a weak shoulder for the pristine material. This surface nature modification was the strongest evidence of an intimate semiconductor–dye interaction [56] and the idea of sensitization and enhancement of photocatalytic performance for MoOxoFe. In order to represent the idea of the reaction mechanism and interaction between MoOxoFe and MB, a scheme was elaborated, and it can be seen in Figure 7.

4. Conclusions

Two materials based on iron molybdate were synthesized and tested as heterogeneous photocatalysts in the visible region of the electromagnetic spectrum. They, MoFe and MoOxoFe, were synthesized using a co-precipitation method using ammonium molybdate and ferric nitrate. However, in the MoOxoFe route, hydrogen peroxide was used to produce the peroxo-molybdenum complex before the addition of the iron salt. Basic characterizations, N2 physisorption at 77 K, AAS, XRD, FTIR-ATR, TGA, Raman, and XPS, showed that these compounds, despite their similar syntheses, have distinct characteristics, mainly evidence of the peroxo group on the surface. SEM images showed a more agglomerated and lumpy nature for MoFe, while MoOxoFe was composed of nanometric particles, which were also observed in TEM. On the other hand, performance for MB degradation showed a different effect for each material. MoOxoFe was able to almost completely degrade the dye in a short time under visible radiation. This rapid consumption of MB led to the hypothesis of sensitization, which was proven by additional photocatalytic reactions comparing this pristine and sensitized iron molybdate. Furthermore, EPR indicated that MoOxoFe-MB produced more radical species, which was indirectly correlated with the superior activity of the material. XPS spectra also revealed that this dye indeed adsorbed on MoOxoFe and changed the chemical behavior of the surface, confirming the sensitization. This work highlights an example of how dyes widely used in literature can boost the performance of low-activity photocatalysts, such as iron molybdate.

Supplementary Materials

The following supporting information can be downloaded at: https://www.mdpi.com/article/10.3390/colorants4020014/s1, Table S1. Molybdenum-iron (Mo/Fe) molar ratio and SBET of iron molybdates. Table S2. Parameters of 57Fe Mössbauer spectroscopy for MoOxoFe and MoFe. Figure S1. 57Fe Mössbauer experimental and fitted spectra for MoFe (a) and MoOxoFe (b). Figure S2. DTA analysis (a), EDS spectra (b,c) and TPR (d) for iron molybdates. Figure S3. SEM Images in different magnification for MoOxoFe (a,c) and MoFe (b,d). Figure S4. Time-dependent spectra of MB removal by MoOxoFe (a) and ESI-MS analysis of MB standard solution, adsorption (60 min) and photocatalysis (120 min). Figure S5. MoOxoFe (left-yeallow) and MoOxoFe-MB (right-green) suspensions after the H2 evolution test in presence of ethanol as hole scavenger.

Author Contributions

Conceptualization, J.B.G.F., M.C.P. and L.C.A.O.; Methodology, J.B.G.F., C.G.V., D.B.d.J., H.F.V.V., E.A.S. and K.K.; Validation, J.B.G.F., C.G.V., D.B.d.J., H.F.V.V., E.A.S. and K.K.; Formal analysis, J.B.G.F., C.G.V., D.B.d.J., H.F.V.V., E.A.S. and K.K.; Investigation, J.B.G.F., C.G.V., D.B.d.J., H.F.V.V. and E.A.S.; Resources, K.K. and L.C.A.O.; Data curation, J.B.G.F.; Writing—original draft, J.B.G.F.; Writing—review & editing, J.B.G.F., K.K., M.C.P. and L.C.A.O.; Visualization, J.B.G.F., M.C.P. and L.C.A.O.; Supervision, M.C.P. and L.C.A.O.; Project administration, L.C.A.O.; Funding acquisition, M.C.P. and L.C.A.O. All authors have read and agreed to the published version of the manuscript.

Funding

This research was funded by FAPESP, process 2023/10329-1; CNPq; Capes; FAPEMIG and FINEP.

Data Availability Statement

No new data were created or analyzed in this study. Data sharing is not applicable to this article.

Acknowledgments

The authors would like to thank the funding agencies FAPESP (process 2023/10329-1, current post-doctoral fellowship of José Balena Gabriel Filho), CNPq, Capes, FAPEMIG, and FINEP.

Conflicts of Interest

Author J.B.G.F. is employed at Embrapa Instrumentation. Other authors declare no conflicts of interest.

References

  1. Yaghoubi, S.; Mousavi, S.M.; Babapoor, A.; Binazadeh, M.; Lai, C.W.; Althomali, R.H.; Rahman, M.M.; Chiang, W.H. Photocatalysts for solar energy conversion: Recent advances and environmental applications. Renew. Sustain. Energy Rev. 2024, 200, 114538. [Google Scholar] [CrossRef]
  2. Dai, Y.; Xiong, Y. Control of selectivity in organic synthesis via heterogeneous photocatalysis under visible light. Nano Res. Energy 2022, 1, e9120006. [Google Scholar] [CrossRef]
  3. Gomes, G.H.M.; Gabriel, J.B.; Bruziquesi, C.G.O.; Victoria, H.V.; Krambrock, K.; Oliveira, L.C.A.; Mohallem, N.D.S. The role of oxygen vacancies in TT-Nb2O5 nanoparticles for the photoconversion of glycerol into solketal. Ceram. Int. 2023, 49, 14719–14732. [Google Scholar] [CrossRef]
  4. Fox, M.A.; Dulay, M.T. Heterogeneous Photocatalysis. Chem. Rev. 1993, 93, 341–357. [Google Scholar] [CrossRef]
  5. Liu, B.; Zhao, X.; Terashima, C.; Fujishima, A.; Nakata, K. Thermodynamic and kinetic analysis of heterogeneous photocatalysis for semiconductor systems. Phys. Chem. Chem. Phys. 2014, 16, 8751–8760. [Google Scholar] [CrossRef] [PubMed]
  6. Marzo, L.; Pagire, S.K.; Reiser, O.; König, B. Visible-Light Photocatalysis: Does It Make a Difference in Organic Synthesis? Angew. Chem. Int. Ed. 2018, 57, 10034–10072. [Google Scholar] [CrossRef]
  7. Friedmann, D.; Hakki, A.; Kim, H.; Choi, W.; Bahnemann, D. Heterogeneous photocatalytic organic synthesis: State-of-the-art and future perspectives. Green Chem. 2016, 18, 5391–5411. [Google Scholar] [CrossRef]
  8. Cao, G.M.; Hu, X.L.; Liao, L.L.; Yan, S.S.; Song, L.; Chruma, J.J.; Gong, L.; Yu, D.G. Visible-light photoredox-catalyzed umpolung carboxylation of carbonyl compounds with CO2. Nat. Commun. 2021, 12, 2–11. [Google Scholar] [CrossRef]
  9. Janczarek, M.; Kowalska, E. Defective dopant-free TiO2 as an efficient visible light-active photocatalyst. Catalysts 2021, 11, 978. [Google Scholar] [CrossRef]
  10. Song, C.; Xiao, L.; Chen, Y.; Yang, F.; Meng, H.; Zhang, W.; Zhang, Y.; Wu, Y. TiO2-Based Catalysts with Various Structures for Photocatalytic Application: A Review. Catalysts 2024, 14, 366. [Google Scholar] [CrossRef]
  11. Sun, N.; Si, X.; He, L.; Zhang, J.; Sun, Y. Strategies for enhancing the photocatalytic activity of semiconductors. Int. J. Hydrogen Energy 2024, 58, 1249–1265. [Google Scholar] [CrossRef]
  12. Gonuguntla, S.; Kamesh, R.; Pal, U.; Chatterjee, D. Dye sensitization of TiO2 relevant to photocatalytic hydrogen generation: Current research trends and prospects. J. Photochem. Photobiol. C Photochem. Rev. 2023, 57, 100621. [Google Scholar] [CrossRef]
  13. Michalec, K.; Kusior, A. From adsorbent to photocatalyst: The sensitization effect of SnO2 surface towards dye photodecomposition. Molecules 2021, 26, 7123. [Google Scholar] [CrossRef]
  14. Castillo-Robles, J.A.; Rocha-Rangel, E.; Ramírez-De-león, J.A.; Caballero-Rico, F.C.; Armendáriz-Mireles, E.N. Advances on dye-sensitized solar cells (DSSCs) nanostructures and natural colorants: A review. J. Compos. Sci. 2021, 5, 288. [Google Scholar] [CrossRef]
  15. Youssef, Z.; Colombeau, L.; Yesmurzayeva, N.; Baros, F.; Vanderesse, R.; Hamieh, T.; Toufaily, J.; Frochot, C.; Roques-Carmes, T. Dye-sensitized nanoparticles for heterogeneous photocatalysis: Cases studies with TiO2, ZnO, fullerene and graphene for water purification. Dye. Pigment. 2018, 159, 49–71. [Google Scholar] [CrossRef]
  16. Sudarsan, S.; Venthan, S.M.; Kumar, P.S.; Anandkumar, M.; Uchaev, D.A.; Trofimov, E.A.; Rangasamy, G. Investigation of the surface and photocatalytic behaviour of copper–iron–molybdate Cu7.26Fe7.26Mo12O48 nanocomposites prepared from discarded printed circuit boards. New J. Chem. 2025, 49, 2685–2693. [Google Scholar] [CrossRef]
  17. Kumar, A.; Sharma, P.; Sharma, G.; Dhiman, P.; Shekh, M.; Sillanpää, M.; Stadler, F.J. Recent progress in advanced strategies to enhance the photocatalytic performance of metal molybdates for H2 production and CO2 reduction. J. Alloys Compd. 2024, 971, 172665. [Google Scholar] [CrossRef]
  18. Yu, J.; Nong, Q.; Jiang, X.; Liu, X.; Wu, Y.; He, Y. Novel Fe2(MoO4)3/g-C3N4 heterojunction for efficient contaminant removal and hydrogen production under visible light irradiation. Sol. Energy 2016, 139, 355–364. [Google Scholar] [CrossRef]
  19. Stoll, S.; Schweiger, A. EasySpin, a comprehensive software package for spectral simulation and analysis in EPR. J. Magn. Reson. 2006, 178, 42–55. [Google Scholar] [CrossRef]
  20. Hill, G.; Wilson, J.H. Raman spectroscopy of iron molybdate catalyst systems: Part I. Prep. Unsupported Catal. J. Mol. Catal. 1990, 63, 65–94. [Google Scholar]
  21. Xu, Q.; Jia, G.; Zhang, J.; Feng, Z.; Li, C. Surface Phase Composition of Iron Molybdate Catalysts Studied by UV Raman Spectroscopy. J. Phys. Chem. C 2008, 112, 9387–9393. [Google Scholar]
  22. House, M.P.; Carley, A.F.; Echeverria-valda, R.; Bowker, M. Effect of Varying the Cation Ratio within Iron Molybdate Catalysts for the Selective Oxidation of Methanol. J. Phys. Chem. C 2008, 112, 4333–4341. [Google Scholar] [CrossRef]
  23. Belhekar, A.A.; Ayyappan, S.; Ramaswamy, A.V. FT-IR studies on the evolution of different phases and their interaction in ferric molybdate—Molybdenum trioxide catalysts. J. Chem. Technol. Biotechnol. 1994, 59, 395–402. [Google Scholar] [CrossRef]
  24. Brookes, C.; Wells, P.P.; Cibin, G.; Dimitratos, N.; Jones, W.; Morgan, D.J.; Bowker, M. Molybdenum oxide on Fe2O3 core-shell catalysts: Probing the nature of the structural motifs responsible for methanol oxidation catalysis. ACS Catal. 2014, 4, 243–250. [Google Scholar] [CrossRef]
  25. Rashad, M.M.; Ibrahim, A.A.; Rayan, D.A.; Sanad, M.M.S.; Helmy, I.M. Photo-Fenton-like degradation of Rhodamine B dye from waste water using iron molybdate catalyst under visible light irradiation, Environ. Nanotechnol. Monit. Manag. 2017, 8, 175–186. [Google Scholar] [CrossRef]
  26. Louka, F.R.; Nguyen, L.T.; Albering, J.H.; Mautner, F.A.; Massoud, S.S. Unprecedented formation of a doubly bridged μ-peroxo-μ-pyrazolyldicarboxylato-dicobalt(III) complex. Inorg. Chem. Commun. 2012, 15, 269–271. [Google Scholar] [CrossRef]
  27. Sorrell, T.N.; Allen, W.E.; White, P.S. Sterically Hindered [Tris(imidazolyl)phosphine]copper Complexes: Formation and Reactivity of a Peroxo-Dicopper(II) Adduct and Structure of a Dinuclear Carbonate-Bridged Complex. Inorg. Chem. 1995, 34, 952–960. [Google Scholar] [CrossRef]
  28. Park, J.H.; Yoo, Y.B.; Lee, K.H.; Jang, W.S.; Oh, J.Y.; Chae, S.S.; Baik, H.K. Low-temperature, high-performance solution-processed thin-film transistors with peroxo-zirconium oxide dielectric. ACS Appl. Mater. Interfaces 2013, 5, 410–417. [Google Scholar] [CrossRef]
  29. Gütlich, P.; Schröder, C.; Schünemann, V. Mössbauer spectroscopy—An indispensable tool in solid state research. Spectrosc. Eur. 2012, 24, 21–32. [Google Scholar]
  30. Kuzmann, E.; Homonnay, Z.; Klencsár, Z.; Szalay, R. 57Fe mössbauer spectroscopy as a tool for study of spin states and magnetic interactions in inorganic chemistry. Molecules 2021, 26, 1062. [Google Scholar] [CrossRef]
  31. Oefner, N.; Heck, F.; Dürl, M.; Schumacher, L.; Siddiqui, H.K.; Kramm, U.I.; Hess, C.; Möller, A.; Albert, B.; Etzold, B.J.M. Activity, Selectivity and Initial Degradation of Iron Molybdate in the Oxidative Dehydrogenation of Ethanol. ChemCatChem 2022, 14, e202101219. [Google Scholar] [CrossRef]
  32. Castelão-Dias, M.; Costa BF, O.; Quinta-Ferreira, R.M. 57Fe Mössbauer Studies in Mo–Fe Supported Catalysts. Hyperfine Interact. 2001, 136, 9–16. [Google Scholar] [CrossRef]
  33. Manseri, K.; Hentit, H.; Elandaloussi, E.H.; Benaichouba, B.; Ouali, M.S. The role of cationic additions in molybdate multi-component catalysts. Hyperfine Interact. 2010, 198, 243–257. [Google Scholar] [CrossRef]
  34. Bayot, D.; Tinant, B.; Devillers, M. Water-soluble niobium peroxo complexes as precursors for the preparation of Nb-based oxide catalysts. Catal. Today 2003, 78, 439–447. [Google Scholar] [CrossRef]
  35. Würtele, C.; Sander, O.; Lutz, V.; Waitz, T.; Tuczek, F.; Schindler, S. Aliphatic C-H bond oxidation of toluene using copper peroxo complexes that are stable at room temperature. J. Am. Chem. Soc. 2009, 131, 7544–7545. [Google Scholar] [CrossRef] [PubMed]
  36. Pajić, D.N.; Djinović, P.; Dražić, G.; Grdadolnik, J.; Šket, P.; Cerkovnik, J.; Pintar, A. Structural stabilization and characterization of active peroxo species on TiO2-nanotube based materials in mild catalytic wet peroxide oxidation process. Appl. Catal. A Gen. 2018, 562, 276–283. [Google Scholar] [CrossRef]
  37. Bonino, F.; Damin, A.; Ricchiardi, G.; Ricci, M.; Spano, G.; Aloisio, R.D.; Zecchina, A.; Lamberti, C.; Prestipino, C.; Bordiga, S. Ti-Peroxo Species in the TS-1/H2O2/H2O System. J. Phys. Chem. B 2004, 108, 3573–3583. [Google Scholar]
  38. Nikolenko, M.V.; Kostynyuk, A.O.; Goutenoire, F.; Kalashnikov, Y.V. Chemical precipitation of iron(III) molybdate + molybdenum trioxide mixtures through continuous crystallization. Inorg. Mater. 2014, 50, 1140–1145. [Google Scholar] [CrossRef]
  39. Shaheen, W.M. Thermal behaviour of pure and binary Fe(NO3)3·9H2O and (NH4)6Mo7O24·4H2O systems. Mater. Sci. Eng. A 2007, 445, 113–121. [Google Scholar] [CrossRef]
  40. Brookes, C.; Wells, P.P.; Dimitratos, N.; Jones, W.; Gibson, E.K.; Morgan, D.J.; Cibin, G.; Nicklin, C.; Mora-Fonz, D.; Scanlon, D.O.; et al. The Nature of the Molybdenum Surface in Iron Molybdate the Active Phase in Selective Methanol Oxidation. J. Phys. Chem. C 2014, 118, 26155–26161. [Google Scholar] [CrossRef]
  41. Yeo, B.R.; Pudge, G.J.F.; Bugler, K.G.; Rushby, A.V.; Kondrat, S.; Bartley, J.; Golunski, S.; Taylor, S.H.; Gibson, E.; Wells, P.P.; et al. The surface of iron molybdate catalysts used for the selective oxidation of methanol. Surf. Sci. 2016, 648, 163–169. [Google Scholar] [CrossRef]
  42. Nikolenko, N.V.; Kozhevnikov, I.V.; Kostyniuk, A.O.; Bayahia, H.; Kalashnykov, Y.V. Preparation of iron molybdate catalysts for methanol to formaldehyde oxidation based on ammonium molybdoferrate(II) precursor. J. Saudi Chem. Soc. 2018, 22, 372–379. [Google Scholar] [CrossRef]
  43. Douvas, A.M.; Vasilopoulou, M.; Georgiadou, D.G.; Soultati, A.; Davazoglou, D.; Vourdas, N.; Giannakopoulos, K.P.; Kontos, A.G.; Kennou, S.; Argitis, P. Sol-gel synthesized, low-temperature processed, reduced molybdenum peroxides for organic optoelectronics applications. J. Mater. Chem. C 2014, 2, 6290–6300. [Google Scholar] [CrossRef]
  44. Islam, T.; Roy, S.C.; Bayat, S.; Weret, M.A.; Hoffman, J.M.; Rao, K.R.; Sawicki, C.; Nie, J.; Alam, R.; Oketola, O.; et al. Mo3S13 Chalcogel: A High-Capacity Electrode for Conversion-Based Li-Ion Batteries. ChemSusChem 2024, 17, e202400084. [Google Scholar] [CrossRef]
  45. Wu, H.; Lian, K. The Development of Pseudocapacitive Molybdenum Oxynitride Electrodes for Supercapacitors. ECS Trans. 2014, 58, 67–75. [Google Scholar] [CrossRef]
  46. Nosaka, Y.; Nosaka, A.Y. Generation and Detection of Reactive Oxygen Species in Photocatalysis. Chem. Rev. 2017, 117, 11302–11336. [Google Scholar] [CrossRef]
  47. Ramalho, T.C.; Oliveira, L.C.A.; Carvalho, K.T.G.; Souza, E.F.; Da Cunha, E.F.F.; Nazzaro, M. Catalytic behavior of niobia species on oxidation reactions: Insights from experimental and theoretical models. J. Mater. Sci. 2008, 43, 5982–5988. [Google Scholar] [CrossRef]
  48. Molla, A.; Sahu, M.; Hussain, S. Under dark and visible light: Fast degradation of methylene blue in the presence of Ag-In-Ni-S nanocomposites. J. Mater. Chem. A 2015, 3, 15616–15625. [Google Scholar] [CrossRef]
  49. Wolski, L.; Sobańska, K.; Walkowiak, A.; Akhmetova, K.; Gryboś, J.; Frankowski, M.; Ziolek, M.; Pietrzyk, P. Enhanced adsorption and degradation of methylene blue over mixed niobium-cerium oxide—Unraveling the synergy between Nb and Ce in advanced oxidation processes. J. Hazard. Mater. 2021, 415, 125665. [Google Scholar] [CrossRef]
  50. Filho, J.B.G.; Almeida, L.D.; Victória, H.F.V.; Gomes, G.H.M.; Krambrock, K.; Robles-Azocar, P.A.; Pereira, M.C.; Oliveira, L.C.A. Niobium Oxides: The key role of hydroxylated surface on photocatalytic driven C–C reductive coupling of acetophenone. J. Catal. 2024, 436, 115580. [Google Scholar] [CrossRef]
  51. Buettner, G.R. Spin Trapping: Esr Parameters of Spin Adducts. Free Radic. Biol. Med. 1987, 3, 259–303. [Google Scholar] [CrossRef]
  52. Filho, J.B.G.; Gomes, G.H.M.; Silva, I.F.; Rios, R.D.F.; Victória, H.F.V.; Krambrock, K.; Pereira, M.C.; Oliveira, L.C.A. Photocatalytic reduction of levulinic acid using thermally modified niobic acid. Chem. Eng. J. 2022, 450, 1385–1394. [Google Scholar] [CrossRef]
  53. Filho, J.B.G.; Silva, I.F.; Alafandi, M.; Rabeah, J. Aerobic Oxidation of 5-Hydroxymethylfurfural (HMF) in Aqueous Medium over Fe-Doped-Poly(heptazine imide) Photocatalysts: Unveiling the Bad Role of Hydroxyl Radical Generation on the Catalytic Performance. Molecules 2023, 28, 8077. [Google Scholar] [CrossRef]
  54. JFilho, B.G.; Rios, R.D.F.; Bruziquesi, C.G.O.; Ferreira, D.C.; Victória, H.F.V.; Krambrock, K.; Pereira, M.C.; Oliveira, L.C.A. A promising approach to transform levulinic acid into γ-valerolactone using niobic acid photocatalyst and the accumulated electron transfer technique. Appl. Catal. B Environ. 2021, 285, 119814. [Google Scholar] [CrossRef]
  55. Taiwo, F.A. Mechanism of tiron as scavenger of superoxide ions and free electrons. Spectroscopy 2008, 22, 491–498. [Google Scholar] [CrossRef]
  56. Alotaibi, M.A.; Alharthi, A.I.; Qahtan, T.F.; Alotibi, S.; Ali, I.; Bakht, M.A. Green synthesis of xanthene derivatives through visible light-driven photocatalysis using blackberry dye-sensitized TiO2. J. Alloys Compd. 2024, 978, 173388. [Google Scholar] [CrossRef]
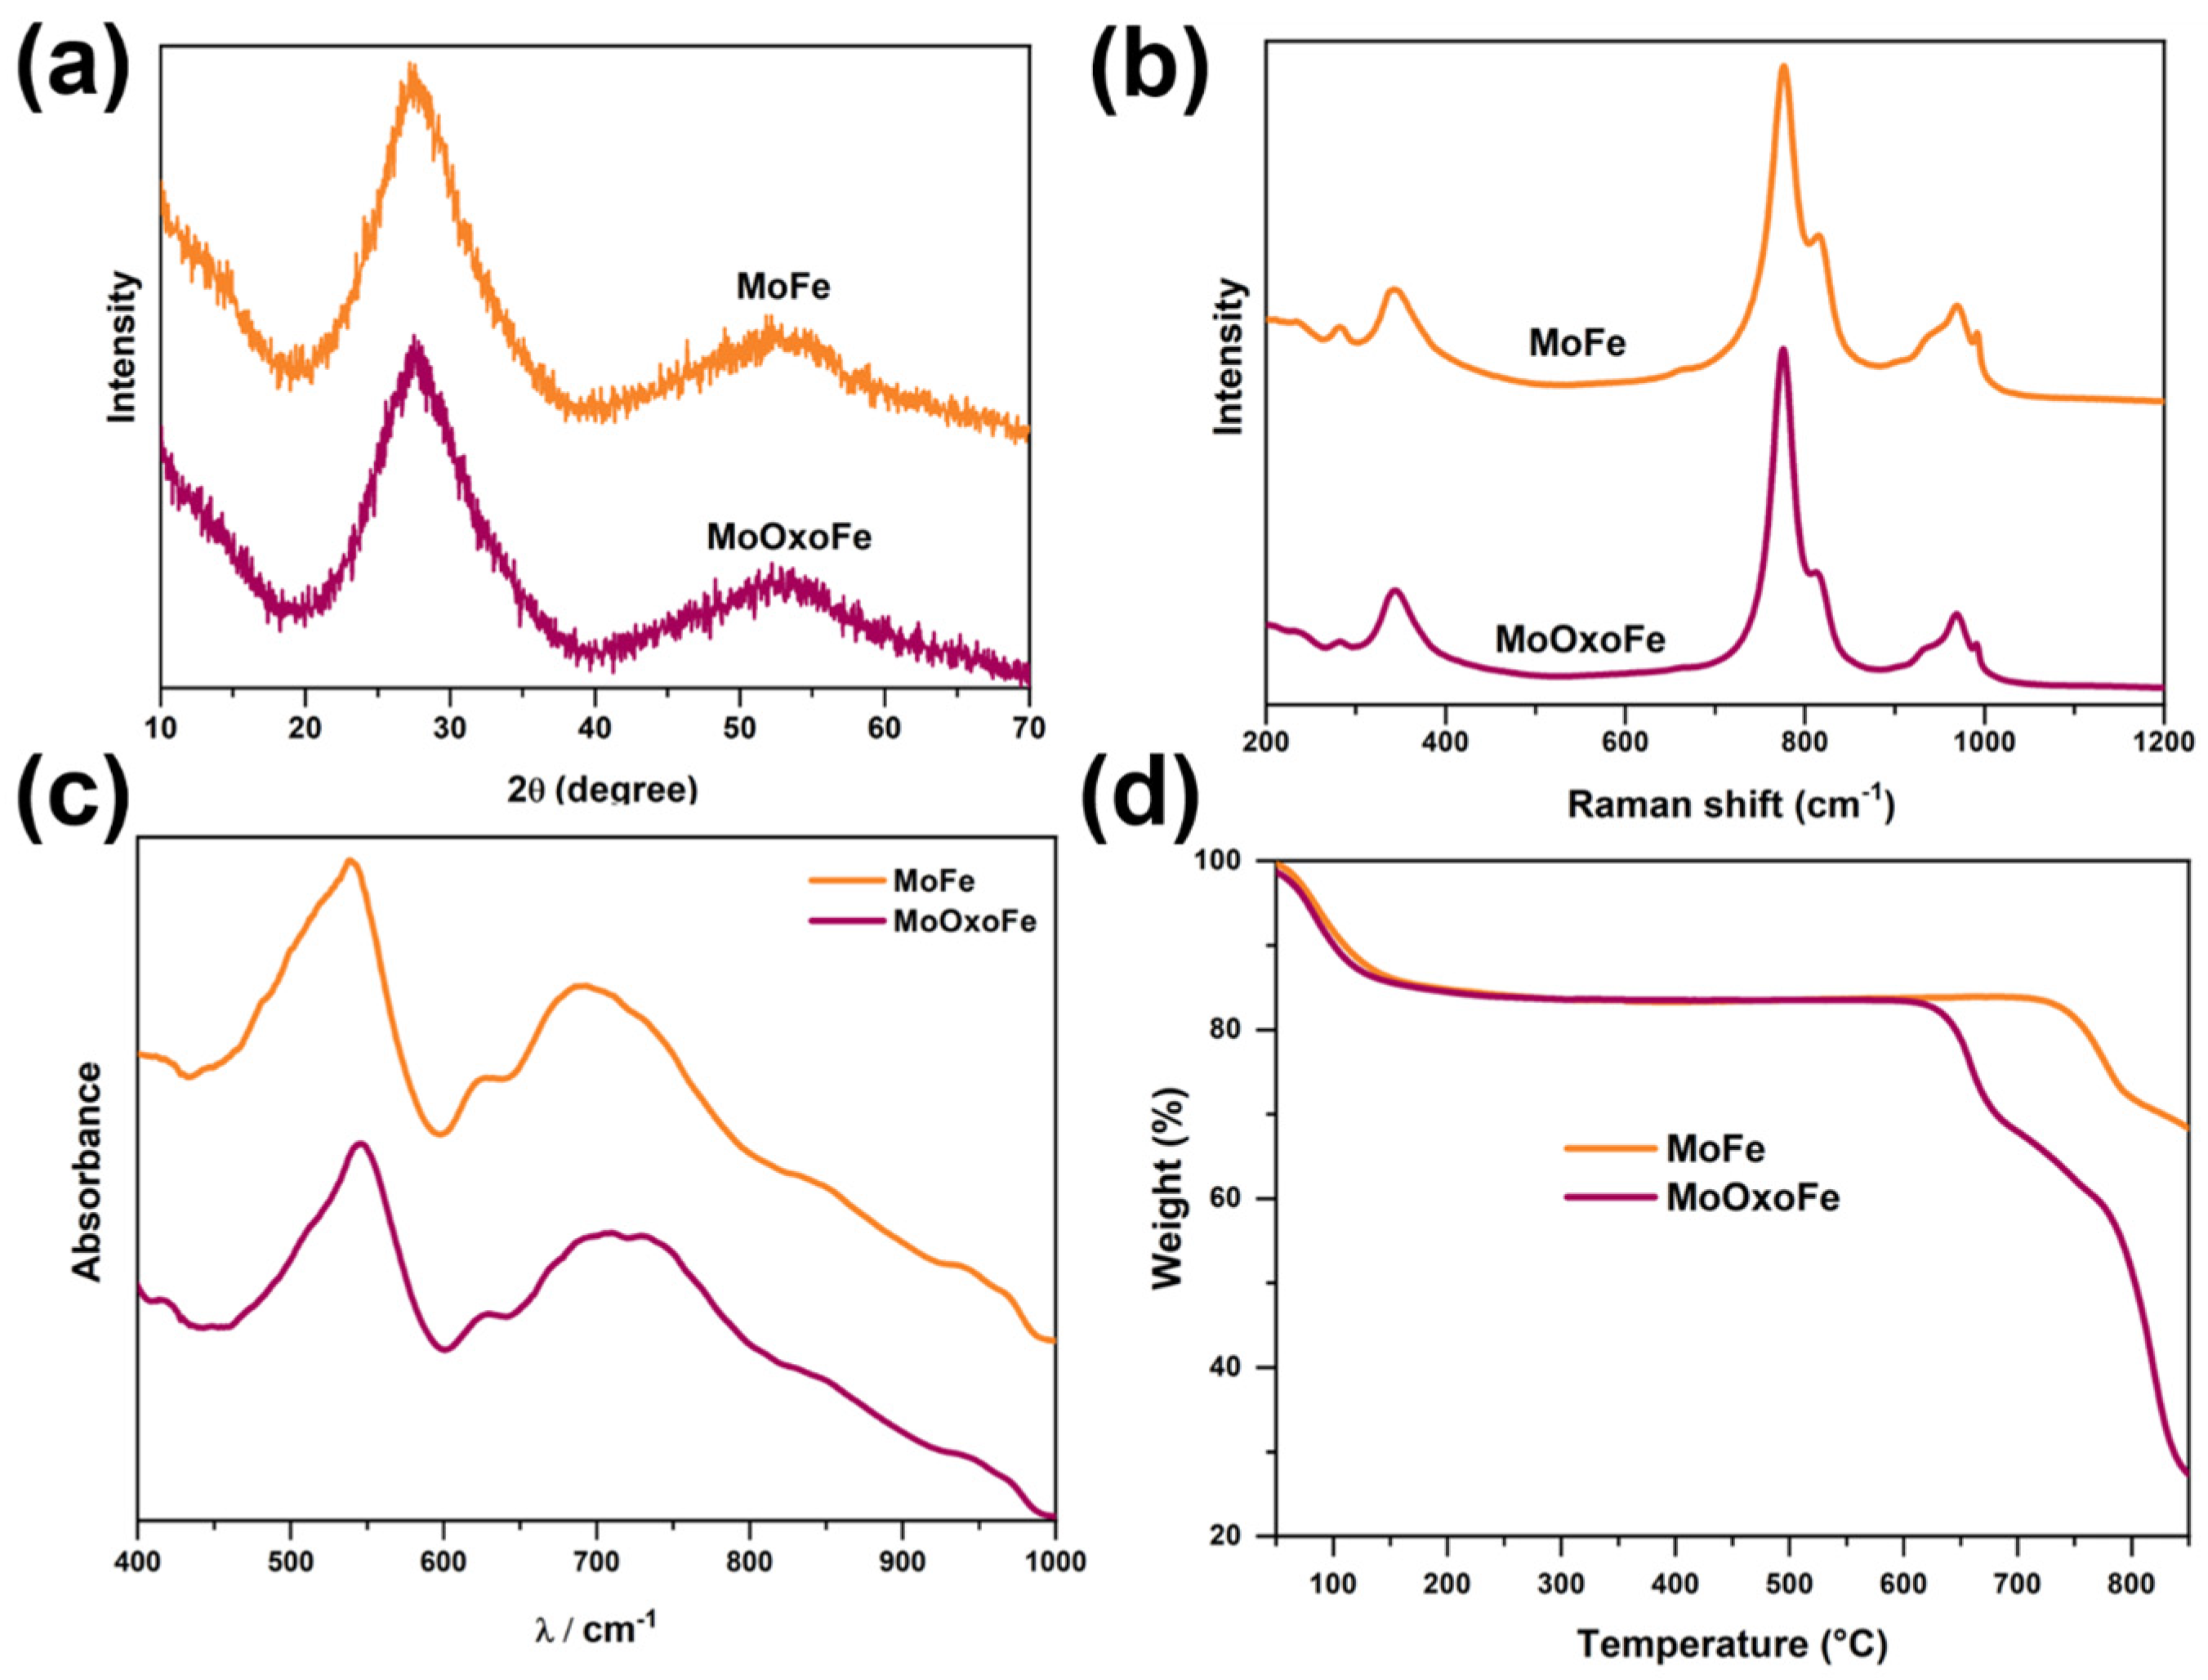
Figure 1. X-ray diffractometry (a), Raman spectroscopy (b), FTIR-ATR spectra (c), and thermogravimetric analysis of iron molybdates (d).
Colorants 04 00014 g001
Figure 2. Kubelka-Munk function (a) and the 1st derivative of the DRS spectra (b) for MoFe and MoOxoFe. XPS spectra of O 1s (c) and Mo 3d (d) showing MoFe, MoOxoFe, and MoOxoFe with an extra loading of H2O2.
Colorants 04 00014 g002
Figure 3. Transmission electron microscopy images, in different magnifications, for MoOxoFe (a,c) and for MoFe (b,d).
Colorants 04 00014 g003
Figure 4. Photocatalytic tests for (a) MB and (b) quinoline removal and (c) hydrogen evolution.
Colorants 04 00014 g004
Figure 5. EPR spectra comparing MoOxoFe, MoOxoFe-MB, and adding Tiron in the MoOxoFe-MB test (a). Experimental and simulated EPR spectra for PBN (b). High-resolution O 1s (c) and Mo 3d (d) XPS spectra of MoOxoFe and MoOxoFe-MB.
Colorants 04 00014 g005
Figure 6. Production of the α-hydroxyethyl radical by the photogenerated hole, also resulting in the release of a proton and the subsequent capture of this radical by the spin trapping agent PBN.
Colorants 04 00014 g006
Figure 7. Schematic representation summarizing the synergism between MoOxoFe and methylene blue (MB).
Colorants 04 00014 g007
Disclaimer/Publisher’s Note: The statements, opinions and data contained in all publications are solely those of the individual author(s) and contributor(s) and not of MDPI and/or the editor(s). MDPI and/or the editor(s) disclaim responsibility for any injury to people or property resulting from any ideas, methods, instructions or products referred to in the content.