Article

Optical Characterization of Fluorescent Chitosan-Based Carbon Dots Embedded in Aqueous Natural Dye

Grupo de Propriedades Ópticas e Térmicas de Materiais (GPOTM), Instituto de Física, Universidade Federal de Uberlândia—UFU, Av. João Naves de Ávila 2121, CEP 38.400-902, Uberlândia 38400-902, MG, Brazil
*
Author to whom correspondence should be addressed.
Colorants 2024, 3(4), 269-281; https://doi.org/10.3390/colorants3040019
Submission received: 31 August 2024 / Revised: 10 October 2024 / Accepted: 14 October 2024 / Published: 21 October 2024
(This article belongs to the Special Issue Feature Papers in Colorant Chemistry)

Abstract

:
(1) Background: This work evaluated the optical characterization of aqueous fluorescent chitosan-based carbon dots (or carbon nanoparticles CNPs) embedded in natural dye for potential functional packaging applications. Chitosan-based materials are nontoxic, biodegradable, biocompatible, bactericidal, and produced from renewable polymer sources. Anthocyanins are pigments of different colors with a large range of potential applications, such as in bioindicators and biomonitoring; (2) Methods: The CNPs were synthetized in aqueous solutions using chitosan as a carbon source. The natural dye was extracted from the leaves of Tradescantia pallida Purpurea in aqueous solutions. The fluorescence quantum efficiency (η) and fluorescence lifetime (τ) were determined using the mode-mismatched pump–probe thermal lens (TL) technique and time-resolved fluorescence lifetimes (TRFL) measurements, respectively; (3) Results: The η and τ were measured for CNPs embedded in natural dye solution at different concentrations (5.2, 12.09, and 21.57 mass percentage composition). The η and τ photophysical parameters obtained for CNPs embedded in natural dye were compared with those of other CNPs synthesized using different carbon sources, such as leaves, seeds, and protein; (4) Conclusions: Fluorescence spectra and time-resolved fluorescence measurements corroborate the TL results, and relatively high values of η were obtained for the CNP synthesized and embedded in natural dye.

Graphical Abstract

1. Introduction

Chitosan-based materials have been widely reported in different applications in agriculture, pharmacy, biomedical applications, and environmental protection due to chitosan being nontoxic, biocompatible, biodegradable, and exhibiting antimicrobial, bactericidal, and antioxidant properties [1,2,3,4,5]. Chitosan is a polysaccharide biopolymer reported to be acquired through the chemical alkaline deacetylation of chitin present in algae and the exoskeletons of arthropods (such as crustaceans and insects), it is also found naturally in limited quantities in some fungi [2,3,5]. Chitosan solutions are fluorescent materials, and fluorescence quantum efficiency (η) enhancement has been obtained for chitosan-based carbon nanoparticles (CNPs) synthesized using heat treatment [6,7,8,9]. Synthesized fluorescent CNPs exhibit low cytotoxicity, and excellent biocompatibility [10,11]. In addition, CNPs can attach to specific cells and enter cells without or with additional functionality, enhancing research in applications such as biosensing, cell mapping, nanodrug carriers, electrochemical imaging, and antifungal and antibacterial activities [6,9,10,11,12]. Moreover, the antifungal properties of chitosan can be enhanced with different additives, such as essential oils, natural dyes, and/or metallic nanoparticles [13,14].
Anthocyanin is a natural dye belonging to the family of flavonoids that exhibits a variety of colors like orange, pink, violet, and blue, and is found in different plants, flowers, fruits, and tubers [15,16,17]. This natural dye has various possible applications in health, the pharmaceutical industry, food processing, solar cell development, and the potential of hydrogen (pH) indicators [16,18,19,20]. Moreover, anthocyanin is reported to have fungicidal properties on necrotrophic fungi, such as Fusarium and Colletotrichum [21], and bactericidal effects against the proliferation of E. coli [22]. On the other side, the development of biomaterials prepared with carbon dots embedded in natural dye for colorful and functional packaging is in progress, and recently, several films have been proposed as food spoilage indicators and food packaging to extend food shelf life [23,24,25,26,27]. Highly fluorescent carbon dots developed from green synthesis and embedded into natural dye for fluorometric probes show relevant potential for applications in food coatings and functional packaging. Smart food packaging applications have been reported, with carbon dots synthesized using rose petal waste as a carbon source and anthocyanin in carrageenan-based functional films to monitor the freshness of minced pork and shrimp [25]. In addition, carbon dots doped with TiO2 were used with anthocyanin, obtained from the residue of sweet potato peels, for carrageenan-based active and pH-dependent films. These films were used for packaging and monitoring the freshness of shrimp, highlighting their potential in preserving the quality and indicating shrimp spoilage [23].
The present work reports on the spectroscopic and optical characterizations of the synthesized CNPs embedded in natural dye extracted from leaves of Tradescantia pallida Purpurea [28,29] at different ratios for possible bioapplications. The thermal lens (TL) technique was applied for the determination of fluorescence quantum efficiency (η). Fluorescence spectra and fluorescence lifetime (τ) were also measured to corroborate the TL results obtained for chitosan-based materials. The photophysical parameters τ and η were compared with results obtained for other CNPs synthesized from leaves, seeds, and/or protein for bioapplications. The leaves of Tradescantia pallida Purpurea are an excellent source of anthocyanins [20,28,29], and CNPs are characterized individually and point out possible interactions between natural dye agents with the goal of intensifying their properties as possible antifungal and/or bactericidal agents for potential smart food packaging applications [13,20,21].

2. Materials and Methods

2.1. Sample Preparation

Chitosan solutions were prepared by diluting 2 g of low molecular weight Sigma-Aldrich chitosan in 100 mL of 2% acetic acid aqueous solutions. The mixture was placed in a magnetic stirrer for 6 h and then centrifuged for 30 min, resulting in a liquid with high viscosity and yellowish coloration. Chitosan-based carbon nanoparticles (CNPs) were synthesized by hydrothermal–pyrolysis carbonization method by diluting 2 g of low molecular weight chitosan in 18 mL of 2% acetic acid aqueous solutions. The sample was subjected to magnetic stirring for 6 h and heated in a porcelain crucible at 180 °C for 10 h [7]. The result was a solid, hard mass that was macerated for 20 min. Subsequently, the sample was diluted in 2% acetic acid in a proportion of 6.5 mg of CNP in 9.6 mL of aqueous acetic acid solution. For the analysis, the CNP solutions were passed through a 450 nm filter, followed by another filter with 220 nm pores.
Anthocyanin was extracted from the leaves of Tradescantia pallida Purpurea collected from the city of Uberlândia (state of Minas Gerais, Brazil) with a similar size (11.7 ± 0.2) cm and color. The leaves were washed with tap and distilled water [20,21]. Afterward, approximately 20 leaves were cut into thin strips and dehydrated for 1.5 h at 400 W (54 ± 3) °C. An analytical balance (Model AUW220D—Shimadzu Brazil, Barueri, SP, Brazil) was used to determine the powder mass (8 g). Next, the leaves were manually macerated (at room temperature) using a mortar and pestle for approximately twenty minutes with 20 mL of distilled water. The mixture was then sieved and filtered twice with a paper filter to obtain the dye solution. The aqueous dye was centrifuged for 1.5 h at 7200 rpm (BioPet Model 8011154, Biosigma, SP, Brazil). Then, the samples were stored and refrigerated (~5 °C).
The CNP aqueous solution (0.11 g/mL) was called the SCNP sample, the Santh sample is an anthocyanin aqueous solution (0.4 g/mL), and for CNP embedded in anthocyanin in aqueous solutions, the ratios used were 5.2, 12.09, and 21.57 mass percentage composition (% by mass) of CNPs for samples called S1, S2, and S3, respectively.

2.2. Spectroscopic and Optical Techniques

Absorbance measurements were performed with a 2 mm quartz cuvette using an EvolutionTM 201 UV-visible spectrometer (Model UV-1650 PC, Shimadzu). Fluorescence spectra (with excitation wavelength at 514.5 nm from argon laser at power Pe = 40 mW) were obtained using a portable spectrometer from Thorlabs. Fluorescence in the function of wavelength (330–560 nm) was performed using Shimadzu RF-5301 PC Spectrofluorophotometer. Fourier transform infrared (FTIR) spectroscopy was performed using a Perkin-Elmer Frontier spectrometer (Perkin-Elmer, Waltham, MA, USA) with a resolution of 2 cm−1. Atomic force microscopy (AFM) imaging of the CNPs was recorded at room temperature with a scanning probe microscope (SPM-9600, Shimadzu). Time-resolved fluorescence lifetimes (TRFL) measurements were performed using a light source PLS 450 LED with λ = (460 ± 10) nm, 40 μW average power at 40 MHz and 800 ps. TRFL results for liquid samples were analyzed using the FluoTime 100 time-resolved fluorescence spectrometer from PicoQuant (Berlin, Germany) using a 1 cm thick quartz cuvette [20,30]. A Ludox solution was used as a scattering sample for prompt measurement [20,30,31]. X-ray powder diffraction (XRD) measurements (LabX XRD-6000 Shimadzu X-ray diffractometer) were performed using a copper target with a voltage of 40 KV and a current of 30 mA.

2.3. Thermal Lens (TL)

TL behavior occurs when an excitation laser beam (with wavelength λe) passes through a liquid sample (cuvette with thickness L), and the absorbed energy is converted into heat. The solution’s refractive index is modified by heating, which causes a thermally induced phase change [32,33]. In the continuous wave (CW) excitation regime, the variation in the probe beam (with wavelength λp) on-axis intensity I(t) at the central part of the probe laser beam can be expressed as follows [32]:
I t = I 0 1 θ 2 tan 1 2   m V 1 + 2 m 2 + V 2 τ c 2 t + 1 + 2 m + V 2 2 ,
where I(0) is the on-axis intensity when t or θ is zero. The parameter τc = we2/4D is the characteristic thermal time constant, where D = K/ρC is the thermal diffusivity (cm2/s), K is the thermal conductivity (W/cmK), ρ is the density (g/cm3), and C is the specific heat (J/gK). The parameter m = (wp/we)2, where we and wp are the excitation and probe beam radii at the sample position, respectively. Here, the parameter V ≈ z1/zc when zc << z2, where z2 (cm) is the distance between the sample and TL detector, z1 is the distance between the sample and probe beam waist, and zc = πwop2p is the confocal distance of the probe beam, where wop is the probe beam radius at the focus with wavelength λp.
In the dual-beam mode-mismatched configuration (pump and probe beams), the TL transient signal amplitude (θ), induced by the pump beam, is approximately the phase difference of the probe beam between r = 0 and r = 2 we, expressed as follows [30,34]:
θ = P e α L e f f K λ p φ d n d T
where Pe is the power of the excitation beam, α (cm−1) is the optical absorption coefficient at the excitation wavelength (λe), Leff = (1 − Exp(−αL))/α is the sample effective length, dn/dT is the temperature coefficient of refractive index and φ is the fraction of photon energy that is converted into heat. The propagation of a probe laser beam through the TL will result in either the spreading (dn/dT < 0) or focusing (dn/dT > 0) of the beam. The fluorescence quantum efficiency (η) or quantum yield, could be determined in this form:
η = ( 1 φ ) < λ e m > / λ e
where <λem> is the average emission wavelength. In this study, a diode laser at 532 nm and an He-Ne laser at 632.8 nm were used as excitation and probe beams, respectively. The parameters V = 1.74 and m = 7.87 were used in mode-mismatched configuration.

3. Results and Discussions

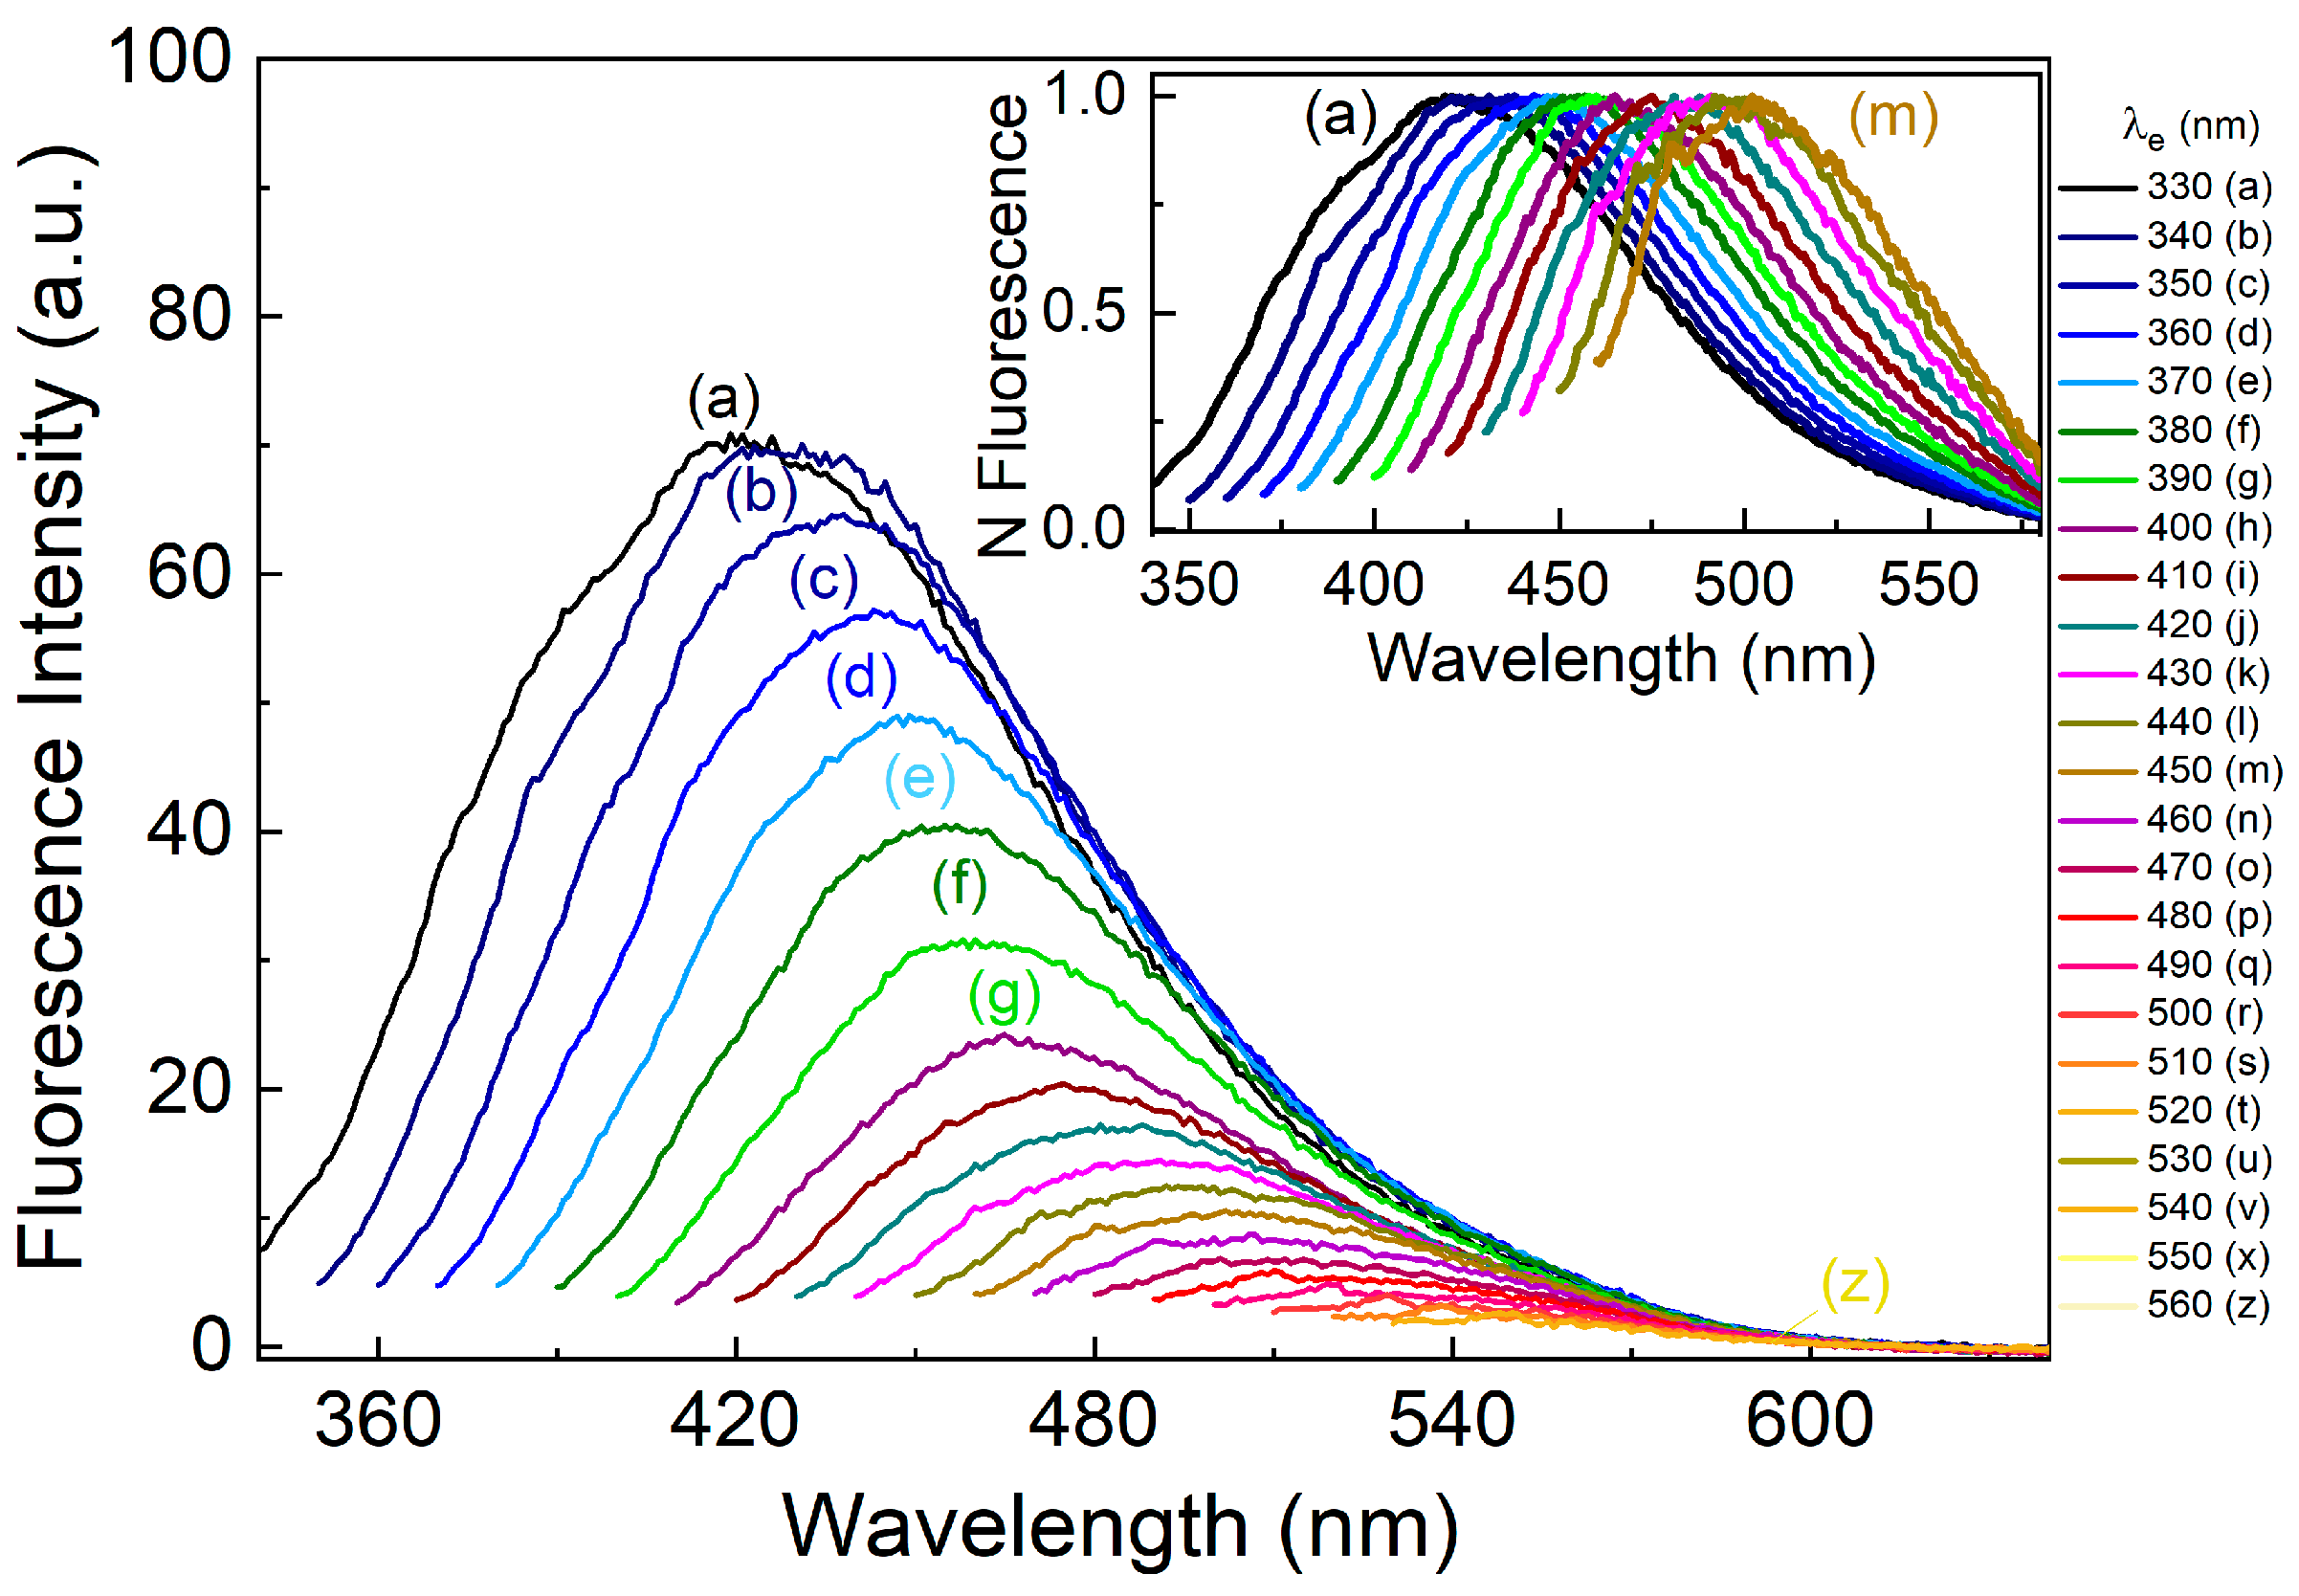
Figure 1 presents the absorbance spectra for CNP aqueous solutions (SCNP), natural dyes inserted in CNP solutions (S1, S2, and S3), and natural dyes (Santh) extracted from the leaves of Tradescantia pallida Purpurea. For CNP, the band at ~280 nm is typical that of carbon dots obtained from different materials, and this band is attributed to be π-π* conjugate transition of the C=C sp2 bond in the carbon core of chitosan-based CNP [7,9]. On the other hand, the typical absorption bands for natural dye were observed at (509 ± 1), (544 ± 1), and (585 ± 1) nm (Figure 1b–e). These bands agree with the values reported for the anthocyanin natural dye extracted from Tradescantia pallida in different solvents, such as aqueous solutions, ethanol, and acetone [21,35,36]. The typical absorption bands observed in the (500–590) nm region, mainly at 585 nm, are attributed to B-ring substituted anthocyanins with a quinonoidal base structure [36,37,38]. The B-ring substituted anthocyanins completely converted to the quinoidal base are reported at pH~5.5 [36,37], and this structure is associated with color stability proprieties due to complex acylation patterns [38]. In addition, Figure 1 presents the fluorescence of the chitosan-based carbon dots nanoparticles SCNP (Figure 1f), and the peak fluorescence is ~583 nm when the sample is excited at 514.5 nm. Figure 2 presents the fluorescence spectra for SCNP at different excitation wavelengths (λe = 330–560 nm). The inset presents normalized fluorescence spectra, and a typical fluorescence shift is reported for carbon dots [7,9,10,11]. This excitation-dependent relationship of the fluorescence spectra is attributed to defects in the energy levels produced by surface passivation, and the fluorescence due to recombination radiation from excitons trapped by the defects and multiple transition modes [7,9,11].
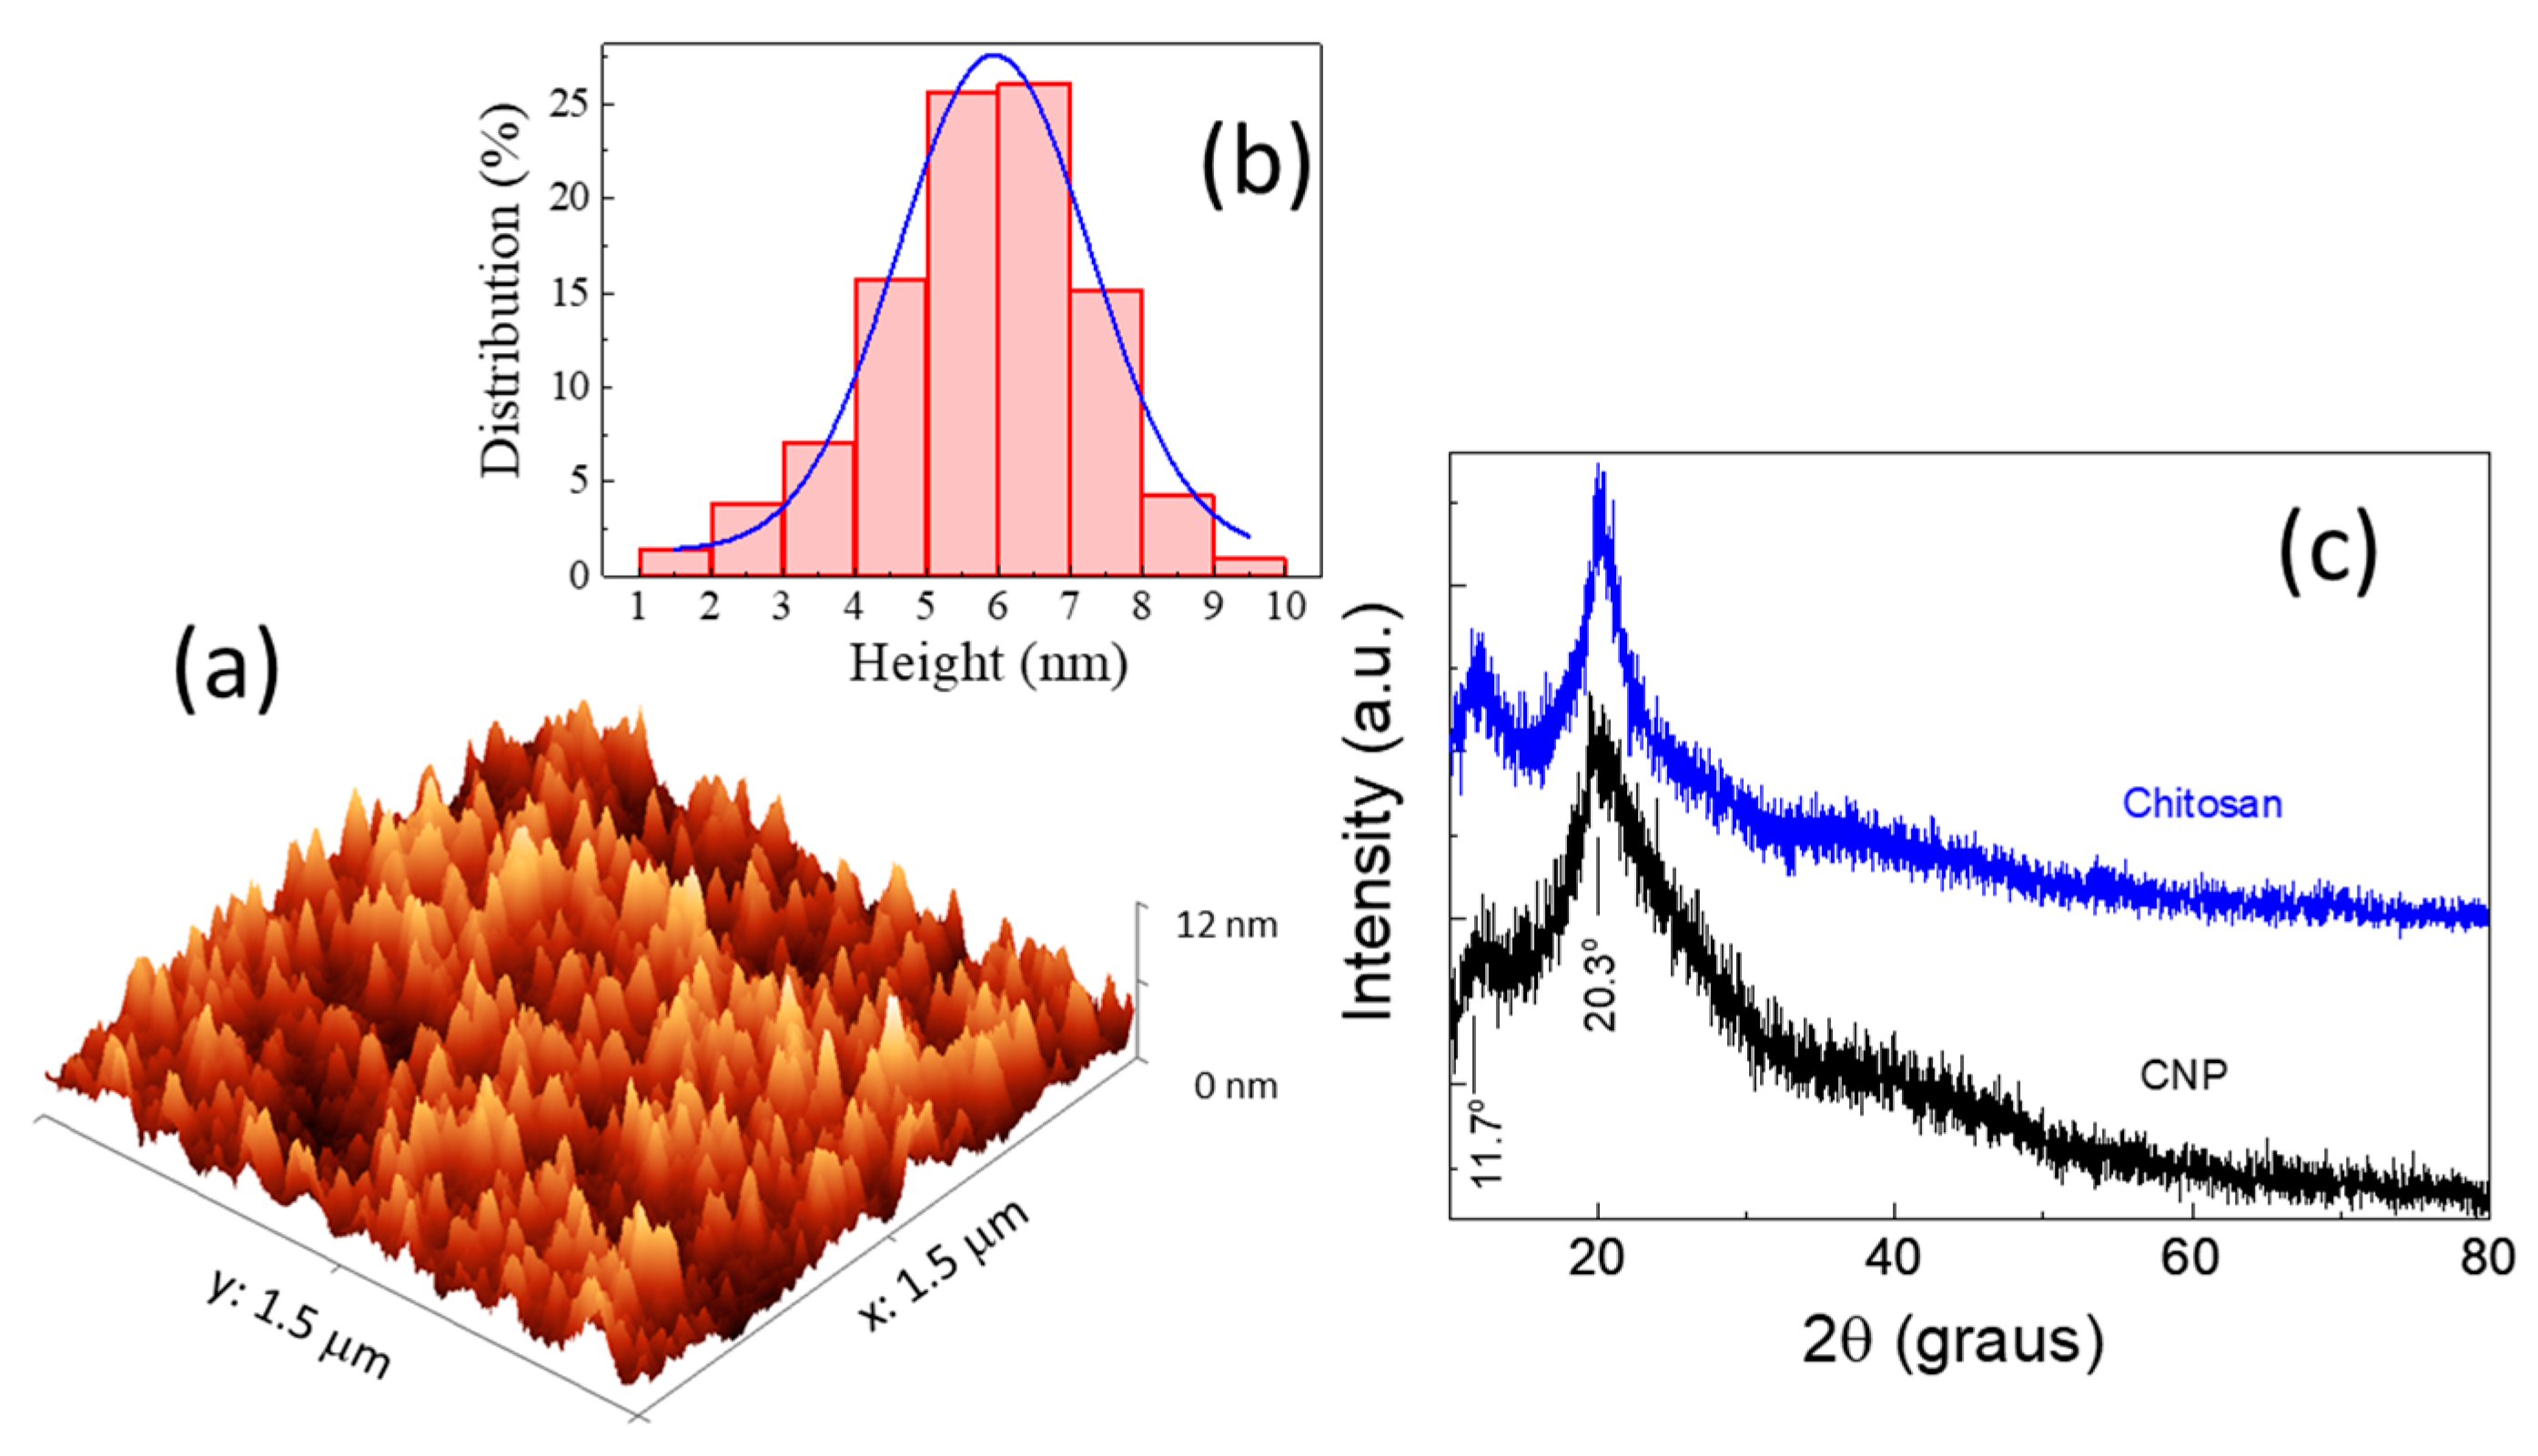
Figure 3a,b presents the AFM results for the chitosan-based carbon nanoparticles SCNP and the height distributions of size measured, respectively. The average size distribution of the CNPs obtained by AFM measurement (Figure 3b) is ~6.0 nm. Figure 3c presents the XRD analysis of chitosan powder and chitosan-based carbon nanoparticles (SCNP) powder. The main crystalline peaks of chitosan occur at 2θ = 20.3° and an amorphous shoulder at 11.7° [7,10]. After hydrothermal–pyrolysis carbonization, a broadened main peak of ~20° is observed, and the crystallinity of the material decreases due to its amorphous nature [7,10]. For carbon dots synthesized using dextrin, a single peak observed at ~24° was attributed to the graphitic nature of the carbon [39]. CNPs obtained from Trapa bispinosa peel as carbon research presented the XRD peaks at 2θ = 24.7° and 2θ = 43.3° that were attributed to (002) and (101) diffraction patterns of graphitic carbon, respectively [40]. For carbon dots obtained from banana juice a broad peak at 21.1° due to (002) peak is reported [41], in this case, the interlayer spacing of the carbon dots ~0.42 nm was obtained, higher than that of the graphitic interlayer spacing (~0.33 nm). A larger spacing interlayer than that of bulk graphite has been attributed to poor crystallization [41,42].
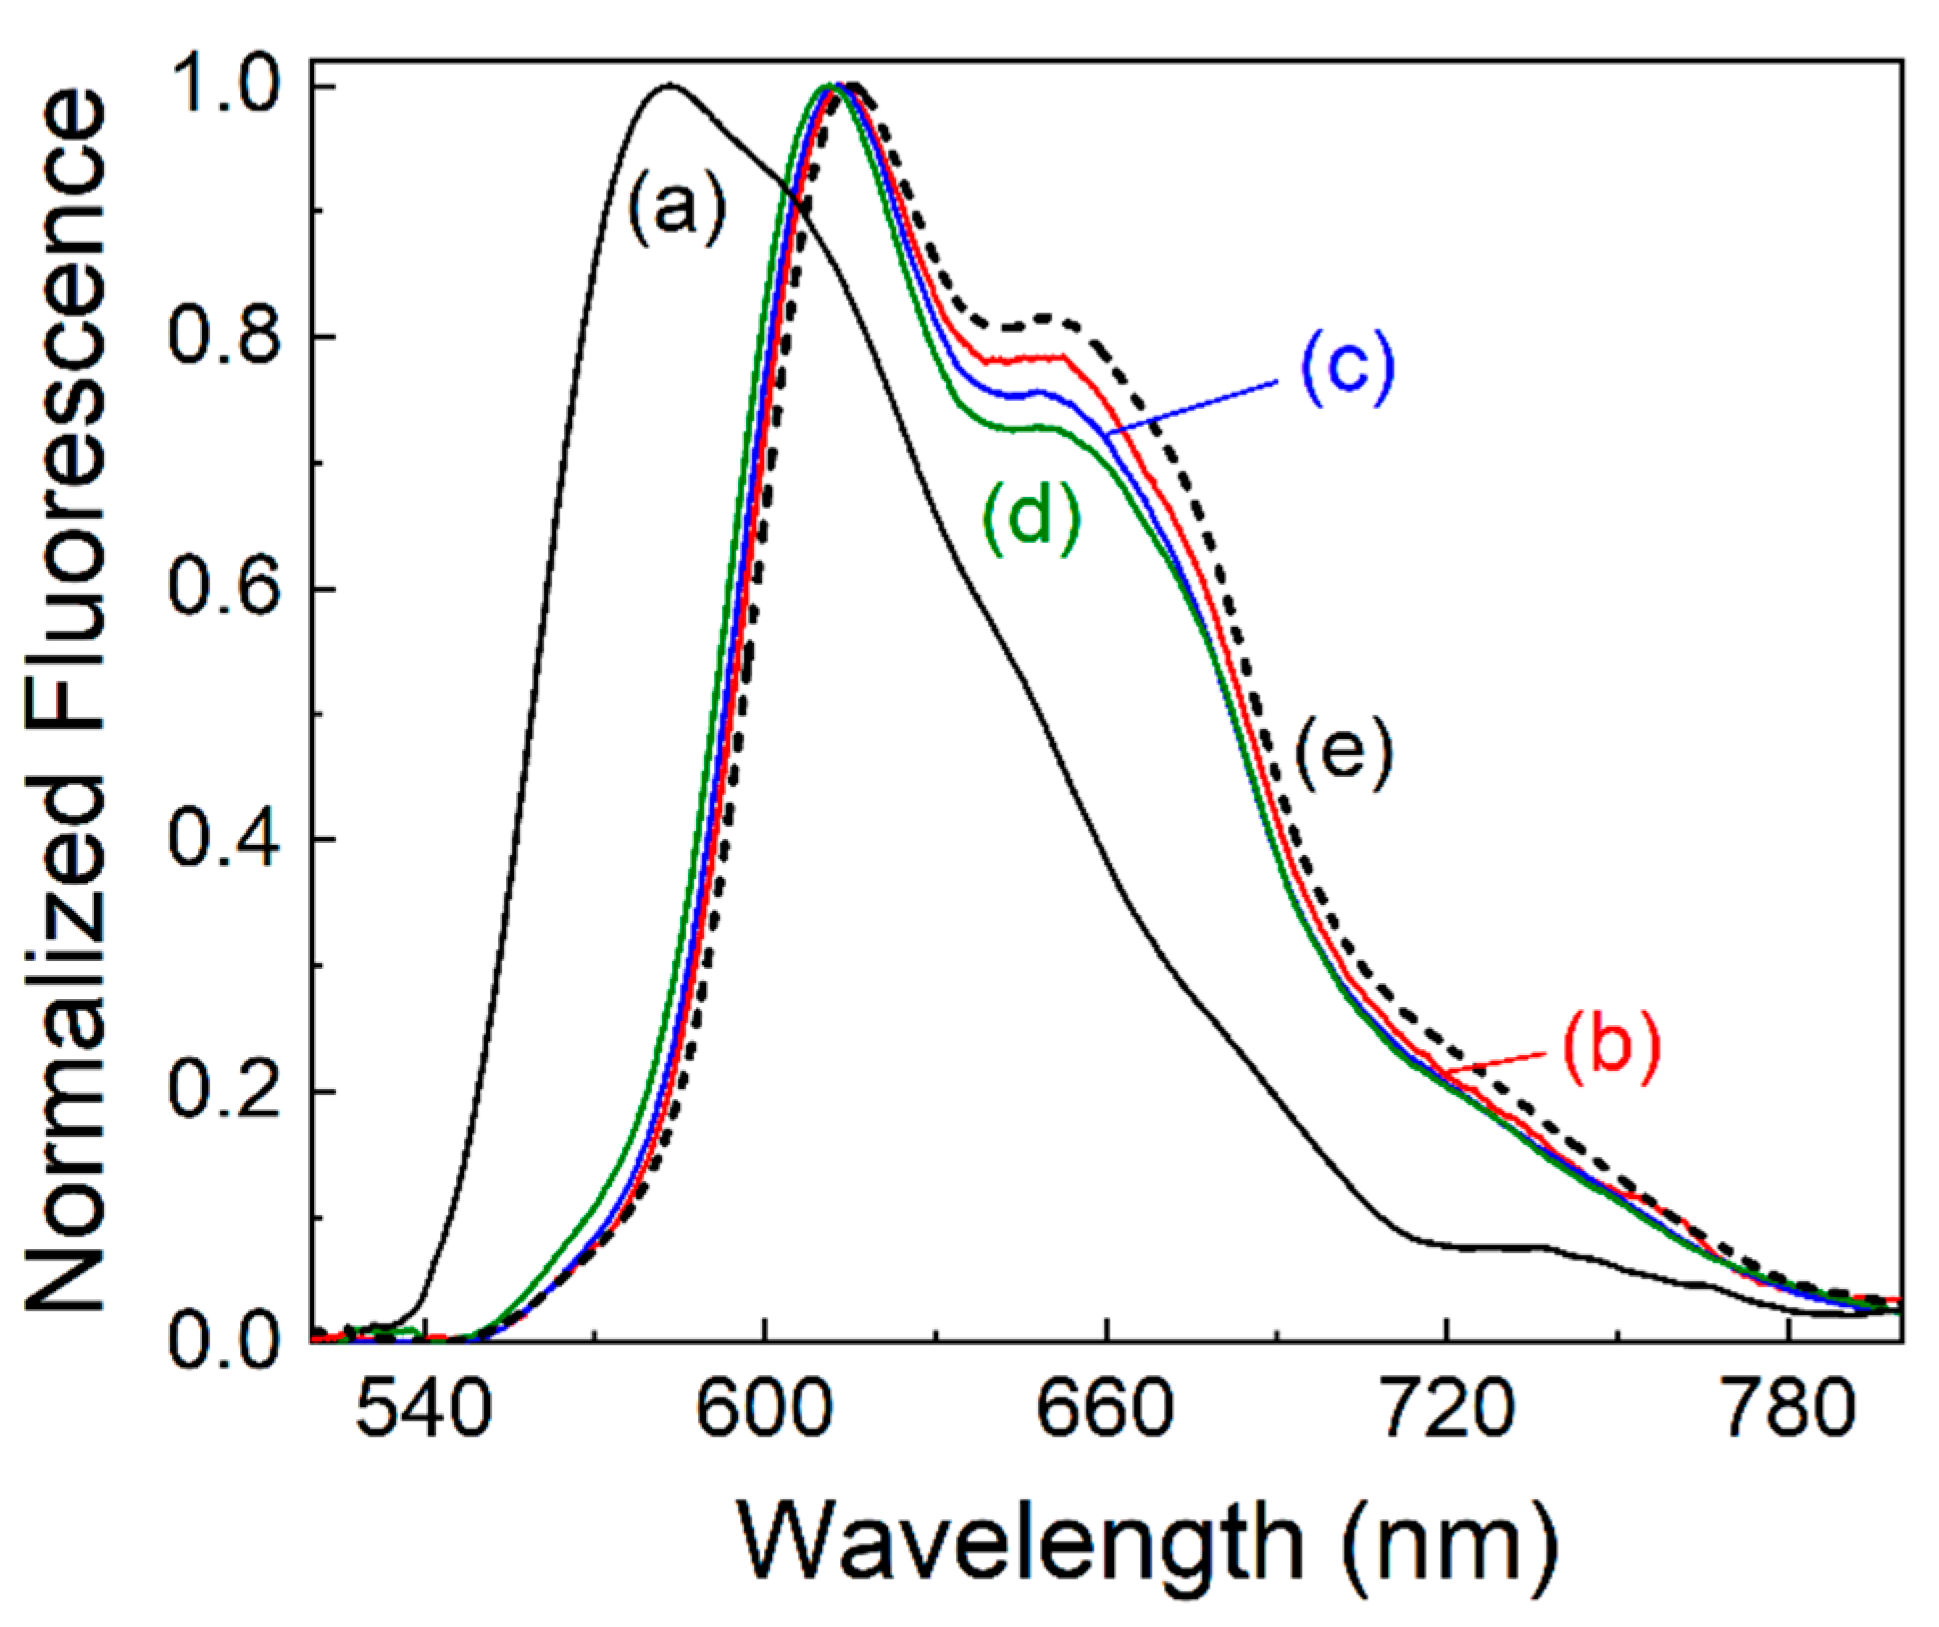
Figure 4 presents the fluorescence spectra at an excitation wavelength of λe = 514.5 nm for the SCNP, Santh, and S1, S2, and S3 samples. The values of <λem> for each natural dye sample (b–e) are presented in Table 1. For SCNP, <λem> = 618 nm was obtained. The peak emission wavelengths obtained for natural dye (Santh) are positioned at 615 nm and 650 nm; for samples S1, S2, and S3, the average peak emission values are localized at (613 ± 1) nm and (650 ± 2) nm. The first peak presents a displacement of 614 to 611 nm with an increased CNP amount. The fluorescence spectra of natural dye extracted from Tradescantia pallida Purpurea in aqueous solutions with different potentials of hydrogen (pH~4–8) and <λem> = (652 ± 3) nm in this pH range were reported [20,21].
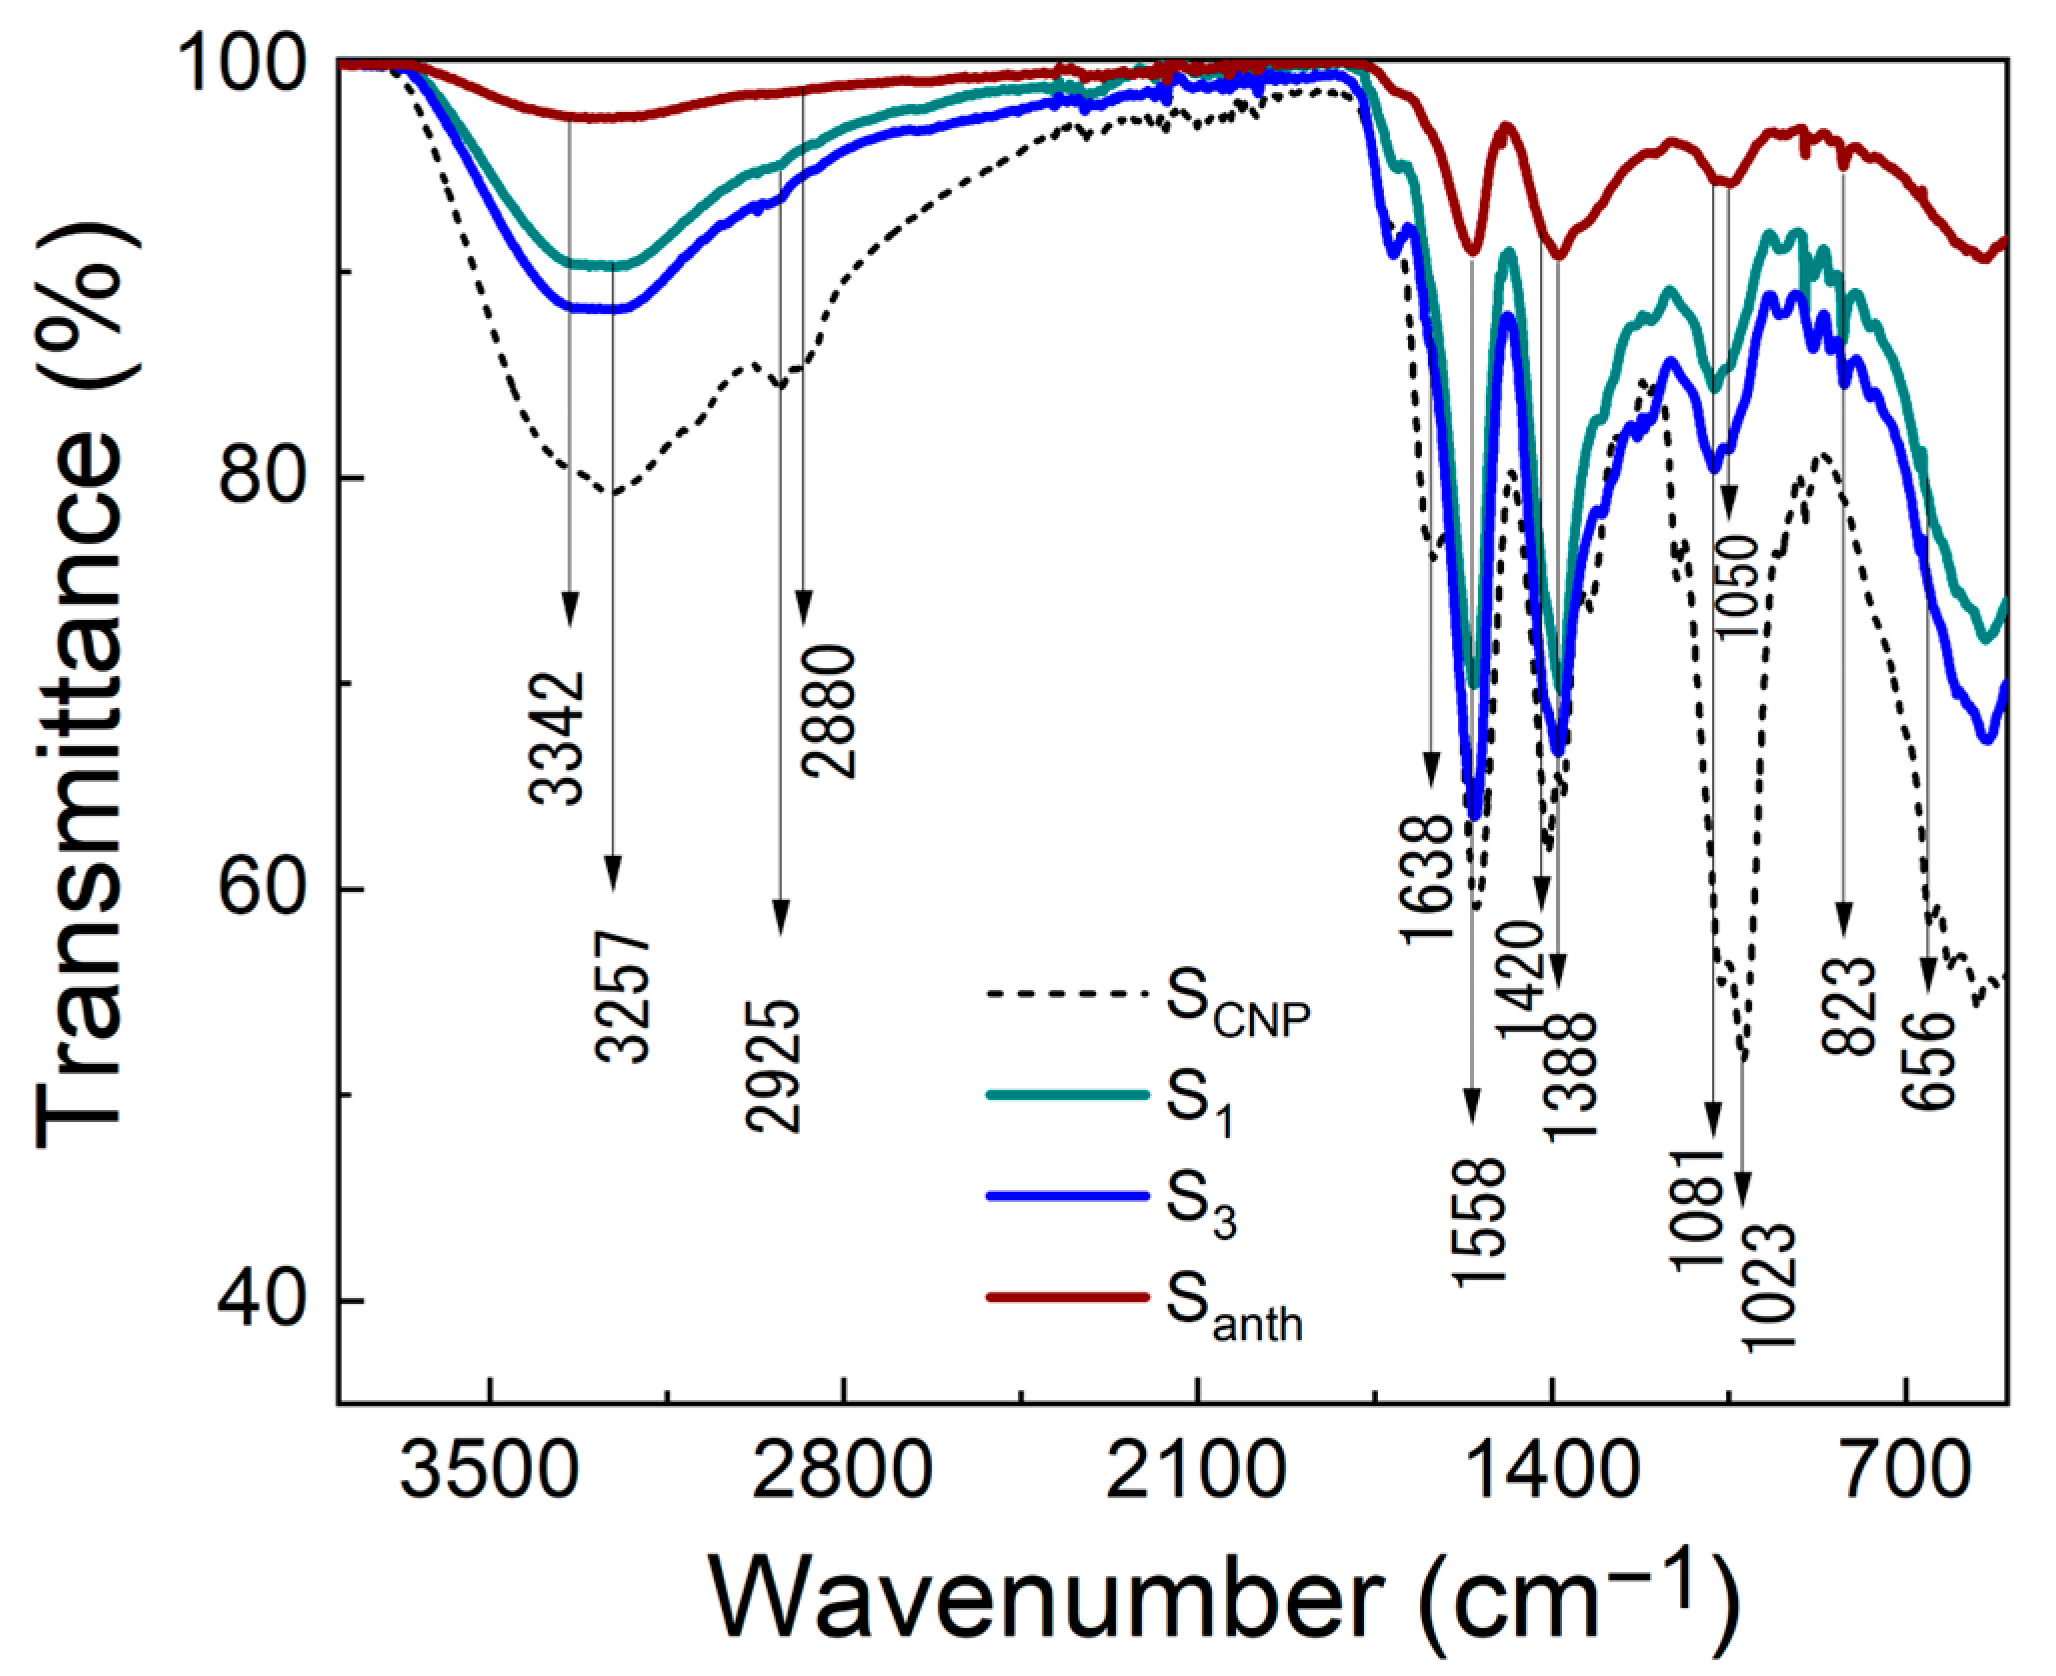
Fourier transform infrared (FTIR) spectra for the CNP derived from chitosan, natural dyes (Santh) extracted from Tradescantia leaves, and S1 and S3 samples are presented in Figure 5. The FTIR spectra show a broad band in the 3500–3100 cm−1 region for the samples analyzed. In this region, the characteristic O−H stretching absorption band (peak at 3342 cm−1) overlaps with the N−H stretching vibrations of the amino group (peak at 3257 cm−1) [7,43,44]. The 2925 and 2880 cm−1 peaks correspond to the symmetric and asymmetric vibrations of CH2, respectively [45]. These peaks can indicate the presence of carbon chains in the CNP structure [45], and in this region are more evident in the CNP samples than in the anthocyanin sample. The absorption peak at 1638 cm−1 is attributed to the C=O (or C=N) vibrations, characterizing the amide functional group vibration [7,45,46,47,48]. This absorption peak at 1638 cm−1 is only evident in the CNP sample. The absorption peak at 1558 cm−1 corresponds to the stretching vibrations in the aromatic rings of carbonyl groups (C=C) or (C=O) for natural dye and it is attributed to the stretching of (C−N) for CNP [20,21,49]. The peak at 1558 cm−1 appears in both samples but is much more intense in the CNP sample. The peak at (1462–1340) cm−1 corresponds to the C−N stretching vibration [48]. This band indicates the presence of nitrogen on the surface of the CNPs [50]. In our samples, a peak was observed at 1420 cm−1. Additionally, the peak at 1388 cm−1 corresponds to the stretching vibrations of C−H rotation [51]. Finally, the 1081 and 1050 peaks can be attributed to the −C−O group [52,53], and 1023 cm−1 peak to the (C−H or C−O) radical group [45]. These peaks suggest that the CNPs and anthocyanins have excellent hydrophility and that the samples can be well dispersed in water due to the presence of −OH and −COOH groups on their surface [53].
On the other hand, for the Santh powder extracted in distilled water, the main vibrational modes were observed at 3342, 1558, 1388, and 1081 cm−1. These bands agree with the peaks reported in references [20,21]. The bands at 823 cm−1 and 656 cm−1 are attributed to ring vibrations C=C−C and to the presence of aromatic C−H bonds [54,55]. In addition, the natural dyes extracted from Tradescantia pallida Purpurea were analyzed using a high-performance liquid chromatography system coupled with a quadrupole time-of-flight high-resolution mass spectrometer, as described in reference Lima et al. [21]. The anthocyanin structures consist mainly of cyanidin, three glucose molecules, arabinose and three ferulic molecules [21,28,29].
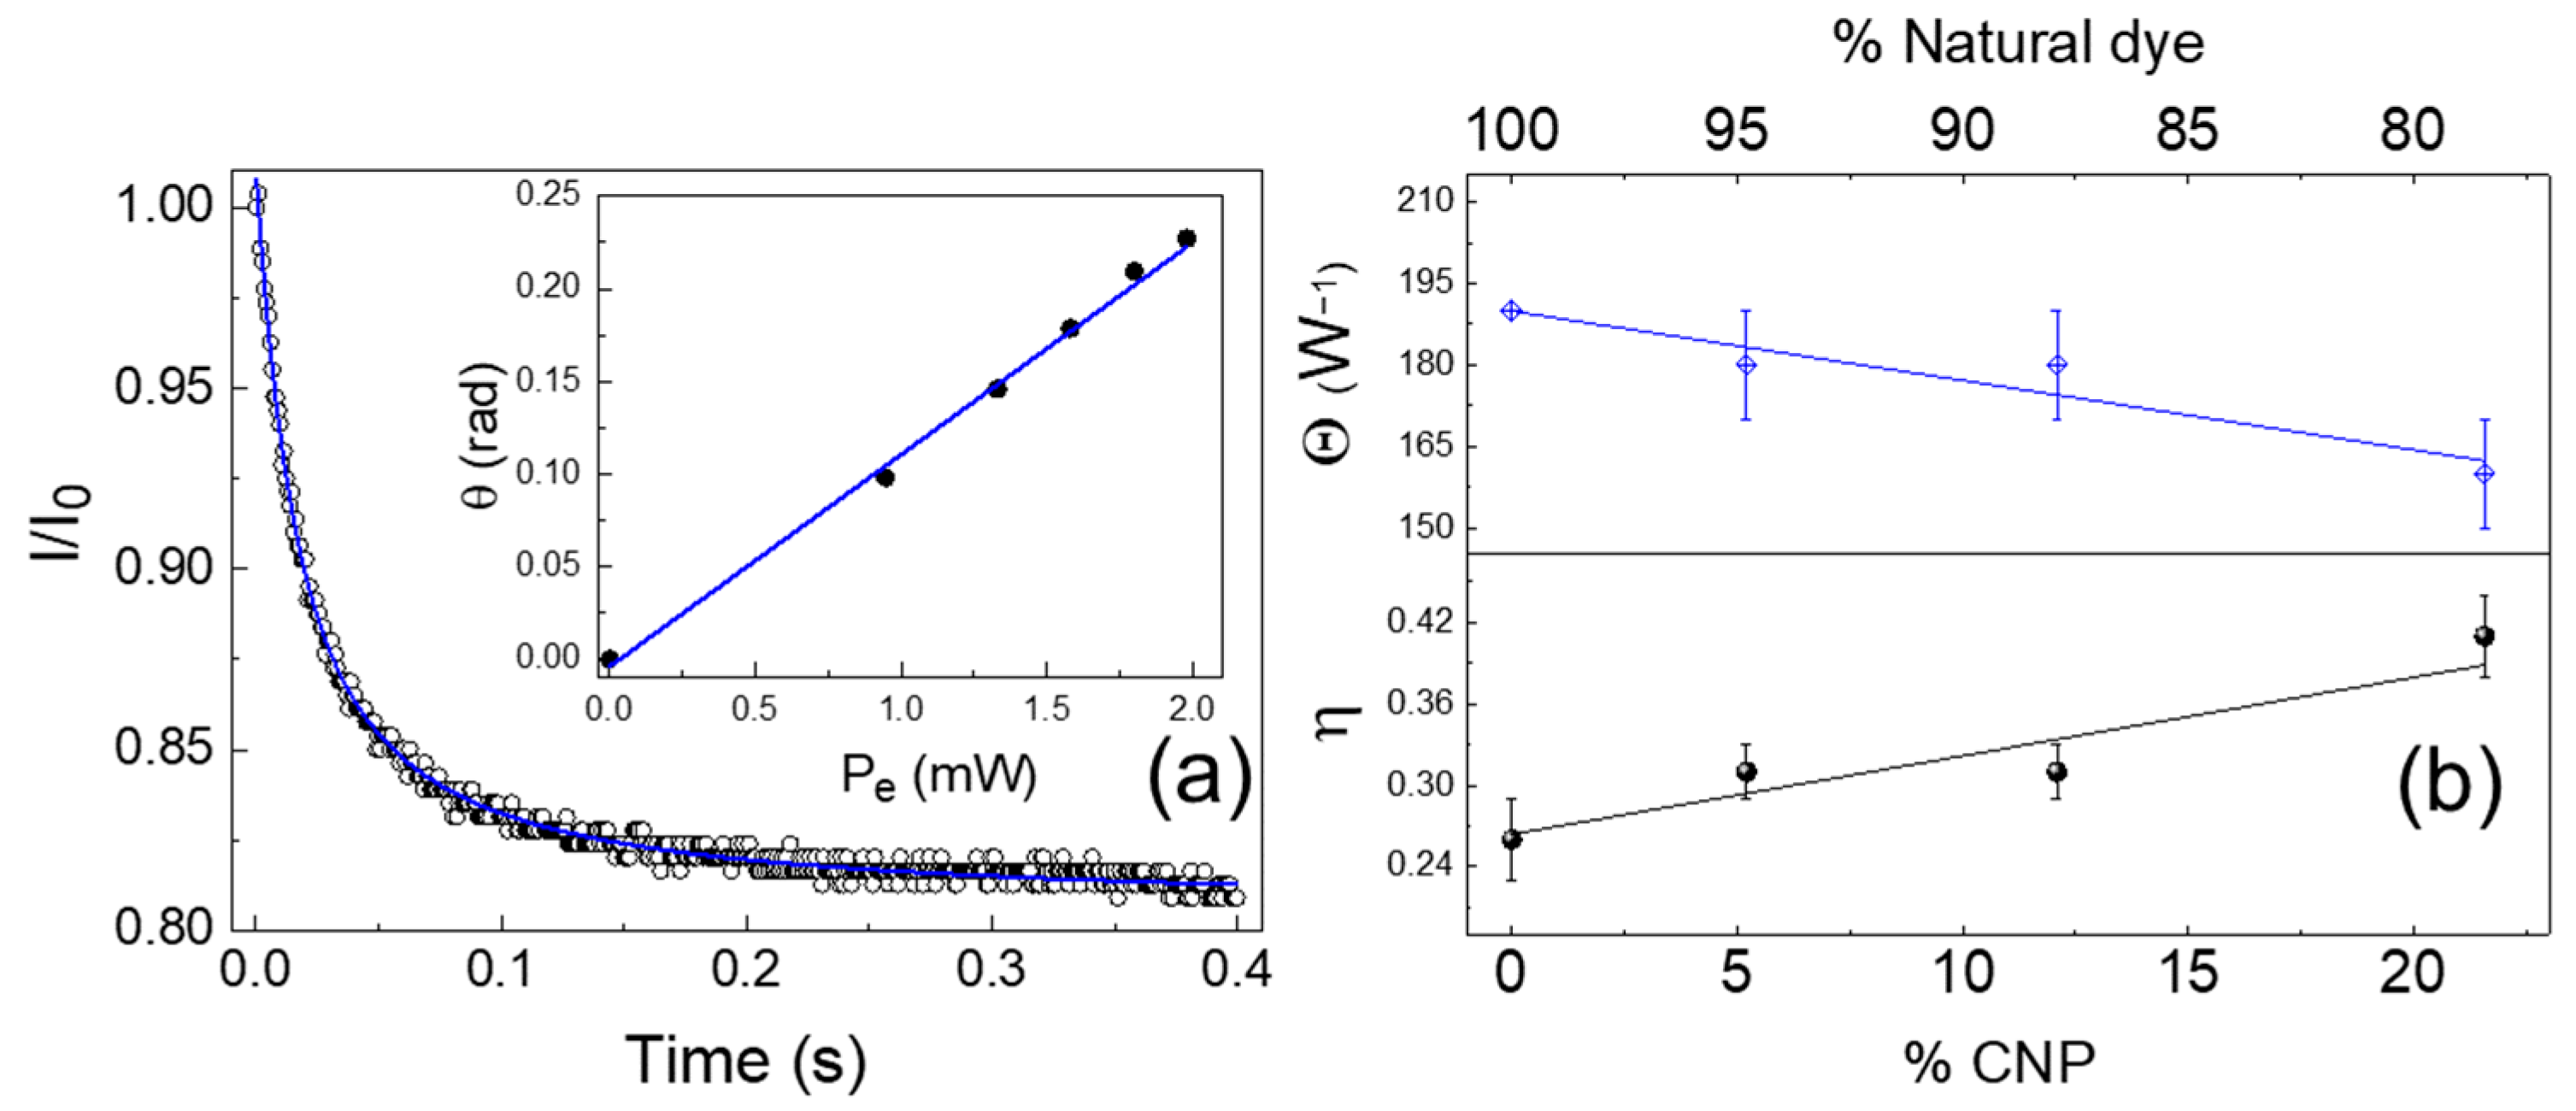
Figure 6a shows a typical TL transient signal for the S3 sample that was fitted using Equation (1), which supplies the TL amplitude θ and τc values. As dn/dT is negative, the TL effect defocuses the probe beam in the far field. The average thermal parameters Θ = −θ/PαLeff of the S3 were calculated, and the results are presented for all samples in Table 1. For SCNP, the value of the Θ = (59 ± 8) W−1 was determined. Using Equations (2) and (3), the K parameter for aqueous solutions [56], dn/dT = −(0.92 ± 0.03) × 10−4 K−1 (at 22 °C) determined for water [56,57], <λem> values from Table 1, and λe = 532 nm, the values of the radiative quantum yield η were determined for all samples (Table 1). Figure 6b presents the Θ and η values in the function of natural dye and CNPs (% in mass). The η value obtained for natural dye is in good agreement with the values reported for anthocyanin extracted as a function of the season and several potential hydrogens [20,21]. For samples S1–S3, the average fluorescence quantum yields increased by ~32% concerning the value for natural dye alone. High fluorescence quantum yields were determined for the chitosan-based carbon dot nanoparticle-embedded natural dye (Table 1). Therefore, the improvement in the η value is related to the increase in the carbon dots concentration (5.2–21.6% by mass of CNPs). This result is potentially important, because the increase in fluorescence of the anthocyanin-carbon dots nanoparticles enhances applications involving the fluorescence of these materials and, on the other side, benefits from the eventual fungicidal effect of the natural dye [20,21]. The η values for several carbon-based nanoparticles synthesized using different carbon sources [58,59,60,61] are presented in Table 2 for comparison. However, for chitosan fluorescent nanoparticles subjected to thermal treatment at 150 °C, a value of η = 0.15 was reported [6]; for CNP by hydrothermal carbonization of chitosan at 180 °C, η = 0.43 [7], and η = 0.07 were reported for chitosan-based carbon dots [9]. From τc and using τc = we2/4D, the D values were determined (Table 1). For SCNP, the value determined was D = (1.42 ± 0.07) 10−7 m2/s, which is in good agreement with the results for aqueous solutions [30,35]. Furthermore, for SCNP the estimated value of η using TL is 0.8. For comparison, η higher than 0.7 has been reported for carbon-based dots co-doped with nitrogen and sulfur (N, S-CDs) [62]. According to recent studies, a value as high as η = 0.88 has been reported for orange juice as a carbon source using hydrothermal treatment for the carbon dots synthesis process [63].
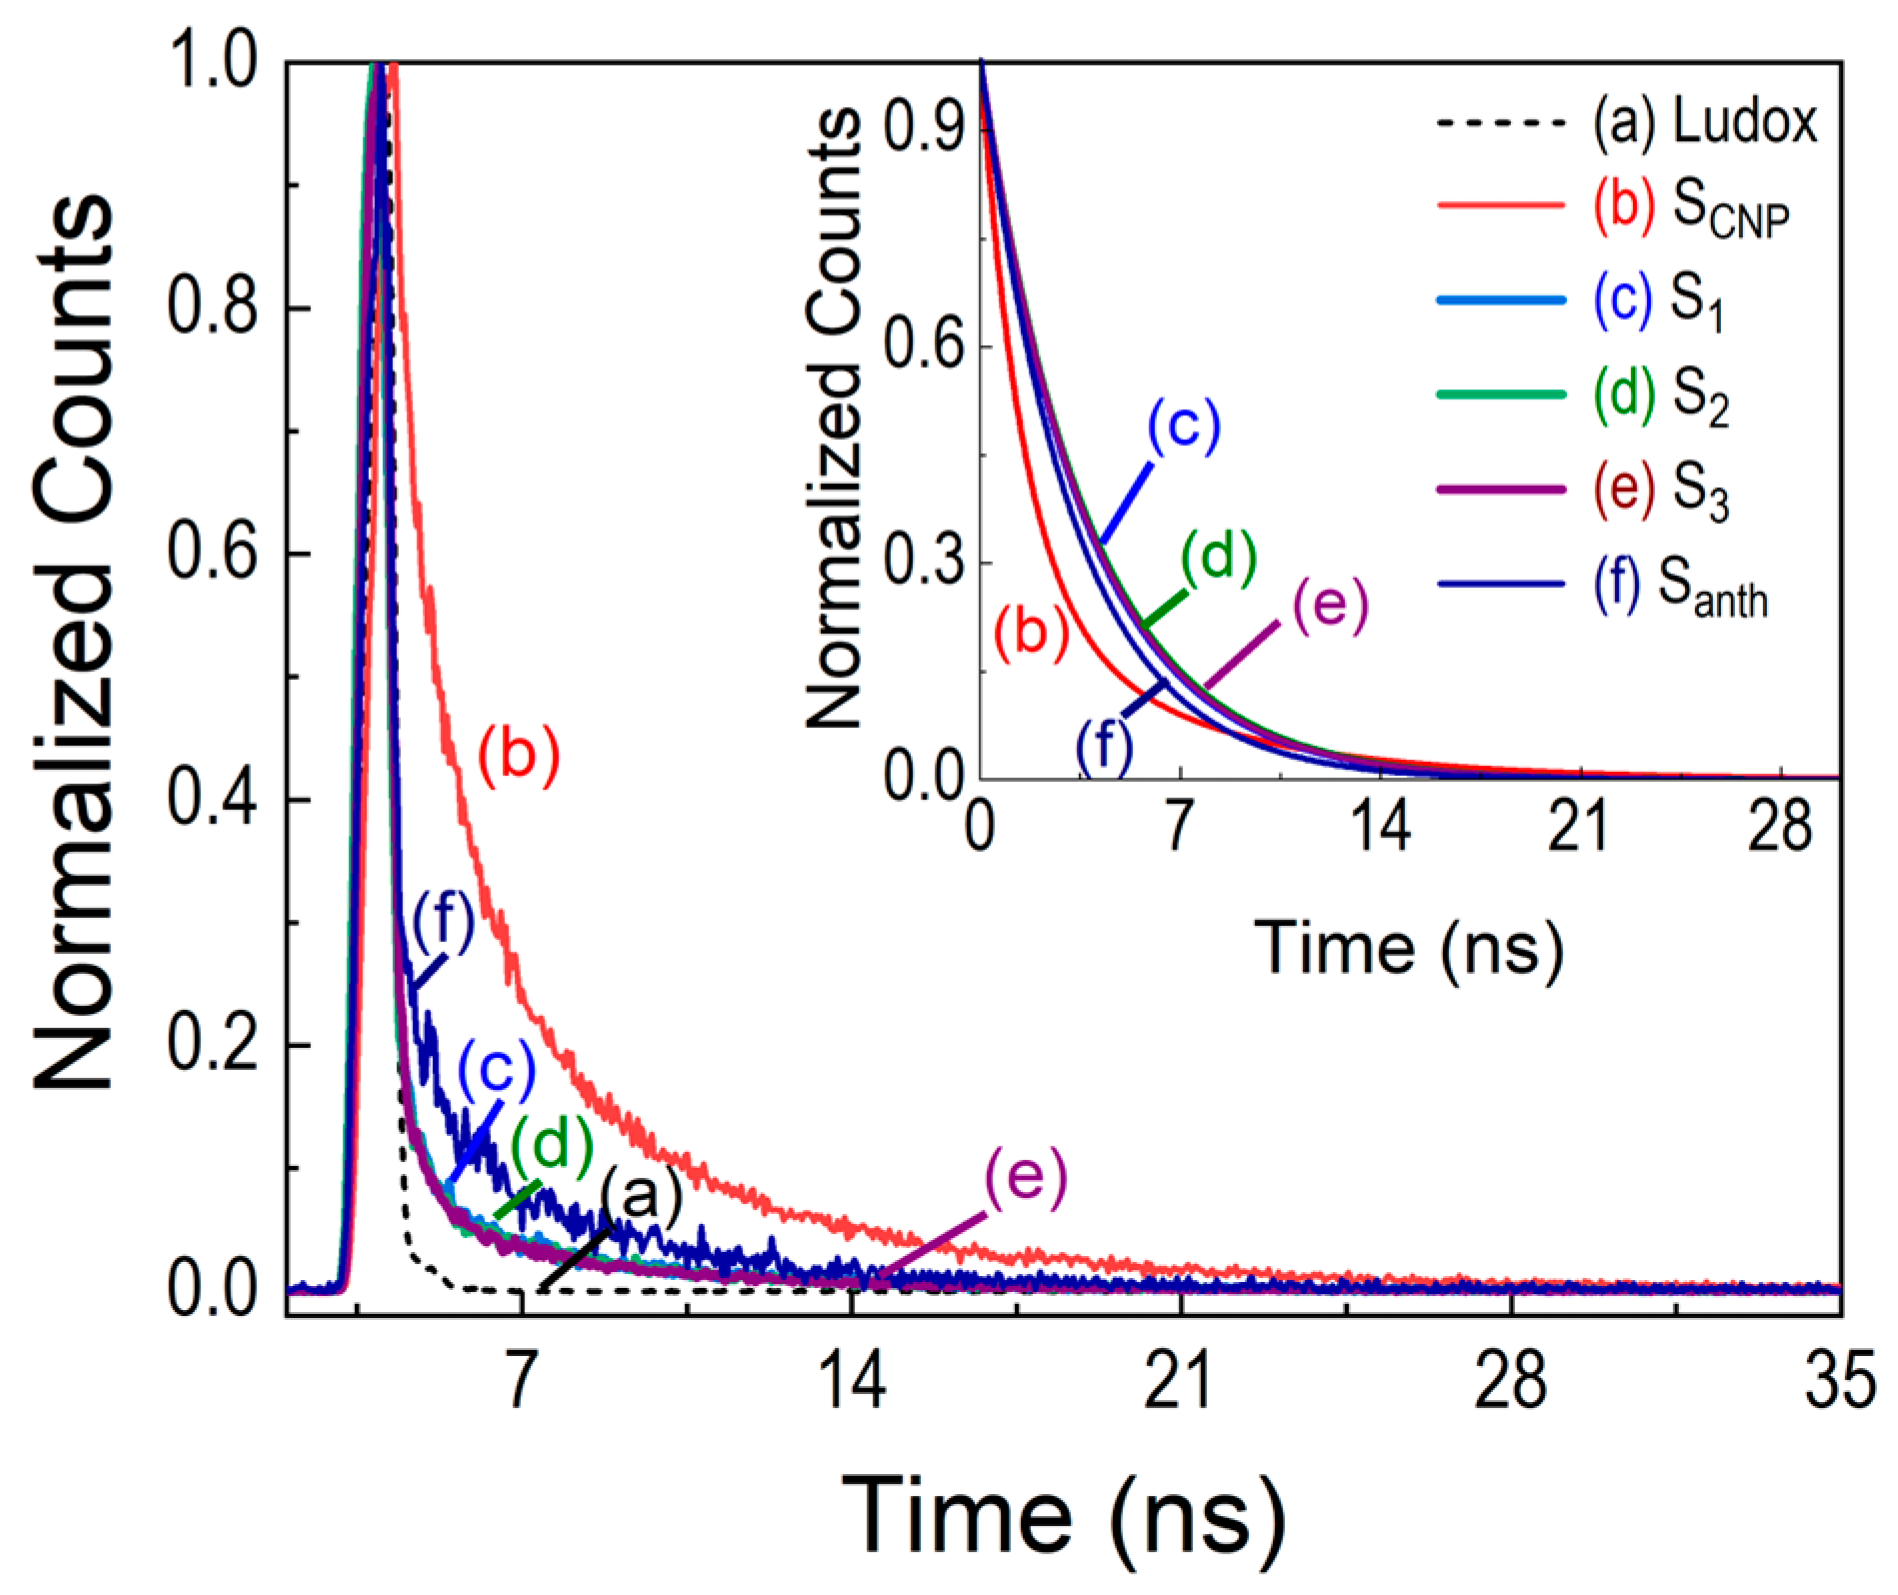
Time-resolved fluorescence (TRFL) spectroscopy measurements were also used for chitosan-based carbon dot nanoparticles and natural dyes (Figure 7). TRFL measurements of the excited states were performed, and the experimental results were adjusted for samples S1, S2, S3, and Santh using the single exponential B + A1 · Exp (−t/τ1), where A1 and B are constants and τ1 is the fluorescence lifetime. The TRFL setup was tested using sodium fluorescein (Synth) in an alkaline aqueous solution (pH 11.24), and the transient emission was adjusted with a single exponential (τ1 = (4.13 ± 0.01) ns and χ2 = (1.03 ± 0. 01)) [20,30,31]. For SCNP, the TRFL measurements were adjusted using two exponential B + A1 · exp (−t/τ1) + A2 · exp (−t/τ2), and the average fluorescence lifetime τAVE was determined using the following expression [47,58,64]:
τ A V E = A 1 τ 1 2 + A 2 τ 2 2 A 1 τ 1 + A 2 τ 2
where τAVE is the amplitude-weighted average lifetime of fluorescence, and τ1 and τ2 are the time constants of the fast and slow decay processes, respectively. A1 and A2 are the corresponding fractional values of the fluorescence intensities. The average TL and TRFL results were obtained using three independent sets of fresh samples, and each set of measurements was repeated approximately seven times.
Figure 7 shows the TRFL for aqueous chitosan-based carbon dots nanoparticles, SCNP, for CNPs embedded in natural dye in different proportions (S1, S2 and S3), and the natural dye Santh extracted from ornamental leaves of Tradescantia pallida Purpurea. The fluorescence decays were well fitted with a single exponential for samples S1, S2, S3, and Santh, and the χ2 value was less than 1.20 for all samples (Table 3). For SCNP, two exponentials were used for fluorescence decay fitting, and the average fluorescence lifetime τAVE was calculated using Equation (4) (Table 3). Three exponentials have been reported in the literature for functionalizing chitosan−carbon dots [47], and the multiple lifetime components were attributed to possible several emission species on the surface of the carbon dots [47]. The fluorescence lifetime and η parameters presented a discrete dependence on the ratios of anthocyanin-carbon dots nanoparticles (5.2–21.6% by mass of CNPs) used. For comparison, typical probes such as fluorescein, rhodamine 6G and bacteriochlorophyll, some fluorescent proteins, and natural dyes exhibit lifetimes in the range 1–4 ns [20,30,31,65]. In addition, τ values are presented in Table 2 for several carbon-based nanoparticles synthesized using different carbon sources, such as bovine serum albumin, Jinhua bergamot, grape seed, and Tamarindus indica leaves [58,59,60,61]. The η values and nanosecond lifetimes of carbon-based nanomaterials have potential for biological and optoelectronic applications [47,66]. However, the green synthesis of fluorescent carbon dots from raw materials used as carbon sources (such as seeds, flowers, fruits, extracts, and foods) has been in increasing development for several applications, including textile engineering and degrading dyes used in textile fabrics [67,68,69]. Other relevant applications of carbon dots synthesized and embedded into curcumin natural dye were reported, including their use as low-cost bioimaging agents and their antimicrobial activity [70]. Carbon dots synthesized from Curcuma longa are reported as probes for detecting triazophos pesticide [71]. In addition, a system based on carbon dots and curcumin was developed for the fluorescence turn-on detection of fluoride ions (F) [72].

4. Conclusions

The fluorescence quantum yield (η) and the fluorescence lifetime (τ) parameters were determined for synthesized carbon-based nanoparticles (CNPs) with an approximate height distribution of ~6 nm and embedded in aqueous natural dye extracted from the leaves of Tradescantia pallida Purpurea (ratios of 5.2, 12.09, and 21.57% by mass of CNPs for S1, S2 and S3, respectively). Up to 32% higher η average values were obtained for CNP embedded in natural dye samples than for anthocyanin (Santh). The nanosecond lifetime was obtained with an average τ = 3.65 ns for CNP embedded in natural dye. These results highlight the synthesized nanomaterials embedded in anthocyanin for potential applications in enhancing food coloration, smart functional food packaging, and extending food shelf life.

Author Contributions

Conceptualization, S.R.D.L., T.V.C., T.T.S.S., D.G.F. and V.P.; methodology, S.R.D.L., T.V.C., T.T.S.S. and T.B.S.; validation, S.R.D.L., T.V.C., D.G.F., T.B.S. and V.P.; formal analysis, S.R.D.L. and V.P.; investigation, S.R.D.L., T.V.C. and T.T.S.S.; data curation, S.R.D.L., T.B.S. and V.P.; writing—original draft preparation, S.R.D.L., A.A.A. and V.P.; writing—review and editing, S.R.D.L., A.A.A. and V.P.; visualization, D.G.F., T.B.S., A.A.A. and V.P.; supervision, V.P.; project administration, V.P.; funding acquisition, V.P. and A.A.A. All authors have read and agreed to the published version of the manuscript.

Funding

This research was funded by Conselho Nacional de Desenvolvimento Científico e Tecnológico (CNPq), grant number 311612/2023-7; Fundação de Amparo à Pesquisa do Estado de Minas Gerais (FAPEMIG), grant number APQ-01647-17, APQ-00656-22, APQ-00330-14; CAPES grant number 001; and Instituto Nacional de Ciência e Tecnologia de Fotônica INCT/CNPq.

Acknowledgments

The authors would like to thank the Brazilian funding agencies CNPq, FAPEMIG, CAPES, and INCT/CNPq for their financial support. The authors would also like to thank the Grupo de Materiais Inorgânicos do Triângulo (GMIT), a research group supported by FAPEMIG, for the absorbance and FTIR analyses, and Rede de Laboratórios Multiusuário (RELAM/PROPP) at the Federal University of Uberlândia for providing the equipment and technical support for the experiments.

Conflicts of Interest

The authors declare no conflicts of interest.

References

  1. Kumar, M.N.V.R. A Review of Chitin and Chitosan Applications. React. Funct. Polym. 2000, 46, 1–27. [Google Scholar] [CrossRef]
  2. Aranaz, I.; Alcántara, A.R.; Civera, M.C.; Arias, C.; Elorza, B.; Caballero, A.H.; Acosta, N. Chitosan: An Overview of Its Properties and Applications. Polymers 2021, 13, 3256. [Google Scholar] [CrossRef]
  3. Raafat, D.; Sahl, H.-G. Chitosan and Its Antimicrobial Potential—A Critical Literature Survey. Microb. Biotechnol. 2009, 2, 186–201. [Google Scholar] [CrossRef]
  4. Wang, J.; Wang, L.; Yu, H.; Abdin, Z.; Chen, Y.; Chen, Q.; Zhou, W.; Zhang, H.; Chen, X. Recent Progress on Synthesis, Property and Application of Modified Chitosan: An Overview. Int. J. Biol. Macromol. 2016, 88, 333–344. [Google Scholar] [CrossRef]
  5. Geng, Z.; Zhang, H.; Xiong, Q.; Zhang, Y.; Zhao, H.; Wang, G. A Fluorescent Chitosan Hydrogel Detection Platform for the Sensitive and Selective Determination of Trace Mercury(II) in Water. J. Mater. Chem. A 2015, 3, 19455–19460. [Google Scholar] [CrossRef]
  6. Padilha, A.C.; Vivas, M.G.; Melo, M.d.S.F.; Campos, M.G.N. Fluorescent Chitosan Nanoparticles as a Carrier System for Trackable Drug Delivery. Polym. Plas. Technol. Mater. 2021, 60, 862–871. [Google Scholar] [CrossRef]
  7. Yang, Y.; Cui, J.; Zheng, M.; Hu, C.; Tan, S.; Xiao, Y.; Yang, Q.; Liu, Y. One-Step Synthesis of Amino-Functionalized Fluorescent Carbon Nanoparticles by Hydrothermal Carbonization of Chitosan. Chem. Commun. 2012, 48, 380–382. [Google Scholar] [CrossRef]
  8. Basumallick, S.; Campos, M.G.N.; Richardson, D.; Gesquiere, A.; Santra, S. Hydrothermally Treated Chitosan Spontaneously Forms Water-Soluble Spherical Particles Stable at a Wide pH Range. Int. J. Polym. Mater. Polym. Biomater. 2016, 65, 751–758. [Google Scholar] [CrossRef]
  9. de Oliveira, B.P.; de Castro Bessa, N.U.; do Nascimento, J.F.; de Paula Cavalcante, C.S.; dos Santos Fontenelle, R.O.; da Silva Abreu, F.O.M. Synthesis of Luminescent Chitosan-based Carbon Dots for Candida albicans bioimaging. Int. J. Biol. Macromol. 2023, 227, 805–814. [Google Scholar] [CrossRef]
  10. Mathew, S.A.; Praveena, P.; Dhanavel, S.; Manikandan, R.; Senthilkumar, S.; Stephen, A. Luminescent Chitosan/Carbon Dots as an Effective Nano-Drug Carrier for Neurodegenerative Diseases. RSC Adv. 2020, 10, 24386–24396. [Google Scholar] [CrossRef]
  11. Lim, S.Y.; Shen, W.; Gao, Z. Carbon Quantum Dots and their Applications. Chem. Soc. Rev. 2015, 44, 362–381. [Google Scholar] [CrossRef]
  12. Zhang, D.-W.; Papaioannou, N.; David, N.M.; Luo, H.; Gao, H.; Tanase, L.C.; Degousée, T.; Samori, P.; Sapelkin, A.; Fenwick, O.; et al. Photoelectrochemical Response of Carbon Dots (CDs) Derived from Chitosan and Their Use in Electrochemical Imaging. Mater. Horiz. 2018, 5, 423–428. [Google Scholar] [CrossRef]
  13. Yang, G.; Jin, Q.; Xu, C.; Fan, S.; Wang, C.; Xie, P. Synthesis, Characterization and Antifungal Activity of Coumarin-Functionalized Chitosan Derivatives. Int. J. Biol. Macromol. 2018, 106, 179–184. [Google Scholar] [CrossRef]
  14. Kalaycioğlu, Z.; Torlak, E.; Akın-Evingür, G.; Ozen, I.; Erim, F.B. Antimicrobial and Physical Properties of Chitosan Films Incorporated with Turmeric Extract. Int. J. Biol. Macromol. 2017, 101, 882–888. [Google Scholar] [CrossRef]
  15. Bendokas, V.; Skemiene, K.; Trumbeckaite, S.; Stanys, V.; Passamonti, S.; Borutaite, V.; Liobikas, J. Anthocyanins: From Plant Pigments to Health Benefits at Mitochondrial Level. Crit. Rev. Food Sci. Nutr. 2020, 60, 3352–3365. [Google Scholar] [CrossRef]
  16. Khoo, H.E.; Azlan, A.; Tang, S.T.; Lim, S.M. Anthocyanidins and Anthocyanins: Colored Pigments as Food, Pharmaceutical Ingredients, and the Potential Health Benefits. Food Nutr. Res. 2017, 61, 1361779. [Google Scholar] [CrossRef]
  17. Francis, F.J.; Markakis, P.C. Food colorans: Anthocyanins. Crit. Rev. Food Sci. Nutr. 1989, 28, 273–314. [Google Scholar] [CrossRef]
  18. Faria, A.; Pestana, D.; Teixeira, D.; de Freitas, V.; Mateus, N.; Calhau, C. Blueberry Anthocyanins and Pyruvic Acid Adducts: Anticancer Properties in Breast Cancer Cell Lines. Phytother. Res. 2010, 24, 1862–1869. [Google Scholar] [CrossRef]
  19. Blaszczyk, A.; Joachimiak-Lechman, K.; Sady, S.; Tański, T.; Szindler, M.; Drygata, A. Environmental Performance of Dye-Sensitized Solar Cells Based on Natural Dyes. Sol. Energy 2021, 215, 346–355. [Google Scholar] [CrossRef]
  20. De Lima, S.R.; Lourenço, L.R.; Thomaz, M.; Messias, D.N.; Andrade, A.A.; Pilla, V. Fluorescence Quantum Yields and Lifetimes of Aqueous Natural Dye Extracted from Tradescantia pallida purpurea at Different Hydrogen Potentials. Photochem 2023, 3, 1–14. [Google Scholar] [CrossRef]
  21. De Lima, S.R.; Felisbino, D.G.; Lima, M.R.S.; Chang, R.; Martins, M.M.; Goulart, L.R.; Andrade, A.A.; Messias, D.N.; Dos Santos, R.R.; Juliatti, F.C.; et al. Fluorescence Quantum Yield of Natural Dye Extracted from Tradescantia Pallida Purpurea as a Function of the Seasons: Preliminary Bioapplication as a Fungicide Probe for Necrotrophic Fungi. J. Photochem. Photobiol. B 2019, 200, 111631. [Google Scholar] [CrossRef]
  22. Lacombe, A.; Wu, V.C.H.; Tyler, S.; Edwards, K. Antimicrobial Action of the American Cranberry Constituents; Phenolics, Anthocyanins, and Organic Acids, Against Escherichia coli O157:H7. Int. J. Food Microbiol. 2010, 139, 102–107. [Google Scholar] [CrossRef]
  23. Riahi, Z.; Khan, A.; Rhim, J.-W.; Shin, G.H.; Kim, J.T. Carrageenan-Based Active and Intelligent Packaging Films Integrated with Anthocyanin and TiO2-Doped Carbon Dots Derived from Sweet Potato Peels. Int. J. Biol. Macromol. 2024, 259, 129371. [Google Scholar] [CrossRef]
  24. Khan, A.; Riahi, Z.; Kim, J.T.; Rhim, J.-W. Carrageenan-Based Multifunctional Packaging Films Containing Zn-Carbon Dots/Anthocyanin Derived from Kohlrabi Peel for Monitoring Quality and Extending the Shelf Life of Shrimps. Food Chem. 2024, 432, 137215. [Google Scholar] [CrossRef]
  25. Wagh, R.V.; Riahi, Z.; Kim, J.T.; Rhim, J.-W. Carrageenan-Based Functional Films Hybridized with Carbon Dots and Anthocyanins from Rose Petals for Smart Food Packaging Applications. Int. J. Biol. Macromol. 2024, 272, 132817. [Google Scholar] [CrossRef]
  26. Koshy, R.R.; Koshy, J.T.; Mary, S.K.; Sadanandan, S.; Jisha, S.; Pothan, L.A. Preparation of pH Sensitive Film Based on Starch/Carbon Nano Dots Incorporating Anthocyanin for Monitoring Spoilage of Pork. Food Control. 2021, 126, 108039. [Google Scholar] [CrossRef]
  27. Wagh, R.V.; Khan, A.; Priyadarshi, R.; Ezati, P.; Rhim, J.-W. Cellulose Nanofiber-Based Multifunctional Films Integrated with Carbon Dots and Anthocyanins from Brassica oleracea for Active and Intelligent Food Packaging Applications. Int. J. Biol. Macromol. 2023, 233, 123567. [Google Scholar] [CrossRef]
  28. Shi, Z.; Daun, H.; Francis, F.J. Major Anthocyanin from Tradescantia pallida: Identification by LSI-MS and Chemical Analyses. J. Food Sci. 1993, 58, 1068–1069. [Google Scholar] [CrossRef]
  29. Shi, Z.; Lin, M.; Francis, F.J. Anthocyanins of Tradescantia pallida. Potential Food Colorants. J. Food Sci. 1992, 57, 761–765. [Google Scholar] [CrossRef]
  30. Santos, T.T.S.; Lourenço, L.R.; De Lima, S.R.; Goulart, L.R.; Messias, D.N.; Andrade, A.A.; Pilla, V. Fluorescence Quantum Yields and Lifetimes of Annatto Aqueous Solutions Dependent on Hydrogen Potential: Applications in Adulterated Milk. J. Photochem. Photobiol. 2021, 8, 100080. [Google Scholar] [CrossRef]
  31. Pilla, V.; Gonçalves, A.C.; Dos Santos, A.A.; Lodeiro, C. Lifetime and Fluorescence Quantum Yield of Two Fluorescein-Amino Acid-Based Compounds in Different Organic Solvents and Gold Colloidal Suspensions. Chemosensors 2018, 6, 26. [Google Scholar] [CrossRef]
  32. Shen, J.; Lowe, R.D.; Snook, R.D. A Model for cw Laser Induced Mode- Mismatched Dual-Beam Thermal Lens Spectrometry. Chem. Phys. 1992, 165, 385–396. [Google Scholar] [CrossRef]
  33. Snook, R.D.; Lowe, R.D. Thermal Lens Spectrometry. A Review. Analyst 1995, 120, 2051–2068. [Google Scholar] [CrossRef]
  34. Pilla, V.; Munin, E.; Gesualdi, M.R.R. Measurement of the Thermo-Optic Coefficient in Liquids by Laser-Induced Conical Diffraction and Thermal Lens Techniques. J. Opt. A Pure Appl. Opt. 2009, 11, 105201. [Google Scholar] [CrossRef]
  35. Mendes, V.; De Lima, S.R.; Torres, J.O.B.; Antunes, A.; Messias, D.N.; Andrade, A.A.; Dantas, N.O.; Zilio, S.C.; Pilla, V. Preliminary Spectroscopic and Thermo-Optical Characterization of Anthocyanin Unpurified Crude Extracted from Tradescantia Pallida Purpurea. Dyes Pigm. 2016, 135, 57–63. [Google Scholar] [CrossRef]
  36. Baublis, A.; Spomer, A.; Berber-Jiménez, M.D. Anthocyanin Pigments: Comparison of Extract Stability. J. Food Sci. 1994, 59, 1219–1221. [Google Scholar] [CrossRef]
  37. Brouillard, R. Origin of the Exceptional Colour Stability of the Zebrina Anthocyanin. Phytochem 1981, 20, 143–145. [Google Scholar] [CrossRef]
  38. Shi, Z.; Lin, M.; Francis, F.J. Stability of Anthocyanins from Tradescantia pallida. J. Food Sci. 1992, 57, 758–760. [Google Scholar] [CrossRef]
  39. Puvvada, N.; Kumar, B.N.P.; Konar, S.; Kalita, H.; Mandal, M.; Pathak, A. Synthesis of Biocompatible Multicolor Luminescent Carbon Dots for Bioimaging Applications. Sci. Technol. Adv. Mater. 2012, 13, 045008. [Google Scholar] [CrossRef]
  40. Mewada, A.; Pandey, S.; Shinde, S.; Mishra, N.; Oza, G.; Thakur, M.; Sharon, M.; Sharon, M. Green Synthesis of Biocompatible Carbon Dots Using Aqueous Extract of Trapa bispinosa Peel. Mater. Sci. Eng. C 2013, 33, 2914–2917. [Google Scholar] [CrossRef]
  41. De, B.; Karak, N. A Green and Facile Approach for the Synthesis of Water Soluble Fluorescent Carbon Dots from Banana Juice. RSC Adv. 2013, 3, 8286–8290. [Google Scholar] [CrossRef]
  42. Zhang, J.; Shen, W.; Pan, D.; Zhang, Z.; Fang, Y.; Wu, M. Controlled Synthesis of Green and Blue Luminescent Carbon Nanoparticles with High Yiels by the Carbonization of Sucrose. New J. Chem. 2010, 34, 591–593. [Google Scholar] [CrossRef]
  43. Munawaroh, H.; Fadillah, G.; Saputri, L.N.M.Z.; Hanif, Q.A.; Hidayat, R.; Wahyuningsih, S. The Co-Pigmentation of Anthocyanin Isolated from Mangosteen Pericarp (Garcinia mangostana L.) as Natural Dye for Dye-Sensitized Solar Cells (DSSC). IOP Conf. Ser. Mater. Sci. Eng. 2016, 107, 012061. [Google Scholar] [CrossRef]
  44. Zhan, J.; Peng, R.; Wei, S.; Chen, J.; Peng, X.; Xiao, B. Ethanol-Precipitation-Assisted Highly Efficient Synthesis of Nitrogen-Doped Carbon Quantum Dots from Chitosan. ACS Omega 2019, 4, 22574–22580. [Google Scholar] [CrossRef]
  45. Dager, A.; Uchida, T.; Maekawa, T.; Tachibana, M. Synthesis and Characterization of Mono-disperse Carbon Quantum Dots from Fennel Seeds: Photoluminescence Analysis using Machine Learning. Sci. Rep. 2019, 9, 14004. [Google Scholar] [CrossRef]
  46. Pawar, S.; Togiti, U.K.; Bhattacharya, A.; Nag, A. Functionalized Chitosan–Carbon Dots: A Fluorescent Probe for Detecting Trace Amount of Water in Organic Solvents. ACS Omega 2019, 4, 11301–11311. [Google Scholar] [CrossRef]
  47. Da, X.; Han, Z.; Yang, Z.; Zhang, D.; Hong, R.; Tao, C.; Lin, H.; Huang, Y. Preparation of Multicolor Carbon Dots with High Fluorescence Quantum Yield and Application in White LED. Chem. Phys. Lett. 2022, 794, 139497. [Google Scholar] [CrossRef]
  48. Stachowska, J.D.; Murphy, A.; Mellor, C.; Fernandes, D.; Gibbons, E.N.; Krysmann, M.J.; Kelarakis, A.; Burgaz, E.; Moore, J.; Yeates, S.G. A Rich Gallery of Carbon Dots Based Photoluminescent Suspensions and Powders Derived by Citric Acid/Urea. Sci. Rep. 2021, 11, 10554. [Google Scholar] [CrossRef]
  49. Ma, C.; Yin, C.; Fan, Y.; Yang, X.; Zhou, X. Highly Efficient Synthesis of N-doped Carbon Dots with Excellent Stability Through Pyrolysis Method. J. Mater. Sci. 2019, 54, 9372–9384. [Google Scholar] [CrossRef]
  50. Atchudan, R.; Edison, T.N.J.I.; Perumal, S.; Muthuchamy, N.; Lee, Y.R. Hydrophilic Nitrogen-Doped Carbon Dots from Biowaste using Dwarf Banana Peel for Environmental and Biological Applications. Fuel 2020, 275, 117821. [Google Scholar] [CrossRef]
  51. Baruah, U.; Gogoi, N.; Konwar, A.; Deka, M.J.; Chowdhury, D.; Majumdar, G. Carbon Dot Based Sensing of Dopamine and Ascorbic Acid. J. Nanopart. 2014, 2014, 178518. [Google Scholar] [CrossRef]
  52. Abdelhamid, H.N.; El-Bery, H.M.; Metwally, A.A.; Elshazly, M.; Hathout, R.M. Synthesis of CdS-Modified Chitosan Quantum Dots for the Drug Delivery of Sesamol. Carbohydr. Polym. 2019, 214, 90–99. [Google Scholar] [CrossRef]
  53. Zhai, H.; Zheng, B.; Yang, F.; Wang, M.; Xiao, D. Synthesis of Water-Soluble Fluorescent Carbon Dots from Setcreasea Purpurea Boom and Its Application for Br2 Detection. Anal. Methods 2018, 10, 151–157. [Google Scholar] [CrossRef]
  54. Favaro, L.I.L.; Balcão, V.M.; Rocha, L.K.H.; Silva, E.C.; Oliveira, J.M.; Vila, M.M.D.C.; Tubino, M. Physicochemical Characterization of a Crude Anthocyanin Extract from the Fruits of Jussara (Euterpe edulis Martius): Potential for Food and Pharmaceutical Applications. J. Braz. Chem. Soc. 2018, 29, 2072–2088. [Google Scholar] [CrossRef]
  55. Wahyuningsih, S.; Wulandari, L.; Wartono, M.W.; Munawaroh, H.; Ramelan, A.H. The Effect of pH and Color Stability of Anthocyanin on Food Colorant. IOP Conf. Series: Mat. Sci. Eng. 2017, 193, 012047. [Google Scholar] [CrossRef]
  56. De Lima, S.R.; Pereira, G.J.; Messias, D.N.; Andrade, A.A.; Oliveira, E.; Lodeiro, C.; Zilio, S.C.; Pilla, V. Fluorescence Quantum Yield Determination of Molecules in Liquids by Thermally Driven Conical Diffraction. J. Lumin. 2018, 197, 175–179. [Google Scholar] [CrossRef]
  57. Domenegueti, J.F.M.; Andrade, A.A.; Pilla, V.; Zilio, S.C. Simultaneous Measurement of Thermo-Optic and Thermal Expansion Coefficients with a Single Arm Double Interferometer. Opt. Express 2017, 25, 313–319. [Google Scholar] [CrossRef]
  58. Pichardo-Molina, J.L.; Cardoso-Avila, P.E.; Flores-Villavicencio, L.L.; Gomez-Ortiz, N.M.; Rodriguez-Rivera, M.A. Fluorescent Carbon Nanoparticles Synthesized from Bovine Serum Albumin Nanoparticles. Int. J. Biol. Macromol. 2020, 142, 724–731. [Google Scholar] [CrossRef]
  59. Yu, J.; Song, N.; Zhang, Y.-K.; Zhong, S.-X.; Wang, A.-J.; Chen, J. Green Preparation of Carbon Dots by Jinhua Bergamot for Sensitive and Selective Fluorescent Detection of Hg2+ and Fe3+. Sens. Actuators B Chem. 2015, 214, 29–35. [Google Scholar] [CrossRef]
  60. Kumawat, M.K.; Thakur, M.; Gurung, R.B.; Srivastava, R. Graphene Quantum Dots for Cell Proliferation, Nucleus Imaging, and Photoluminescent Sensing Applications. Sci. Rep. 2017, 7, 15858. [Google Scholar] [CrossRef]
  61. Bano, D.; Kumar, V.; Singh, V.K.; Hasan, S.H. Green Synthesis of Fluorescent Carbon Quantum Dots for the Detection of Mercury(II) and Glutathione. New J. Chem. 2018, 42, 5814–5821. [Google Scholar] [CrossRef]
  62. Dong, Y.; Pang, H.; Yang, H.B.; Guo, C.; Shao, J.; Chi, Y.; Li, C.M.; Yu, T. Carbon-Based Dots Co-Doped with Nitrogen and Sulfur for High Quantum Yield and Excitation-Independent Emission. Angew. Chem. Int. Ed. 2013, 52, 7800–7804. [Google Scholar] [CrossRef]
  63. Ateia, E.E.; Rabie, O.; Mohamed, A.T. Assessment of the Correlation Between Optical Properties and CQD Preparation Approaches. Eur. Phys. J. Plus 2024, 139, 24. [Google Scholar] [CrossRef]
  64. Sun, Y.; Liu, S.; Sun, L.; Wu, S.; Hu, G.; Pang, X.; Smith, A.T.; Hu, C.; Zeng, S.; Wang, W.; et al. Ultralong Lifetime and Efficient Room Temperature Phosphorescent Carbon Dots Through Multi-Confinement Structure Design. Nat. Commun. 2020, 11, 5591. [Google Scholar] [CrossRef]
  65. Berezin, M.Y.; Achilefu, S. Fluorescence Lifetime Measurements and Biological Imaging. Chem. Rev. 2010, 110, 2641–2684. [Google Scholar] [CrossRef]
  66. Peng, J.; Gao, W.; Gupta, B.K.; Liu, Z.; Romero-Aburto, R.; Ge, L.; Song, L.; Alemany, L.B.; Zhan, X.; Gao, G.; et al. Graphene Quantum Dots Derived from Carbon Fibers. Nano Lett. 2012, 12, 844–849. [Google Scholar] [CrossRef]
  67. Felipe, D.G.; Serna, T.B.; Andrade, A.A.; Pilla, V. Synthesis of Fluorescent Carbon Dots from Raw Materials: An Overview of Textile Applications. Trends Text. Eng. Fashion. Technol. 2024, 10, 1155–1159. [Google Scholar] [CrossRef]
  68. Varman, G.A.; Kalanidhi, K.; Nagaraaj, P. Green Synthesis of Fluorescent Carbon Dots from Canon Ball Fruit for Sensitive Detection of Fe3+ and Catalytic Reduction of Textile Dyes. Dyes Pigm. 2022, 199, 110101. [Google Scholar] [CrossRef]
  69. Mogharbel, A.T.; Pashameah, R.A.; Alluhaybi, A.A.; Almahri, A.; Abumelha, H.M.; Habeebullah, T.M.; El-Metwaly, N.M. Development of a “Turn-off” Fluorescent Sensor for Acetone from Rice Straw-Derived Carbon Dots Immobilized onto Textile Cotton Mask. J. Mol. Liq. 2022, 362, 119666. [Google Scholar] [CrossRef]
  70. Thirumalaivasan, N.; Kanagaraj, K.; Logesh, K.; Chandrasekaran, S.; Kumar, S.; Subramanian, R.; Senthilkumar, N.; Kumar, A.; Angadi, V.J.; Al-Kahtani, A.A. Exploring Luminescent Carbon Dots Derived from Syrup Bottle Waste and Curcumin for Potential Antimicrobial and Bioimaging Applications. Chemosphere 2024, 354, 141592. [Google Scholar] [CrossRef]
  71. Vadia, F.Y.; Mehta, V.N.; ·Jha, S.; ·Park, T.J.; ·Malek, N.I.; Kailasa, S.K. Development of Simple Fluorescence Analytical Strategy for the Detection of Triazophos Using Greenish-Yellow Emissive Carbon Dots Derived from Curcuma longa. J. Fluoresc. 2023. [Google Scholar] [CrossRef]
  72. Zhang, X.; Tan, X.; Hu, Y. Blue/Yellow Emissive Carbon Dots Coupled with Curcumin: A Hybrid Sensor Toward Fluorescence Turn-On Detection of Fluoride Ion. J. Hazard. Mater. 2021, 411, 125184. [Google Scholar] [CrossRef]
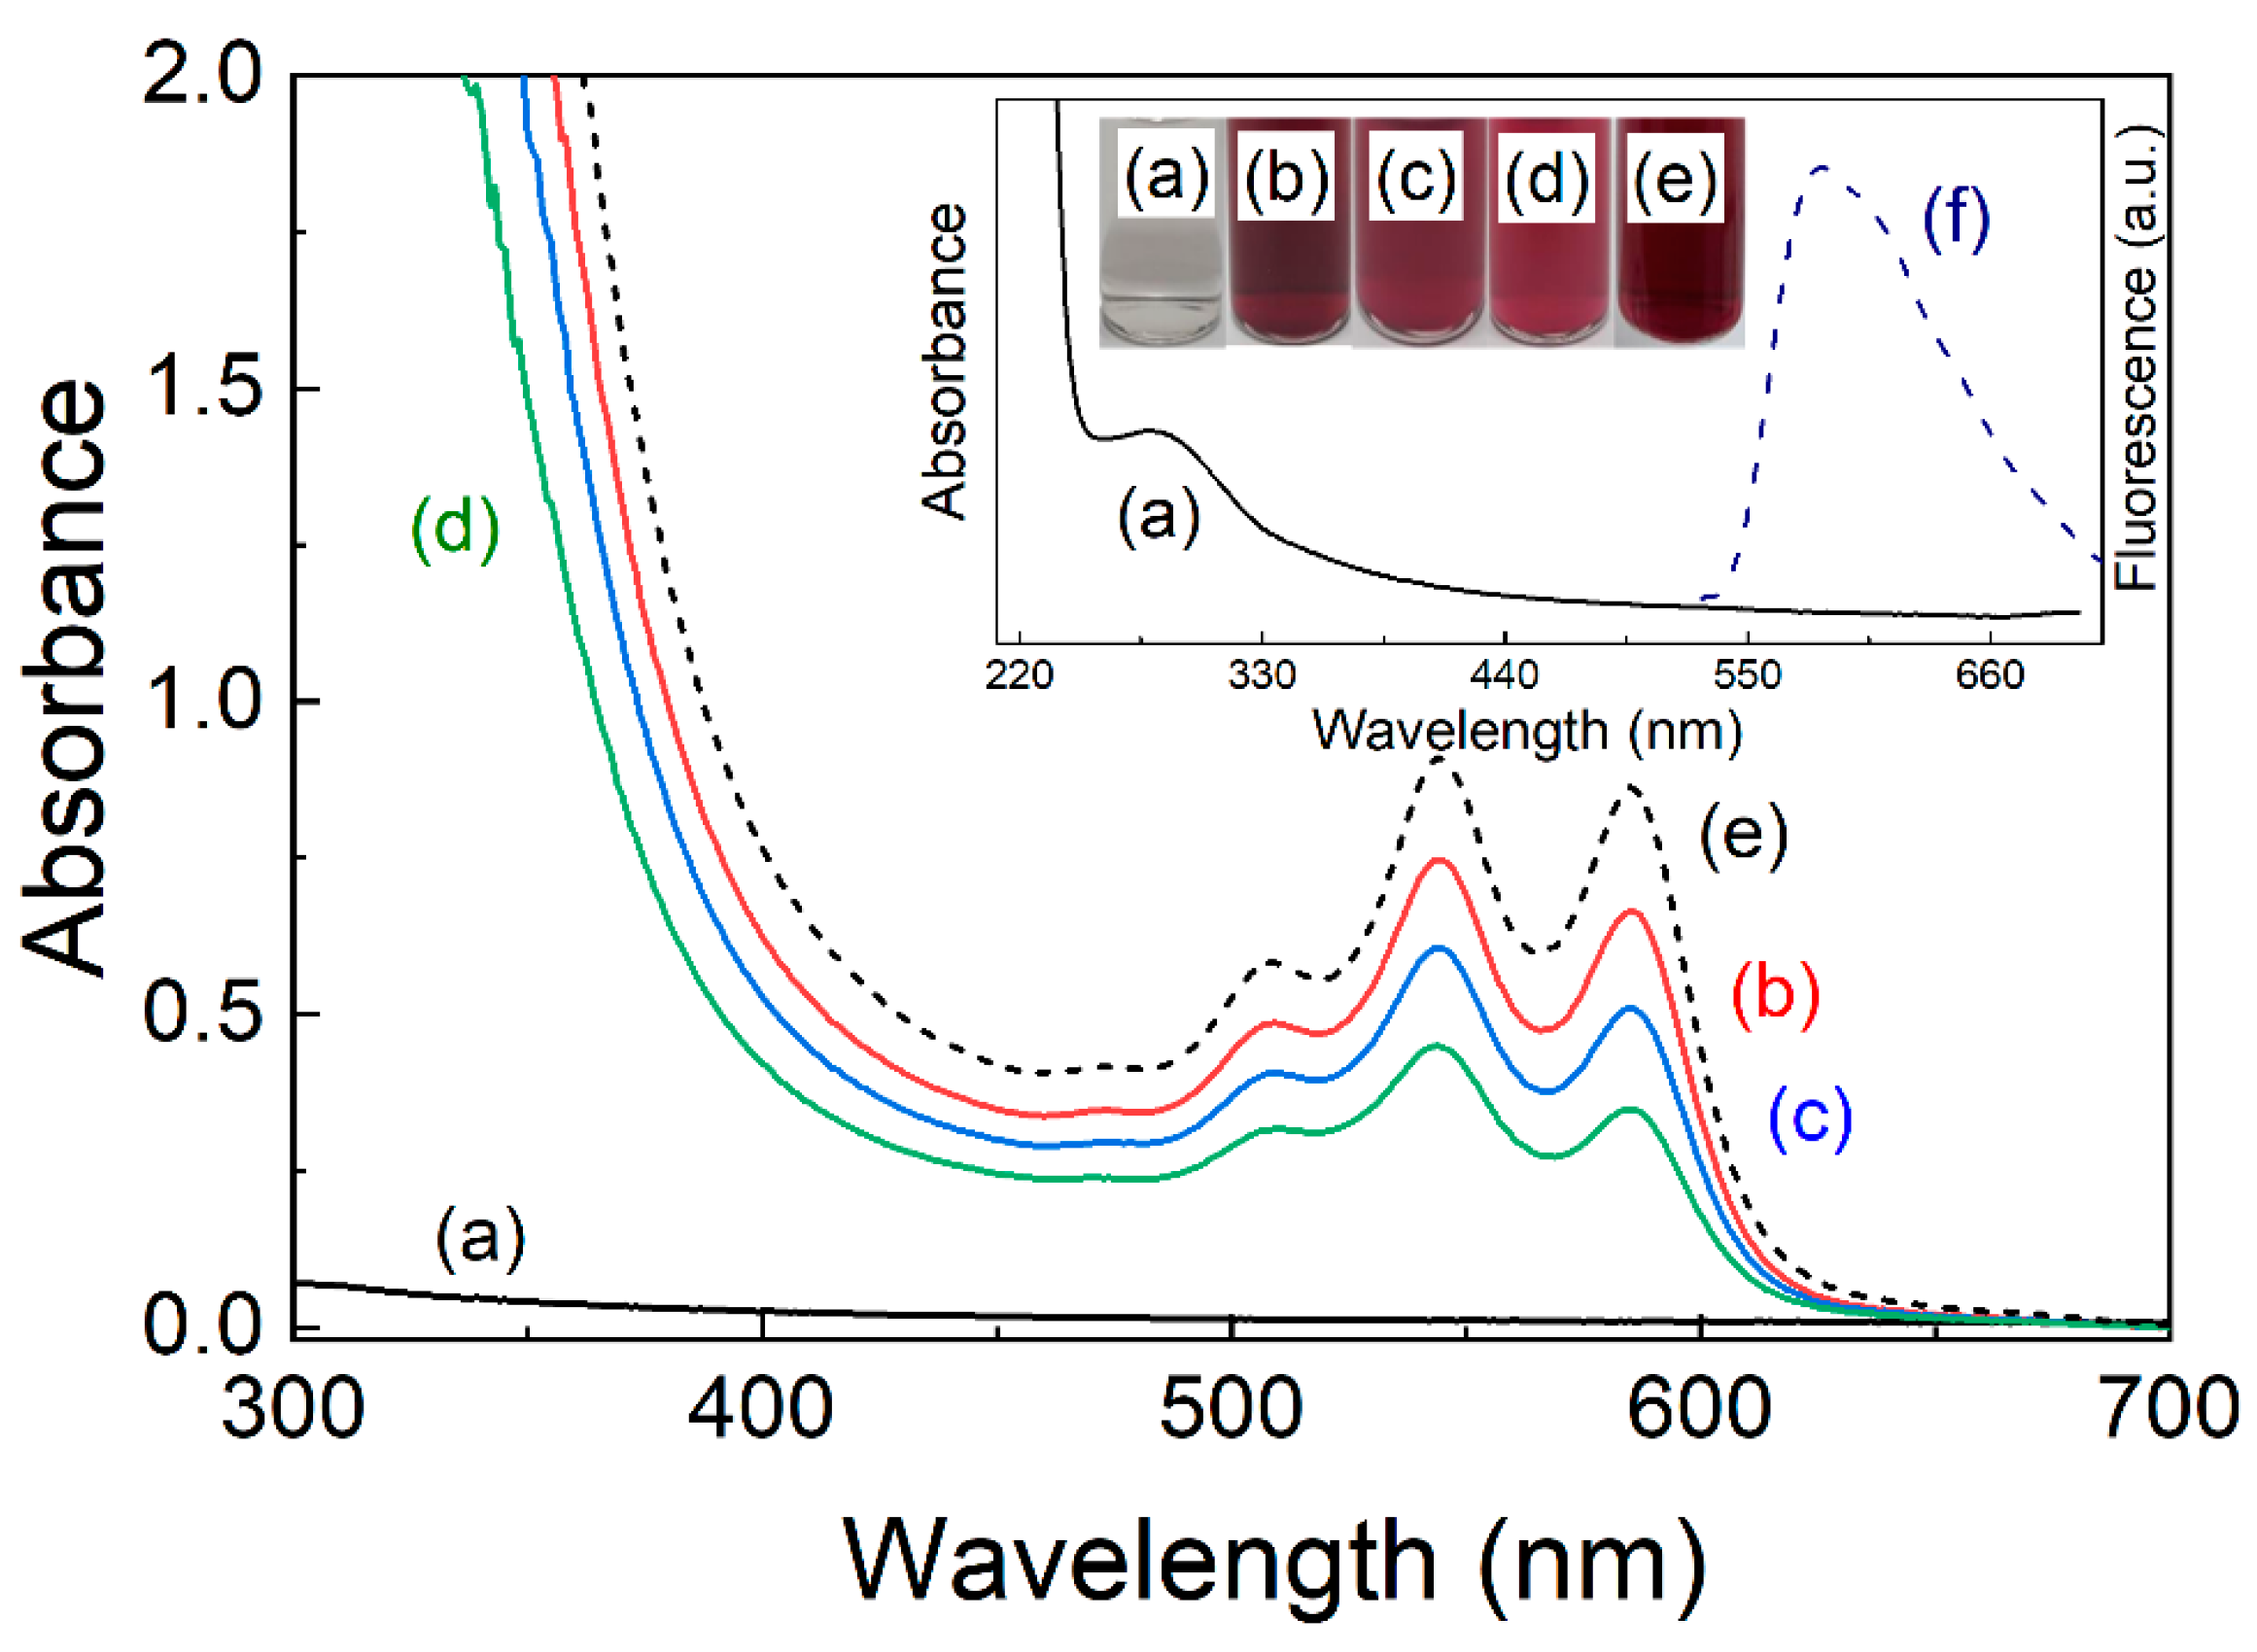
Figure 1. Absorbance spectra of the chitosan-based carbon dot nanoparticle SCNP sample (a), S1 (b), S2 (c), S3 (d), and anthocyanin Santh (e) (2 mm quartz cuvette). (f) presents the fluorescence spectrum for CNPs at excitation at 514 nm and Pe = 40 mW (10 mm quartz cuvette).
Colorants 03 00019 g001
Figure 2. Fluorescence intensity and normalized fluorescence (N Fluorescence) spectra for chitosan-based carbon dots SCNP sample at different wavelength excitation (λe = 330–560 nm, 10 mm quartz cuvette).
Colorants 03 00019 g002
Figure 3. (a) Room temperature AFM images, (b) height distribution of the chitosan-based carbon dot SCNP sample, and (c) XRD results for chitosan and CNP powders.
Colorants 03 00019 g003
Figure 4. Fluorescence spectra of the chitosan-based carbon dot nanoparticle SCNP sample (a), S1 (b), S2 (c), S3 (d), and anthocyanin Santh (e) with laser excitation at 514.5 nm and Pe = 40 mW (10 mm quartz cuvette).
Colorants 03 00019 g004
Figure 5. FTIR spectra of the chitosan-based carbon dot nanoparticles SCNP and CNP embedded in natural dye in different proportions (S1 and S3) and of the natural dye Santh. The peaks at 3342, 3257, 2925, 2880, 1638, 1558, 1420, 1388, 1081, 1050, 1023, 823, and 656 cm−1 are presented.
Colorants 03 00019 g005
Figure 6. (a) TL transient signal for S3 at λ e = 532 nm and P e = 1.98 mW. The values obtained from the curve fitting were θ = (0.2272 ± 0.0006) rad and τ c = (4.29 ± 0.03) ms. (b) Θ and η are presented as a function of the percent composition by mass (%) of natural dye and CNP, obtained from TL measurements.
Colorants 03 00019 g006
Figure 7. TRFL measurements for Ludox (a), SCNP (b), S1 (c), S2 (d), S3 (e), and Santh (f) (Table 3). The resulting decay fits are shown at the top for samples (bf).
Colorants 03 00019 g007
Table 1. TL results for chitosan-based carbon dot nanoparticles embedded in natural dye (S1, S2, and S3) and anthocyanin (Santh).
Sampleem>
(±1 nm) 1
D
(10−7 m2/s)
Θ
(W−1)
η
S1653(1.42 ± 0.07)(180 ± 10)(0.31 ± 0.02)
S2650(1.41 ± 0.09)(180 ± 10)(0.31 ± 0.02)
S3648(1.4 ± 0.1)(160 ± 10)(0.41 ± 0.03)
Santh655(1.41 ± 0.03)(190 ± 20)(0.26 ± 0.03)
1 λe = 514.5 nm, and the average <λem> values were obtained using tree-independent fresh samples measurements.
Table 2. The τ and η values for several carbon-based nanoparticles, which were synthesized using different carbon sources.
Carbon SourceSample Nameτ (ns)η (%)
Bovine Serum Albumin [58]FC-NPs-27.616.5
Jinhua Bergamot [59]C-dots3.8450.78
Grape Seed [60]sGQDs10.0431.79
Tamarindus indica Leaves [61]CQDs5.9846.6
Chitosan (this work)S3 CNPs(3.65 ± 0.04)(41 ± 3)
Table 3. Time-resolved fluorescent results for chitosan-based carbon dot nanoparticles SCNP, S1, S2, S3, and natural dye Santh.
Sampleτ1 (ns)
(A1 %)
τ2 (ns)
(A2 %)
χ2τAVE (ns)
SCNP1.4 ± 0.2
(73.68)
6.2 ± 0.3
(26.32)
1.00 ± 0.014.34
S13.58 ± 0.05
(100)
-1.01 ± 0.01-
S23.71 ± 0.04
(100)
-1.18 ± 0.08-
S33.65 ± 0.04
(100)
-1.20 ± 0.06-
Santh3.2 ± 0.2
(100)
-1.03 ± 0.05-
Disclaimer/Publisher’s Note: The statements, opinions and data contained in all publications are solely those of the individual author(s) and contributor(s) and not of MDPI and/or the editor(s). MDPI and/or the editor(s) disclaim responsibility for any injury to people or property resulting from any ideas, methods, instructions or products referred to in the content.