Article

Easy and Fast Obtention of ZnO by Thermal Decomposition of Zinc Acetate and Its Photocatalytic Properties over Rhodamine B Dye

by
Dalete Araujo de Souza
1,
Pedro Hyug de Almeida da Silva
1,
Francisco Paulino da Silva
1,
Yonny Romaguera-Barcelay
2,3,
Robson Dantas Ferreira
1,
Edgar Alves Araujo Junior
4,
José Fábio de Lima Nascimento
1,
Fagner Ferreira da Costa
1,
Litiko Lopes Takeno
1,
Yurimiler Leyet Ruiz
5,
Lianet Aguilera Dominguez
5,
Walter Ricardo Brito
2 and
Francisco Xavier Nobre
1,3,5,*
1
GREEN—Grupo de Recursos Energéticos e Nanomateriais, Instituto Federal de Educação, Ciência e Tecnologia do Amazonas, Campus Manaus Centro (IFAM-CMC), Av. Sete de Setembro, Manaus 69020-120, AM, Brazil
2
CEEMPRE-ARISE, BioMark@UC, Department of Chemical Engineering, Faculty of Science and Technology, University of Coimbra, 3030-790 Coimbra, Portugal
3
LABEL—Laboratório de Bioeletrônica e Eletroanalítica (LABEL), Department of Chemistry, Federal University of Amazonas, Manaus 69067-005, AM, Brazil
4
Laboratório de Materiais Avançados, Campus Ministro Petrônio Portela, Universidade Federal do Piauí, Teresina 64049-550, PI, Brazil
5
LPMAT—Laboratório de Processamento de Materiais, Department of Materials Engineering, Federal University of Amazonas, Manaus 69067-005, AM, Brazil
*
Author to whom correspondence should be addressed.
Colorants 2024, 3(3), 229-252; https://doi.org/10.3390/colorants3030016
Submission received: 13 August 2024 / Revised: 15 September 2024 / Accepted: 17 September 2024 / Published: 23 September 2024
(This article belongs to the Special Issue Feature Papers in Colorant Chemistry)

Abstract

:
This study presents a simple, low-cost, and efficient route to obtain zinc oxide by adopting the thermal decomposition method of zinc acetate at 300 (Gr@ZnO_300), 400 (Gr@ZnO_400), 500 (Gr@ZnO_500), and 600 °C (Gr@ZnO_600) for 1 h. The diffraction patterns collected for the samples indicated the majority formation of the hexagonal phase (P63mc) for zinc oxide and residual amounts for graphitic carbon, which has a hexagonal structure of space group P63/mmc. The images collected by scanning electron microscopy (SEM) revealed the formation of sub-microcrystals with elongated rod-shaped morphology, with dimensions between 0.223 and 1.09 μm. The optical and colourimetric properties of the obtained materials indicate the presence of graphitic carbon in the samples, corroborating the analysis by XRD and Raman spectroscopy, with an optical bandgap close to 3.21 eV, and energies of the valence (EVB) and conduction (ECB) bands of 2.89 eV and −0.31 eV, respectively. The photocatalytic performance at 20 min of exposure time under UV light of all prepared samples in the decolourisation of rhodamine B (RhB) dye solutions follows the order Gr@ZnO_300 (95.6%) > Gr@ZnO_600 (92.8%) > Gr@ZnO_400 (84.0%) > Gr@ZnO_500 (78.1%), where the photocatalytic performance of Gr@ZnO_300 sample was 16.5 times more effective than the photolysis test. Moreover, the results confirmed that the best performance was archived at pH = 10, and the holes (h+) and superoxide (O2•−) radicals are the main species involved in the discolouration of RhB dye molecules in an aqueous medium. Finally, the reusability experiment shows high stability of the Gr@ZnO_300 sample as a solid photocatalyst and cycling capability, which obtained total discolouration of RhB of a solution under five cycling experiments of 60 min of exposure to UV light at room temperature.

1. Introduction

Water is the most important natural resource we have, as it is essential for maintaining life on Earth [1]. It is distributed on 70% of the planet’s surface, but most of this water is salty (97.5%), and freshwater is basically 2.5% of this volume [2]. Of this total fresh water, 68.7% is in a solid state, 30.1% is deep underground, and the remainder (1.2%) is available in the atmosphere, present in beings and rivers, lakes, and dams [3]. Given this quantity, we realise the importance of preserving rivers and lakes that are accessible to the majority of society [4].
According to Oliveira [5], Brazil is a privileged country because it has 12% of all the fresh surface water on Earth. However, contamination is also at a worrying level. Among the contaminants that affect water quality due to human activities, fertilisers, pesticides, suspended solid waste, dyes, paints, and others stand out. For Ong et al. [6], one of the promising solutions in response to water issues is the implementation of wastewater recovery and reuse projects to ensure sustainable water development and management. In this context, advanced oxidation processes (AOPs) have attracted significant interest from the scientific community, as they are easy to develop, have low related costs, are scalable, and present high performance in the decolourisation of effluents, degradation of micropollutants, and reduction in heavy metals [7].
Among the advanced oxidative processes, heterogeneous photocatalysis stands out, which consists of the photodegradation or discolouration of molecules that have chromophore groups through the absorption of photons by an inorganic semiconductor [8]. Once excited, the semiconductor provides the emergence of radicals with high oxidising potential and instability, which attack the carbon chains with low selectivity, resulting in the discolouration or mineralisation of the molecules into colourless compounds of low toxicity and molecular weight [9,10].
Several semiconductors have photocatalytic properties. These semiconductors have optical and structural characteristics that enable photocatalytic applications through the absorption of photons in the ultraviolet region, that is, wavelengths shorter than 400 nm, as well as in the visible region of the electromagnetic spectrum.
Among the catalysts with high photocatalytic performance, the polymorphs of titanium oxide—TiO2, zinc oxide—ZnO [6], silver phosphate—Ag3PO4 [11], metal sulphides [12], as well as molybdates—Ag2MoO4 [13], vanadates—AgVO3 [14], and silver tungstates—Ag2WO4 [15]. However, the instability presented by semiconductors during the physical–chemical processes adopted in photocatalytic tests has been a limiting factor in applications in real environments, which results in a decrease in performance over several cycles, therefore making the process economically unfeasible [10].
Currently, technological advances in the field of photocatalysis have sought to improve the properties of materials, mainly by modifying particle size [16], surface area [17], distribution, and morphology [18]. Among the reported semiconductors, zinc oxide (ZnO) stands out for exhibiting properties that enable numerous applications, mainly in the field of photocatalysts [19], sensors [20], drugs [21], adsorbents [22], pigments [23], packaging [24], cosmetics [25], and antimicrobials [26].
ZnO crystallises in three structures: wurtzite, rock salt, and zinc blend. The first case exhibits a hexagonal structure with the space group P63mc and the point group C 6 v 4 , with lattice parameters a = b = 0.32539 nm and c = 0.52098 nm, resulting in an interrelation of layers of hexagonal close-packed (hcp) crystals [27]. At room temperature and high pressures, in this case around 9 GPa, the phase transition from the wurtzite structure to rock salt occurs, and the reverse process may occur under pressure around 2 GPa [28]. The rock salt phase crystallises in the cubic structure with lattice parameters a = b = c = 0.4287 nm, the space group F m 3 ¯ m , and angles α = β = γ = 90° [29]. The zinc blend phase, less common, is also reported for zinc oxide and has a cubic structure (F4 3 ¯ m), with axes a = b = c = 0.4598 nm, and the angle between axes is α = β = γ = 90° [30].
There are several methods for synthesising zinc oxide, among which the hydrothermal [31], sonochemical [32], chemical precipitation [33], sol–gel [19], vapour deposition [34], and thermal decomposition [35] methods are well reported. In particular, it is possible to note that the synthesis methods directly affect the structural, morphological, optical, and catalytic properties of the materials obtained [17,27,31,32].
However, long reaction times, the formation of undesirable phases, the need for sophisticated equipment, and the use of corrosive reagents have driven studies into eco-friendly methodologies without reducing performance in applications of interest. On the other hand, the search for alternatives to improve the optical and catalytic properties of zinc oxide has been reported in the literature [36], which involves obtaining heterojunctions [37], doping with ions of transition elements and rare earths [38,39], as well as support in matrices enriched with carbon [40].
Therefore, carbon-based materials have been promising candidates as catalyst supports due to their high surface area, high stability to different chemical environments, easy obtainability, and availability from natural sources [41]. In the study carried out by Xu et. al. [42], zinc oxide nanoparticles were modified with carbon quantum dots, increasing the surface area and consequent improvements in the photocatalytic properties in the photodegradation of rhodamine B (RhB) dye solutions. On the other hand, Jayababu and Kim [43] presented in their study excellent semiconductor properties for ZnO nanorods supported on black carbon, making them promising materials for supercapacitor applications. The capacitive properties of the composite obtained from graphene and zinc oxide were also reported by Saranya, Ramachandran, and Wang [44], obtaining a specific capacitance close to 122.4 F/g, which is higher than the particular zinc capacitance oxide and pure graphene.
To contribute to the literature related to zinc oxide based on carbon-supported materials, this study reports a simple and economically viable approach to obtain zinc oxide (ZnO) nanostructures supported on a carbon matrix. For these purposes, the thermal decomposition method was adopted at 300 °C, 400 °C, 500 °C, and 600 °C for 1 h. The obtained samples were characterised by X-ray diffraction (XRD), Raman spectroscopy, scanning electron microscopy (SEM), UV-vis diffuse reflectance (UV-vis/DRS) and colourimetric analysis. Meanwhile, the photocatalytic performance was investigated in the decolourisation of RhB dye solutions under UVc radiation under different experimental conditions.

2. Materials and Methods

2.1. Synthesis of Gr@ZnO Nanocomposite

The synthesis of the nanostructures was carried out by the thermal decomposition method of zinc acetate (ZnC4H6O4) (Sigma-Aldrich, São Paulo, Brazil, purity > 99.99%) without any previous purification. Therefore, 6 g of zinc acetate was introduced into a porcelain crucible, and calculations were performed separately at 300, 400, 500, and 600 °C for 1 h in an oxidising atmosphere, adopting a heating rate of 10 °min−1, which remained in the respective ramps for 1 h. The materials were named, respectively, Gr@ZnO_300, Gr@ZnO_400, Gr@ZnO_500, and Gr@ZnO_600. The final material was collected, macerated with the aid of a mortar and pestle, and stored for characterization and photocatalytic applications.

2.2. Characterization

The X-ray diffraction (XRD) patterns of ZnO were performed using a Shimadzu diffractometer (Kyoto, Japan), operating with Cu-Kα irradiation (λ = 0.15406 nm) at 40 mA and 40 kV. The scanning electron microscopy images were acquired using a TESCAN electron microscope (Brno, Czech Republic), model VEGAN 3, using samples deposited on aluminium substrates and carbon tape. The Raman spectra were obtained by a B&W Tek spectrometer (Newark, NJ, USA), model i-Raman Plus, collecting vibrational information in the range of 50 cm−1 to 2000 cm−1, which adopted a laser with a wavelength of 532 nm (green) to excite the samples with a power of 0.2 mW. Diffuse reflectance spectra were collected using a Shimadzu UV-2600 (Tokyo, Japan) spectrophotometer, collecting data in the diffuse reflectance module in the range of 200 to 800 nm, with barium sulphate as the reflection standard. Colourimetric information was obtained using a DeltaVista spectrophotometer (São Paulo, Brazil), model 450G, collecting information in the spectral range between 400 and 700 nm, in solid state, i.e., powder samples, without prior treatment.

2.3. Photocatalytic Experiments

The photocatalytic performance of the prepared materials was investigated in the decolourisation of RhB dye solutions under exposure to four UVc lamps, 15 W each, totalling 60 W, which has an emission wavelength of 253.7 nm. In each photocatalytic experiment, 50 mL of the RhB dye solution and 50 mg of the catalyst were subjected to ultrasonic stirring for 10 min without light (dark) to obtain adsorption equilibrium. Subsequently, the evolution of the decolourisation process of the RhB dye molecules was monitored by collecting aliquots at consecutive intervals of 10 min, centrifuged at 12,000 rpm for 3 min, and collecting the UV-vis spectrum in the range of 190 to 800 nm, followed by the analysis of the absorbance at the wavelength of 554 nm, characteristic of the electronic transitions of the chromophore group of the RhB dye. For this purpose, a UV-vis spectrometer, Thermo Scientific Evolution 201/220 (Waltham, MA, USA, EUA), was operated.

3. Results and Discussion

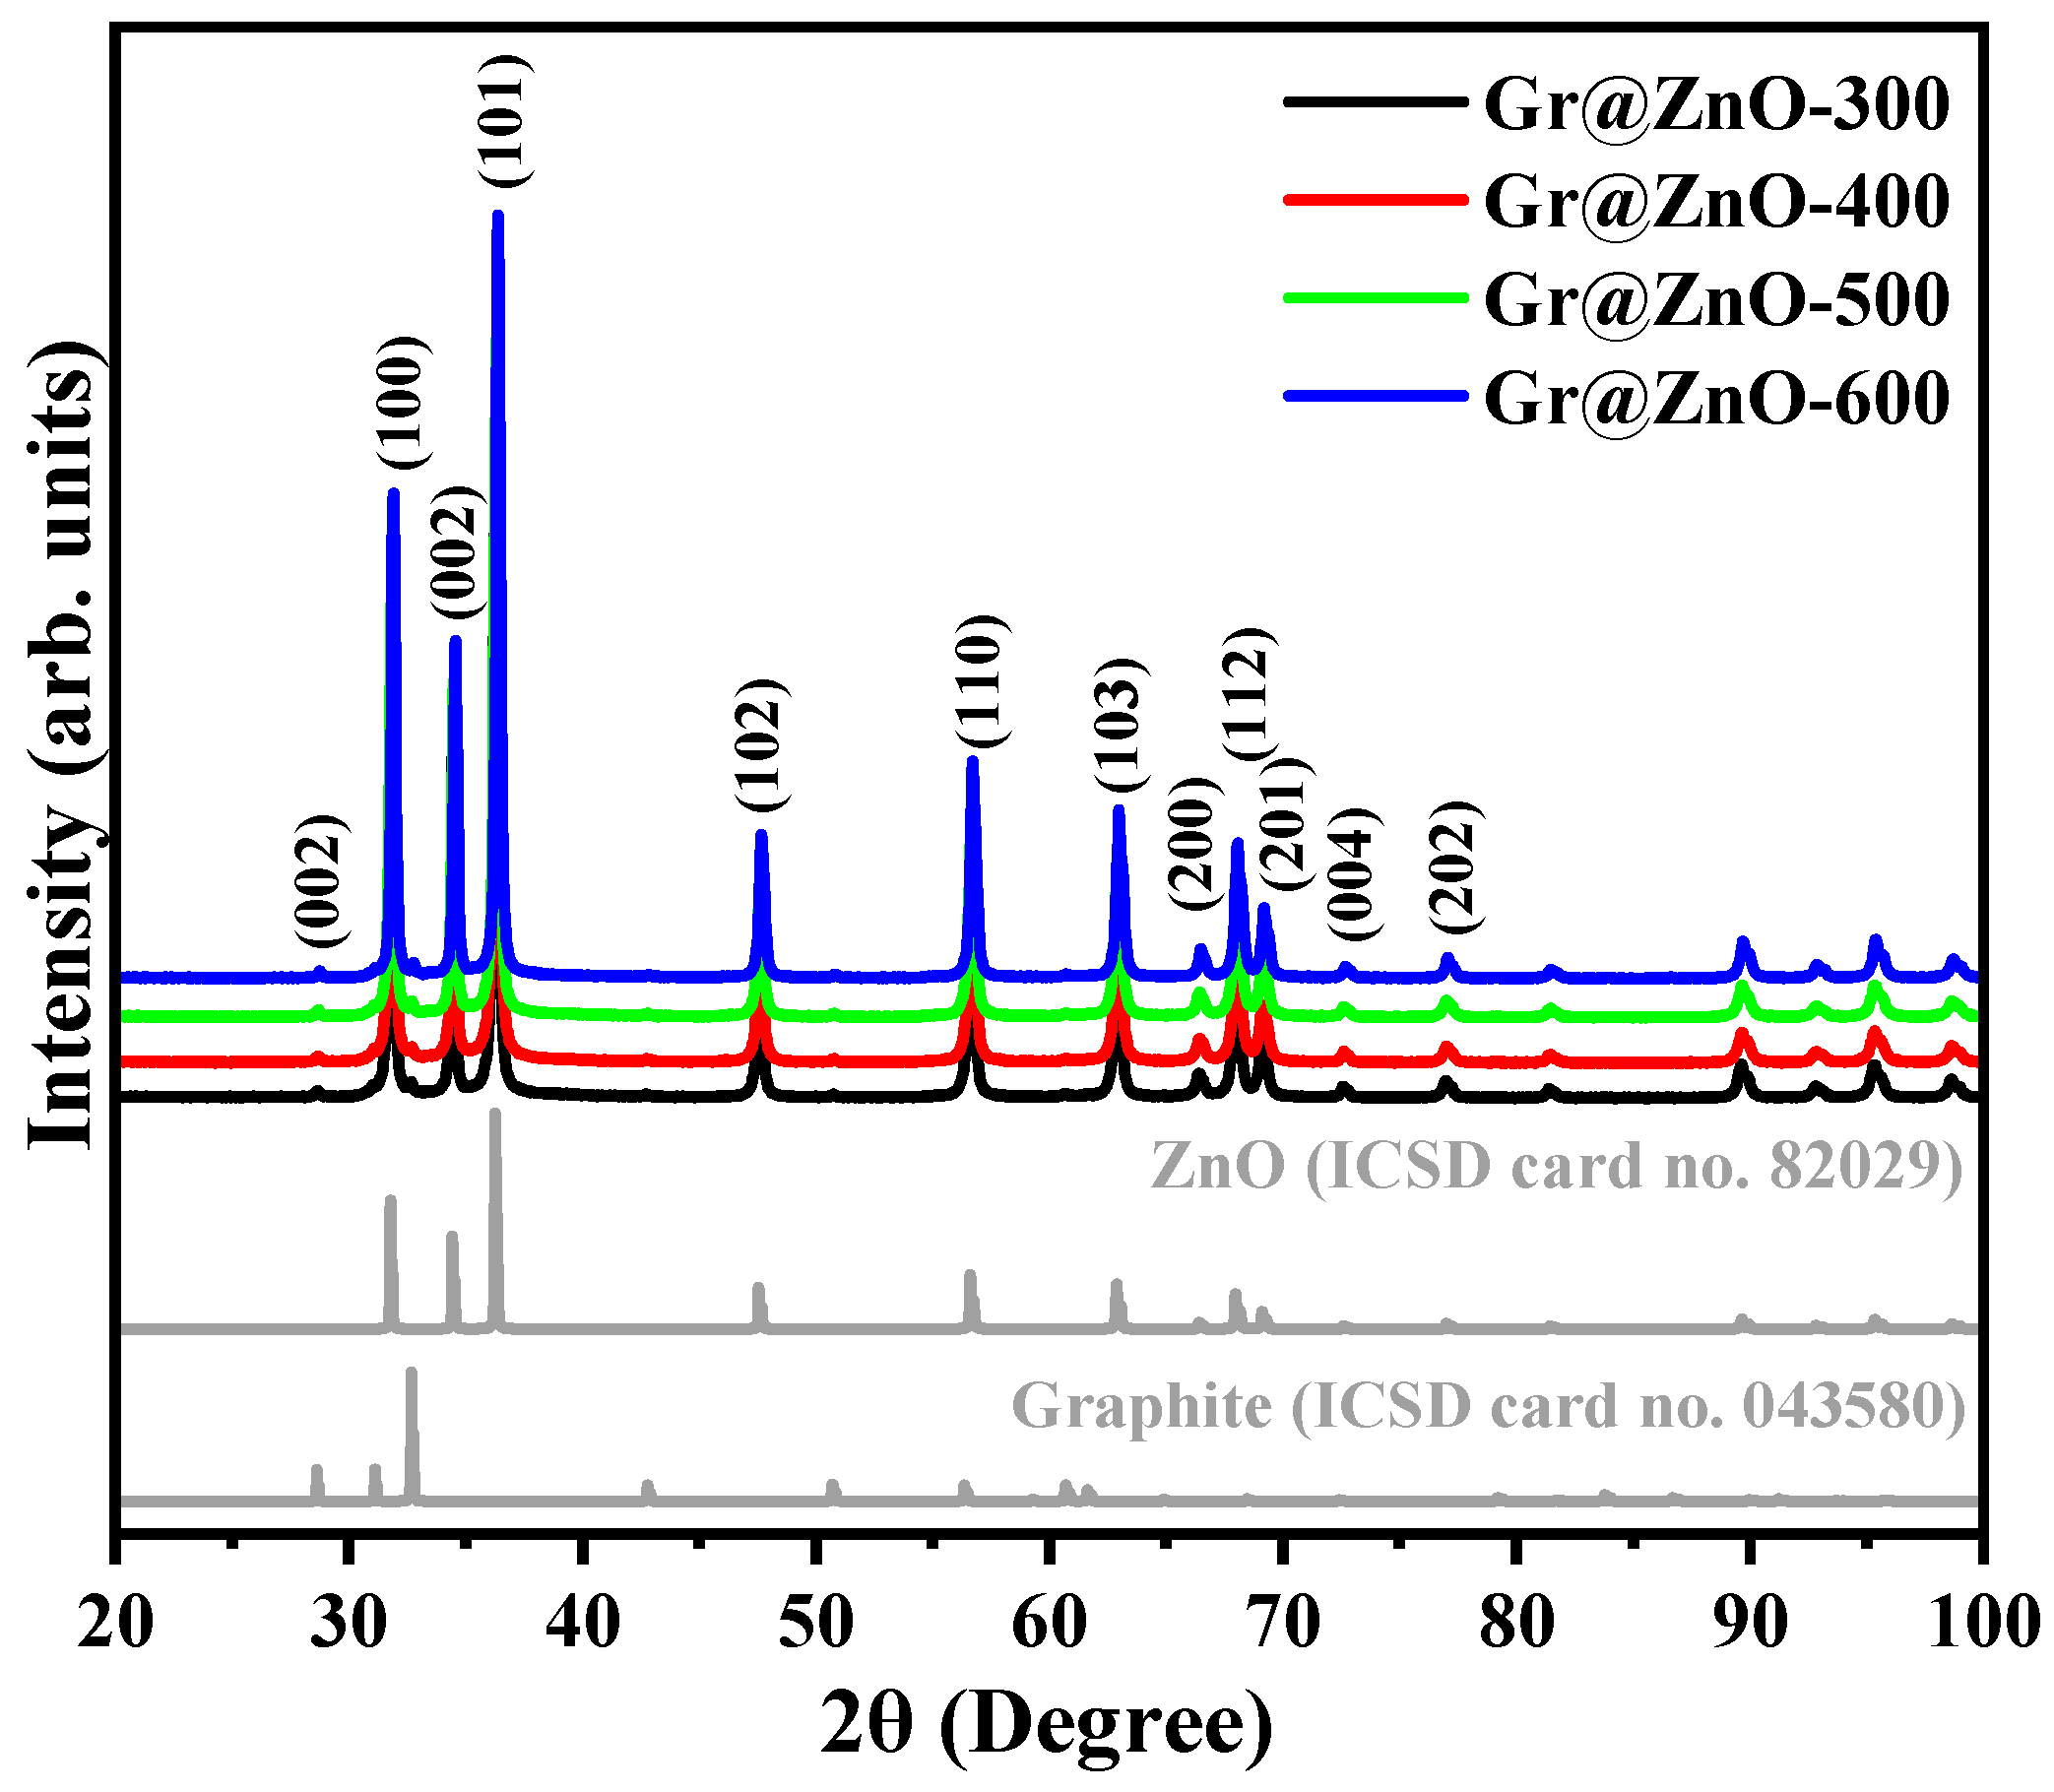
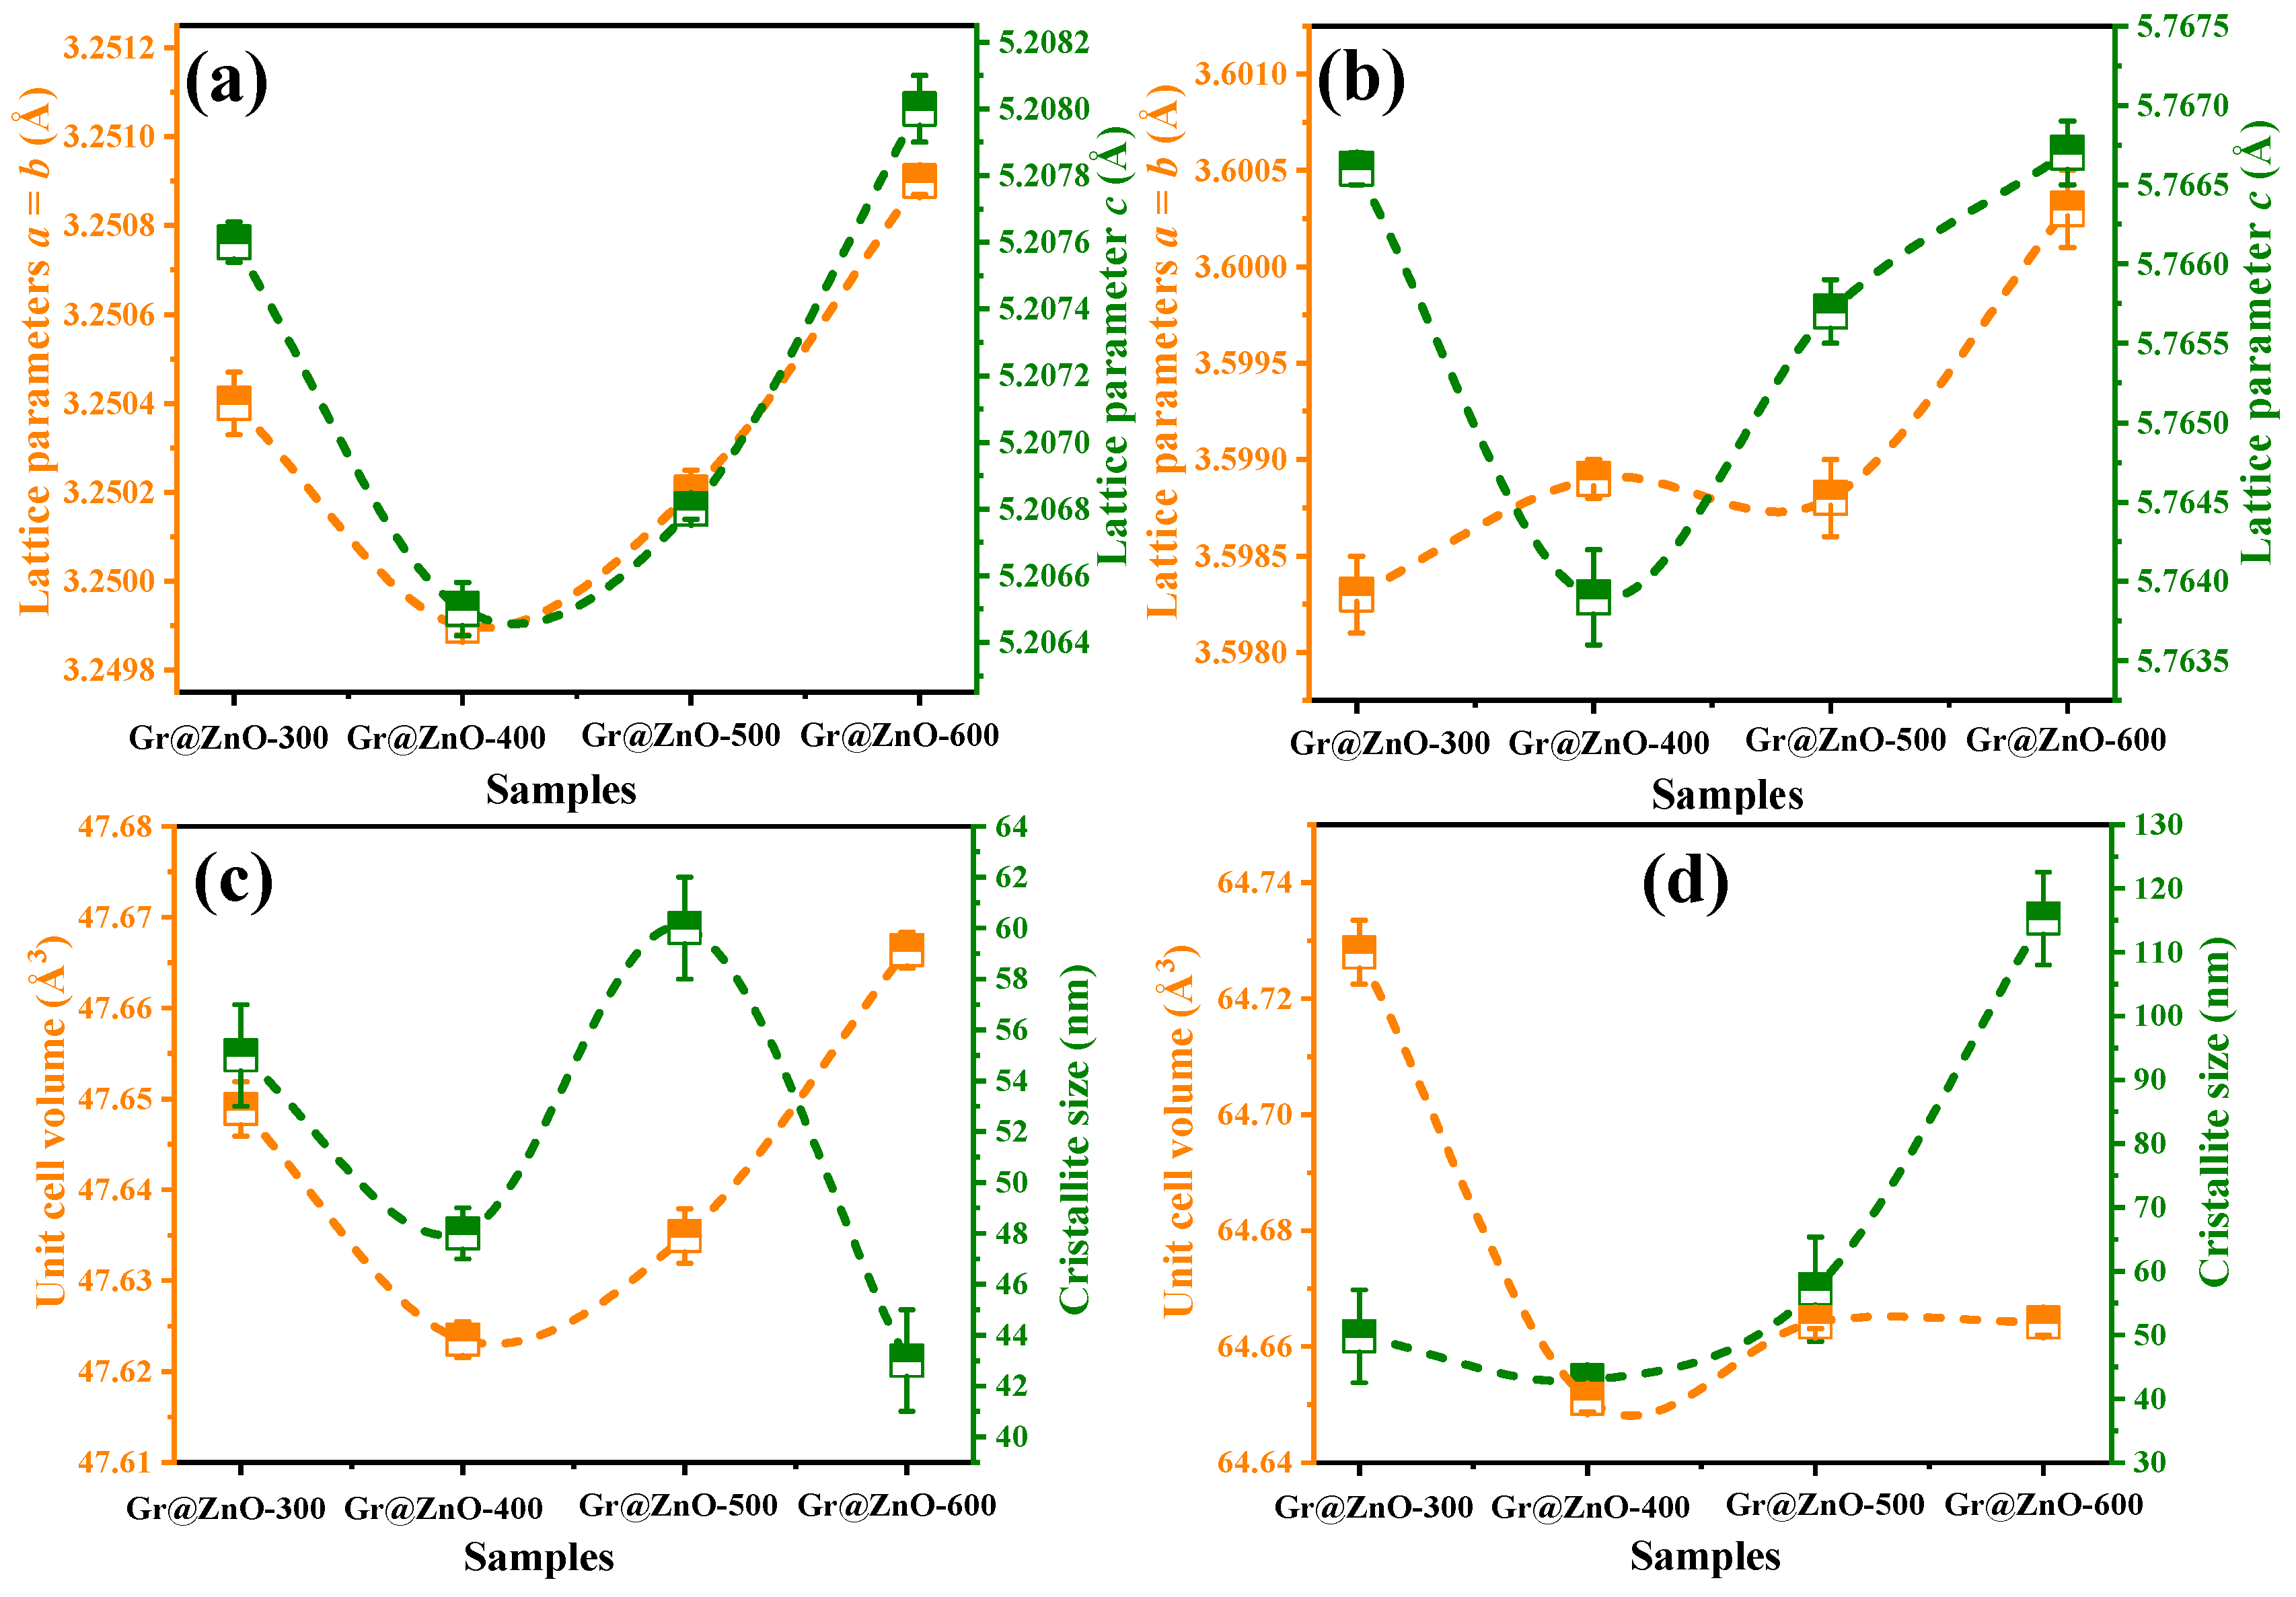
3.1. XRD Diffraction Pattern and Structural Rietveld Refinement

Figure 1 shows the diffraction patterns of the samples Gr@ZnO_300, Gr@ZnO_400, Gr@ZnO_500, and Gr@ZnO_600. Therefore, the indexing of the crystallographic planes resulted in similarity with those characteristics of the hexagonal structure of wurtzite (space group P63mc), with high similarity with the information contained in the Inorganic Crystal Structure Database card no. 82029 [45] and in the consulted literature [19,26,42,43]. The diffraction peaks centred at 31.7°, 34.6°, 36.2°, 47.6°, 56.5°, 62.9°, 68.0°, 69.2°, 72.7°, 77.7°, and 81.4°, were indexed, respectively, to the crystallographic planes (100), (002), (101), (102), (110), (103), (112), (201), (004), (201), and (204). All of these are characteristic of the hexagonal structure of ZnO. The profile and intensity of the diffraction peaks observed in the 2θ range between 20 and 100° suggest the obtention of samples with a high degree of crystallinity and three-dimensional organization at short and long ranges.
In addition to the crystallographic planes associated with the zinc oxide structure, low-intensity diffraction peaks were identified at 2θ angles equal to 28.6°, 31.1°, 32.7°, 42.7°, 50.7°, 56.2°, 60.3°, and 61.7°, in this case, indexed to the hexagonal structure with the space group P63/mmc. Therefore, the result suggests the occurrence of graphitic carbon (Gr) from the thermal decomposition of zinc acetate in air atmosphere during the heat treatment of the samples.
The structural refinement of the synthesised materials is shown in Figure 2a–d, in this case, adopting the Rietveld method, using the Fullprof software, January 2024 version. For these purposes, the Thompson–Cox–Hastings pseudo-Voigt (TCH-PV) function was used to adjust the intensity and profile of the diffraction peaks. At the same time, the background was refined by initially adopting a polynomial function, and for the last cycles, the adjustment by interpolation was adopted. Among other parameters, the atomic positions (x, y, and z), lattice parameters (a, b, c, α, β, and γ), volume, and occupancy were refined.
Figure 2a–d graphically present the plot obtained for the structural refinement by the Rietveld method of the synthesised samples, where Yobs and Ycal correspond to the experimental and theoretical data, respectively. The Yobs–Ycal line, called residual, consists of the difference between the diffraction intensities of the experimental peaks and the peaks mathematically modelled by the adopted function. Finally, the Bragg peaks indicate the positions in 2θ values for the characteristic reflections of the refined crystalline structures. It is important to highlight that the input information used in the fitting calculation was extracted from ICSD card no. 82029 and ICSD card no. 043580, characteristic of zinc oxide and terbium (Tb), respectively. In this case, the diffraction pattern of terbium presents a structure isomorphic to graphitic carbon, with a hexagonal structure and space group of P63/mmc.
As shown in the graphs available in Figure 2a–d, the excellent correlation between the experimental and theoretical information can be noted, reflected by the small amount of residue in the Yobs–Ycal line, further corroborating the initial identification of the graphitic carbon phase. The small difference observed in the 2θ interval between 30 and 40° can be related to the preferential orientation of the crystallographic planes (100), (002), and (101), due to several factors, including the compaction of the samples in the preparation for acquisition of the diffraction patterns.
A detailed study of the crystallographic information was carried out by evaluating the variation in the lattice parameters as a function of the heat treatment temperature, which, in this case, was based on the information obtained by structural refinement using the Rietveld method. In parts of Figure 3a–d, the variation in the lattice parameters (a, b, and c) is graphically presented, as well as the variation in the unit cell volume and crystallite size for the ZnO structures and graphitic carbon structure.
The graphical profile observed in Figure 3a reveals that the variation in the lattice parameters for ZnO exhibited isotropic behaviour, where the same trend for the c axis accompanied the decrease or increase in the a and b coordinate axes. Therefore, the smallest length for the axes was observed for the Gr@ZnO_400 sample, which suffered an approximate reduction of 0.015% in the length of axes in relation to those related to the Gr@ZnO_300 sample. The increase in the heat treatment temperature to 500 °C (Gr@ZnO_500) and 600 °C (Gr@ZnO_600) resulted in an increase in the length of the axes by approximately 0.030%, in relation to the Gr@ZnO_400 sample by the expansion of the unit cell.
These results corroborate what was observed in Figure 3c, which reveals the same trend for the unit cell volume, in this case, obtaining the lowest volume for the Gr@ZnO_400 sample (V = 47.6235(2) Å3), followed by a gradual increase for the Gr@ZnO_500 (V = 47.6349(3) Å3) and Gr@ZnO_600 (V = 47.6664(2) Å3) samples. In contrast, it is noted that the crystallite size did not follow the same behaviour observed for the length of the a, b, and c coordinate axes and unit cell volume, suggesting the presence of crystalline defects, as well as oxygen vacancies, which induce the appearance of distortions of the Zn-O bonds and of the angles in the [ZnO] clusters with tetrahedral symmetry.
For the hexagonal of graphitic carbon (Figure 3b), it is possible to note that the increase in the heat treatment temperature from 300 to 600 °C, in this case, to obtain the samples Gr@ZnO_300, Gr@ZnO_400, Gr@ZnO_500, and Gr@ZnO_600, did not imply a linear or gradual relationship for the length of the coordinate axes. Therefore, based on the structural Rietveld refinement results, the length of a = b axes underwent variations that indicate the shortest length for the sample Gr@ZnO_300 (a = b = 3.5983(7) Å), while the longest length was obtained for the sample Gr@ZnO-600, in this case, 3.6003(5) Å. On the other hand, at a temperature of 400 °C, the shortest length of the c coordinate axis was noted, (5.7639(2) Å), and after this temperature, it gradually increased until reaching the highest value at a temperature of 600 °C (5.7667(3) Å). This behaviour may be related to the bulk of the structure, which undergoes delamination of the superimposed structures and, consequently, independently shortens or elongates the axes a = b and c.
The structural refinement also allowed the quantification of the crystalline phases, in which the composition of ZnO corresponds to 96.74% (Gr@ZnO_300), 95.12% (Gr@ZnO_400), 95.51% (Gr@ZnO_500), and 95.10% (Gr@ZnO_600). For the graphitic carbon phase, the respective percentages related to the phase were 3.26%, 4.88%, 4.49%, and 4.90%, respectively.
Although the diffraction pattern indexed for the lower intensity peaks in the diffraction patterns of the samples coincides with the hexagonal structure of graphite, there may be the occurrence of amorphous carbon such as carbon black, since the temperature of 300 °C was not sufficient for the complete conversion of carbon-rich compounds to graphite at constant pressure. Therefore, this result corroborated the Raman spectroscopy and colourimetry studies described in the subsequent topics.
The crystallite size (Dhkl) for the structures was calculated by adopting the Scherrer method [46], as shown in Equation (1):
D h k l = k λ β h k l c o s θ
where k and λ correspond to the constant associated with the particle shape (k = 0.91) and the wavelength (λCu = 0.15406 nm) adopted in the acquisition of the diffraction patterns of the samples, while β h k l is the full width at half maximum of the diffraction peaks and θ is the diffraction angle associated with the peaks identified in the diffraction pattern, both of which are associated with the hexagonal structure of ZnO and graphitic carbon. In this case, the β h k l was obtained through the following expression: β h k l = β s a m p l e 2 β i n s t r u m e n t a l 2   , where the β i n s t r u m e n t a l was given by Rietveld refinement of the standard diffraction pattern of lanthanum hexaboride (LaB6, Sigma-Aldrich, purity > 99.9%).
The crystallite size for zinc oxide that composes the samples Gr@ZnO_300, Gr@ZnO_400, Gr@ZnO_500, and Gr@ZnO_600 were, respectively, 55, 48, 60, and 43 nm. While for the crystallites that compose the carbon phase, the crystallite size was 110 nm (Gr@ZnO_300), 40 nm (Gr@ZnO_400), 52 nm (Gr@ZnO_500), and 53 nm (Gr@ZnO_600). It is important to highlight that both structures presented a similar graphic profile for the behaviour of the unit cell volume with the increase in the samples’ heat treatment temperature.

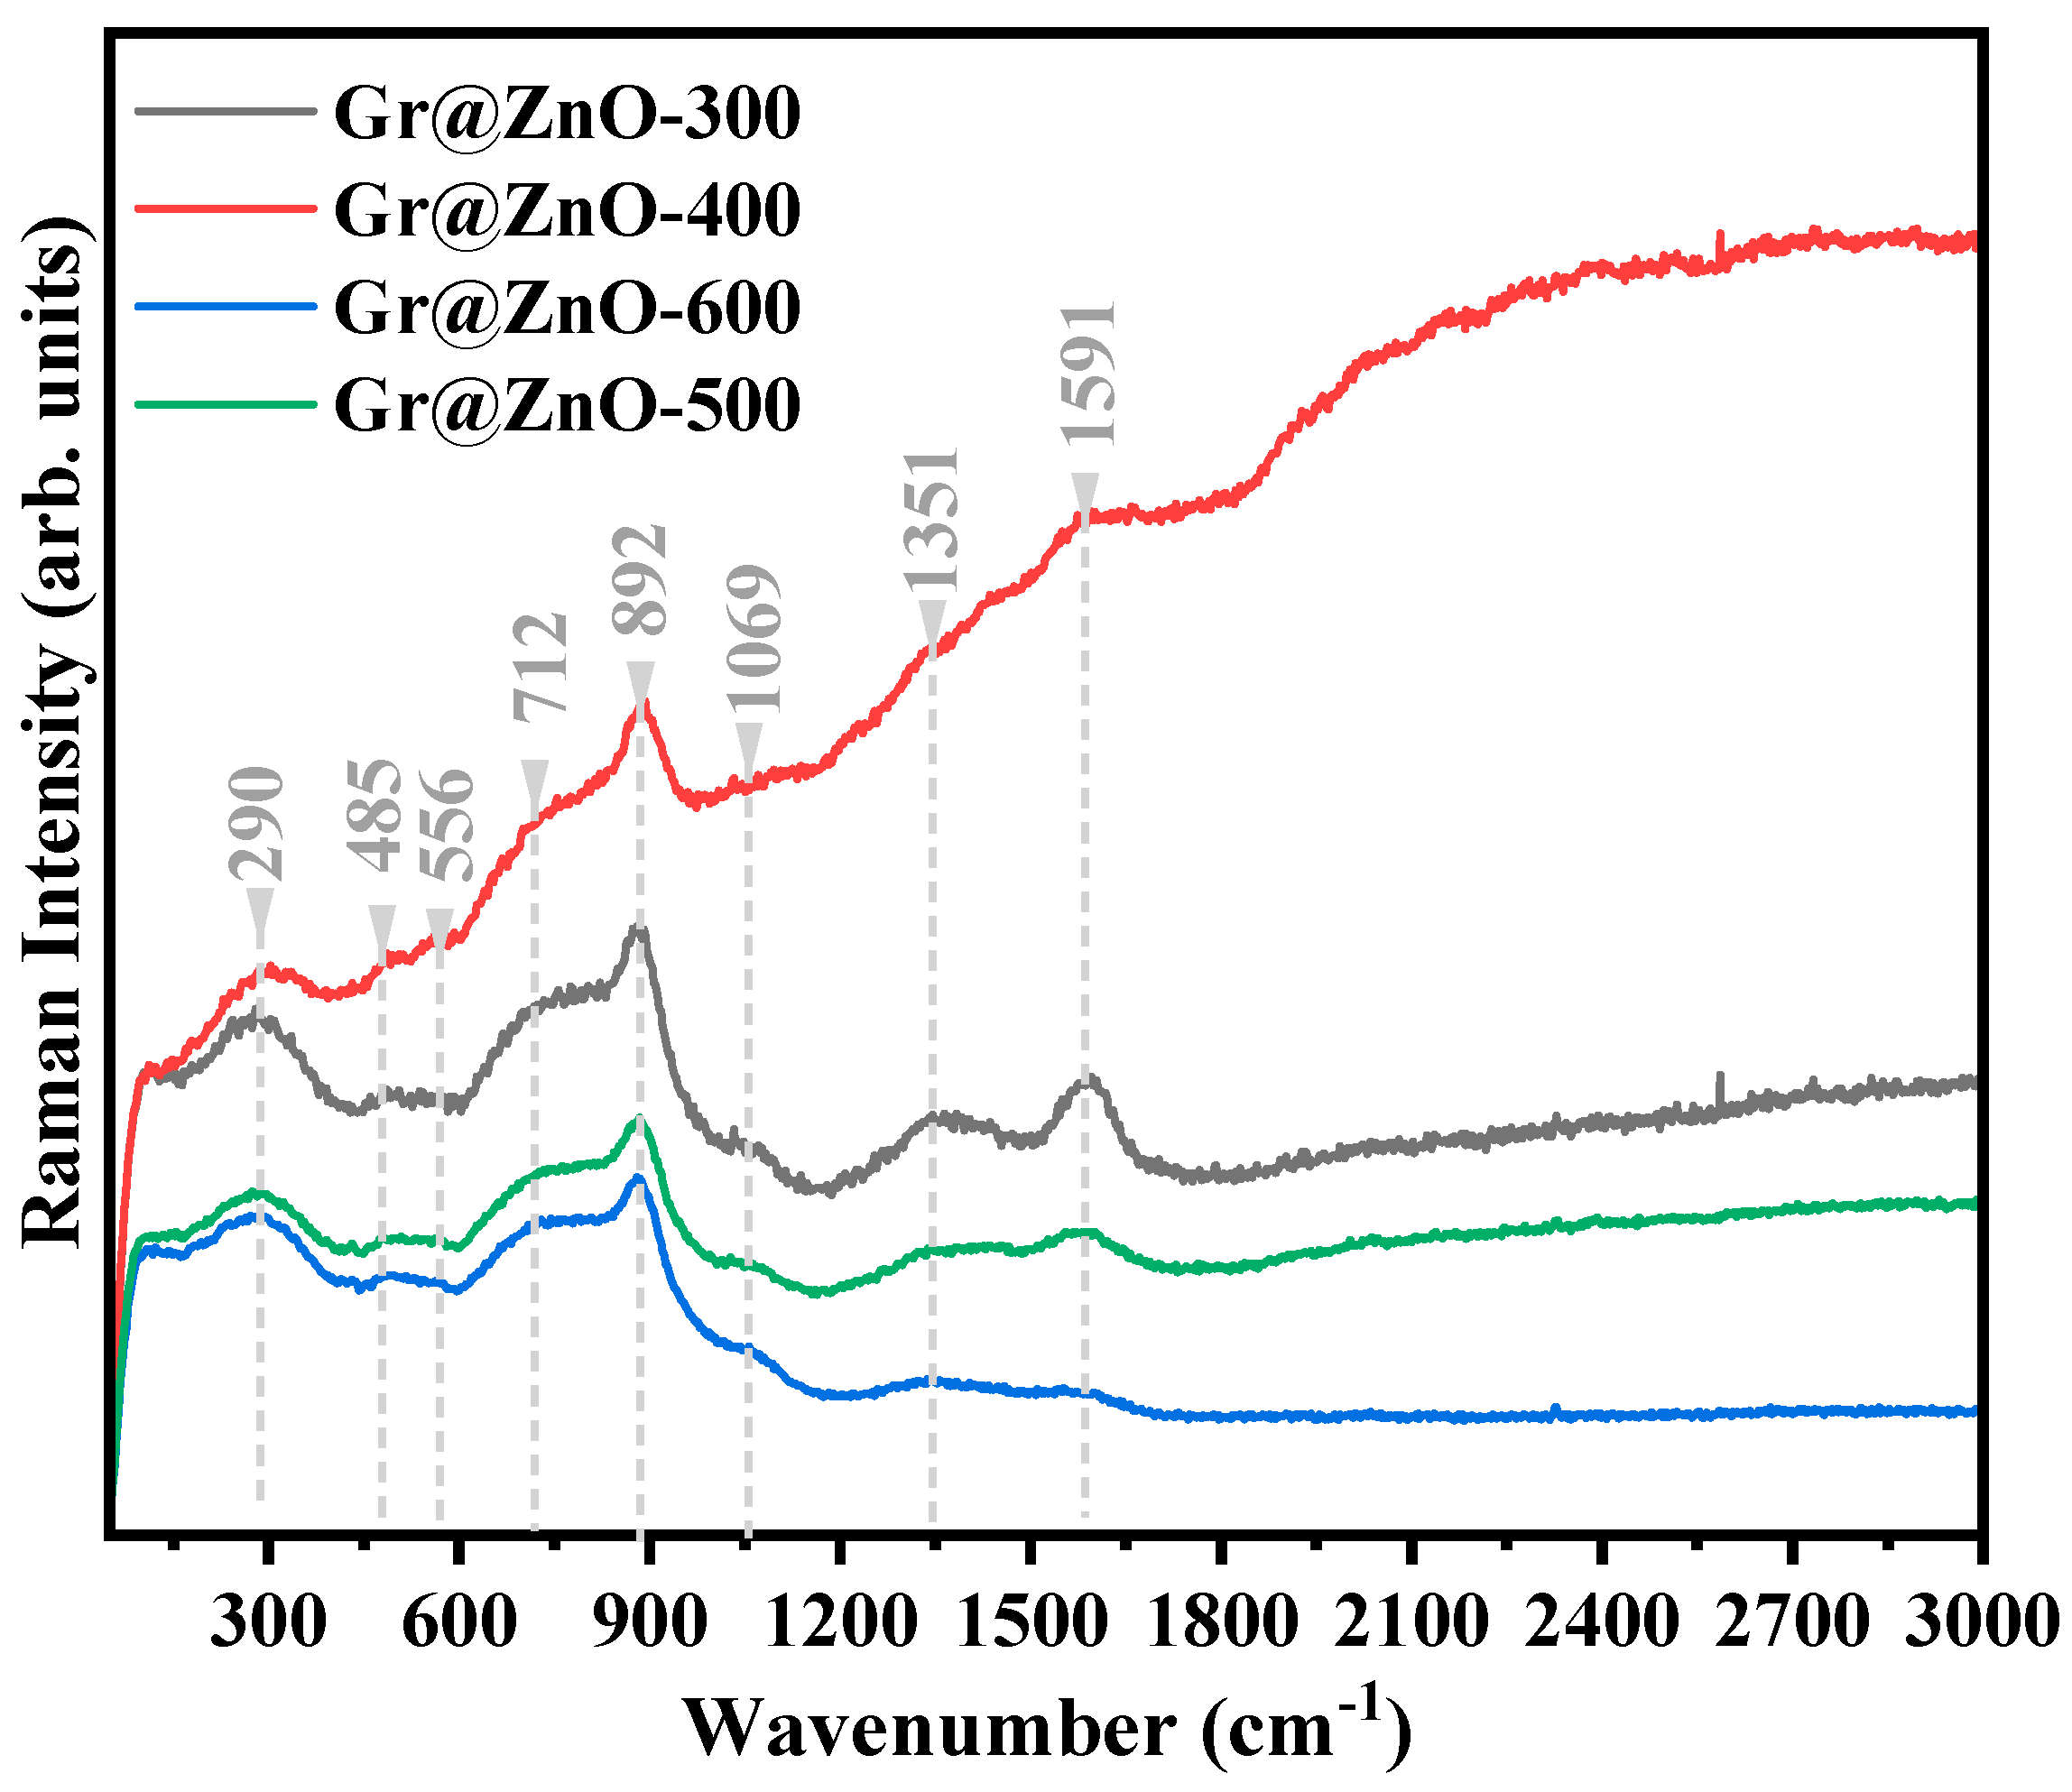
3.2. Vibrational Raman Spectroscopy

The study of the vibrational properties of the obtained samples was carried out by Raman spectroscopy through data acquisition in the range between 50 and 3000 cm−1, as shown in Figure 4. Therefore, it is possible to identify the main active modes of the hexagonal structure of zinc oxide, which, according to group theory, has six active modes for the point group P63mc, as shown in Equation (2) [45].
Γ o p t = 1 A 1 + 2 B 1 + 1 E 1 + 2 E 2
It is worth highlighting that because the A1 and E1 modes are polar, they undergo division, giving rise to the longitudinal modes (LO) and optical modes (TO), where, for the E2 modes, low ( E 2 L o w ) and high ( E 2 H i g h ) vibration frequency modes can be observed for the phonons associated with the vibrations of the oxygen and zinc atoms in the crystal lattice, respectively [47].
In contrast, B1 modes are not active in vibrational Raman spectroscopy. Therefore, the vibrational mode identified at 892 cm−1 and 290 cm−1 is associated with the phonons E 2 H i g h E 2 L o w and A 1 T O + E 2 L o w , respectively. On the other hand, the band between 485 and 556 cm−1 can be associated with the modes A 1 L O / E 2 L o w , while the asymmetric band at 712 cm−1 is attributed to the stretching of the Zn-O-Zn bonds. Second-order vibrations were also identified in the spectra, however, under low intensity, at the wavenumber close to 1069 cm−1. The bands present at 1351 and 1591 cm−1 are characteristic of monolayer carbon structures, called D band and G band, respectively [48]. Therefore, confirming the observations made in the analysis of the XRD patterns, in addition, the absence of the band near 2653 cm−1 is a strong indication of the obtention of a structure enriched with graphitic carbon [49].

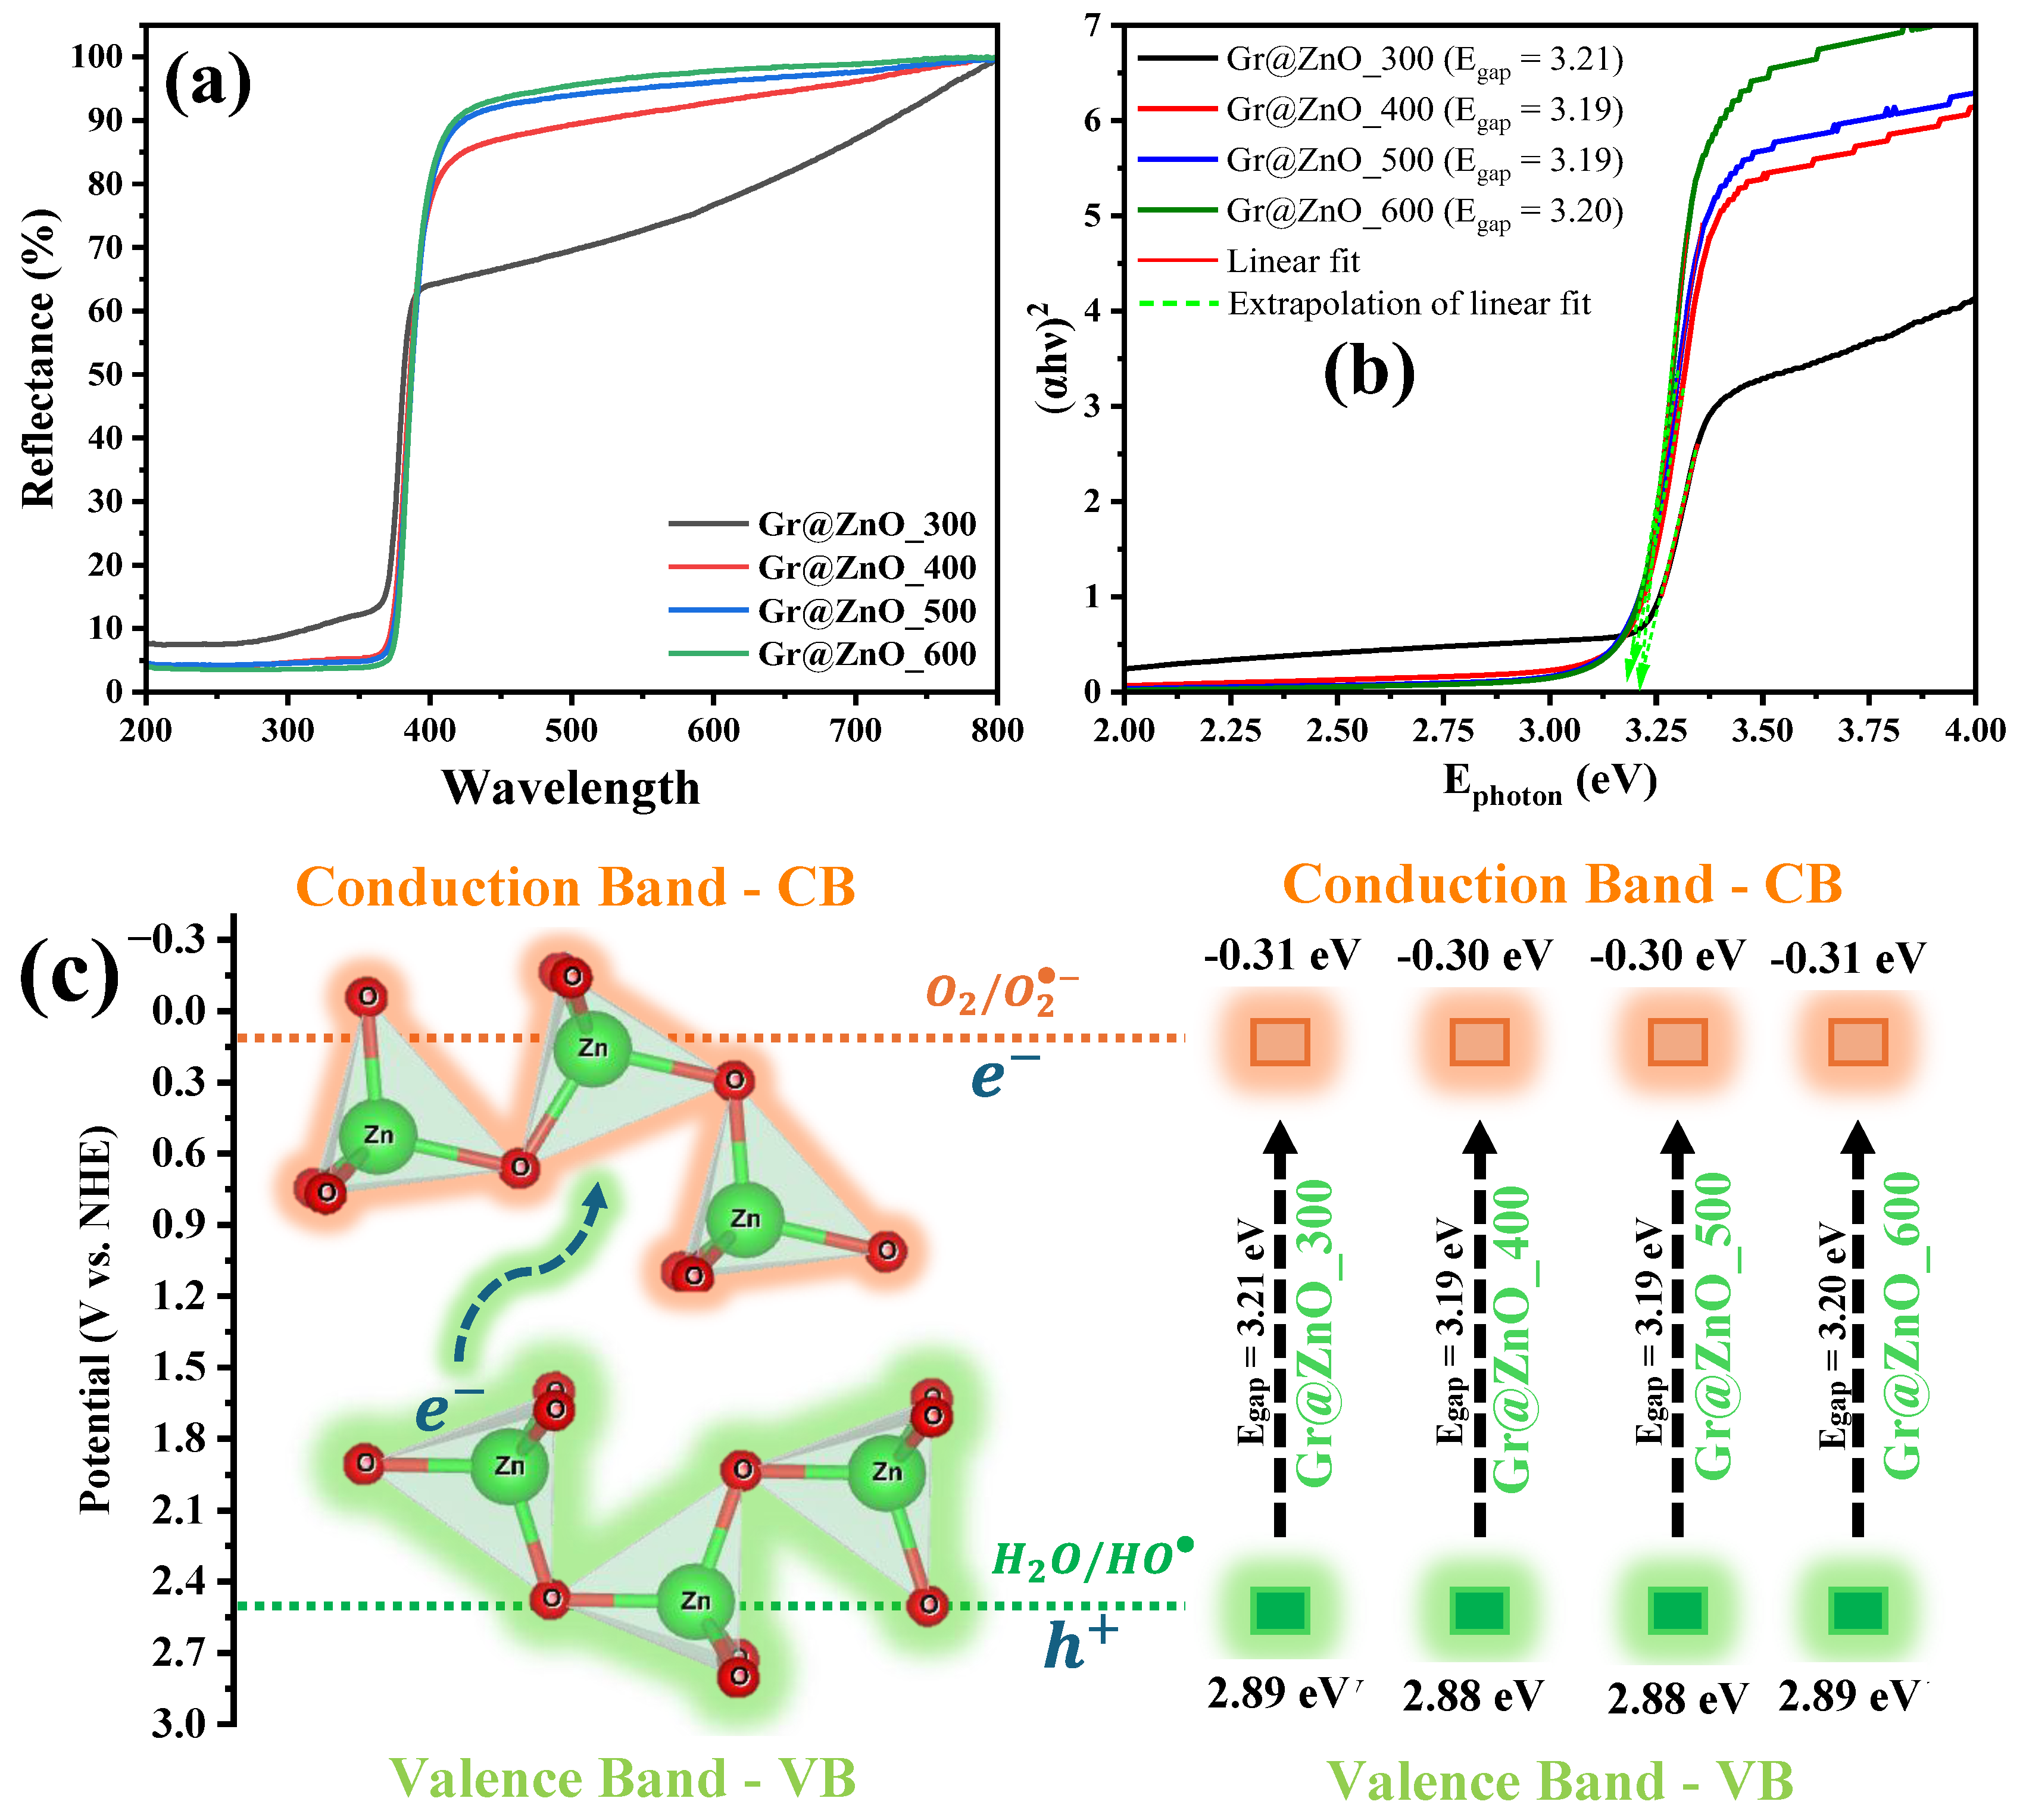
3.3. UV-Vis by Diffuse Reflectance Spectroscopy

The optical properties of the materials were investigated by UV-vis diffuse reflectance spectroscopy (UV-vis/DRS), as shown in parts of Figure 5a–c. Initially, diffuse reflectance spectra were collected in the range of 200 to 800 nm (Figure 5a), which exhibit maximum percentage reflection at wavelengths above 400 nm, a characteristic profile of zinc oxide that absorbs photons in the ultraviolet region [23,50]. In addition, it is possible to confirm the semiconductor characteristics of the synthesised materials, zinc oxide being an n-type semiconductor [51], that is, it makes electrons available in oxidative processes or heterojunctions between n-p-type semiconductors.
When observing the reflectance spectra, the reduction in the reflection percentage for the Gr@ZnO_300 sample and comparison with the others should be noted, a fact that can be related to the absorption of the carbon-enriched phase, which exhibits a more intense dark colour than the others. In this same region, there was a gradual increase in the reflectance percentage with the increase in heat treatment, which was noticeable in the colour variation from dark grey to opaque white. This information agrees with the Raman vibrational modes, which exhibit a reduction in the intensity of the vibrational modes related to the D and G bands, associated with the vibrations of the graphitic carbon structures.
The optical bandgap (Egap) value was calculated by initially converting the wavelength scan interval (λ) into photon energy (Ephot), using the modified Plank Equation (Ephot = 1240 nm.eV/λ). Subsequently, the percentage reflectance data were converted into eV2cm−2, and inserted into the Tauc Equation [52] to obtain the Egap, adopting Equation (3):
( α h ν ) 1 n = C 1 ( h ν E g a p )
where is equivalent to the photon energy, C1 is a proportionality constant, and n is the nature of the type of electronic transition characteristic of the semiconductor [19,21,27,35,53]. Thus, for the direct allowed transitions, direct forbidden transitions, indirect allowed transitions, and indirect forbidden transitions, the values of n are ½, 3/2, 2, and 3, respectively [8]. According to Jafarova and Orudzhev 2021, zinc oxide has predominantly direct electronic transitions, mainly involving electronic transitions between the O 2p orbitals, present in the valence band (VB), and the Zn 4s orbitals, present in the conduction band, that is, above the Fermi level. Therefore, it was decided to adopt direct allowed transitions, that is, n = ½, which determined the value of Egap, extrapolating the straight section of the paraboloidal curve obtained for the data of ( α h ν ) 2 versus photon energy when assigned y = 0.
As shown in Figure 5b, the Egap values for the samples Gr@ZnO_300, Gr@ZnO_400, Gr@ZnO_500, and Gr@ZnO_600 were 3.21 eV, 3.19 eV, 3.19 eV, and 3.20 eV, respectively. Therefore, no significant changes in the optical properties of the materials were observed with increasing temperature during the sample preparation process. Furthermore, all the synthesised samples exhibit strong absorption in the ultraviolet A region, which comprises the range between 3.1 eV and 3.9 eV.
In the study carried out by Otis et al. [54], zinc oxide nanoparticles were efficiently synthesised using the solvency-free solid-state method, using mechanosynthesis, which exhibited an Egap value close to 3.2 eV. On the other hand, Zhou et al. [53] reported the production of zinc oxide nanospheres with a surface area of 86.5 m2 and Egap close to 3.1 eV, adopting the high-energy milling method followed by heat treatment at 300 °C. Therefore, both studies present results that are very close to those obtained for the samples synthesised in the present study regarding optical properties.
To investigate the optical properties of the samples Gr@ZnO_300, Gr@ZnO_400, Gr@ZnO_500, and Gr@ZnO_600 in detail, we decided to calculate the band position of the valence (VB) and conduction (CB) bands, as this information is of utmost importance for the discussion of the possibility of oxidation of water molecules, reduction in oxygen molecules, generation of holes, and capture of electrons by species present in the reaction medium. Thus, the methodology described by Masula et al. [55] was used, which made it possible to calculate the energy values of the valence (EVB) and conduction (ECB) bands, using Equations (4) and (5), respectively:
E V B = χ Z n O E e + 1 2 E g a p
E C B = E V B E g a p
where χ_ZnO is the calculated electronegativity for zinc oxide ( χ Z n O = 5.79 eV), E e is the free electron energy ( E e = 4.5 eV), and Egap is the bandgap energy obtained for each synthesised sample [56]. Therefore, the EVB values were very close, which can be considered the approximate value of 2.89 eV, while the ECB value was approximately −0.31 eV as can be seen in Figure 5c.
The EVB and ECB values indicate the capacity of hole formation ( h + ) in the BV by the samples Gr@ZnO_300, Gr@ZnO_400, Gr@ZnO_500, and Gr@ZnO_600, followed by the oxidation of water molecules present in the reaction medium, resulting in the formation of the chemical species, H+ and HO [57]. In addition, a direct attack of holes on the carbon chains is possible, mainly if there is efficient adsorption of the organic compound molecules on the catalyst surface. On the other hand, the photoexcited electrons for the BC migrate to the catalyst surface and make it possible for them to be captured by the oxygen molecules dissolved in the reaction medium, giving rise to superoxide radicals ( H O 2 ) [6].

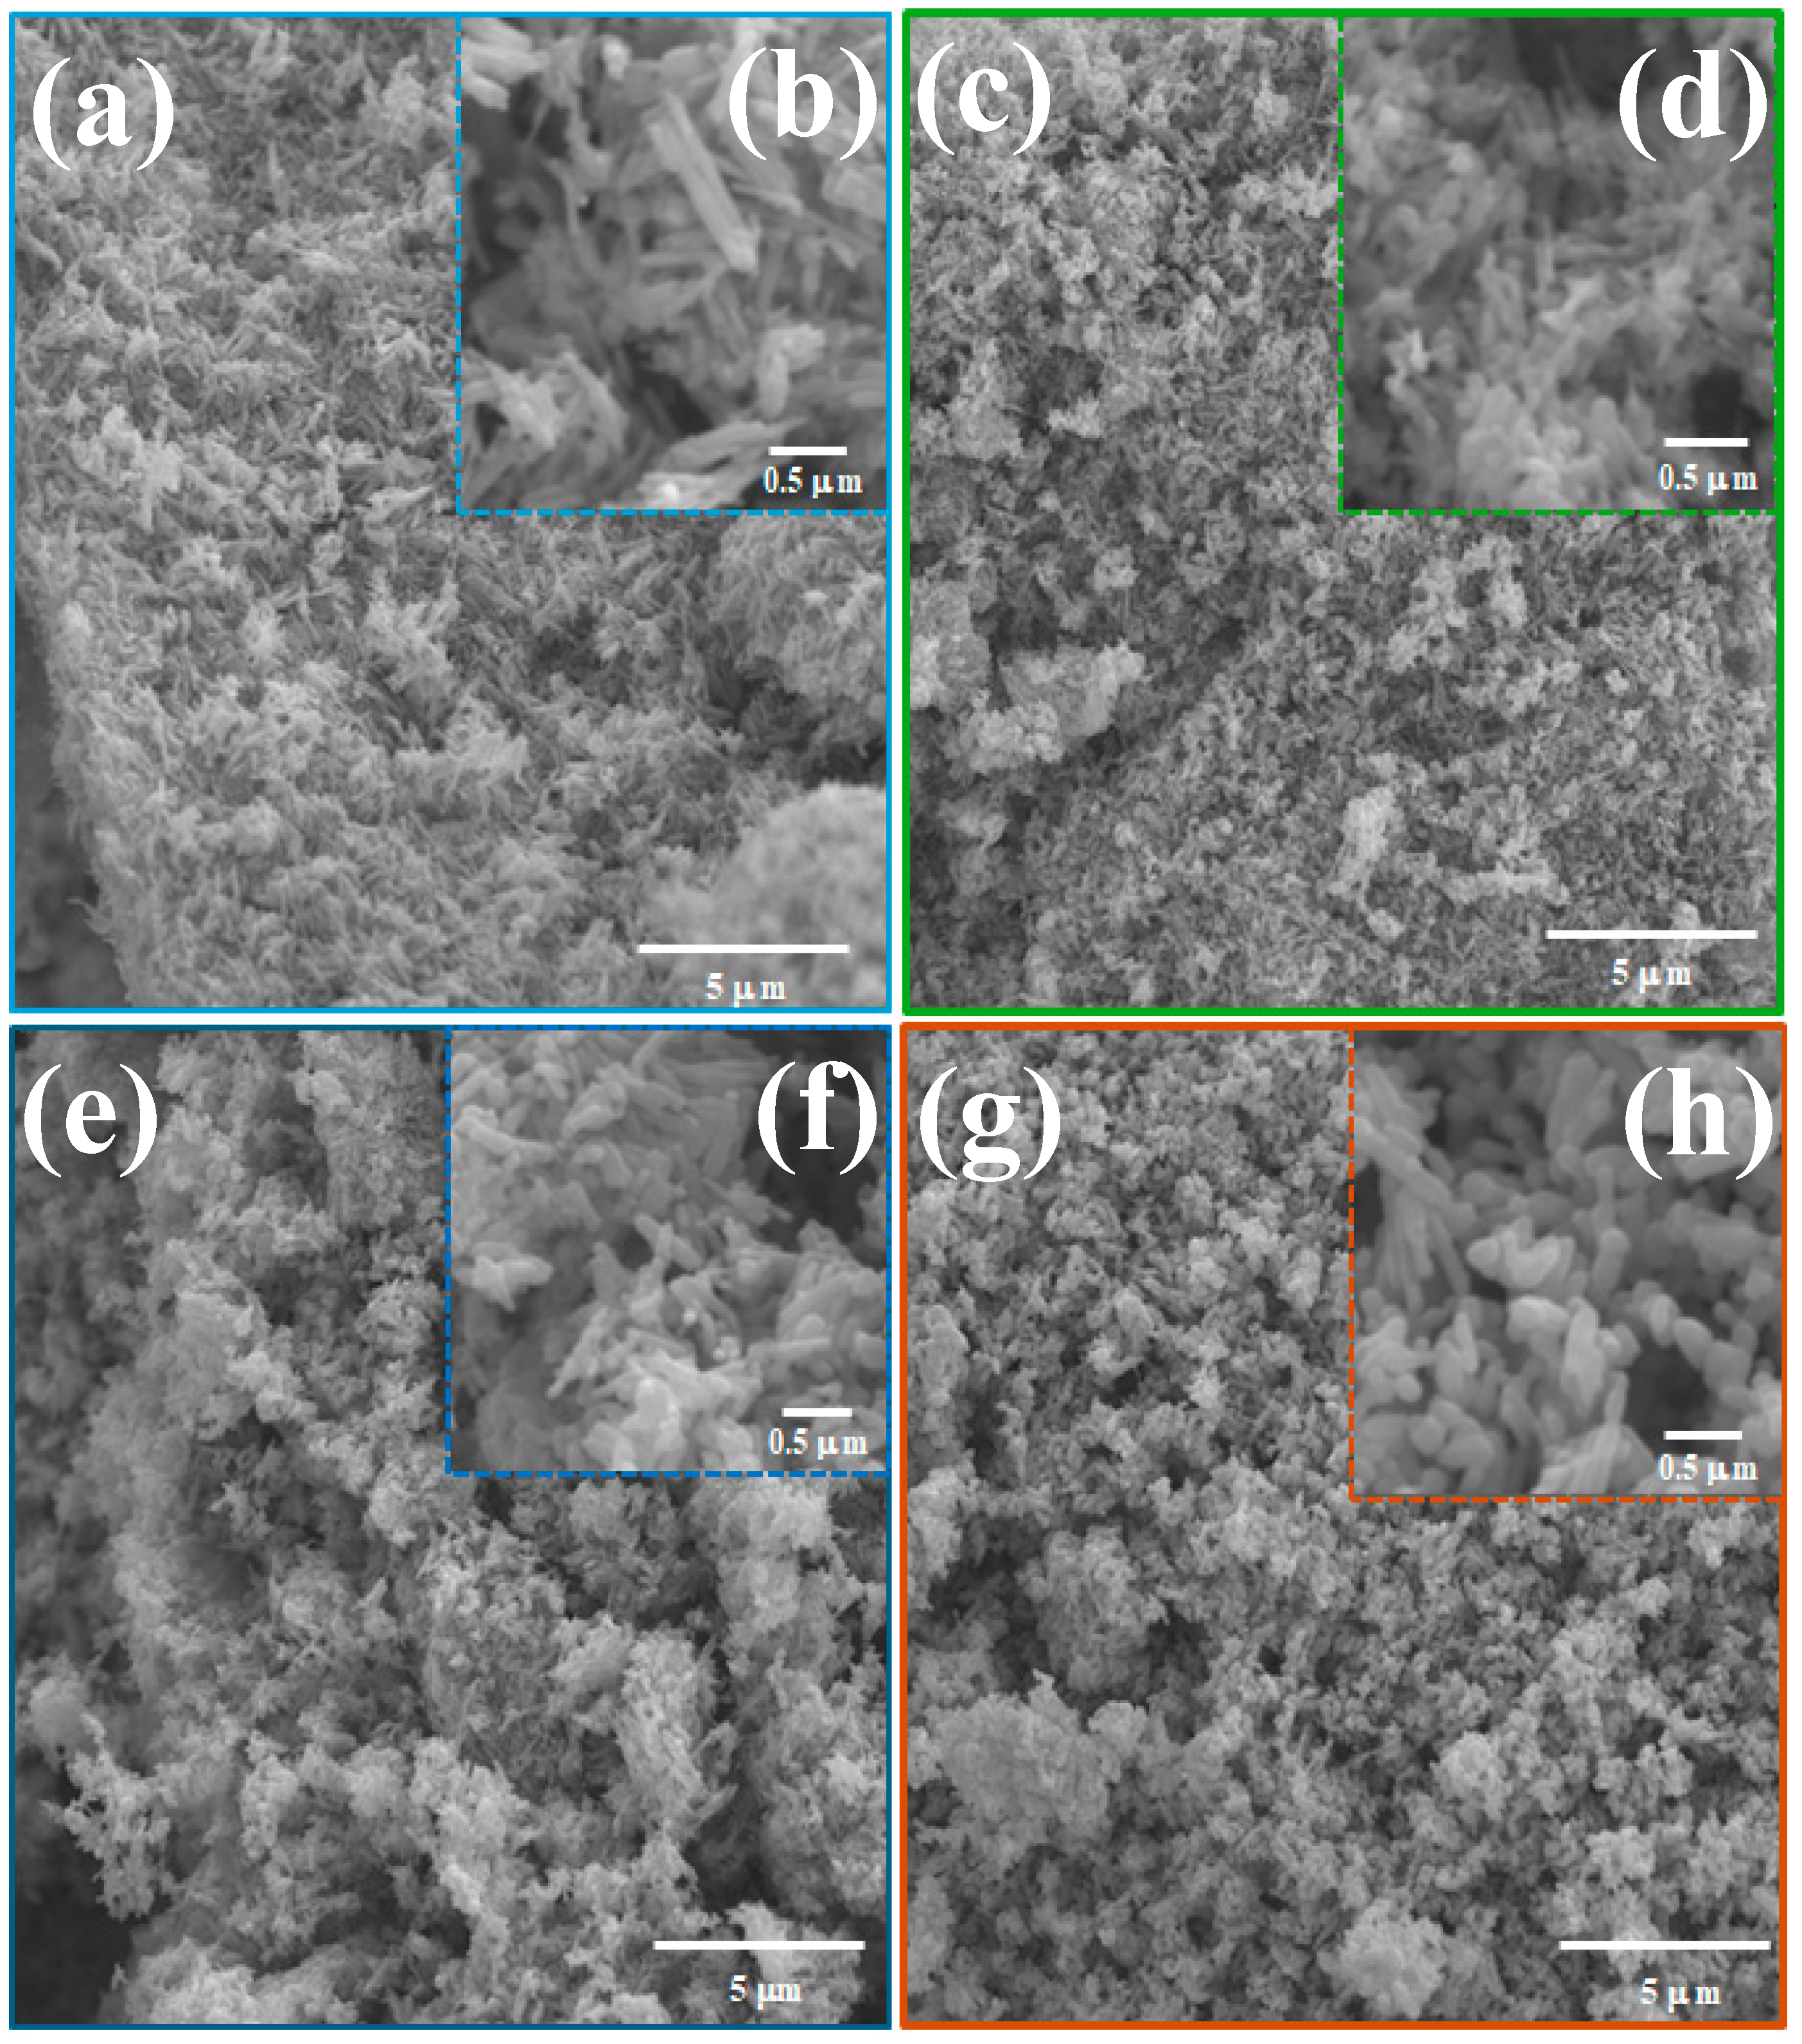
3.4. Scanning Electron Microscopy (SEM) and Energy Dispersive X-ray (EDX)

The morphology of the prepared materials was studied by field emission scanning electron microscopy (FE-SEM), as seen in parts of Figure 6a–h. Based on the images presented, it is possible to notice the occurrence of crystal clusters with elongated shapes resembling rods with submicrometric dimensions. With the aid of the freely available software ImageJ, version 1.53t [58], the length of approximately 50 particles was measured for each of the samples, thus obtaining the length range for the samples Gr@ZnO_300, Gr@ZnO_400, Gr@ZnO_500, and Gr@ZnO_600, of 309–1094 nm, 223–682 nm, 283–682 nm, and 520–573 nm, respectively.
The heterogeneity in particle length is due to the pyrolysis process of zinc acetate, which is used as a precursor in the synthesis of materials. This process undergoes a dehydration process and subsequent degradation of the carbon chains, resulting in the formation of zinc oxide together with carbon-enriched residues with a graphitic structure. In the study carried out by Mar et al. [59], anhydrous zinc acetate was subjected to heat treatment and monitored by excited X-ray photoelectron spectroscopy (XPS), which allowed observing the variation in the bands associated with the energy binding of the elements carbon (C 1s), oxygen (O 1s), and zinc (Zn 2p3/2). The presence of carbon was close to 34%. In comparison, for the elements oxygen and zinc, the percentages were 21% and 19%, respectively.
The semiquantitative analysis of the samples Gr@ZnO_300, Gr@ZnO_400, Gr@ZnO_500, and Gr@ZnO_600 was performed by dispersive X-ray spectroscopy (EDX), accompanied by the analysis of the distribution of the elements in the matrix by mapping as shown in Figure 7a–p.
Based on the information presented in parts of Figure 7a–p, it is worth highlighting the presence of peaks associated with the dispersive energies (Kα) of the elements oxygen and zinc, corresponding to oxygen at 0.5 KeV. For zinc, peaks were identified at values corresponding to 1.0, 8.56 (Kα), and 9.5 keV (Kαb). The peak at 1.53 KeV is due to the Kβ emission of aluminium, which is characteristic of the substrate used to accommodate the samples to acquire the EDX spectra.
The percentage of zinc composition in the samples was 29.62%, 31.72%, 33.08%, and 38.25% for the samples Gr@ZnO_300, Gr@ZnO_400, Gr@ZnO_500, and Gr@ZnO_600, respectively. On the other hand, the percentage composition (mol) for oxygen revealed the respective presence of 70.38%, 68.28%, 66.92%, and 61.75%. Thus, the results indicate that samples with Zn:O ratios of 4.75, 4, 3.8, and 3 were obtained for the samples Gr@ZnO_300, Gr@ZnO_400, Gr@ZnO_500, and Gr@ZnO_600, respectively. These results suggest an increase in the efficiency of carbonization of organic matter with the increase in temperature during the heat treatment, which implied a gradual reduction in the amount of oxygen in the composition of the samples and consequent enrichment of the ZnO phase.

3.5. Colourimetry

The colourimetric analysis of the synthesised materials is summarised in Table 1. It is possible to note that the CIELab colourimetric coordinates [60] indicate the colour variation in the tristimulus diagram, where positive values of a* indicate the predominance of red colour, and the opposite indicates the predominance of green colour. On the other hand, positive and negative values for the b* coordinate indicate the predominance of the colours yellow and blue, respectively [61]. The L* parameter is associated with luminosity. It can display values with a minimum of zero (dark tones) and a maximum of one hundred, which indicates samples with a white tone. Less used, but no less important, is the h* coordinate, called the Hue angle, which indicates the angle for the vector that is projected onto the CIELab diagram in relation to the combination of the colour coordinates a* and b* to obtain the resulting colour [62].
It can be noted that a darker colour (L* = 49.58) was obtained for sample Gr@ZnO_300, indicating the occurrence of amorphous black carbon, as well as the graphite in the composition. In this case, the sample Gr@ZnO_300 exhibited a hexadecimal colourimetric coordinate (Hex) code of 7C756D and RGB coordinates equal to 124, 117, and 109, respectively. At temperatures above 300 °C, we believe that there was a disappearance of residual black carbon to graphite, which, consequently, led to the modification of the colourimetric properties, with a significant variation in the colourimetric coordinate L*. Therefore, we believe that the reduction in the intensity of the molecular vibration bands of the D and G bands in Raman spectroscopy, which are characteristics of black carbon, indicates the conversion of black carbon to graphite. Although the Egap values of the samples are very close, the variation in the colour pattern indicates differences in composition and particle size, which, in this case, are the main factors contributing to the observations made.
Among the samples obtained, the one heat-treated at 400 °C (Gr@ZnO_400) presented a high luminosity value (L* = 81.66). Curiously, it was the sample with the lowest values of crystallographic coordinates and unit cell volume for ZnO. For the carbon structure, it resulted in the lowest values of crystallite size and unit cell volume.

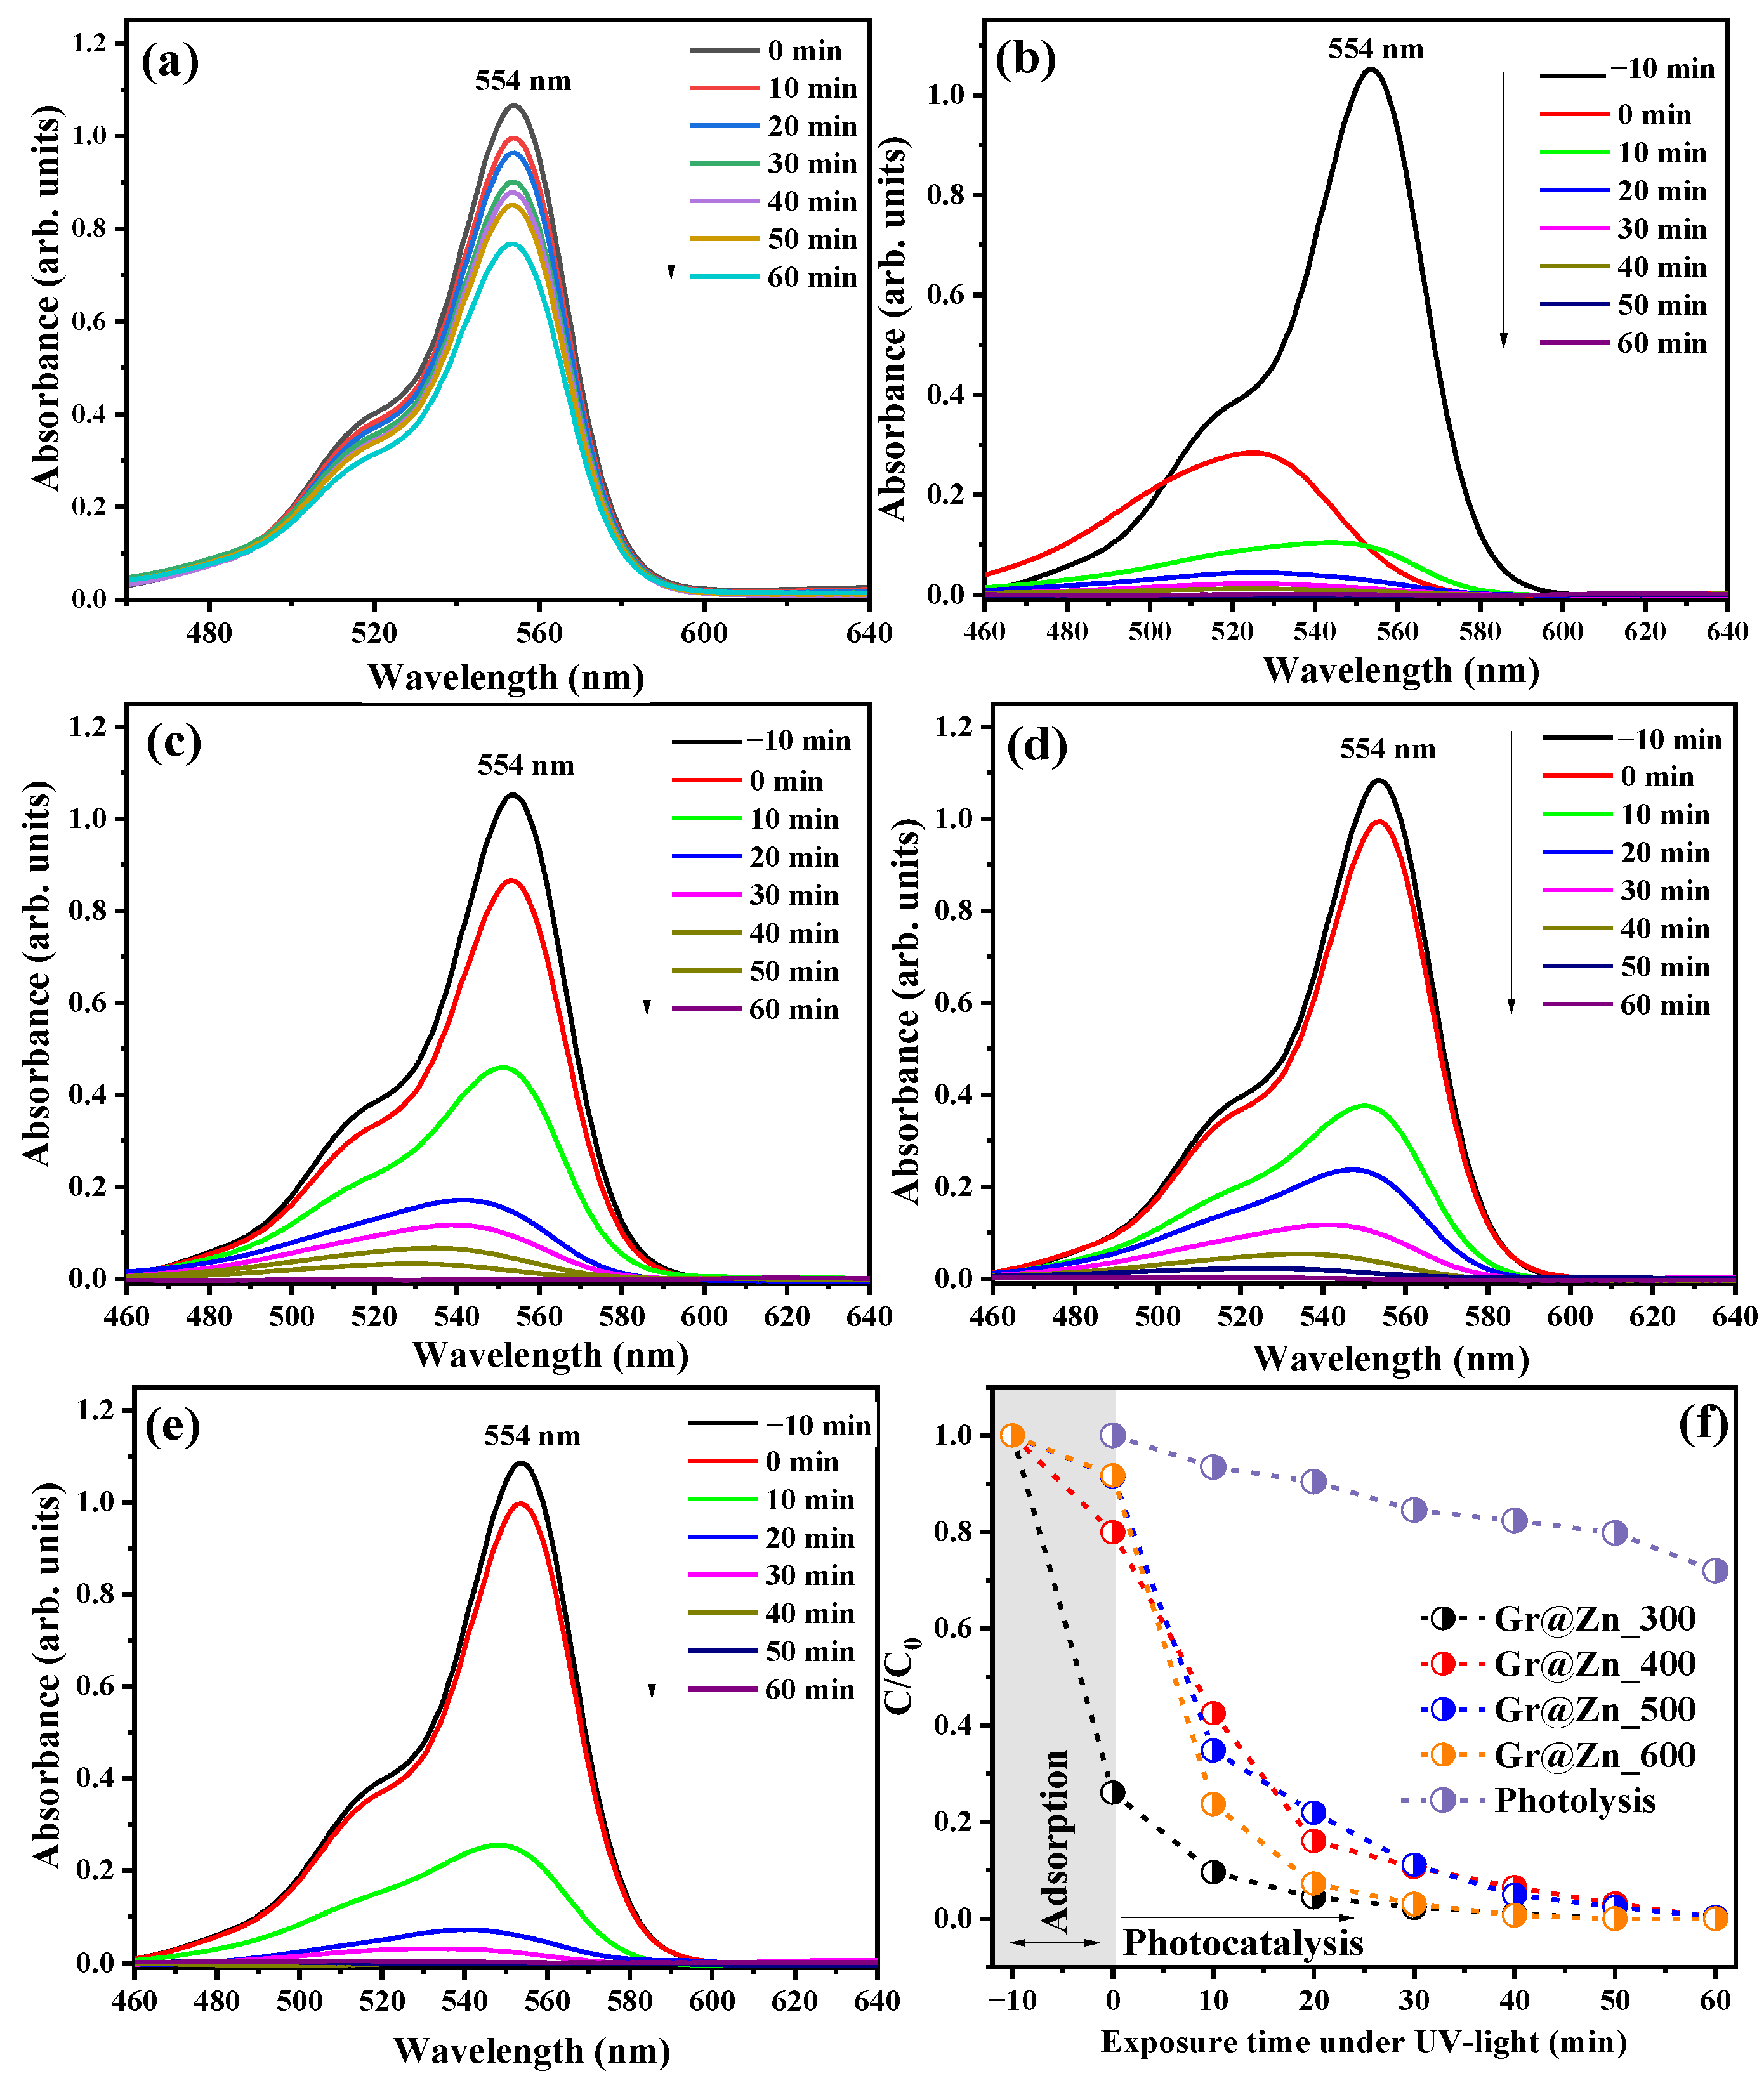
3.6. Photocatalytic Properties of Samples in the Discolouration of RhB Dye Solution

The photocatalytic performance of prepared materials was investigated by decolourising the rhodamine B (RhB) dye in an aqueous medium under ultraviolet radiation with an emission wavelength of 253.7 nm, as shown in Figure 8a–f. The decolourisation process was investigated over 60 min of exposure under constant magnetic stirring and aeration with a compressed air flow rate of 3 Lmin−1 for these purposes.
Initially, the contribution of the energy associated with the wavelength of the radiation used was investigated [63,64,65]. Thus, the photolysis experiment was conducted, in which an RhB dye solution with a concentration of 5 mgL−1 was exposed to UVc light for 60 min under constant magnetic stirring and aeration. As can be seen in Figure 8a, there was a slight reduction in the maximum absorption of the RhB dye solution after 60 min, due to the high stability of the RhB dye molecules to the oxidative process. Therefore, there was an approximate reduction of 27.5% of the initial concentration at 60 min of exposure, which can be considered insufficient for effective effluent remediation. Differently, when using samples Gr@ZnO_300, Gr@ZnO_400, Gr@ZnO_500, and Gr@ZnO_600 as heterogeneous catalysts in the photocatalytic process, as shown in Figure 8b–e, a rapid decrease in the absorption band of the RhB dye molecules was noted, accompanied by visual discolouration of the solution.
Among the catalysts used, the samples Gr@ZnO_300 and Gr@ZnO_600 exhibit similar performance, which resulted in 100% decolourisation of the solution after 40 min of exposure to UVc radiation. The evolution of the decolourisation process of the solution was accompanied by the plot of C/C0 as a function of the exposure time (min), where C corresponds to the concentration at different times and C0, the initial concentration, in this case, 5 mgL−1, as can be seen in Figure 8f.
It is important to point out that before the UVc radiation exposure process, the solutions containing the catalyst were subjected to adsorption equilibrium with the solid phase (catalyst) with an ultrasonic washer for 10 min in the absence of light. This methodology allows us to observe that among the catalysts used in the experiments, the Gr@ZnO_300 sample was the one that resulted in the highest adsorption percentage, which corresponds to approximately 73% of the initial concentration (Figure 8f). While the other samples, Gr@ZnO_400, Gr@ZnO_500, and Gr@ZnO_600, resulted in the respective percentages of 17.5%, 7.6%, and 7.31%.
This behaviour suggests the high electrostatic affinity of the RhB dye molecules with the surface of the Gr@ZnO_300 catalyst, possibly due to the carbon chains and oxygenated groups present. These induce the modification of the surface and an increase in the disposition of anionic species, consequently contributing to the increase in the adsorption of the RhB dye molecules [66,67,68].
The kinetic study for the oxidative processes involving tests in the presence and absence of catalysts (photolysis) was carried out using the pseudo-first-order model represented by Equation (6) [69], commonly reported for photocatalytic tests involving inorganic semiconductors as heterogeneous catalysts, mainly zinc oxide:
ln ( C C 0 ) = k a p p t
where kapp and t correspond to the apparent rate constant and time, respectively. Furthermore, assuming that the final concentration can be half the initial concentration (C = 1 2 C0) [70], the half-life value for the reaction can be obtained.
From these results, it is noted that the apparent rate constant for the decolourisation reactions of the RhB dye followed the decreasing order of 118.34 × 10⁻³ min−1 (r2 = 0.997), 79.96 × 10⁻³ min−1 (r2 = 0.997), 69.93 × 10⁻³ min−1 (r2 = 0.994), and 63.99 × 10⁻³ min−1 (r2 = 0.984), referring to the experiments with the catalysts Gr@ZnO_600, Gr@ZnO_300, Gr@ZnO_500, and Gr@ZnO_400, respectively. For the experiment called photolysis, a rate constant equal to 4.87 × 10⁻³ min−1 (r2 = 0.990) was obtained, which indicates a decolourisation rate ratio of the RhB dye molecules approximately 24.2 and 16.4 times faster for the experiment having the catalysts Gr@ZnO_600 and Gr@ZnO_300 compared to the experiment in the absence of catalysts, that is, photolysis.
In the study carried out by Altaf et al. [18], zinc oxide microcrystals were efficiently synthesised using the hydrothermal method, followed by recrystallization of the materials by heat treatment at temperatures of 300, 600, and 800 °C and subsequently applied in the photodegradation of the RhB dye in aqueous medium. The authors obtained a rate constant equivalent to 35.6 × 10⁻³ min−1 using experimental conditions. While in the study presented by Kumar et al. [71], zinc oxide nanoparticles were used in the photocatalysis of the RhB dye, resulting in a rate constant equal to 3.9 × 10⁻³ min−1.
Due to the lower heat treatment temperature for the Gr@ZnO_300 sample and similar photocatalytic performance compared to the Gr@ZnO_600 sample, as can be seen in Figure 8f, it was decided to study the effect of varying the initial pH of the solution, in this case, pH = 3, 5, 7, 9, and 11, adopting this as the catalyst for the photocatalytic experiments. Therefore, Figure 9a,b present the graph of C/C0 versus time of exposure to UVc radiation adopting the Gr@ZnO_300 sample as a heterogeneous catalyst, as well as the graph of the zero point charge, for the photocatalytic performance of the Gr@ZnO_300 sample in the discolouration of RHB dye solutions at a concentration of 10 mgL−1.
Based on these results, it is possible to note that although the catalyst has a significant photocatalytic activity for all pH ranges in acidic media (pH = 3 and 5), this behaviour is inferior when compared to neutral and basic pH. In this study, the best performance was achieved for pH = 9 and 11. This result can be correlated to (i) direct oxidation of the RhB dye chains by the removal of electrons by the photogenerated holes (h+), which destabilise the molecules, causing successive reactions and losses of groups of atoms that contribute to the charge transfer in the chromophore chain and (ii) oxidation of the H O ions and consequent formation of the HO [72,73,74]. Once in an aqueous medium, the radicals HO attack the carbon chains, mainly the electrons present in the π bonds, leading to instability of the bonds and successive breaks. This gives rise to compounds with lower molecular weight and, ultimately, mineralization of the molecules [75,76,77].
Corroborating the information presented in the previous paragraph, the zero charge point available in Figure 9b shows the behaviour of the surface charges with the variation in the pH of the medium for the sample Gr@ZnO_300, in which it is noticeable that under pH intervals below 6.02, there was a predominance of positive surface charges on the surface of the catalyst Gr@ZnO_300, which explains the lower catalytic performance observed, due to the repulsion of the molecules of the dye RhB, which is a cationic molecule, in which case there is majority participation of superoxide radicals ( O 2 ) and hydroxyl radicals (HO), since direct oxidation by holes is not favoured.
On the other hand, at pH values above the zero-point charge (PZC), i.e., 6.02, negative surface charges predominate, which favour the adsorption of RhB dye molecules on the catalyst surface, consequently inducing direct oxidation by the action of photogenerated holes. In addition, the arrangement of hydroxyl groups in the reaction medium increases the conversion rate of hydroxyl ions into hydroxyl radicals, favouring oxidative processes and consequent decolourisation of RhB dye molecules. In addition to the tests in the presence of the catalyst, experiments in its absence were also conducted at acidic and basic pH, which did not significantly affect the decolourisation of RhB dye molecules, as seen in Figure 9a. Therefore, this reinforces the importance of the Gr@ZnO_300 catalyst as an accelerator of the oxidative process.
The significant participation of the oxidising species holes, electrons, hydroxyl radicals and superoxide radicals was investigated by adding scavenging substances: ammonium oxalate (AO), silver nitrate (SN), tert-butanol alcohol (TA), and p-benzoquinone (PB), respectively [58,63,68,78]. For comparison purposes, an experiment was conducted in the absence of scavengers, called WC. This made it possible to evaluate the percentage reduction in the percentage decolourisation of the solutions by the addition of the captured substances in the reaction medium and thus determine the majority contribution of each of the species involved.
Figure 10a–f present the UV-vis spectra of the solutions subjected to catalytic tests, investigating each species’ contribution by adding their respective radical scavenger, adopting a scavenger concentration of 1 × 10⁻⁴ molL−1 for all cases.
Figure 10e shows the experiment performed in the absence of scavengers in the reaction medium, where it is possible to observe the complete disappearance of the characteristic RhB dye band, with maximum absorbance at wavelength 554 nm after 60 min and exposure to UVc radiation. However, when the tests were performed with the addition of the substance p-benzoquinone (Figure 10b) and ammonium oxalate (AO) (Figure 10c), which are the scavengers of holes and superoxide radicals, respectively, there was a significant decrease in the oxidation performance of the RhB dye molecules, compared to the tests performed with the addition of hydroxyl radical scavengers (Figure 10a) and electrons (Figure 10c).
The percentage decrease in performance involving the experiments in the 30 min time period followed the decreasing order AO (42.74%) > PB (40.46%) > TBA (26.01%) > SN (14.64%). Based on this information, it is possible to confirm that holes, superoxide radicals, and hydroxyl radicals are the main oxidising species generated from the photoexcitation of the Gr@ZnO_300 catalyst in aqueous medium. Xu et al. [42] reported in their study the performance of superoxide radicals and holes as the main active oxidising species in the photodegradation of the RhB dye in aqueous medium by zinc oxide nanoparticles when irradiated by ultraviolet light. Therefore, their findings corroborate the results obtained in the present study.

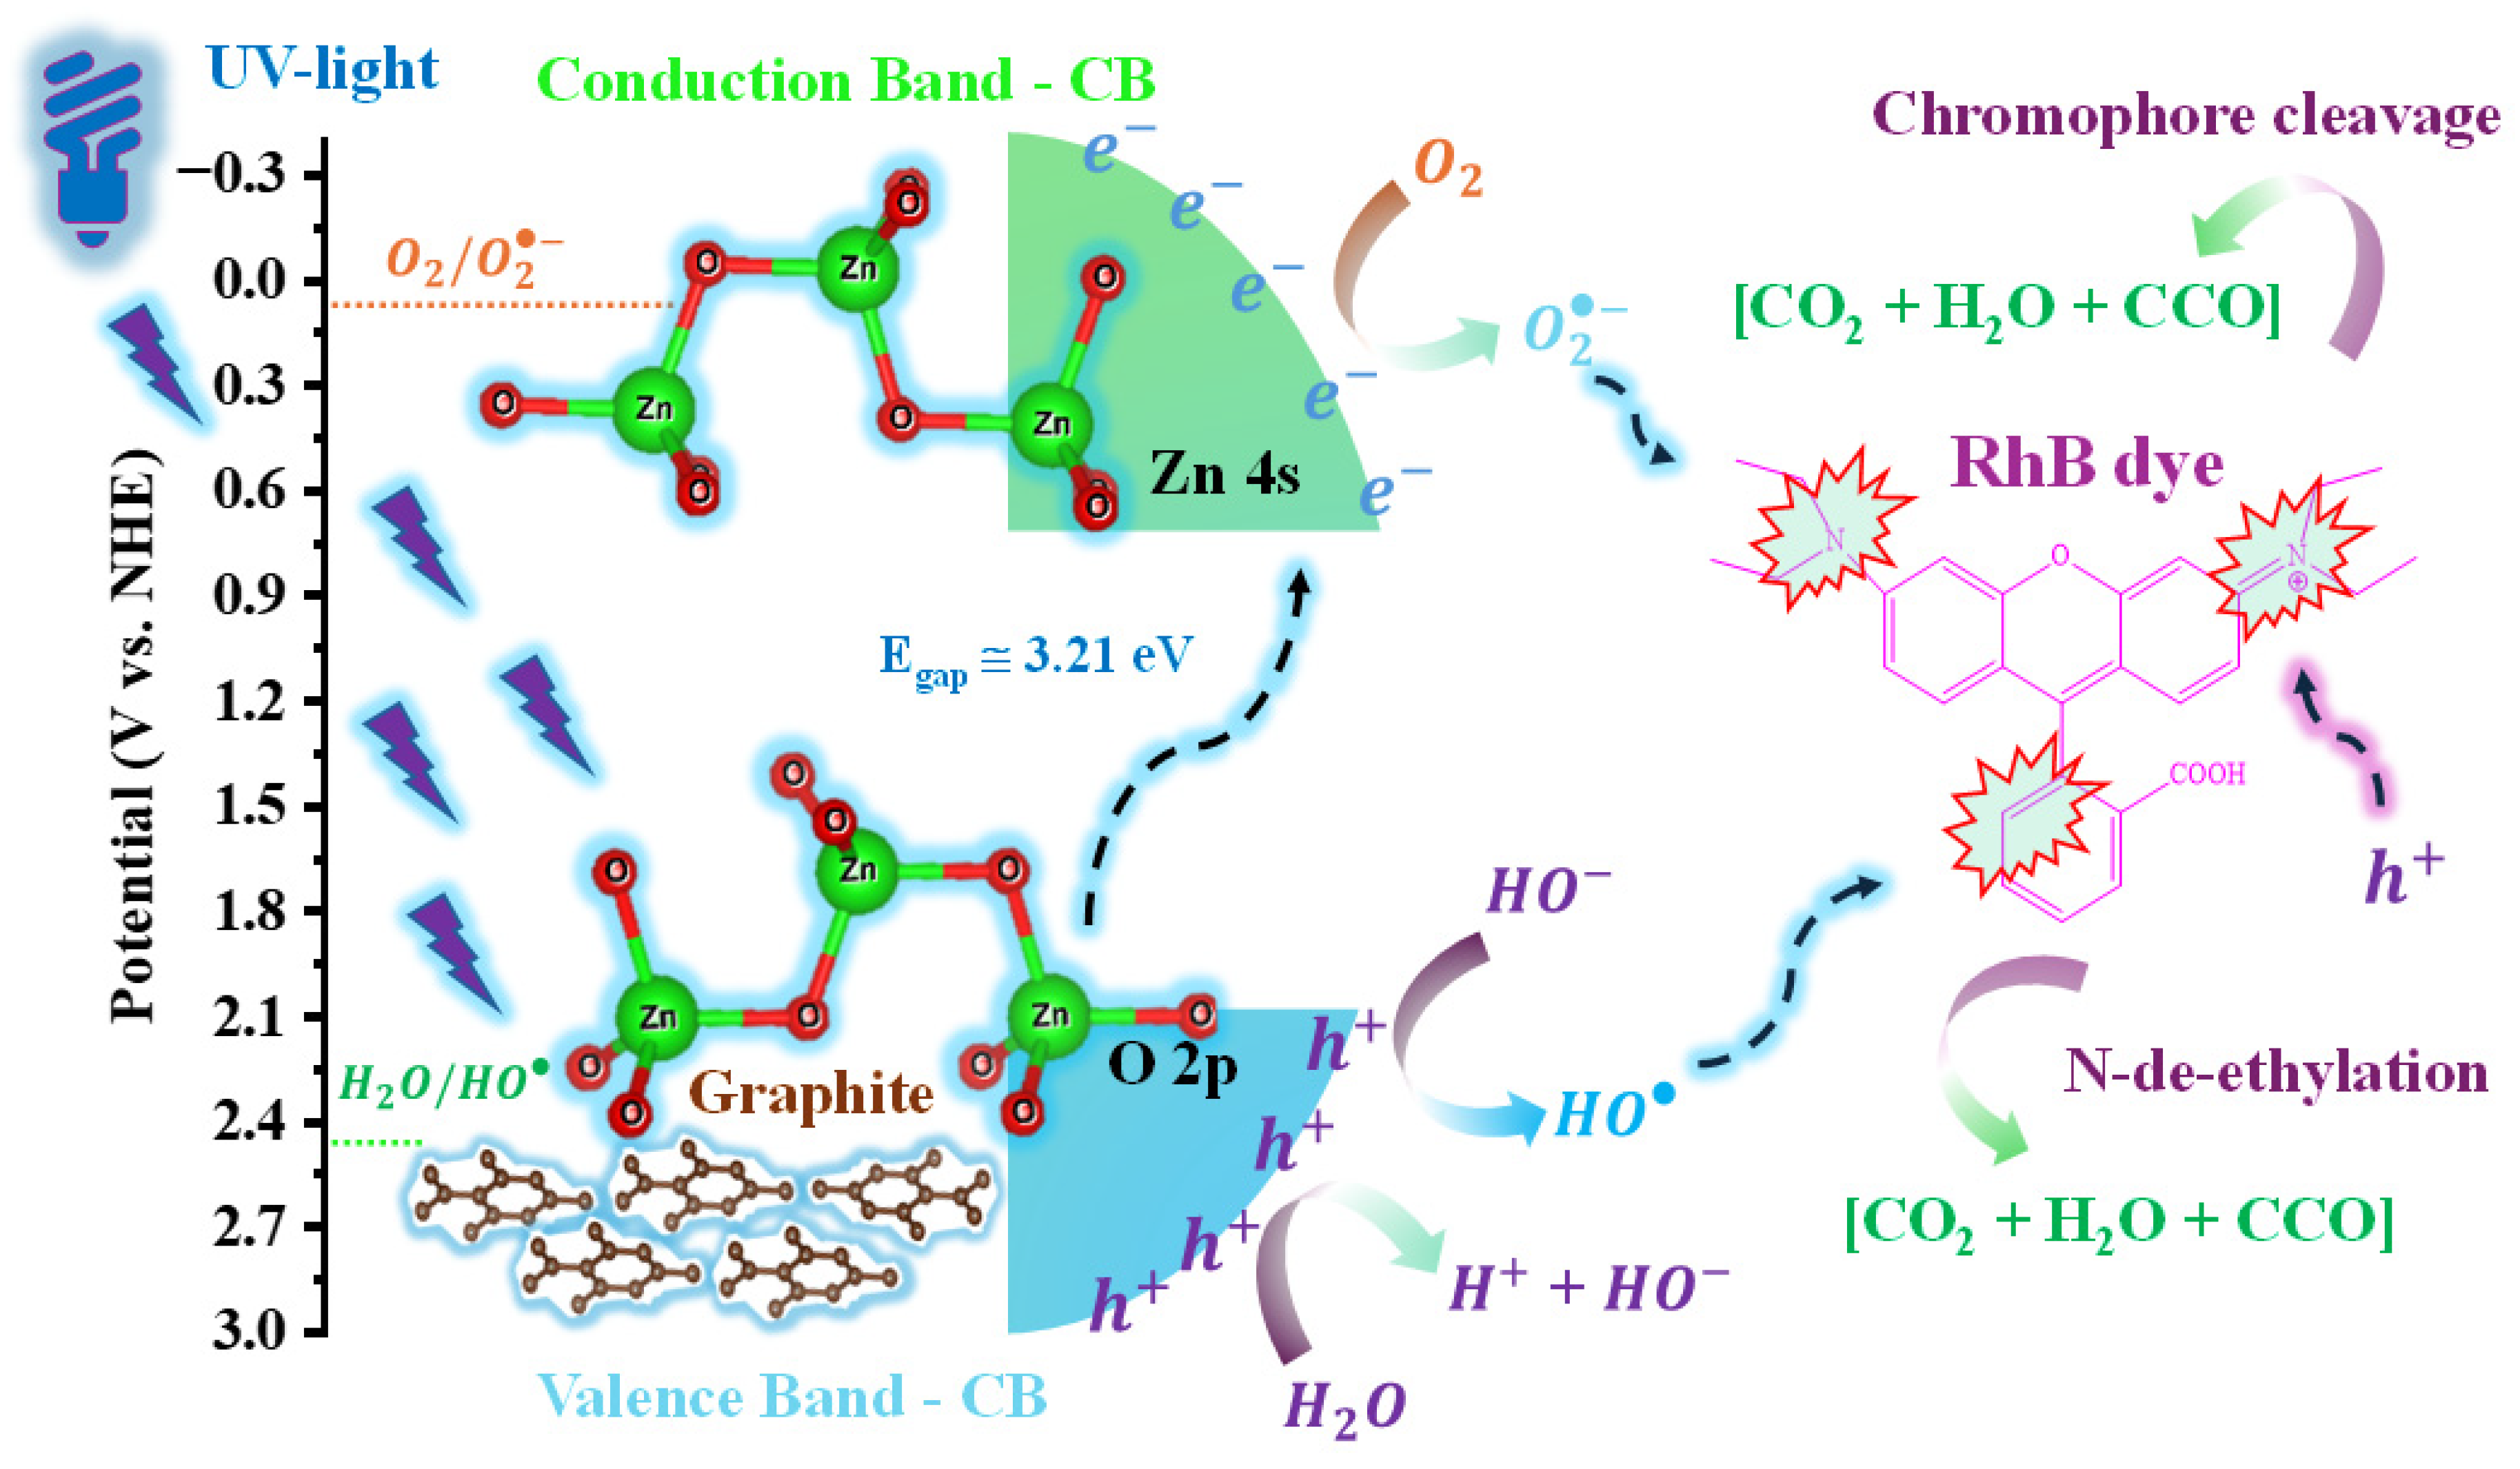
3.7. Proposed Mechanisms for RhB Discolouration by the Gr@ZnO_300 Sample

Based on the information presented, it was possible to propose the mechanism of the decolourisation of RhB dye molecules in an aqueous medium, as shown in the schematic representation in Figure 11. In an aqueous medium, zinc oxide sub-microcrystals adsorb RhB dye molecules, favoured by the presence of graphitic carbon. When irradiated with UVc light at a wavelength of 257.3 nm, they undergo excitation and consequent promotion of electrons present in the valence band, more precisely from the O 2p orbitals to the Zn 4s orbitals present in the conduction band, creating holes in the valence band.
The crystalline defects and deformations in the length and angle of chemical bonds facilitate this process, mainly due to the polarization of the [ZnO] clusters with tetrahedral symmetry, which maintain interactions between the ordered ( [ Z n O ] o x ) and disordered ( [ Z n O ] d x ) units along the crystal lattice in the electron/hole pair formation process. These processes are described in Equations (7) and (8).
ZnO ( distorted )     [ Z n O ] o x [ Z n O ] d x
[ Z n O ] o x [ Z n O ] d x + h ν     [ Z n O ] o [ Z n O ] d
Once in an aqueous medium, water molecules are adsorbed on the surface of ZnO sub-microcrystals so that polarised and electron-deficient clusters [ Z n O ] d oxidise water molecules to H+ and HO ions, as shown in Equations (9) and (10), regenerating the electron in the valence band and filling the photogenerated hole—h+. These clusters also provide the opportunity for the oxidation of hydroxyl ions into hydroxyl radicals (Equation (11)), in addition to directly oxidising the carbon chains of the RhB dye (Equations (12) and (13)), especially if they are efficiently adsorbed on the surface of ZnO sub-microcrystals. After the removal of electrons from the dye’s fixing or chromophore groups, the chemical bonds become unstable, leading to successive secondary reactions that result in N-de-hethylation and/or cleavage of the chromophore group, resulting in the breaking of bonds and the formation of colourless compounds with lower molecular weight, CCO, as shown in Equation (14) [78].
[ Z n O ] d + H 2 O     [ Z n O ] d H 2 O ( ads )
[ Z n O ] d H 2 O ( ads )     H + ( aq ) + HO ( aq ) + [ Z n O ] d x
[ Z n O ] d + HO ( aq )     HO   ( aq ) + [ Z n O ] d x
[ Z n O ] d + [ RhB   dye ]     [ Z n O ] d [ dRhB   dye ] ( ads )
[ Z n O ] d [ RhB   dye ] ( ads )     [ Z n O ] d x + [ dRhB   dye ] *
[RhB dye]* → CCO
In the conduction band, excited electrons migrate to the catalyst surface and promote the reduction in oxygen molecules adsorbed on the catalyst surface, as well as oxygen molecules available in the reaction medium, thus regenerating the [ Z n O ] d x clusters and giving rise to superoxide radicals. The steps are sequentially presented in Equations (15) and (16). Then, the superoxide radicals, together with the other oxidising species, attack the carbon chains of the dye, leading to the breaking of the bonds and the formation of colourless compounds of low molecular weight, and in some cases, the formation of gases (CO2, CO, NO2, and NO) and water molecules [79,80,81,82,83], as represented in Equations (17)–(19).
[ Z n O ] d + O 2   ( aq )     [ Z n O ] d O 2 ( aq )
[ Z n O ] d O 2 ( ads )     O 2   ( aq ) + [ Z n O ] d x
O 2 ( a q ) + [ RhB   dye ] [ RhB   dye ] * + ( O 2 )
HO ( a q ) + [ RhB   dye ] [ RhB   dye ] * + HO ( aq )
[ RhB   dye ] * CCO + H 2 O + CO 2
The stability of the Gr@ZnO_300 catalyst was investigated by using it in five consecutive catalytic cycles, which had as experimental conditions, 50 mL of solution with RhB dye concentration equal to 10 mgL−1, catalyst mass equivalent to 50 mg, magnetic stirring, and constant aeration.

3.8. Reusability

Figure 12a,b show the photocatalytic performance of the Gr@ZnO_300 sample used in five catalytic cycles, as well as the diffraction pattern of the catalyst before and after the photocatalytic tests. Therefore, supported by the information presented, it is possible to affirm the high thermodynamic stability of the Gr@ZnO_300 sample, which resulted in a discolouration percentage of the RhB dye solution above 90% (Figure 12a), even after five reuse cycles. Therefore, it is possible to affirm the high thermodynamic stability of the Gr@ZnO_300 sample, which resulted in a discolouration percentage of the RhB dye solution above 90% (Figure 12a), even after five reuse cycles. In addition, it is also possible to highlight the similarity of the diffraction pattern collected for the catalyst before and after the mentioned tests (Figure 12b), indicating that there was no formation of secondary phases or decomposition of the structure, confirming the possibility of reusing this material for photocatalytic purposes, which implies cost reduction in its use in continuous flow conditions in industrial plants.
Lal et al. [78] report the synthesis, characterization, and application of zinc oxide nanoparticles by the hydrothermal method and photocatalytic application in the degradation of RhB dye molecules in an aqueous medium using the response surface optimization method. The authors reveal that in the catalyst recycling test in several cycles, there was a 12% decrease in performance compared to the first photocatalytic cycle. In the study presented by Sayem et al. [83], zinc oxide nanoparticles were supported on reduced graphene oxide, obtaining heterojunctions with efficient performance in the photodegradation of RhB dye molecules, which resulted in a reduction of approximately 6% in the catalyst performance after the fourth reuse cycle. Therefore, compared to the literature described in the previous paragraphs, the materials obtained in this study are promising candidates for photocatalytic applications in the remediation of effluents containing persistent organic pollutants.

4. Conclusions

In summary, zinc oxide sub-microcrystals were synthesised by adopting the thermal decomposition method of zinc acetate in an oxidising atmosphere at temperatures of 300 (Gr@ZnO_300), 400 (Gr@ZnO_400), 500 (Gr@ZnO_400), and 600 °C (Gr@ZnO_600) for 1 h. The obtained materials were characterised by XRD, which confirmed the hexagonal phase for zinc oxide for all heat treatment temperatures, and especially confirmed that the materials contained a small fraction of graphitic carbon derived from the combustion of organic matter. These results corroborate Raman spectroscopy, where the main vibrational modes characteristic of zinc oxide and graphitic carbon structure were identified. The optical properties of the materials revealed strong absorption in the ultraviolet region, obtaining Egap close to 3.21 eV and colourimetric properties that reinforce the presence of graphitic carbon, mainly for the sample synthesised at 300 °C (Gr@ZnO_300). The morphological analysis of the materials revealed the occurrence of particle clusters in the shape of elongated rods, with lengths ranging from 0.223 to 1.09 μm. In contrast, the semiquantitative analysis by EDX revealed the presence of energy peaks associated with the elements Zn and O, which are characteristics of zinc oxide for all samples. Finally, the photocatalytic performance of the materials obtained in the decolourisation of RhB dye solutions resulted in the best performances for the samples Gr@ZnO_300 and Gr@ZnO_600, reaching approximately 16.5 and 24 times more efficiency than the experiment conducted in the absence of catalysts. In this case, holes, superoxide radicals, and hydroxyl radicals were predominant in the oxidation of the RhB dye molecules. Furthermore, after five consecutive cycles of photocatalysis, they presented high stability, confirmed by the collected diffraction patterns, confirming the promising properties of the materials obtained for applications in the oxidation of organic pollutants.

Author Contributions

Conceptualization, R.D.F.; methodology, D.A.d.S., P.H.d.A.d.S., Y.R.-B., J.F.d.L.N., F.F.d.C., L.L.T., Y.L.R., L.A.D. and W.R.B.; software, F.P.d.S. and R.D.F.; validation, R.D.F., E.A.A.J. and F.X.N.; formal analysis, P.H.d.A.d.S., Y.R.-B. and F.F.d.C.; investigation, F.P.d.S., E.A.A.J., J.F.d.L.N., F.F.d.C. and L.A.D.; resources, W.R.B.; data curation, D.A.d.S., F.P.d.S., E.A.A.J., J.F.d.L.N., F.F.d.C. and L.L.T.; writing—original draft, L.L.T. and F.X.N.; writing—review and editing, Y.L.R. and F.X.N.; visualization, Y.R.-B. and L.A.D.; supervision, J.F.d.L.N., L.L.T., Y.L.R. and F.X.N.; project administration, L.A.D.; funding acquisition, W.R.B. All authors have read and agreed to the published version of the manuscript.

Funding

The authors would like to thank the Departamento de Química, Meio Ambiente e Alimentos (DQA), and Central Analítica of Instituto Federal de Educação, Ciência e Tecnologia do Amazonas, for support in the XRD analysis; the “Coordenação de Aperfeiçoamento de Pessoal de Nível Superior—Brasil (CAPES)”, Finance Code 001; “Fundação de Amparo à Pesquisa do Estado do Amazonas”, and “Conselho Nacional de Desenvolvimento Científico e Tecnológico” for their financial support.

Data Availability Statement

The original contributions presented in this study are included in the article. Further inquiries can be directed to the corresponding author.

Conflicts of Interest

The authors declare no conflicts of interest.

References

  1. Li, D.; Wang, Z.; Yang, Y.; Liu, H.; Fang, S.; Liu, S. Research Status and Development Trend of Wastewater Treatment Technology and Its Low Carbonization. Appl. Sci. 2023, 13, 1400. [Google Scholar] [CrossRef]
  2. Kumar, M.; Shekhar, S.; Kumar, R.; Kumar, P.; Govarthanan, M.; Chaminda, T. Drinking water treatment and associated toxic byproducts: Concurrence and urgence. Environ. Pollut. 2023, 320, 121009. [Google Scholar] [CrossRef] [PubMed]
  3. Khanal, S.; Kazama, S.; Benyapa, S.; Takizawa, S. Performance Assessment of Household Water Treatment and Safe Storage in Kathmandu Valley, Nepal. Water 2023, 15, 2305. [Google Scholar] [CrossRef]
  4. Tortajada, C. Contributions of recycled wastewater to clean water and sanitation Sustainable Development Goals. Npj Clean. Water 2020, 3, 22. [Google Scholar] [CrossRef]
  5. Oliveira, E.D.C.; Castelo-Branco, R.; Silva, L.; Silva, N.; Azevedo, J.; Vasconcelos, V.; Faustino, S.; Cunha, A. First detection of microcystin-lr in the amazon river at the drinking water treatment plant of the municipality of Macapá, Brazil. Toxins 2019, 11, 669. [Google Scholar] [CrossRef]
  6. Ong, C.B.; Ng, L.Y.; Mohammad, A.W. A review of ZnO nanoparticles as solar photocatalysts: Synthesis, mechanisms and applications. Renew. Sustain. Energy Rev. 2018, 81, 536–551. [Google Scholar] [CrossRef]
  7. Rayaroth, M.P.; Aravindakumar, C.T.; Shah, N.S.; Boczkaj, G. Advanced oxidation processes (AOPs) based wastewater treatment—Unexpected nitration side reactions—A serious environmental issue: A review. Chem. Eng. J. 2022, 430, 133002. [Google Scholar] [CrossRef]
  8. Nobre, F.X.; Mariano, F.A.F.; Santos, F.E.P.; Rocco, M.L.M.; Manzato, L.; De Matos, J.M.E.; Couceiro, P.R.C.; Brito, W.R. Heterogeneous photocatalysis of Tordon 2,4-D herbicide using the phase mixture of TiO2. J. Environ. Chem. Eng. 2019, 7, 103501. [Google Scholar] [CrossRef]
  9. Wang, Z.; Li, C.; Domen, K. Recent developments in heterogeneous photocatalysts for solar-driven overall water splitting. Chem. Soc. Rev. 2019, 48, 2109–2125. [Google Scholar] [CrossRef]
  10. Wang, H.; Li, X.; Zhao, X.; Li, C.; Song, X.; Zhang, P.; Huo, P. A review on heterogeneous photocatalysis for environmental remediation: From semiconductors to modification strategies. Chin. J. Catal. 2022, 43, 178–214. [Google Scholar] [CrossRef]
  11. Amirulsyafiee, A.; Khan, M.M.; Harunsani, M.H. Ag3PO4 and Ag3PO4—Based visible light active photocatalysts: Recent progress, synthesis, and photocatalytic applications. Catal. Commun. 2022, 172, 106556. [Google Scholar] [CrossRef]
  12. Sumanth Kumar, D.; Jai Kumar, B.; Mahesh, H.M. Quantum Nanostructures (QDs): An Overview; Elsevier Ltd.: Amsterdam, The Netherlands, 2018; ISBN 9780081019757. [Google Scholar]
  13. Xu, Z.; Zhong, J.; Li, M. Ionic liquid-assisted construction of Z-scheme Ag/Ag3PO4/Ag2MoO4 heterojunctions with enhanced photocatalytic performance. Inorg. Chem. Commun. 2023, 152, 110734. [Google Scholar] [CrossRef]
  14. Li, X.; Hu, T.; Zhang, J.; Dai, K.; Liang, C. Novel 2D SnNb2O6/Ag3VO4 S-scheme heterojunction with enhanced visible-light photocatalytic activity. Ceram. Int. 2021, 47, 7169–7176. [Google Scholar] [CrossRef]
  15. Nobre, F.X.; Bastos, I.S.; dos Santos Fontenelle, R.O.; Júnior, E.A.A.; Takeno, M.L.; Manzato, L.; de Matos, J.M.E.; Orlandi, P.P.; de Fátima Souza Mendes, J.; Brito, W.R.; et al. Antimicrobial properties of α-Ag2WO4 rod-like microcrystals synthesized by sonochemistry and sonochemistry followed by hydrothermal conventional method. Ultrason. Sonochem. 2019, 58, 104620. [Google Scholar] [CrossRef] [PubMed]
  16. Cui, Z.; Zhang, L.; Xue, Y.; Feng, Y.; Wang, M.; Chen, J.; Ji, B.; Wang, C.; Xue, Y. Effects of shape and particle size on the photocatalytic kinetics and mechanism of nano-CeO2. Int. J. Miner. Metall. Mater. 2022, 29, 2221–2231. [Google Scholar] [CrossRef]
  17. He, X.; Yang, Y.; Li, Y.; Chen, J.; Yang, S.; Liu, R.; Xu, Z. Effects of structure and surface properties on the performance of ZnO towards photocatalytic degradation of methylene blue. Appl. Surf. Sci. 2022, 599, 153898. [Google Scholar] [CrossRef]
  18. Tuc Altaf, C.; Colak, T.O.; Rostas, A.M.; Popa, A.; Toloman, D.; Suciu, M.; Demirci Sankir, N.; Sankir, M. Impact on the Photocatalytic Dye Degradation of Morphology and Annealing-Induced Defects in Zinc Oxide Nanostructures. ACS Omega 2023, 8, 14952–14964. [Google Scholar] [CrossRef]
  19. Ben Amor, I.; Hemmami, H.; Laouini, S.E.; Mahboub, M.S.; Barhoum, A. Sol-Gel Synthesis of ZnO Nanoparticles Using Different Chitosan Sources: Effects on Antibacterial Activity and Photocatalytic Degradation of AZO Dye. Catalysts 2022, 12, 1611. [Google Scholar] [CrossRef]
  20. García-Casas, X.; Aparicio, F.J.; Budagosky, J.; Ghaffarinejad, A.; Orozco-Corrales, N.; Ostrikov, K.; Sánchez-Valencia, J.R.; Barranco, Á.; Borrás, A. Paper-based ZnO self-powered sensors and nanogenerators by plasma technology. Nano Energy 2023, 114, 108686. [Google Scholar] [CrossRef]
  21. Manikanika; Chopra, L. Photocatalytic activity of zinc oxide for dye and drug degradation: A review. Mater. Today Proc. 2022, 52, 1653–1656. [Google Scholar] [CrossRef]
  22. Carmel Aruja, T.; Sharma, R.; Dhiman, V.; Chand, S.; Choudhary, P.; Kondal, N. ZnO based nanoadsorbents for purification of lead contaminated water. Mater. Today Proc. 2022; in press. [Google Scholar] [CrossRef]
  23. Mikhailov, M.M.; Yuryev, S.A.; Lapin, A.N.; Goronchko, V.A. Reflective thermal control coating for spacecraft based on ZnO pigment and Li2SiO3 silicate modified by SiO2 nanoparticles. Ceram. Int. 2023, 49, 20817–20821. [Google Scholar] [CrossRef]
  24. Smaoui, S.; Chérif, I.; Ben Hlima, H.; Khan, M.U.; Rebezov, M.; Thiruvengadam, M.; Sarkar, T.; Shariati, M.A.; Lorenzo, J.M. Zinc oxide nanoparticles in meat packaging: A systematic review of recent literature. Food Packag. Shelf Life 2023, 36, 101045. [Google Scholar] [CrossRef]
  25. Youn, S.-M.; Choi, S.-J. Food Additive Zinc Oxide Nanoparticles: Dissolution, Interaction, Fate, Cytotoxicity, and Oral Toxicity. Int. J. Mol. Sci. 2022, 23, 6074. [Google Scholar] [CrossRef] [PubMed]
  26. Wu, H.; Meng, Y.; Yu, M.; Yang, H. Modulating the antibacterial activity of ZnO/talc by balancing the monodispersity of ZnO nanoparticles. Appl. Clay Sci. 2023, 242, 107024. [Google Scholar] [CrossRef]
  27. Sharma, D.K.; Shukla, S.; Sharma, K.K.; Kumar, V. A review on ZnO: Fundamental properties and applications. Mater. Today Proc. 2020, 49, 3028–3035. [Google Scholar] [CrossRef]
  28. Baranov, A.N.; Sokolov, P.S.; Solozhenko, V.L. ZnO under Pressure: From Nanoparticles to Single Crystals. Crystals 2022, 12, 744. [Google Scholar] [CrossRef]
  29. Zarhri, Z.; Cocom Dzul, M.B.; Ziat, Y.; Jiménez Torrez, L.F.; Oubram, O.; Ifguis, O. Comparative study of optical properties of ZnO Zinc Blend and Rock Salt structures, TB-mBJ and GGA approximations. Phys. B Condens. Matter 2022, 634, 413798. [Google Scholar] [CrossRef]
  30. Koster, R.S.; Fang, C.M.; Dijkstra, M.; Van Blaaderen, A.; Van Huis, M.A. Stabilization of rock salt ZnO nanocrystals by low-energy surfaces and Mg additions: A first-principles study. J. Phys. Chem. C 2015, 119, 5648–5656. [Google Scholar] [CrossRef]
  31. Ejsmont, A.; Goscianska, J. Hydrothermal Synthesis of ZnO Superstructures with Controlled Morphology via Temperature and pH Optimization. Materials 2023, 16, 1641. [Google Scholar] [CrossRef]
  32. Karkeh-Abadi, F.; Ghiyasiyan-Arani, M.; Salavati-Niasari, M. Sonochemical synthesized BaMoO4/ZnO nanocomposites as electrode materials: A comparative study on GO and GQD employed in hydrogen storage. Ultrason. Sonochem. 2022, 90, 106167. [Google Scholar] [CrossRef] [PubMed]
  33. Mahmood, N.B.; Saeed, F.R.; Gbashi, K.R.; Mahmood, U.S. Synthesis and characterization of zinc oxide nanoparticles via oxalate co-precipitation method. Mater. Lett. X 2022, 13, 100126. [Google Scholar] [CrossRef]
  34. Zhao, D.; Sathasivam, S.; Wang, M.; Carmalt, C.J. Transparent and conducting boron doped ZnO thin films grown by aerosol assisted chemical vapor deposition. RSC Adv. 2022, 12, 33049–33055. [Google Scholar] [CrossRef] [PubMed]
  35. Rathore, R.; Kaurav, N. The structural and optical properties of ZnO nanoparticles synthesized via thermal decomposition. Mater. Today Proc. 2022, 54, 624–627. [Google Scholar] [CrossRef]
  36. Murcia, J.J.; Hernández Niño, J.S.; Rojas, H.; Brijaldo, M.H.; Martín-Gómez, A.N.; Sánchez-Cid, P.; Navío, J.A.; Hidalgo, M.C.; Jaramillo-Paez, C. ZnO/Ag3PO4 and ZnO–Malachite as Effective Photocatalysts for the Removal of Enteropathogenic Bacteria, Dyestuffs, and Heavy Metals from Municipal and Industrial Wastewater. Water 2021, 13, 2264. [Google Scholar] [CrossRef]
  37. Saeed, M.; Albalawi, K.; Khan, I.; Akram, N.; Abd El-Rahim, I.H.A.; Alhag, S.K.; Ezzat Ahmed, A. Faiza Synthesis of p-n NiO-ZnO heterojunction for photodegradation of crystal violet dye. Alexandria Eng. J. 2023, 65, 561–574. [Google Scholar] [CrossRef]
  38. Kara, R.; Mentar, L.; Azizi, A. Synthesis and characterization of Mg-doped ZnO thin-films electrochemically grown on FTO substrates for optoelectronic applications. RSC Adv. 2020, 10, 40467–40479. [Google Scholar] [CrossRef]
  39. Shivananjaiah, H.N.; Sailaja Kumari, K.; Geetha, M.S. Green mediated synthesis of lanthanum doped zinc oxide: Study of its structural, optical and latent fingerprint application. J. Rare Earths 2020, 38, 1281–1287. [Google Scholar] [CrossRef]
  40. Wang, C.C.; Lo, A.Y.; Cheng, M.C.; Chang, Y.S.; Shih, H.C.; Shieu, F.S.; Tsai, H.T. Zinc oxide nanostructures enhanced photoluminescence by carbon-black nanoparticles in Moiré heterostructures. Sci. Rep. 2023, 13, 9704. [Google Scholar] [CrossRef]
  41. Lam, E.; Luong, J.H.T. Carbon materials as catalyst supports and catalysts in the transformation of biomass to fuels and chemicals. ACS Catal. 2014, 4, 3393–3410. [Google Scholar] [CrossRef]
  42. Xu, J.J.; Lu, Y.N.; Tao, F.F.; Liang, P.F.; Zhang, P.A. ZnO Nanoparticles Modified by Carbon Quantum Dots for the Photocatalytic Removal of Synthetic Pigment Pollutants. ACS Omega 2023, 8, 7845–7857. [Google Scholar] [CrossRef] [PubMed]
  43. Jayababu, N.; Kim, D. ZnO nanorods@conductive carbon black nanocomposite based flexible integrated system for energy conversion and storage through triboelectric nanogenerator and supercapacitor. Nano Energy 2021, 82, 105726. [Google Scholar] [CrossRef]
  44. Saranya, M.; Ramachandran, R.; Wang, F. Graphene-zinc oxide (G-ZnO) nanocomposite for electrochemical supercapacitor applications. J. Sci. Adv. Mater. Devices 2016, 1, 454–460. [Google Scholar] [CrossRef]
  45. Sawada, H.; Wang, R.; Sleight, A.W. An Electron Density Residual Study of Zinc Oxide. J. Solid State Chem. 1996, 122, 148–150. [Google Scholar] [CrossRef]
  46. Holzwarth, U.; Gibson, N. The Scherrer equation versus the “Debye-Scherrer equation”. Nat. Nanotechnol. 2011, 6, 534. [Google Scholar] [CrossRef]
  47. Sankara Reddy, B.; Venkatramana Reddy, S.; Koteeswara Reddy, N. Physical and magnetic properties of (Co, Ag) doped ZnO nanoparticles. J. Mater. Sci. Mater. Electron. 2013, 24, 5204–5210. [Google Scholar] [CrossRef]
  48. Li, Z.; Deng, L.; Kinloch, I.A.; Young, R.J. Raman spectroscopy of carbon materials and their composites: Graphene, nanotubes and fibres. Prog. Mater. Sci. 2023, 135, 101089. [Google Scholar] [CrossRef]
  49. Noor, N.A.M.; Kamarudin, S.K.; Darus, M.; Diyana, N.F.; Yunos, M.; Idris, M.A. Photocatalytic properties and graphene oxide additional effects in TiO2. Solid State Phenom. 2018, 280, 65–70. [Google Scholar] [CrossRef]
  50. Refat, N.M.; Nassar, M.Y.; Sadeek, S.A. A controllable one-pot hydrothermal synthesis of spherical cobalt ferrite nanoparticles: Synthesis, characterization, and optical properties. RSC Adv. 2022, 12, 25081–25095. [Google Scholar] [CrossRef]
  51. Rahman, M.; Kamruzzaman, M.; Zapien, J.A.; Afrose, R.; Anam, T.K.; Liton, M.N.H.; Helal, M.A.; Khan, M.K.R. Conversion of n-type to p-type conductivity in ZnO by incorporation of Ag and Ag-Li. Mater. Today Commun. 2022, 33, 104278. [Google Scholar] [CrossRef]
  52. Coulter, J.B.; Birnie, D.P. Assessing Tauc Plot Slope Quantification: ZnO Thin Films as a Model System. Phys. Status Solid Basic Res. 2018, 255, 1700393. [Google Scholar] [CrossRef]
  53. Zhou, Z.; Wang, J.; Jhun, C.G. Zno nanospheres fabricated by mechanochemical method with photocatalytic properties. Catalysts 2021, 11, 572. [Google Scholar] [CrossRef]
  54. Otis, G.; Ejgenberg, M.; Mastai, Y. Solvent-free mechanochemical synthesis of zno nanoparticles by high-energy ball milling of ε-zn(Oh)2 crystals. Nanomaterials 2021, 11, 238. [Google Scholar] [CrossRef] [PubMed]
  55. Masula, K.; Bhongiri, Y.; Raghav Rao, G.; Vijay Kumar, P.; Pola, S.; Basude, M. Evolution of photocatalytic activity of CeO2–Bi2O3 composite material for wastewater degradation under visible-light irradiation. Opt. Mater. 2022, 126, 112201. [Google Scholar] [CrossRef]
  56. Safartoobi, A.; Mazloom, J.; Ghodsi, F.E. Silver/molybdenum metal-organic framework derived Ag2MoO4 nanoparticles as novel electrode for high-performance supercapacitor. J. Energy Storage 2023, 68, 107818. [Google Scholar] [CrossRef]
  57. Farooq, U.; Phul, R.; Alshehri, S.M.; Ahmed, J.; Ahmad, T. Electrocatalytic and Enhanced Photocatalytic Applications of Sodium Niobate Nanoparticles Developed by Citrate Precursor Route. Sci. Rep. 2019, 9, 4488. [Google Scholar] [CrossRef]
  58. Khadim, H.J.; Al-Farraji, A.; Ammar, S.H. Boosted visible-light-driven photocatalytic degradation of lomefloxacin over α-Ag2WO4/NiSx nanocomposites. Environ. Nanotechnol. Monit. Manag. 2022, 18, 100722. [Google Scholar] [CrossRef]
  59. Mar, G.L.; Timbrell, P.Y.; Lamb, R.N. Formation of Zinc Oxide Thin Films by the Thermal Decomposition of Zinc Acetate. Surf. Sci. Princ. Appl. 1993, 73, 177–192. [Google Scholar] [CrossRef]
  60. Oliveira, Y.L.; Costa, M.J.S.; Jucá, A.C.S.; Silva, L.K.R.; Longo, E.; Arul, N.S.; Cavalcante, L.S. Structural characterization, morphology, optical and colorimetric properties of NiWO4 crystals synthesized by the co-precipitation and polymeric precursor methods. J. Mol. Struct. 2020, 1221, 128774. [Google Scholar] [CrossRef]
  61. Nobre, F.X.; Mendes, O.C.; da Silva, A.P.J.; Junior, J.L.S.; do Nascimento, M.V.B.; Pessoa Junior, W.A.G.; Manzato, L.; Brandim, A.S.; Matos, J.M.E.; Brito, W.R.; et al. Fast and efficient green synthesis of CaWO4 NPs using eggshells as a biogenic calcium source: Structure, optical property, and morphology. J. Photochem. Photobiol. A Chem. 2023, 439, 114589. [Google Scholar] [CrossRef]
  62. van Brenk, B.; Wösten, H.A.B. A screening method for decoloration of xenobiotic dyes by fungi. J. Microbiol. Methods 2021, 188, 106301. [Google Scholar] [CrossRef] [PubMed]
  63. Kusmierek, E. A CeO2 semiconductor as a photocatalytic and photoelectrocatalytic material for the remediation of pollutants in industrial wastewater: A review. Catalysts 2020, 10, 1435. [Google Scholar] [CrossRef]
  64. Chen, Y.-J.; Tseng, C.-S.; Tseng, P.-J.; Huang, C.-W.; Wu, T.; Lin, Y.-W. Synthesis and characterization of Ag/Ag3PO4 nanomaterial modified BiPO4 photocatalyst by sonochemical method and its photocatalytic application. J. Mater. Sci. Mater. Electron. 2017, 28, 11886–11899. [Google Scholar] [CrossRef]
  65. Kumar, S.; AlOmar, S.Y.; Kumari, K.; Albalawi, F.; Kumar, R.; Ahmed, F.; Ahmad, N.; Dwivedi, S.; Alvi, P.A. Structural, Optical, Electrical and Antibacterial Properties of Fe-Doped CeO2 Nanoparticles. Crystals 2021, 11, 1594. [Google Scholar] [CrossRef]
  66. Cho, I.S.; Kwak, C.H.; Kim, D.W.; Lee, S.; Hong, K.S. Photophysical, photoelectrochemical, and photocatalytic properties of novel SnWO4 oxide semiconductors with narrow band gaps. J. Phys. Chem. C 2009, 113, 10647–10653. [Google Scholar] [CrossRef]
  67. Cho, I.S.; Kim, D.W.; Cho, C.M.; An, J.S.; Roh, H.S.; Hong, K.S. Synthesis, characterization and photocatalytic properties of CaNb2O6 with ellipsoid-like plate morphology. Solid. State Sci. 2010, 12, 982–988. [Google Scholar] [CrossRef]
  68. Assis, M.; Robeldo, T.; Foggi, C.C.; Kubo, A.M.; Mínguez-Vega, G.; Condoncillo, E.; Beltran-Mir, H.; Torres-Mendieta, R.; Andrés, J.; Oliva, M.; et al. Ag Nanoparticles/α-Ag2WO4 Composite Formed by Electron Beam and Femtosecond Irradiation as Potent Antifungal and Antitumor Agents. Sci. Rep. 2019, 9, 9927. [Google Scholar] [CrossRef]
  69. Takeno, M.L.; Nobre, F.X.; da Costa, F.F.; Botelho do Nascimento, M.V.; Pessoa Júnior, W.A.G.; Araújo Júnior, E.A.; Sousa, G.d.S.; de Sá, M.L.; Gurgel, R.S.; Albuquerque, P.M.; et al. Solvent Effect on the Structural, Optical, Morphology, and Antimicrobial Activity of Silver Phosphate Microcrystals by Conventional Hydrothermal Method. ACS Omega 2024, 9, 23069–23085. [Google Scholar] [CrossRef]
  70. do Nascimento, M.V.; Nobre, F.X.; de Araújo, E.N.; de Araujo, C.I.; Couceiro, P.R.; Manzato, L. Ag2−xCuxWO4 Solid Solution: Structure, Morphology, Optical Properties, and Photocatalytic Performance in the Degradation of RhB under Blue Light-Emitting Device Irradiation. J. Phys. Chem. C 2021, 125, 11875–11890. [Google Scholar] [CrossRef]
  71. Kumar, S.; Sharma, S.K.; Kaushik, R.D.; Purohit, L.P. Chalcogen-doped zinc oxide nanoparticles for photocatalytic degradation of Rhodamine B under the irradiation of ultraviolet light. Mater. Today Chem. 2021, 20, 100464. [Google Scholar] [CrossRef]
  72. Nagajyothi, P.C.; Sreekanth, T.V.M.; Ramaraghavulu, R.; Devarayapalli, K.C.; Yoo, K.; Vattikuti, S.V.P.; Shim, J. Photocatalytic dye degradation and hydrogen production activity of Ag3PO4/g-C3N4 nanocatalyst. J. Mater. Sci. Mater. Electron. 2019, 30, 14890–14901. [Google Scholar] [CrossRef]
  73. Kim, Y.; Hwang, H.M.; Wang, L.; Kim, I.; Yoon, Y.; Lee, H. Solar-light photocatalytic disinfection using crystalline/amorphous low energy bandgap reduced TiO2. Sci. Rep. 2016, 6, 25212. [Google Scholar] [CrossRef] [PubMed]
  74. Nobre, F.X.; Muniz, R.; do Nascimento, E.R.; Amorim, R.S.; Silva, R.S.; Almeida, A.; Moreira, J.A.; Tavares, P.B.; Brito, W.R.; Couceiro, P.R.C.; et al. Hydrothermal temperature dependence of CaWO4 nanoparticles: Structural, optical, morphology and photocatalytic activity. J. Mater. Sci. Mater. Electron. 2021, 32, 9776–9794. [Google Scholar] [CrossRef]
  75. Sousa, G.d.S.; Nobre, F.X.; Araújo Júnior, E.A.; Sambrano, J.R.; Albuquerque, A.d.R.; Bindá, R.d.S.; Couceiro, P.R.d.C.; Brito, W.R.; Cavalcante, L.S.; Santos, M.R.d.M.C.; et al. Hydrothermal synthesis, structural characterization and photocatalytic properties of β-Ag2MoO4 microcrystals: Correlation between experimental and theoretical data. Arab. J. Chem. 2020, 13, 2806–2825. [Google Scholar] [CrossRef]
  76. Nobre, F.X.; Gil Pessoa, W.A.; Ruiz, Y.L.; Imbiriba Bentes, V.L.; Silva-Moraes, M.O.; Costa Silva, T.M.; Rocco, M.L.M.; Larrudé, D.R.G.; de Matos, J.M.E.; Couceiro, P.R.d.C.; et al. Facile synthesis of nTiO2 phase mixture: Characterization and catalytic performance. Mater. Res. Bull. 2019, 109, 60–71. [Google Scholar] [CrossRef]
  77. Chang, H.; Yi, H.; Ke, Q.; Zhang, J. Preparation of a AgCl/PbMoO4 Composite and Investigation of Its Photocatalytic Oxidative Desulfurization Performance. ACS Omega 2020, 5, 10927–10938. [Google Scholar] [CrossRef]
  78. Lal, M.; Sharma, P.; Singh, L.; Ram, C. Photocatalytic degradation of hazardous Rhodamine B dye using sol-gel mediated ultrasonic hydrothermal synthesized of ZnO nanoparticles. Results Eng. 2023, 17, 100890. [Google Scholar] [CrossRef]
  79. Kumar, A.; Choudhary, P.; Kumar, A.; Camargo, P.H.C.; Krishnan, V. Recent Advances in Plasmonic Photocatalysis Based on TiO2 and Noble Metal Nanoparticles for Energy Conversion, Environmental Remediation, and Organic Synthesis. Small 2022, 18, 2101638. [Google Scholar] [CrossRef]
  80. Santiago, A.A.G.; Andrade Neto, N.F.; Longo, E.; Paskocimas, C.A.; Motta, F.V.; Bomio, M.R.D. Fast and continuous obtaining of Eu3+ doped CeO2 microspheres by ultrasonic spray pyrolysis: Characterization and photocatalytic activity. J. Mater. Sci. Mater. Electron. 2019, 30, 11508–11519. [Google Scholar] [CrossRef]
  81. Gomes, E.O.; Gracia, L.; Santiago, A.A.G.; Tranquilin, R.L.; Motta, F.V.; Amoresi, R.A.C.; Longo, E.; Bomio, M.R.D.; Andres, J. Structure, electronic properties, morphology evolution, and photocatalytic activity in PbMoO4 and Pb1-2: XCaxSrxMoO4(x = 0.1, 0.2, 0.3, 0.4 and 0.5) solid solutions. Phys. Chem. Chem. Phys. 2020, 22, 25876–25891. [Google Scholar] [CrossRef]
  82. Ayappan, C.; Palanivel, B.; Jayaraman, V.; Maiyalagan, T.; Mani, A. One-step hydrothermal synthesis of CaWO4/α-Ag2WO4 heterojunction: An efficient photocatalyst for removal of organic contaminants. Mater. Sci. Semicond. Process. 2019, 104, 104693. [Google Scholar] [CrossRef]
  83. Sayem, M.A.; Hossen Suvo, M.A.; Syed, I.M.; Bhuiyan, M.A. Effective adsorption and visible light driven enhanced photocatalytic degradation of rhodamine B using ZnO nanoparticles immobilized on graphene oxide nanosheets. Results Phys. 2024, 58, 107471. [Google Scholar] [CrossRef]
Figure 1. X-ray diffraction pattern of Gr@ZnO_300, Gr@ZnO_400, Gr@ZnO_500, and Gr@ZnO_600.
Colorants 03 00016 g001
Figure 2. X-ray diffraction pattern of (a) Gr@ZnO_300, (b) Gr@ZnO_400, (c) Gr@ZnO_500, and (d) Gr@ZnO_600.
Colorants 03 00016 g002
Figure 3. Plots for lattice parameters a = b vs. c of (a) ZnO and (b) graphitic carbon. Plots of unit cell volume vs. crystallite size of (c) ZnO and (d) graphitic carbon for all synthesised samples.
Colorants 03 00016 g003
Figure 4. Vibrational Raman spectrum of the Gr@ZnO_300, Gr@ZnO_400, Gr@ZnO_500, and Gr@ZnO_600 samples.
Colorants 03 00016 g004
Figure 5. (a) UV-vis by diffuse reflectance spectroscopy, (b) Tauc plot, and (c) band position of Gr@ZnO_300, Gr@ZnO_400, Gr@ZnO_500, and Gr@ZnO_600.
Colorants 03 00016 g005
Figure 6. FE-SEM images of (a,b) Gr@ZnO_300, (c,d) Gr@ZnO_400, (e,f) Gr@ZnO_500, and (g,h) Gr@ZnO_600.
Colorants 03 00016 g006
Figure 7. Mapping and EDX spectrum of samples (ad) Gr@ZnO_300, (eh) Gr@ZnO_400, (il) Gr@ZnO_500, and (mp) Gr@ZnO_600. The Al* is due to the aluminium substrate that was used in the deposition of sample before the acquisition of SEM images and EDX data.
Colorants 03 00016 g007
Figure 8. UV-vis spectrum of RhB for (a) photolysis experiment and using the samples (b) Gr@ZnO_300, (c) Gr@ZnO_400, (d) Gr@ZnO_500, and (e) Gr@ZnO_600 as the catalyst and (f) C/C0 versus exposure time plot.
Colorants 03 00016 g008
Figure 9. (a) C/C0 versus exposure time and (b) PCZ plot of Gr@ZnO_300 at different pH values.
Colorants 03 00016 g009
Figure 10. (af) UV-vis spectrum of RhB solution at different scavenger radicals using the Gr@ZnO_300 sample as the catalyst and (f) C/C0 plot versus exposure time under UVc light for each experiment.
Colorants 03 00016 g010
Figure 11. Schematic representation for RhB dye decolourisation by oxidant species generated by photoexcitation of the Gr@ZnO_300 sample in aqueous media by UVc light.
Colorants 03 00016 g011
Figure 12. (a) Reusability of Gr@ZnO_300 as a catalyst over five consecutive photocatalytic experiments and (b) XRD pattern of Gr@ZnO_300 before (fresh) and after the five consecutive catalytic cycles.
Colorants 03 00016 g012
Table 1. Colourimetric properties of Gr@ZnO_300, Gr@ZnO_400, Gr@ZnO_500, and Gr@ZnO_600 through the Hex code, colourimetric coordinates (L*, a*, and b*), observed colour, RGB coordinates, and Egap.
SampleHexColourimetric CoordinatesColourRGBEgap
L*a*b*RGB
A7C756D49.581.795.12 1241171093.21
BCFCBC281.660.364.62 2072031943.19
CC2BEB977.320.653.04 1941901853.19
DB0AEAB71.150.231.771761741713.21
Legend: A = Gr@ZnO_300; B = Gr@ZnO_400; C = Gr@ZnO_500; and D = Gr@ZnO_600.
Disclaimer/Publisher’s Note: The statements, opinions and data contained in all publications are solely those of the individual author(s) and contributor(s) and not of MDPI and/or the editor(s). MDPI and/or the editor(s) disclaim responsibility for any injury to people or property resulting from any ideas, methods, instructions or products referred to in the content.

