
Electrochemical Deposition of SiO2-Coatings on a Carbon Fiber


Abstract
1. Introduction
2. Materials and Methods
2.1. Materials
2.2. Preparation of the Reaction Medium
2.3. Coating Process
2.4. Scanning Electron Microscopy
3. Results
3.1. Characterization of Coatings
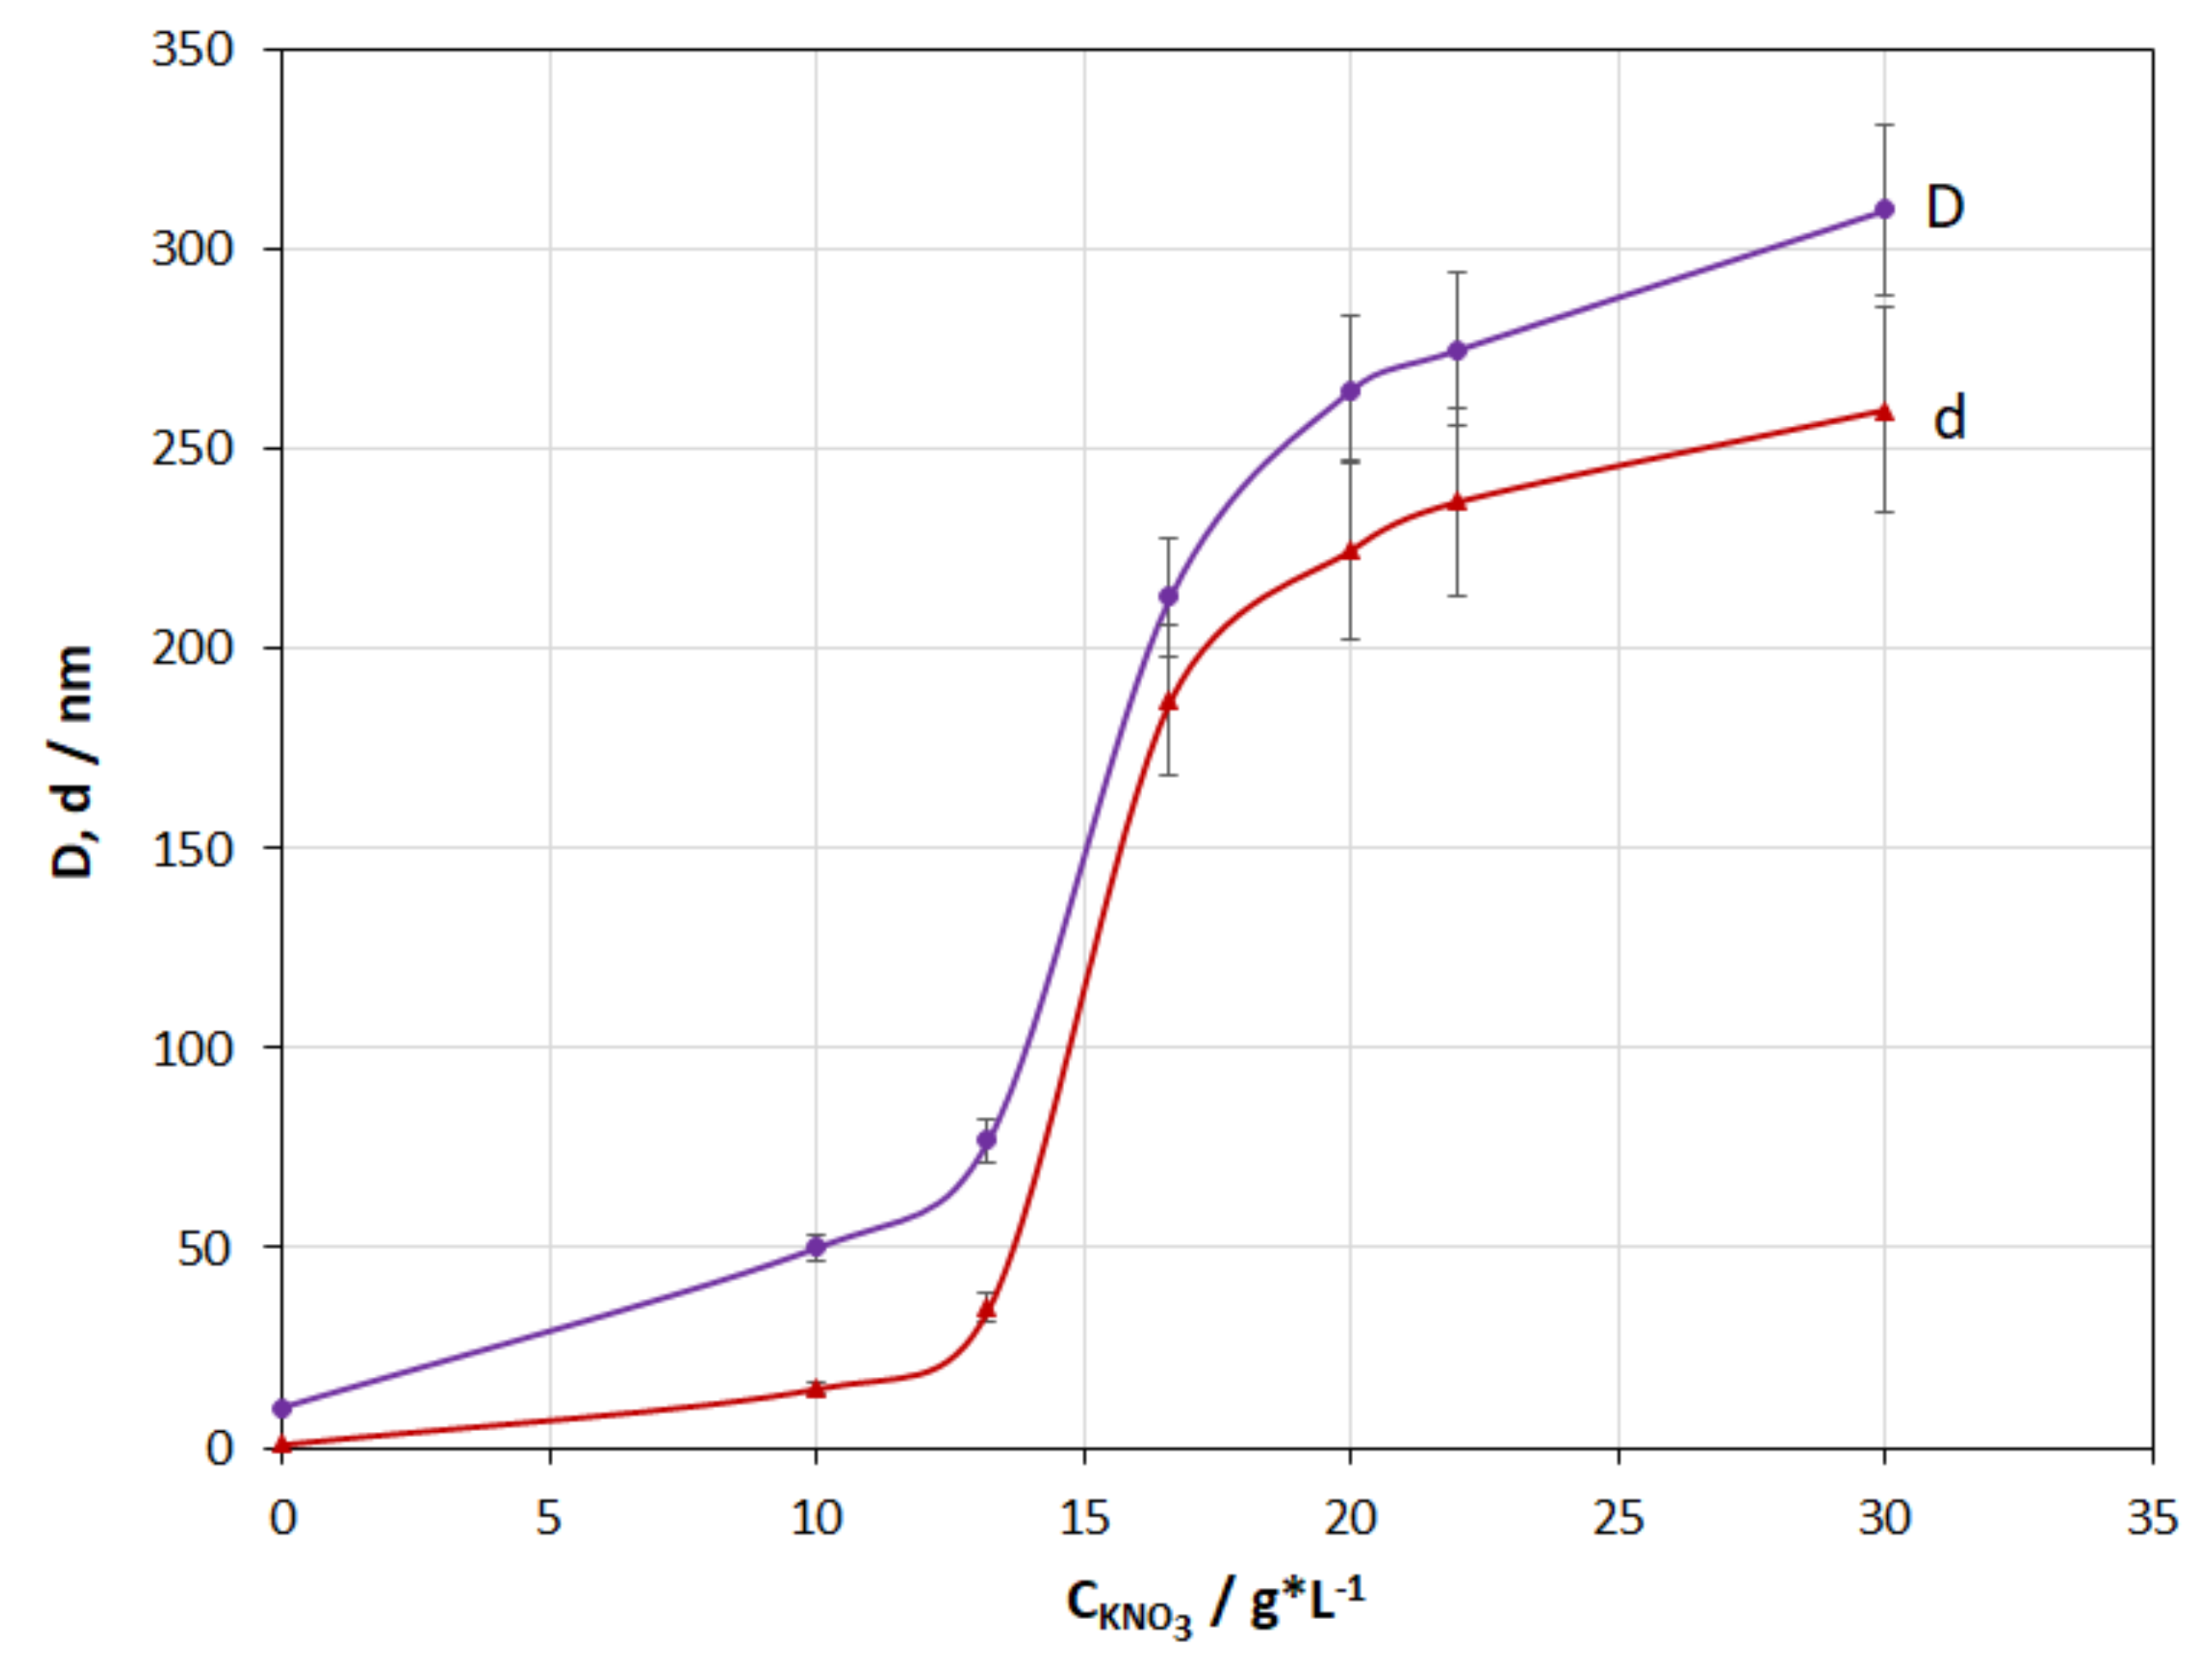
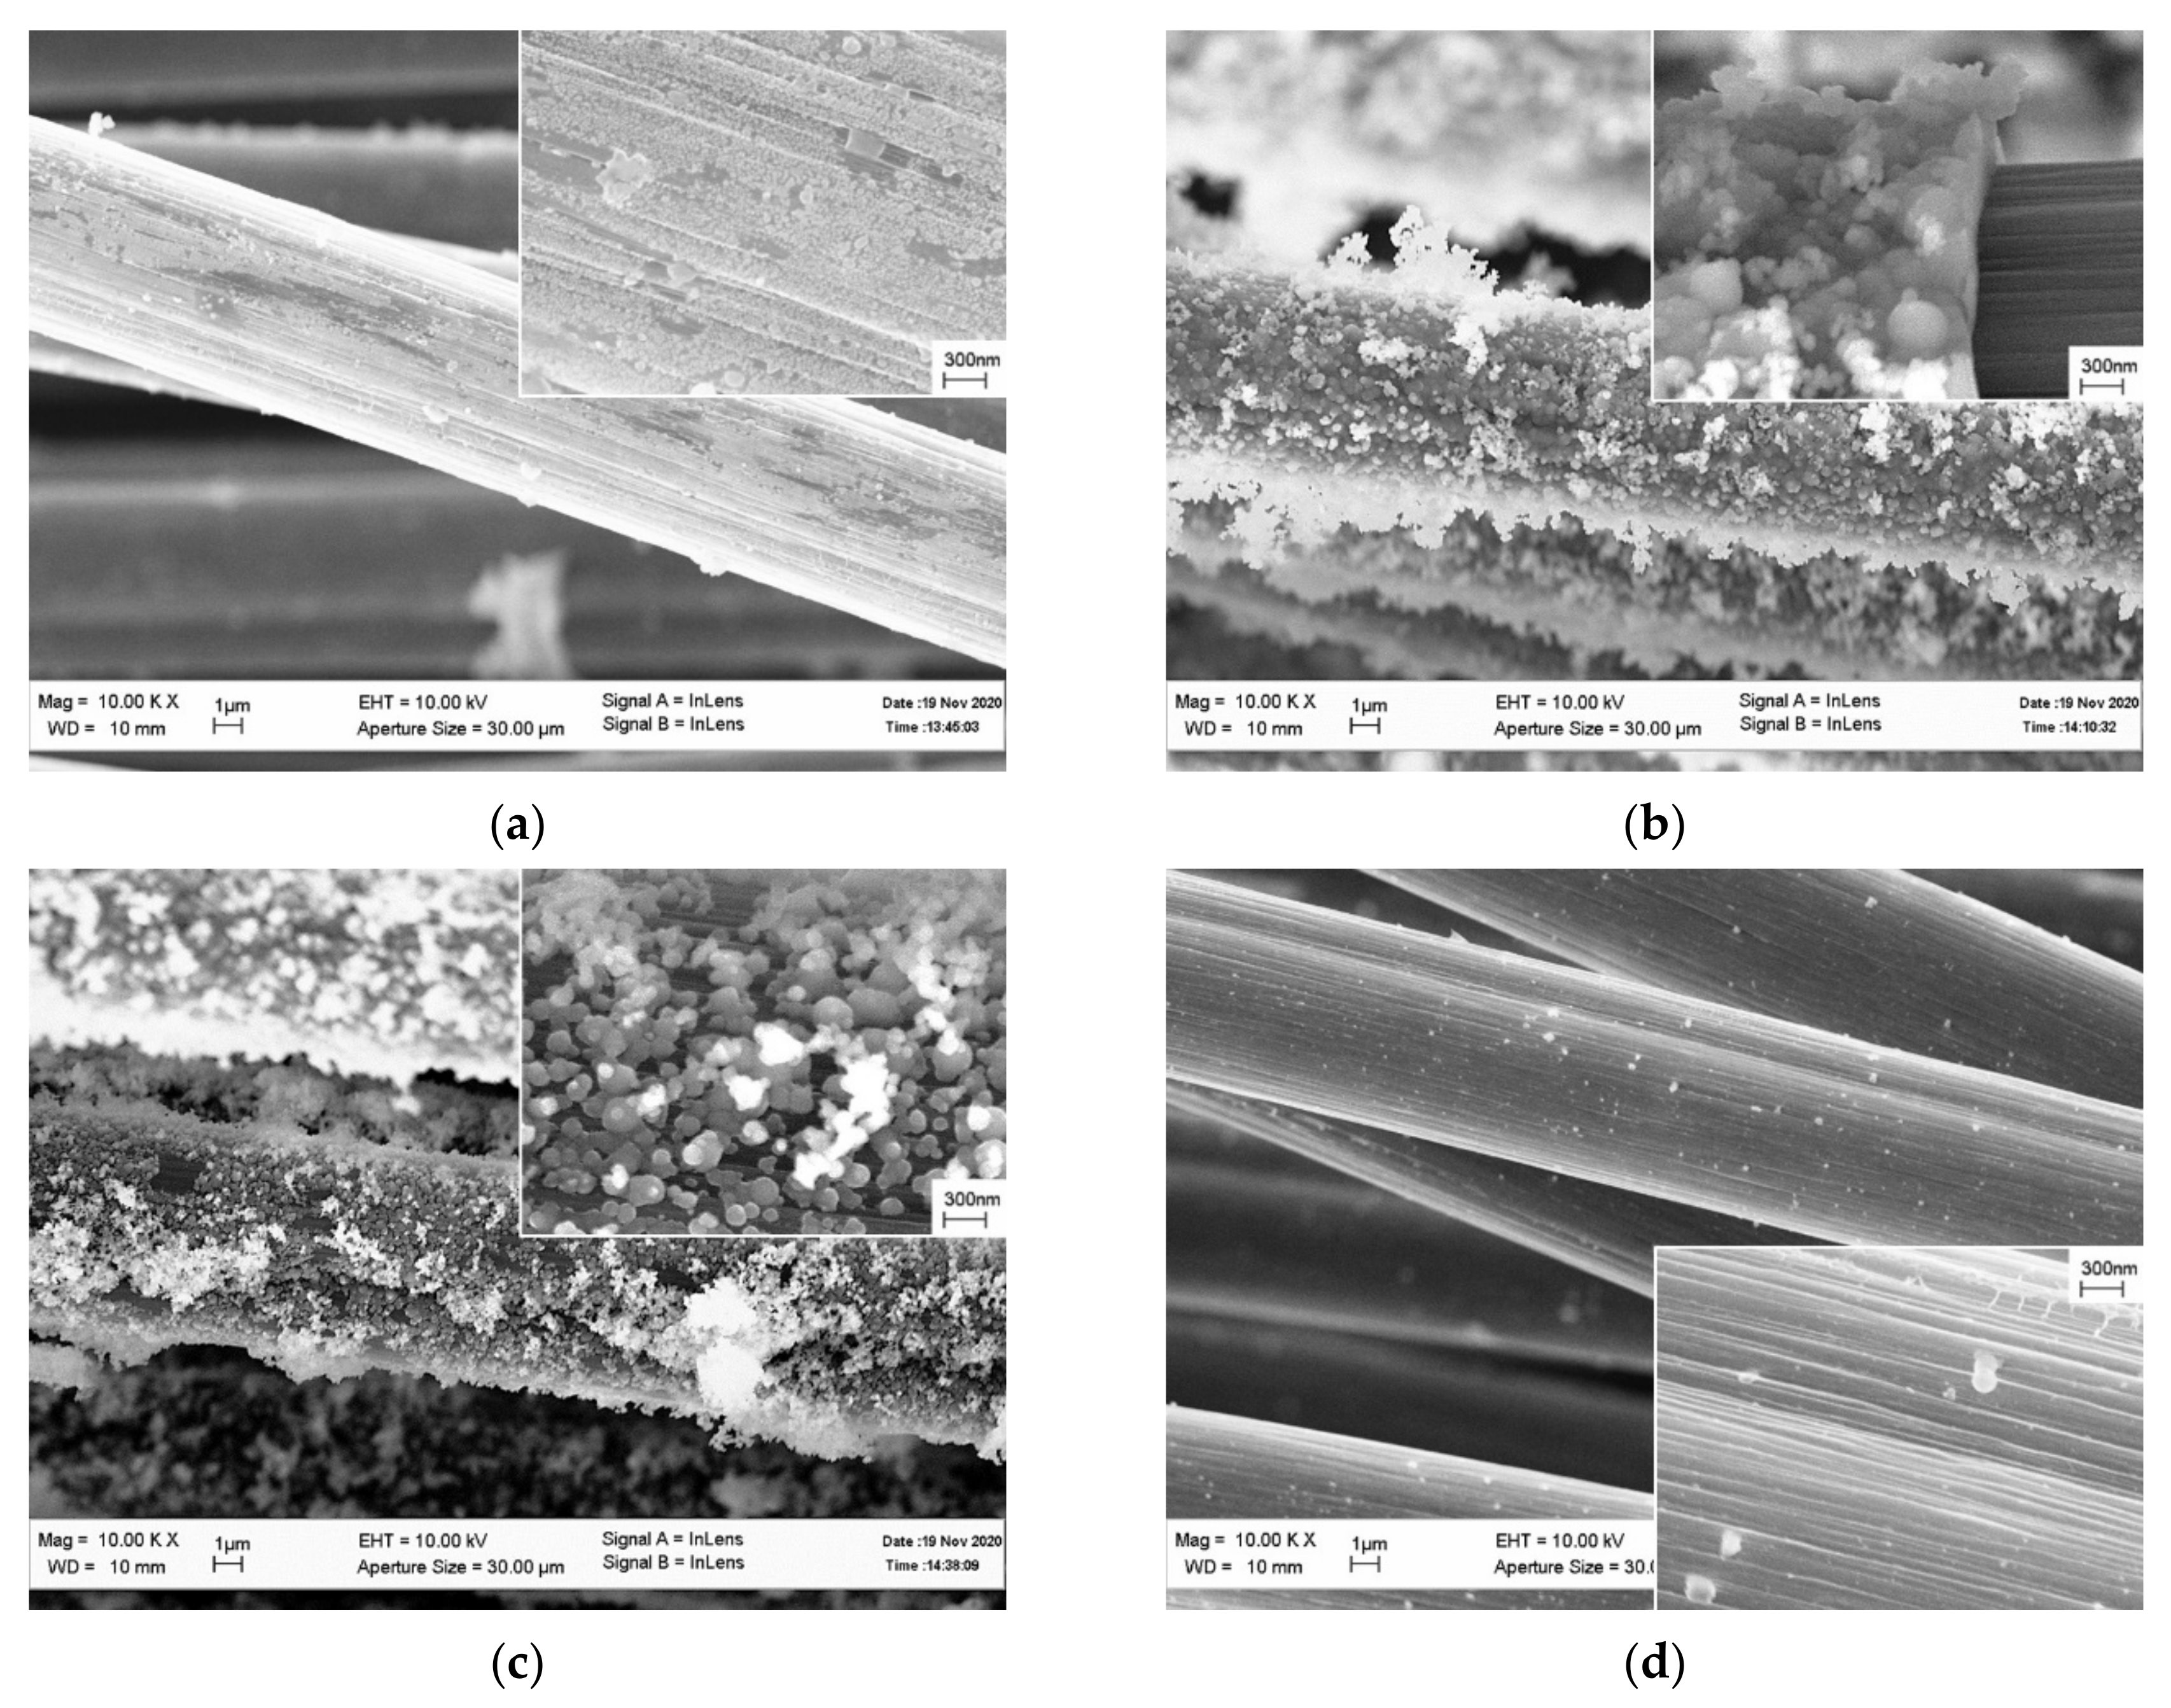
3.2. Salt Concentration
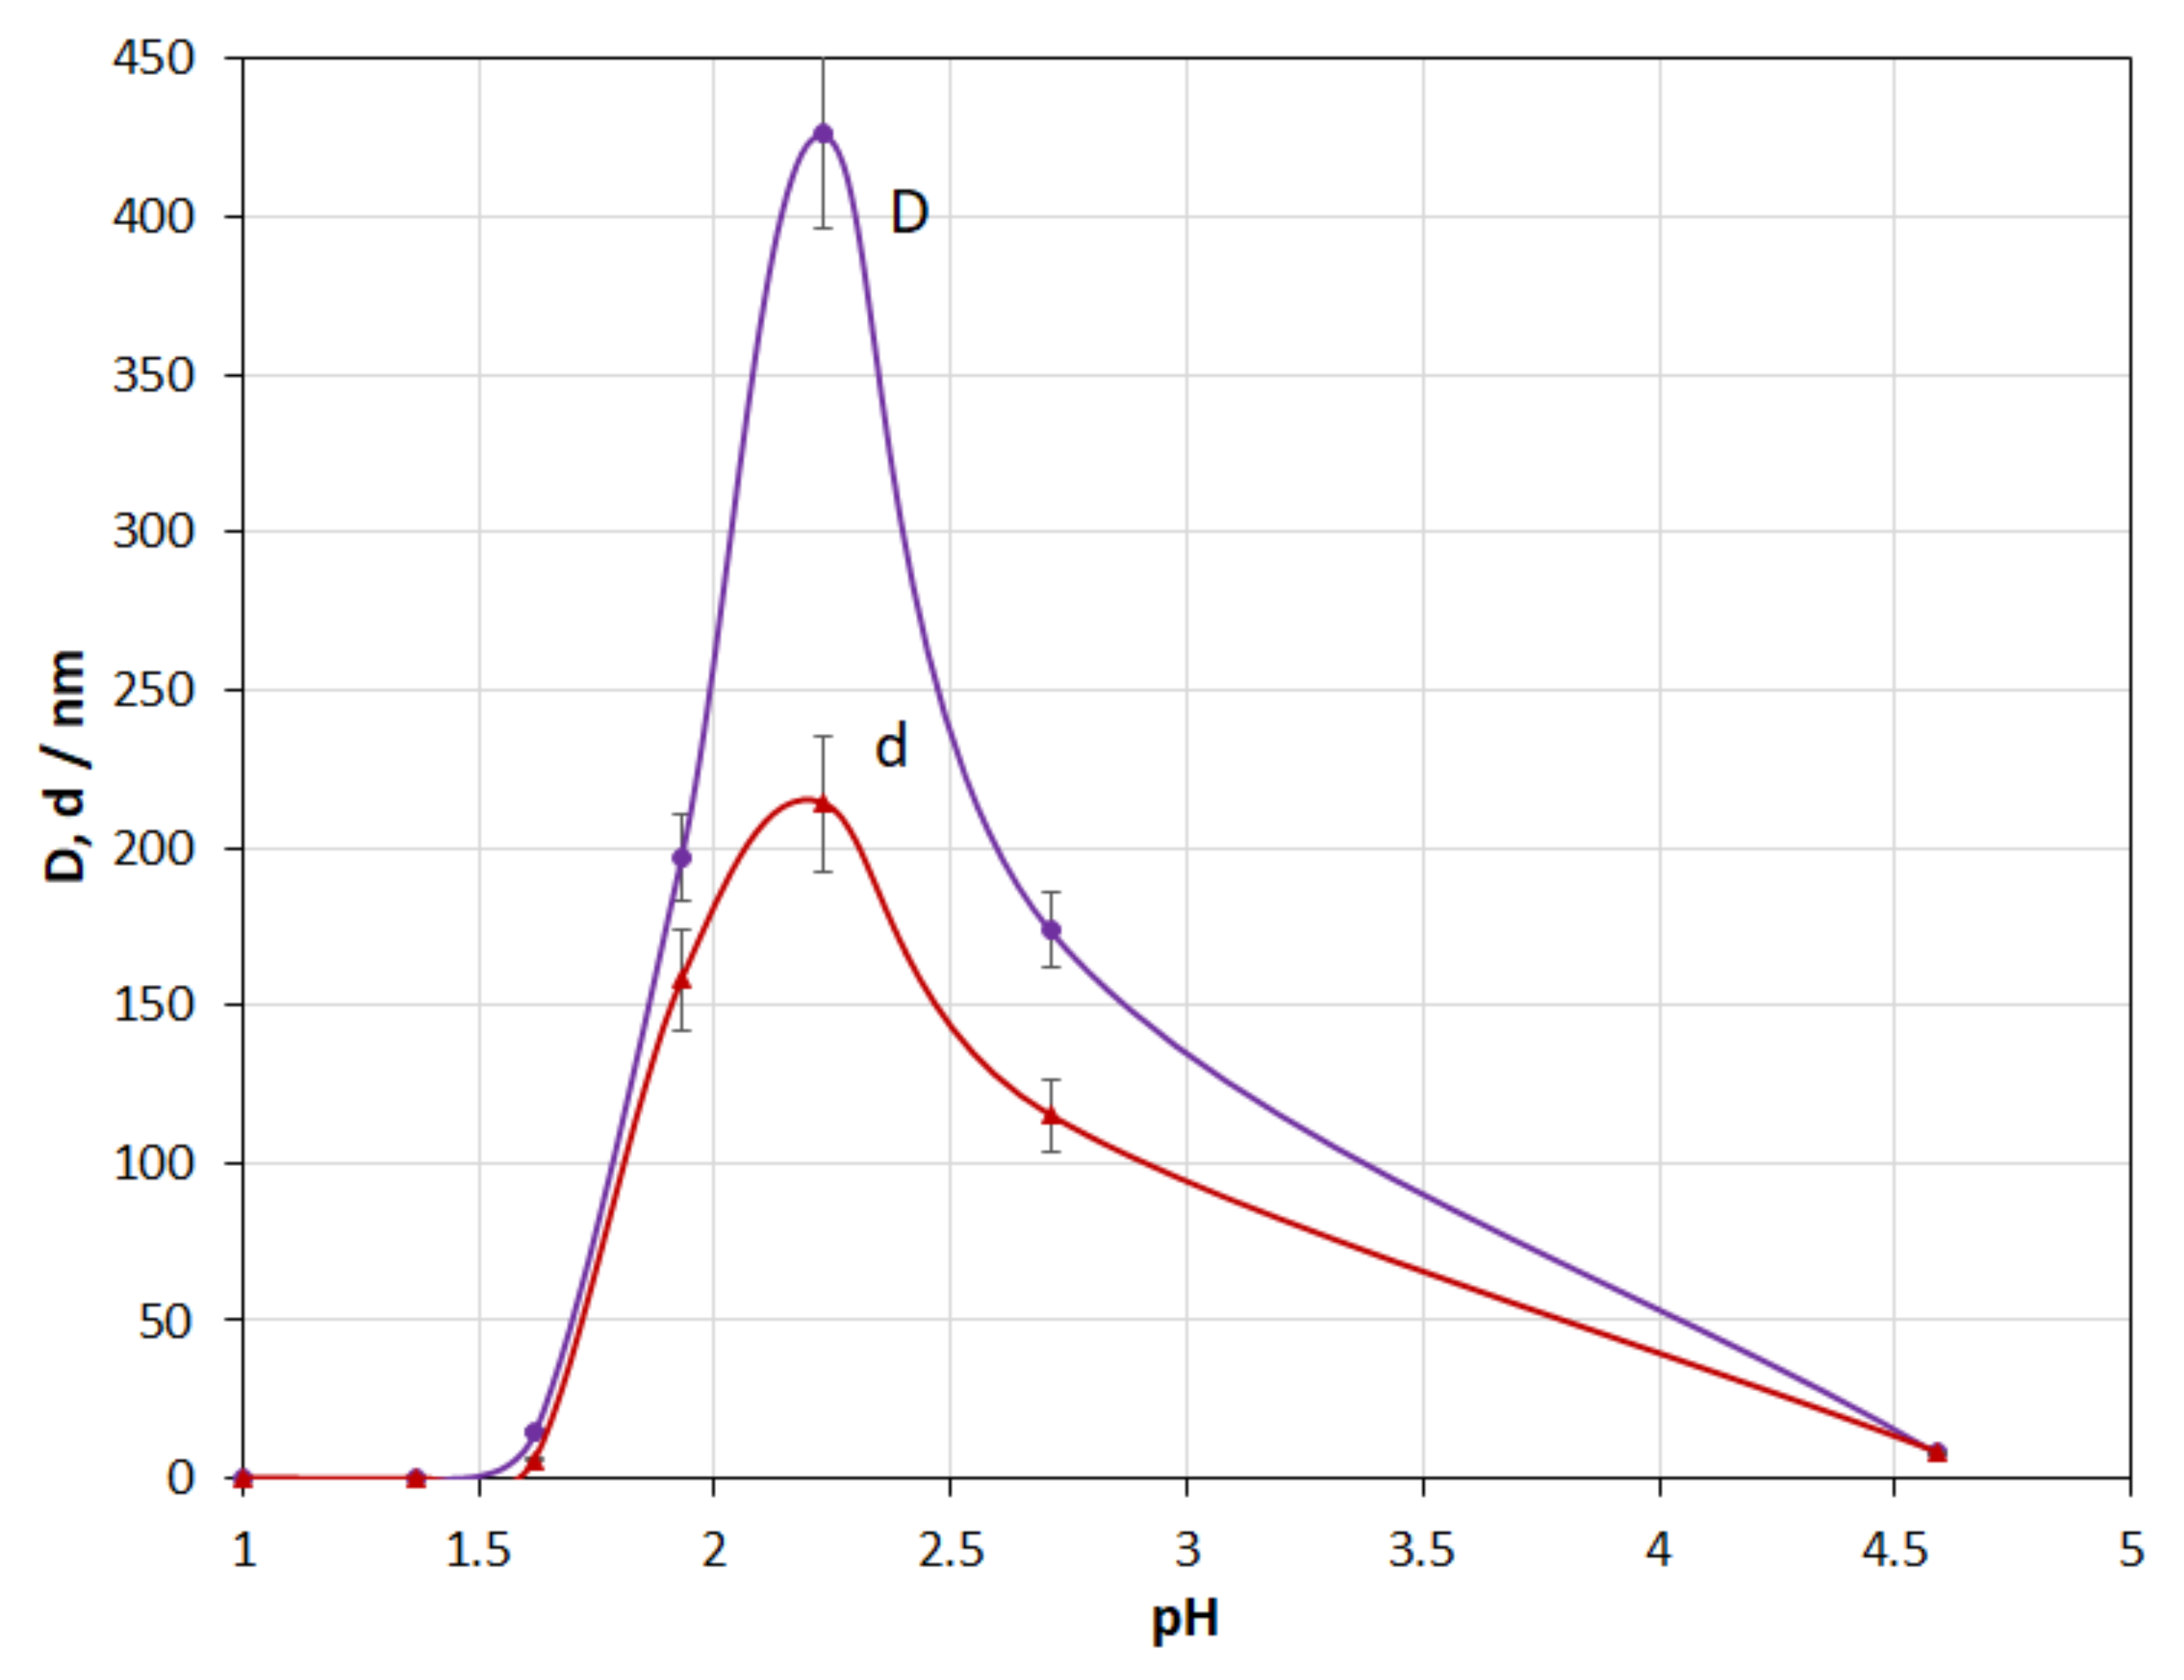
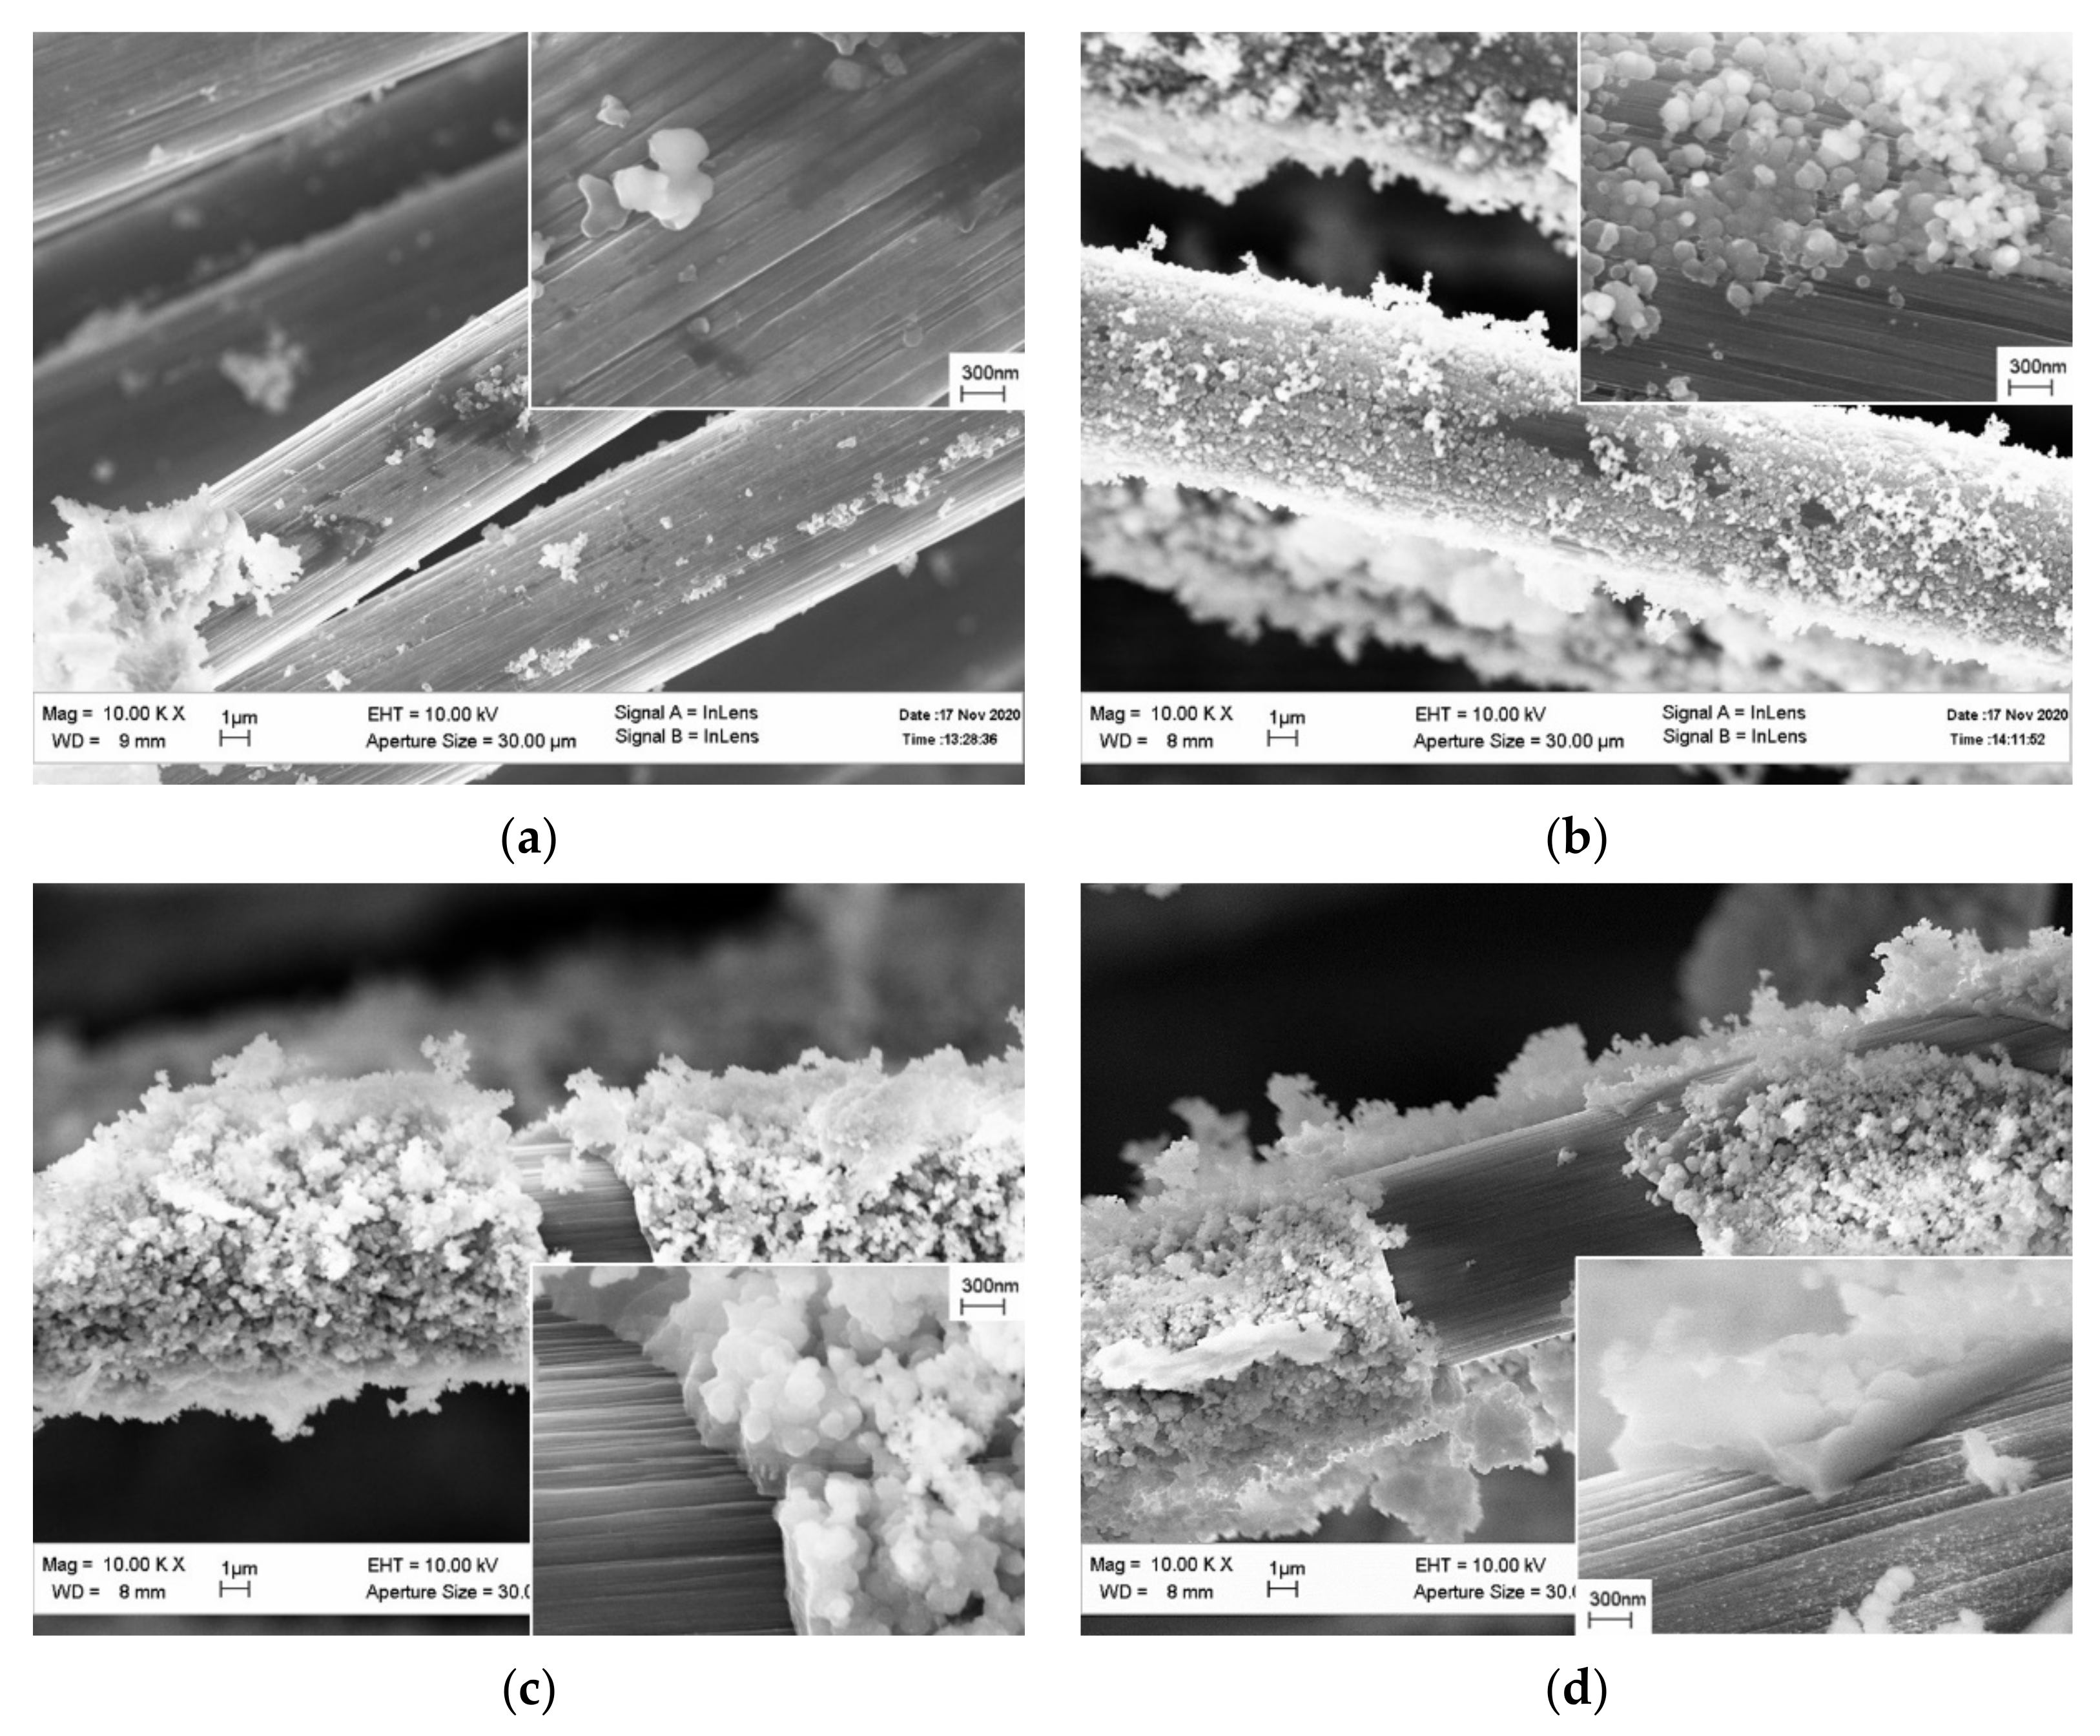
3.3. pH of the Reaction Medium
3.4. Molar Ratio H2O:TEOS
3.5. Isopropanol Concentration in the Reaction Medium
3.6. Current Density
3.7. Coating Deposition Time
4. Discussion
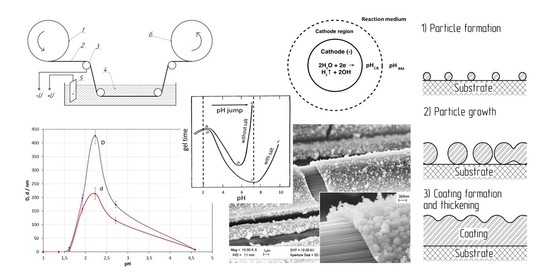
4.1. Coating Formation Mechanism
4.2. Effect of KNO3 Salt Concentration
4.3. Effect of pH of the Reaction Medium
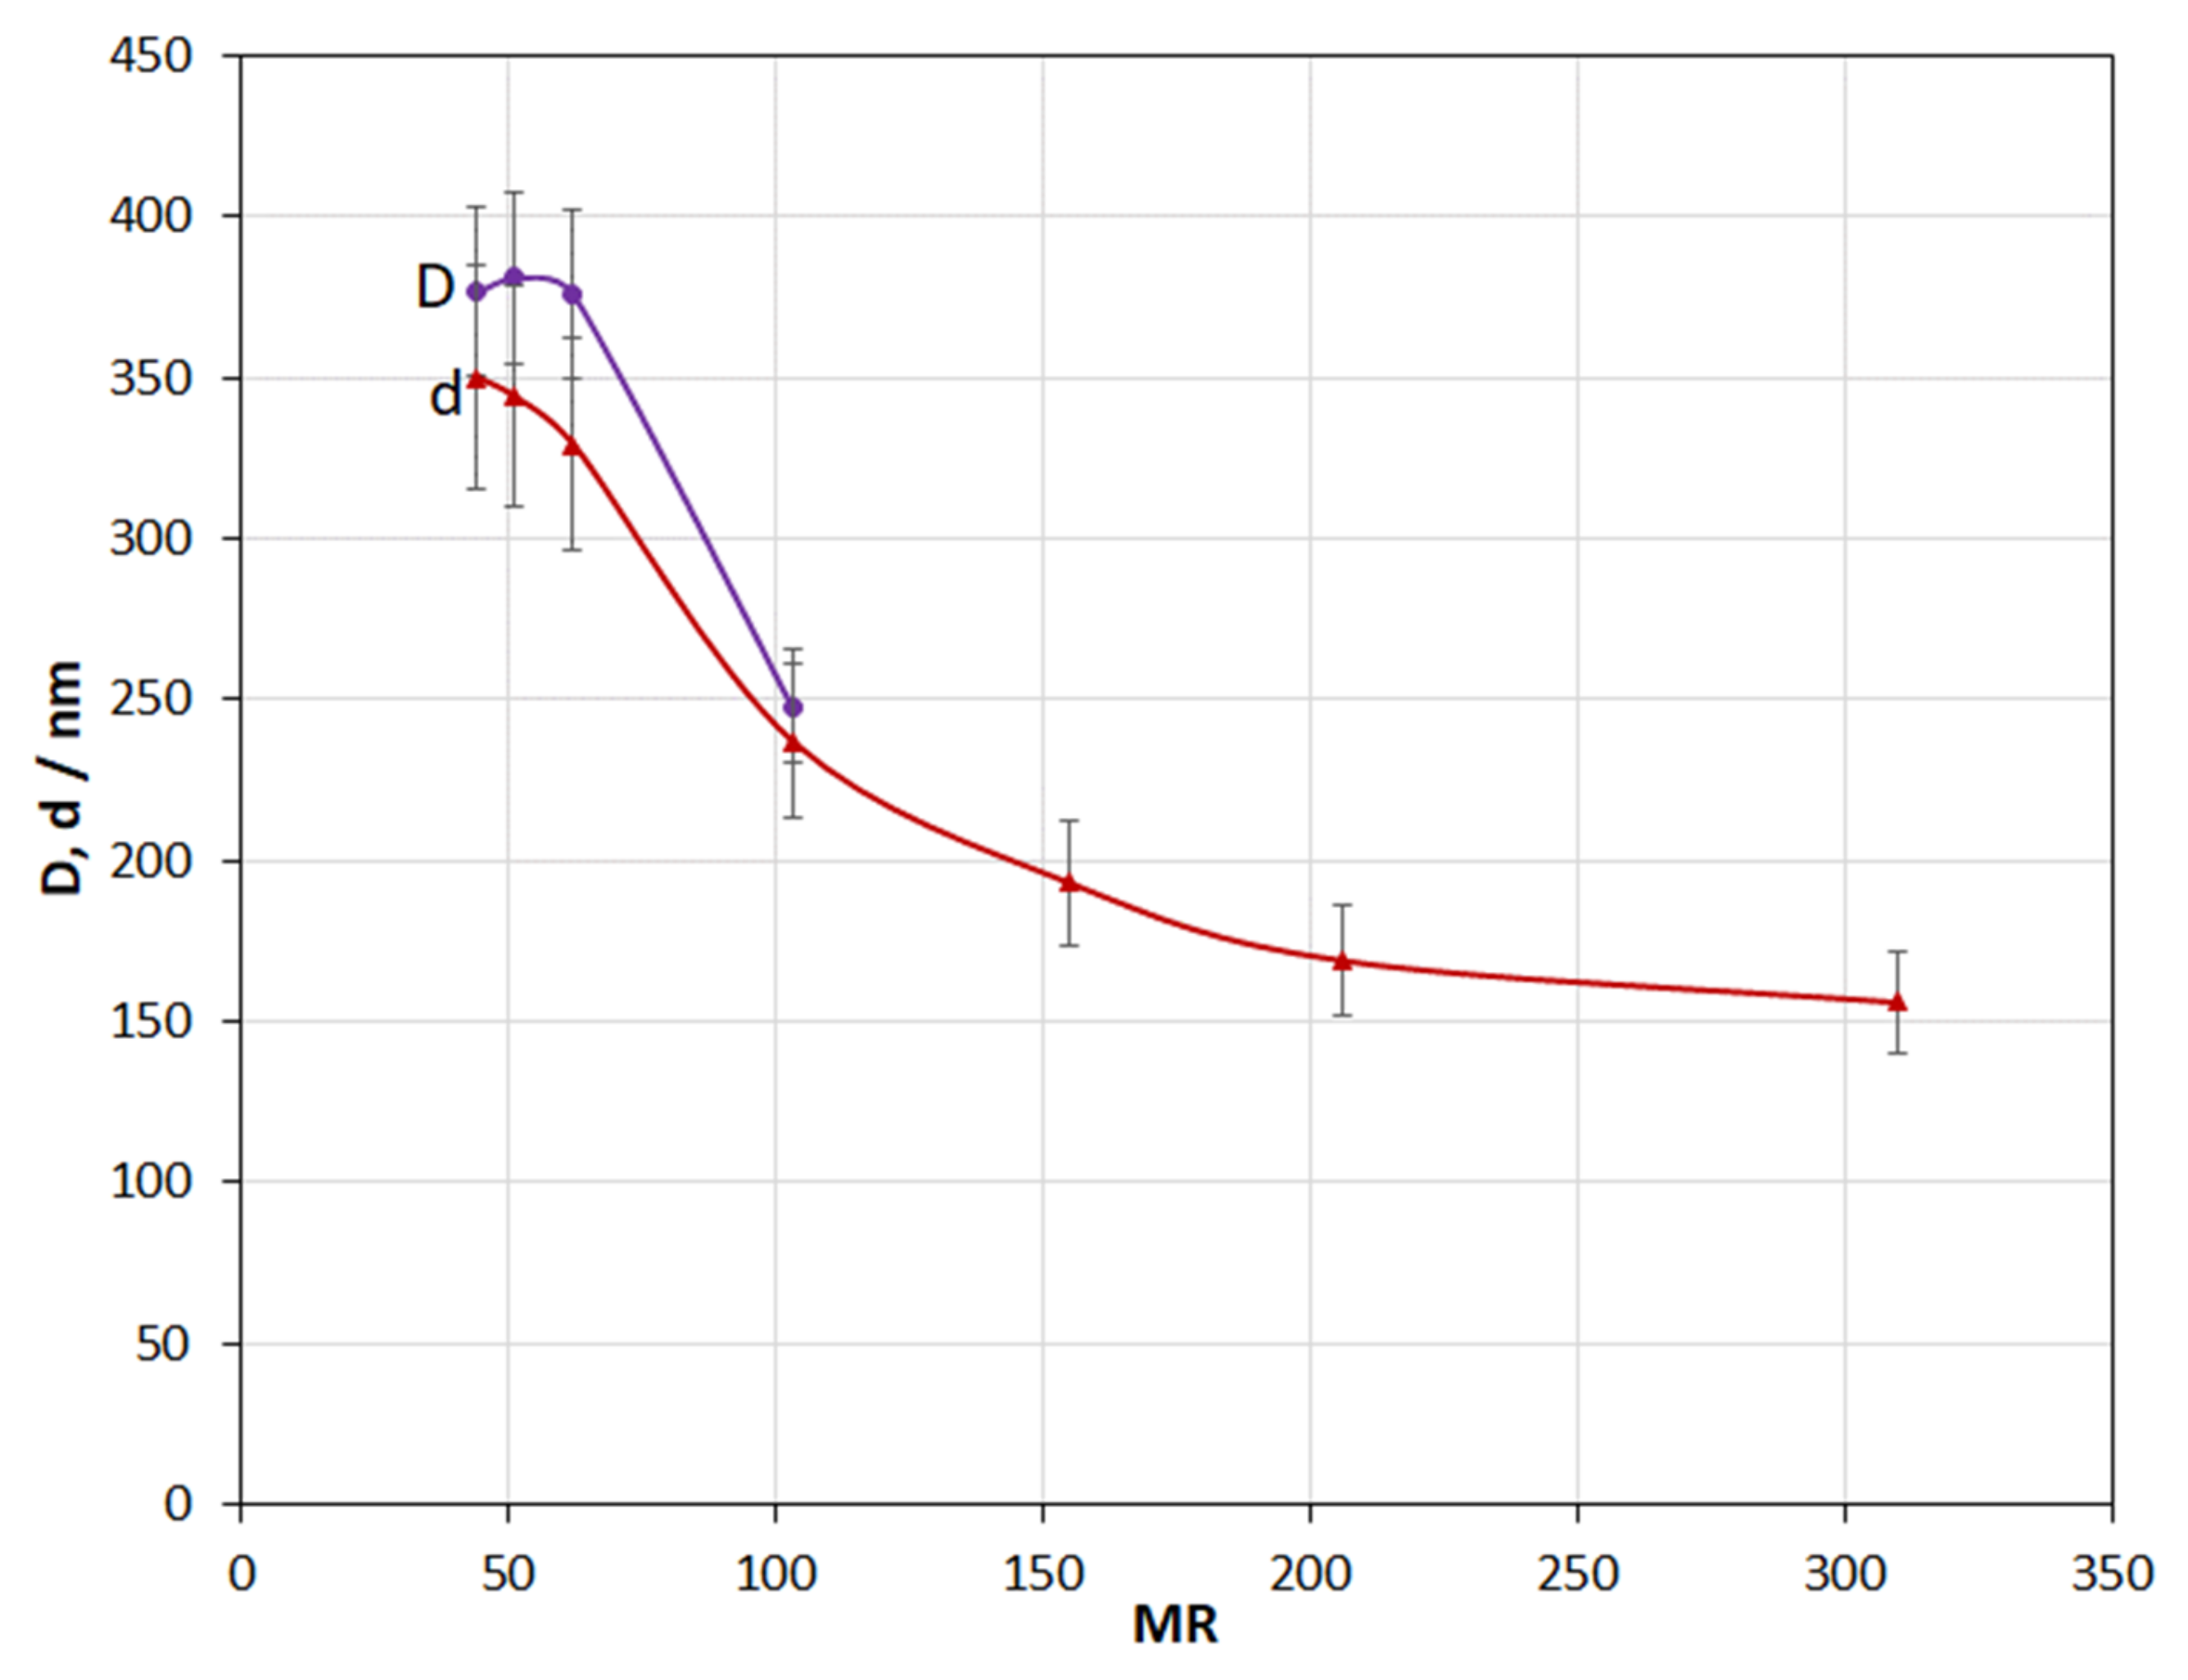
4.4. Effect of MR
4.5. Effect of Isopropyl Alcohol Concentration
4.6. Effect of Current Density and Deposition Time
5. Conclusions
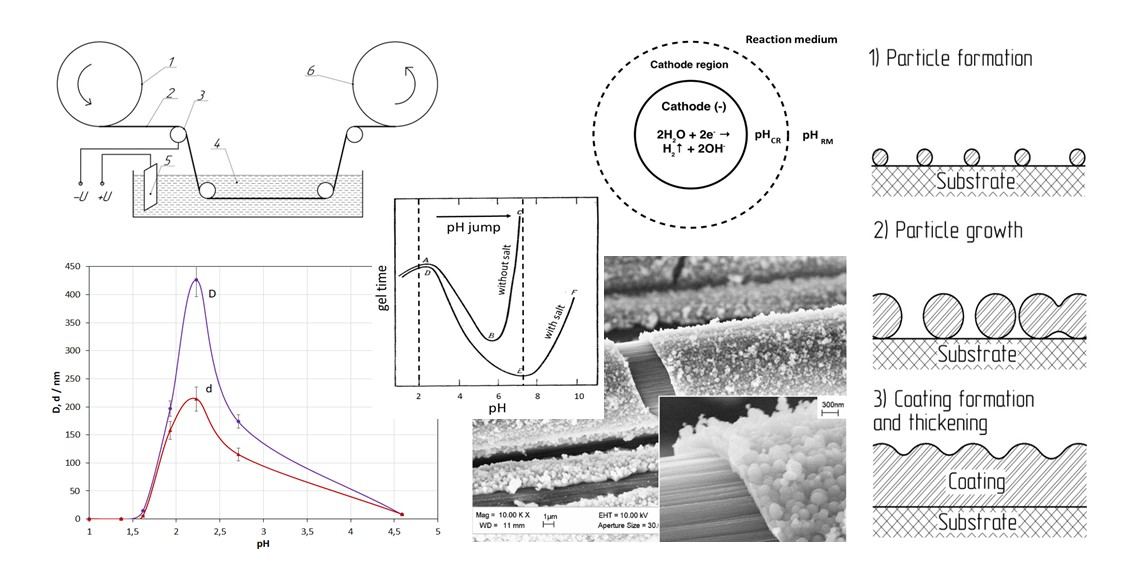
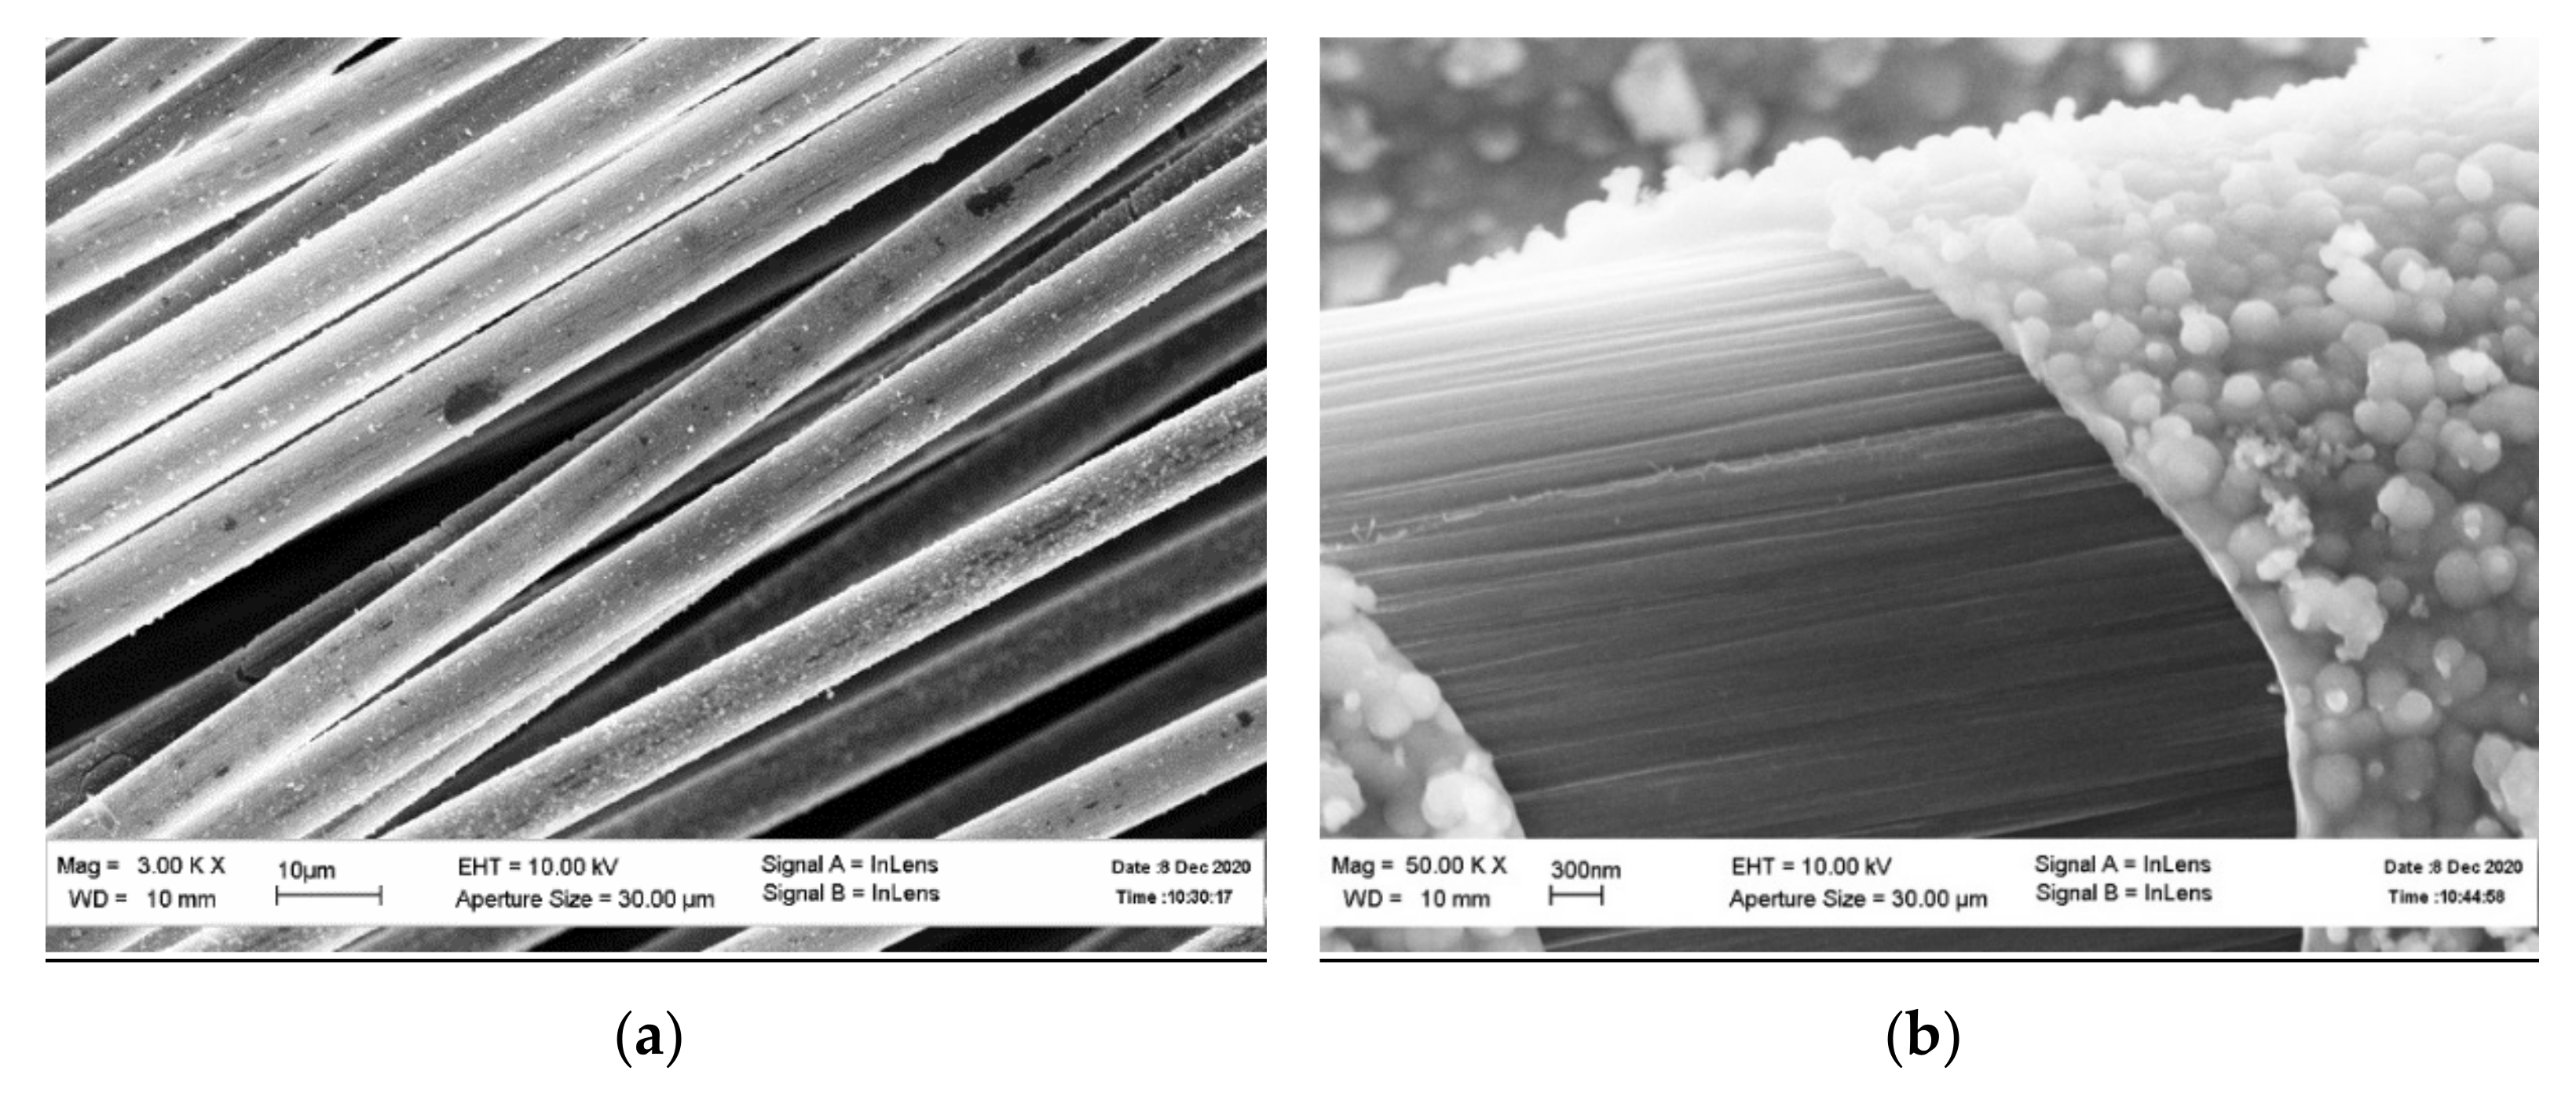
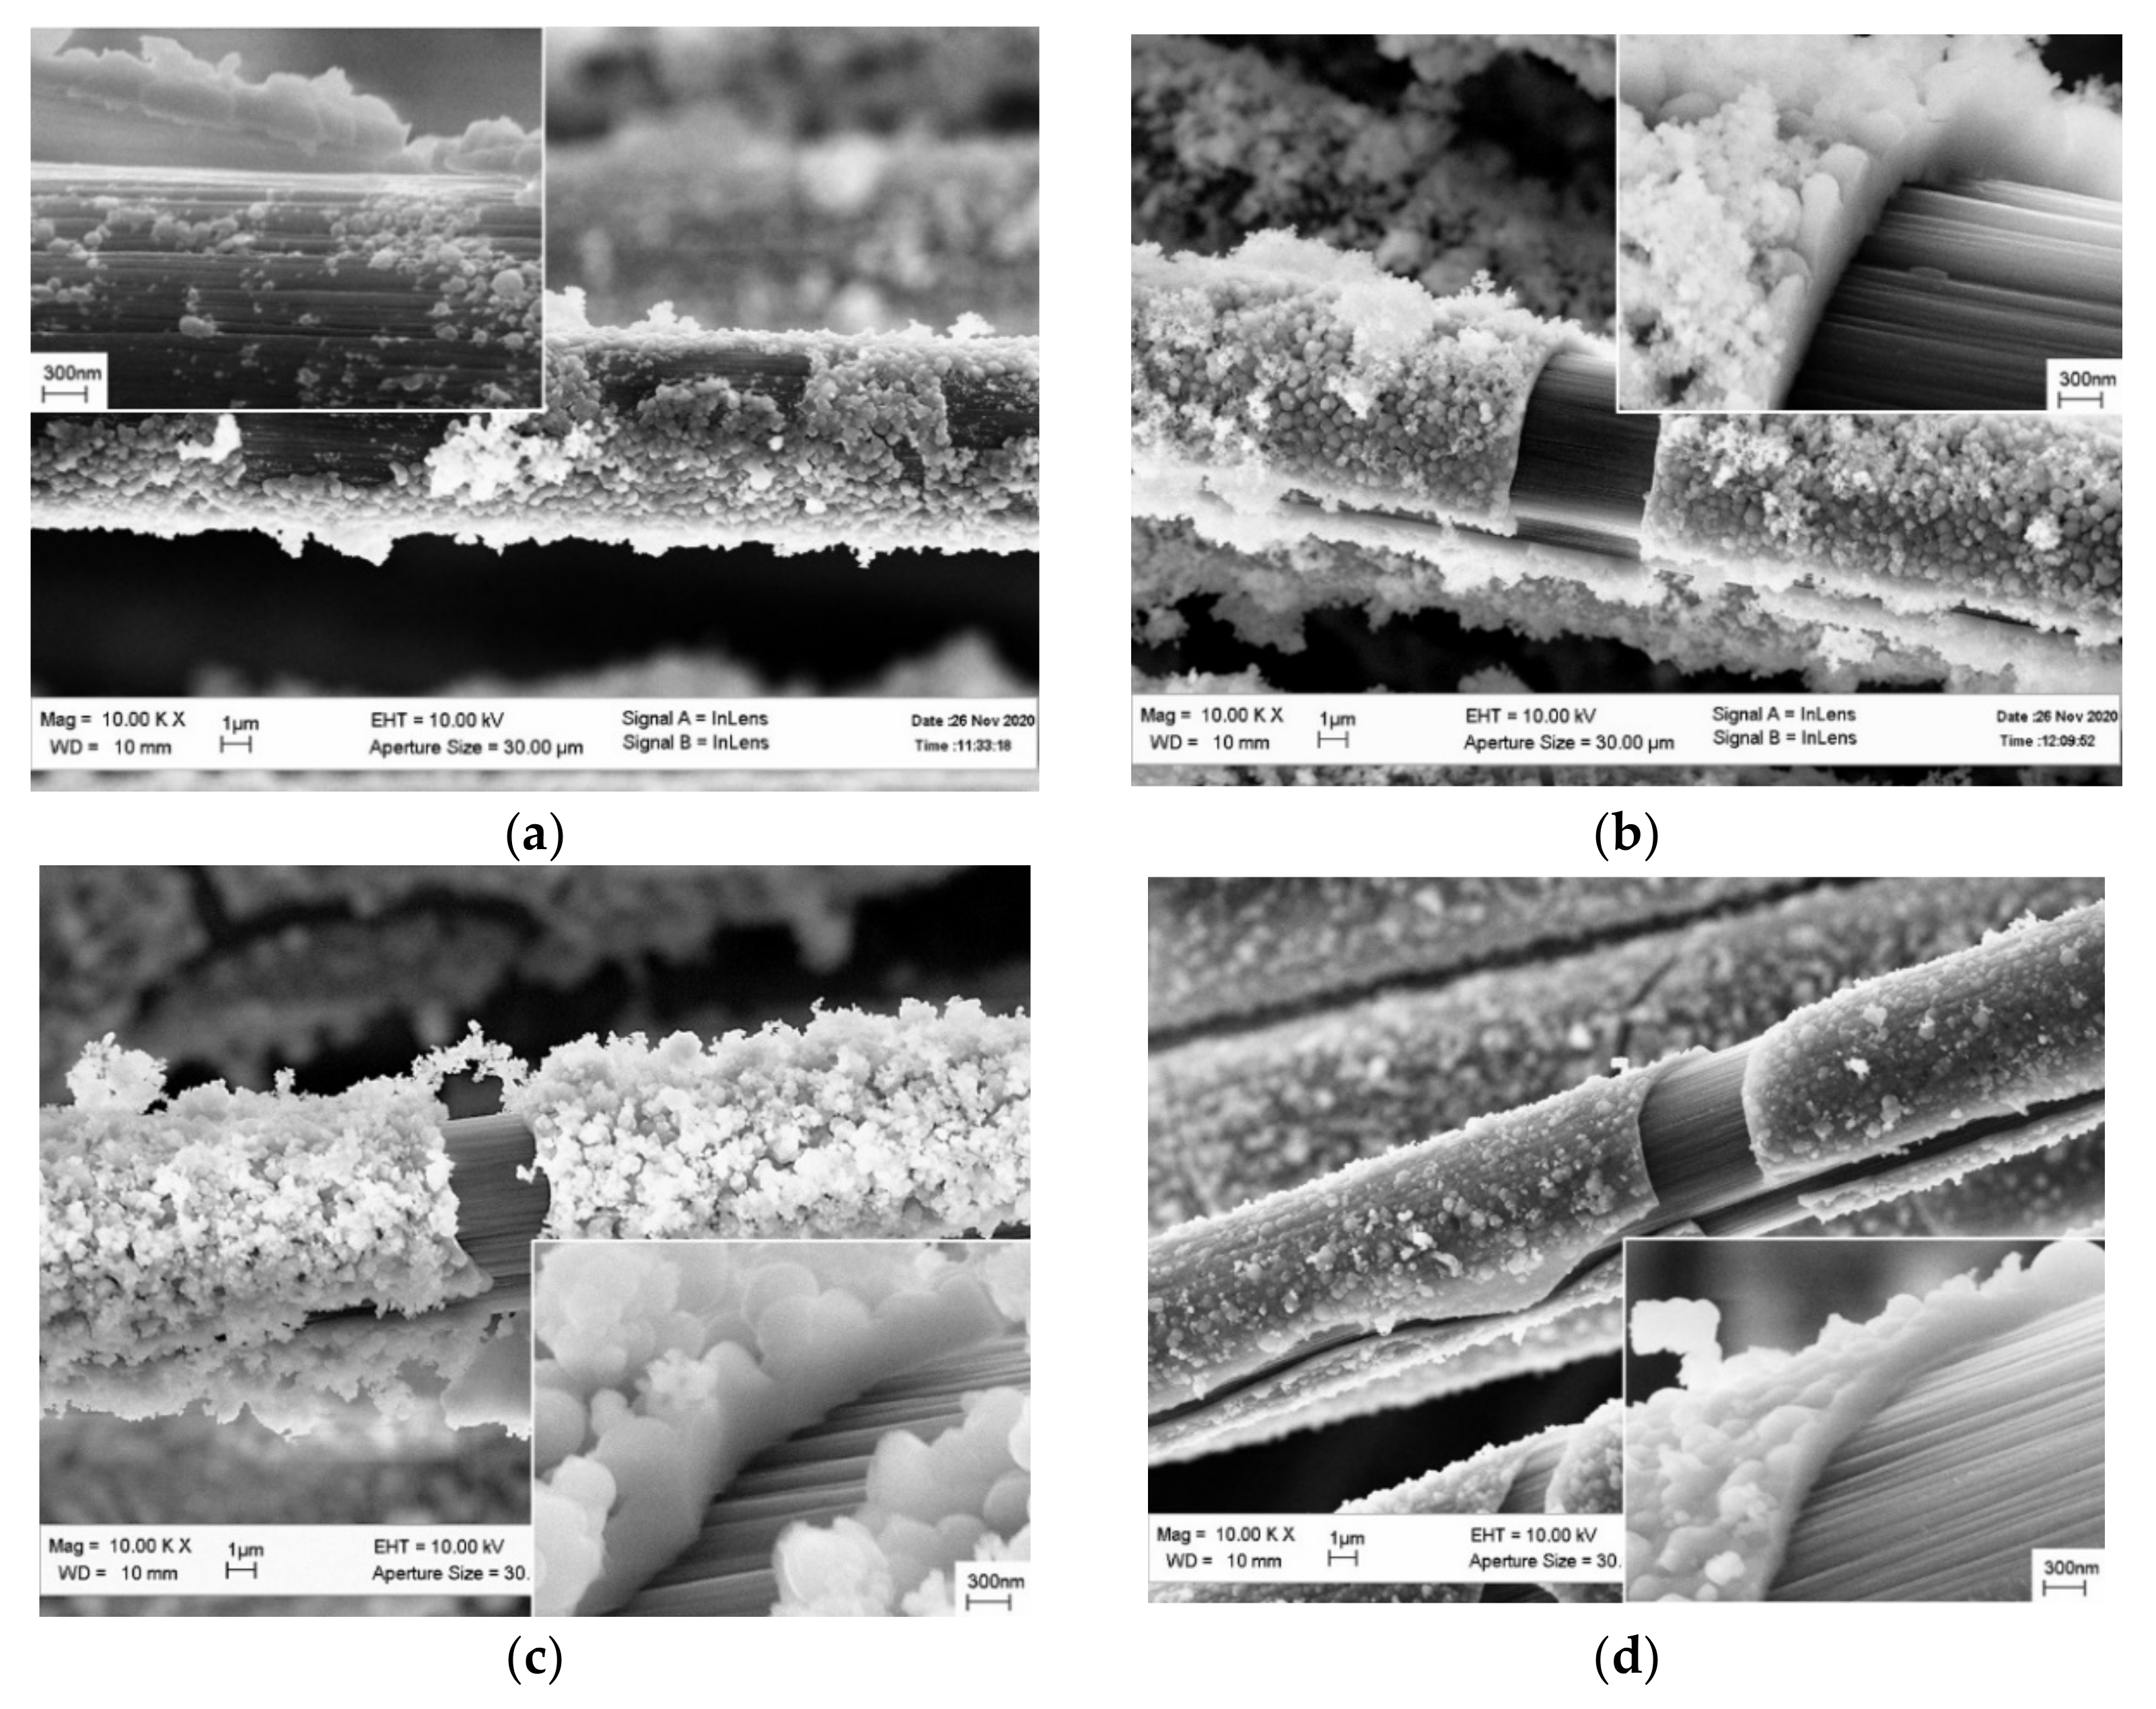
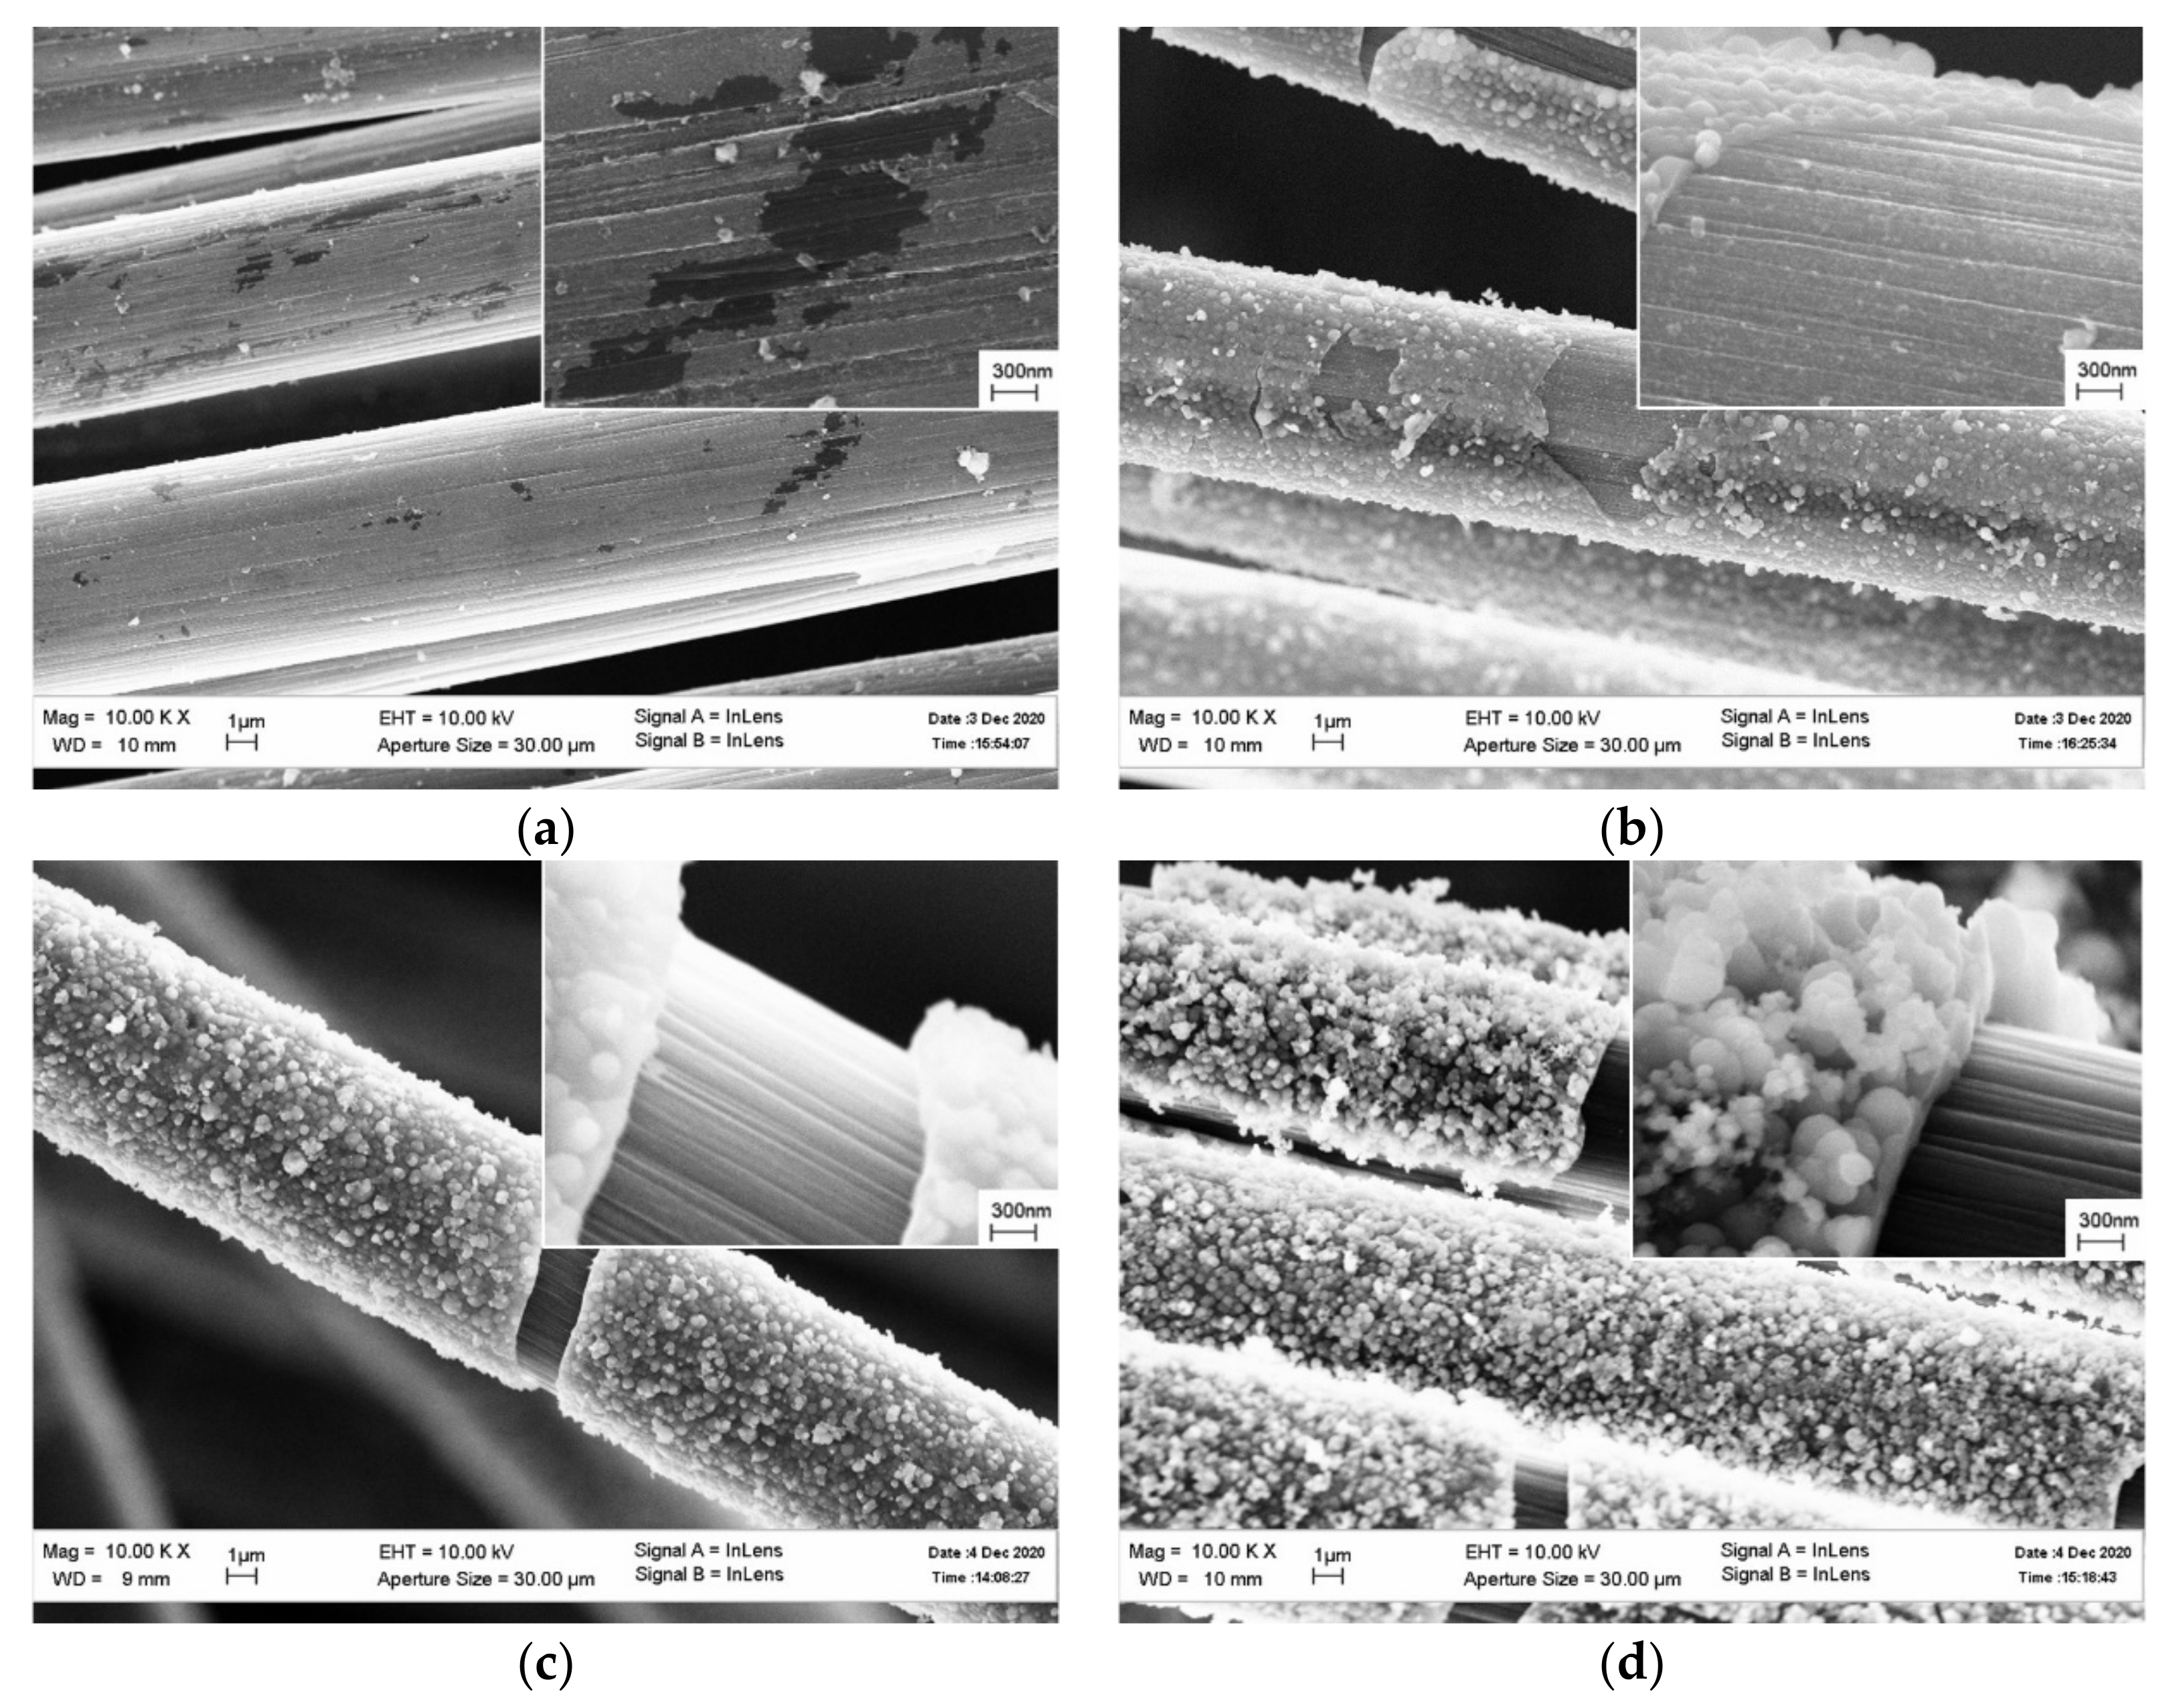
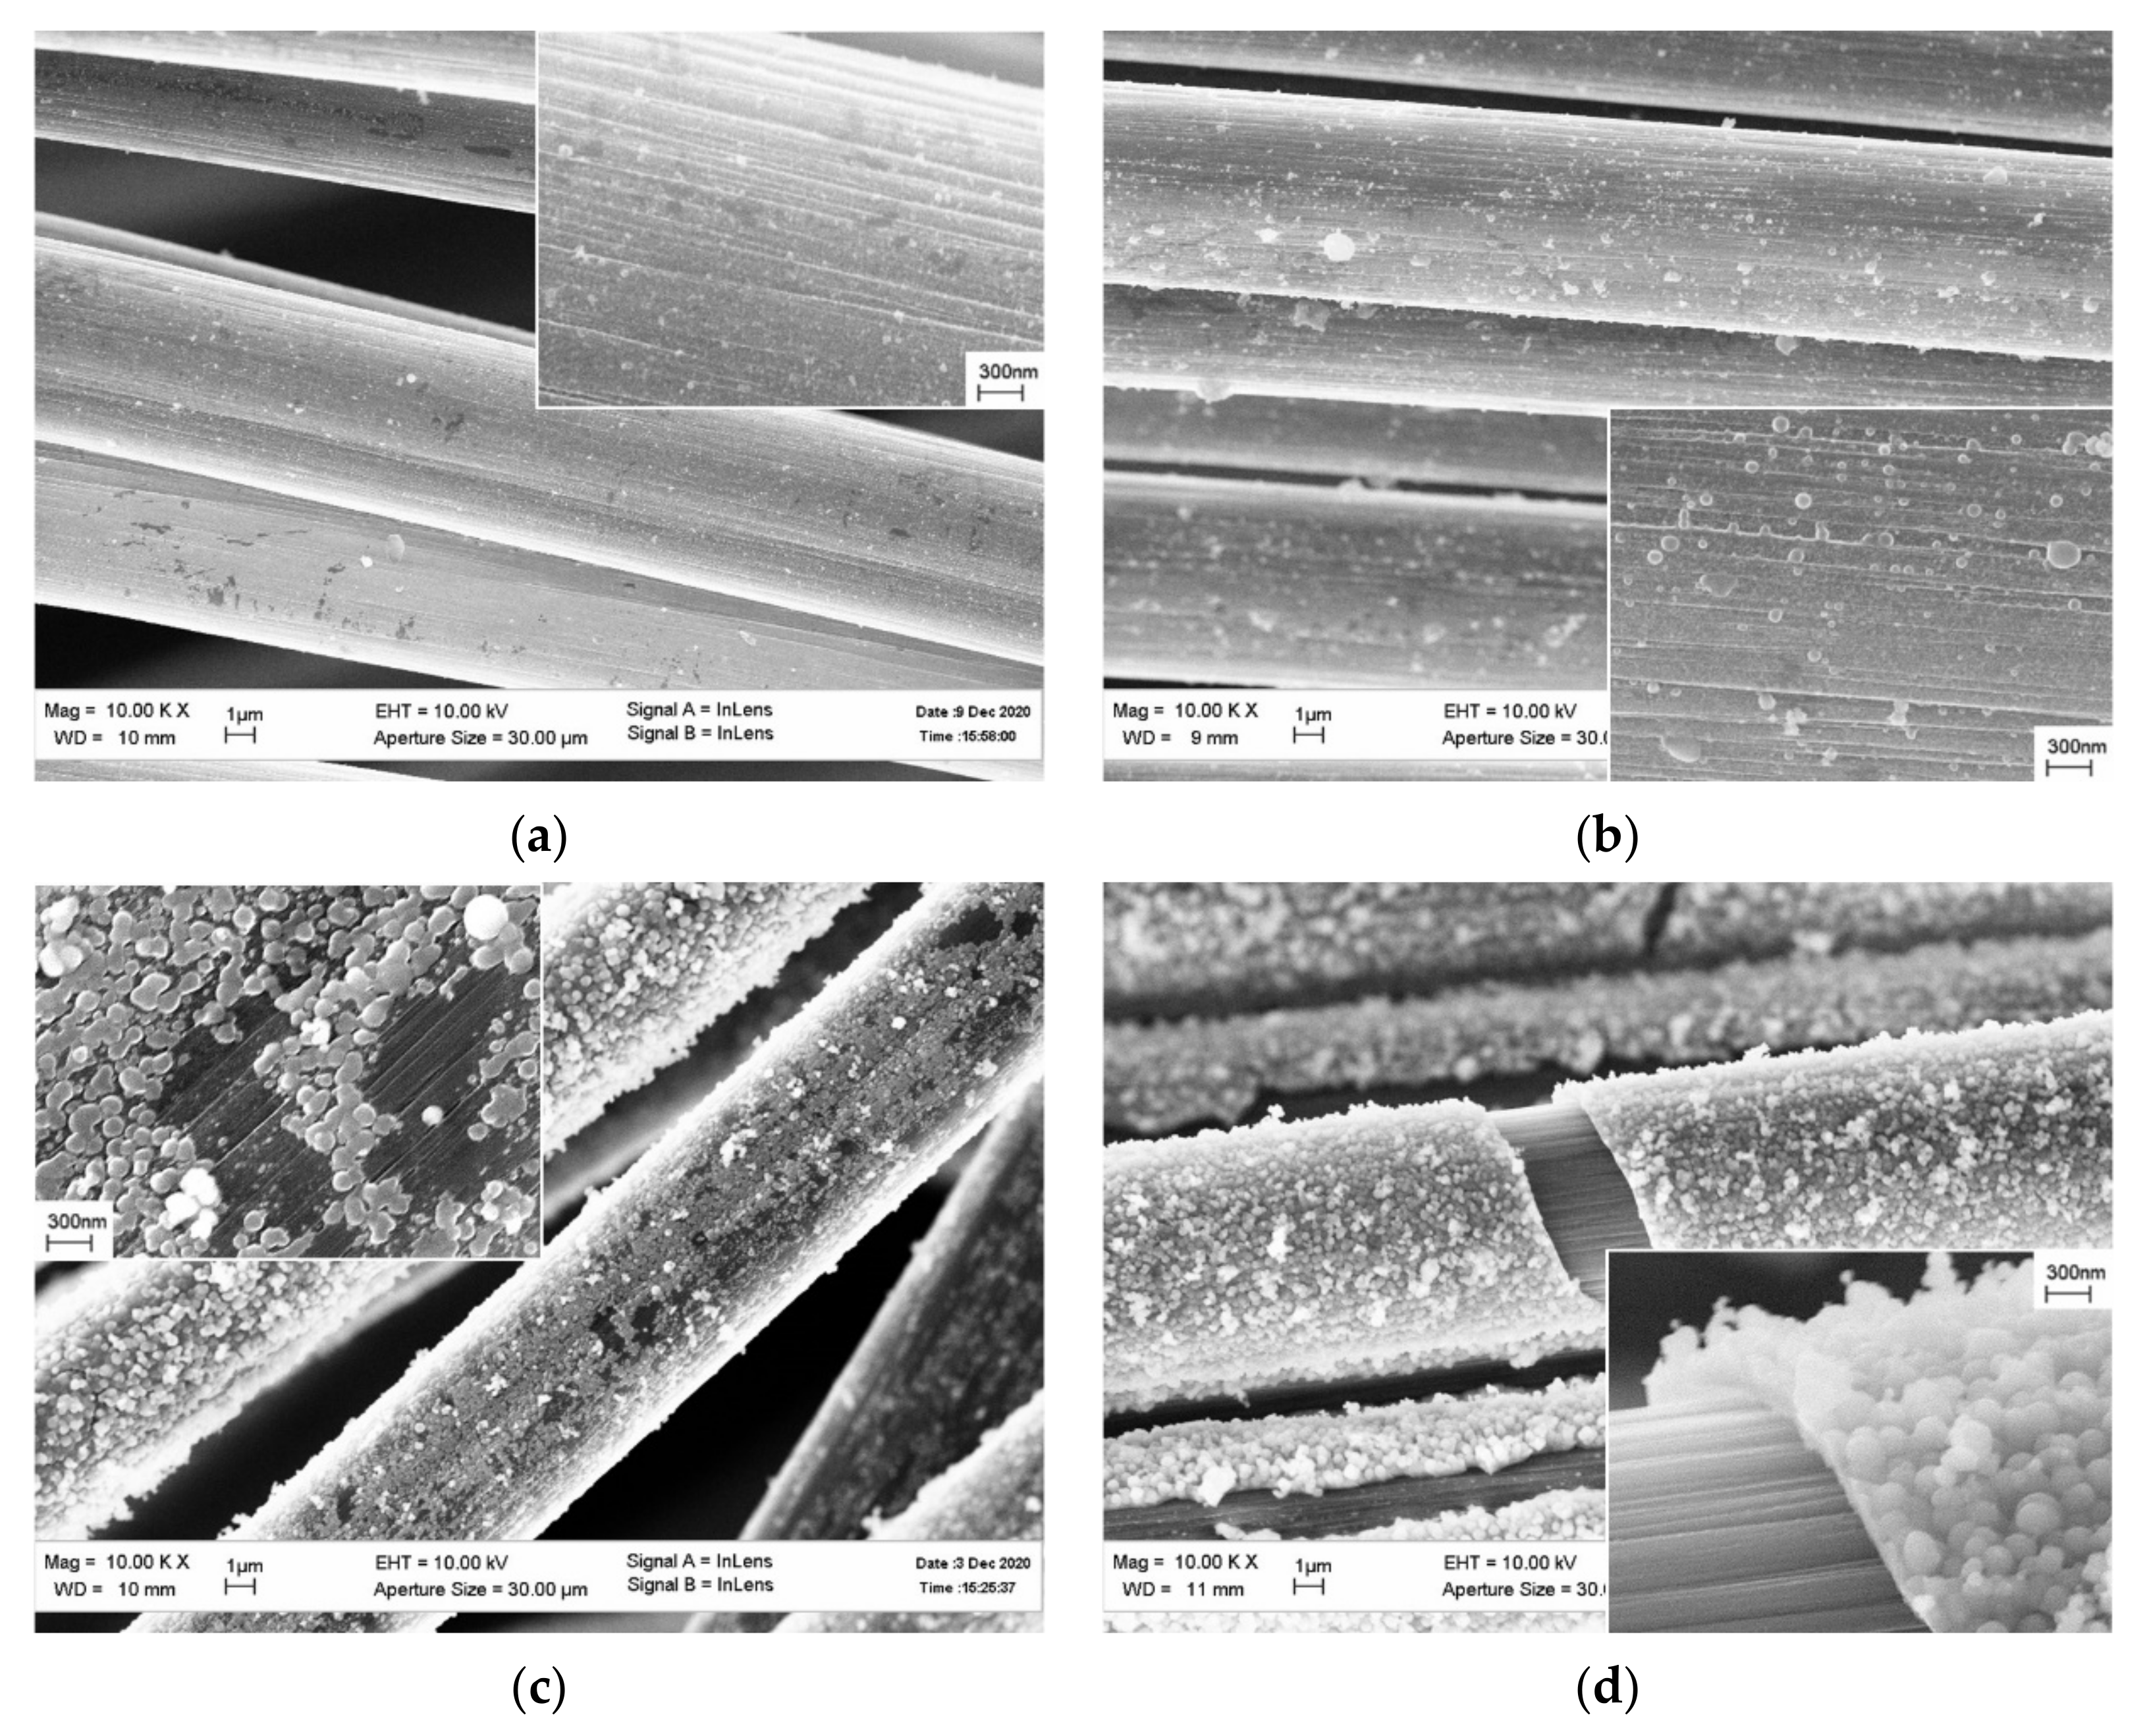
- For the first time, a method combining a sol-gel process and electrochemical deposition has been used to deposit oxide coatings on the carbon fiber. The method allows all filaments of a carbon fiber yarn to be uniformly coated. A characteristic feature of the structure of all obtained coatings is that it is formed of interconnected particles. The coating thickness can be pre-set in the range from a few nanometers to 1.2 µm.
- The work presents the results of studying the effect of current density, deposition time, salt concentration, pH, TEOS/H2O molar ratio, and alcohol concentration in the initial reaction medium on the structure and thickness of the coatings being formed. The results are in good agreement with the classical concepts of the behavior of silica sols.
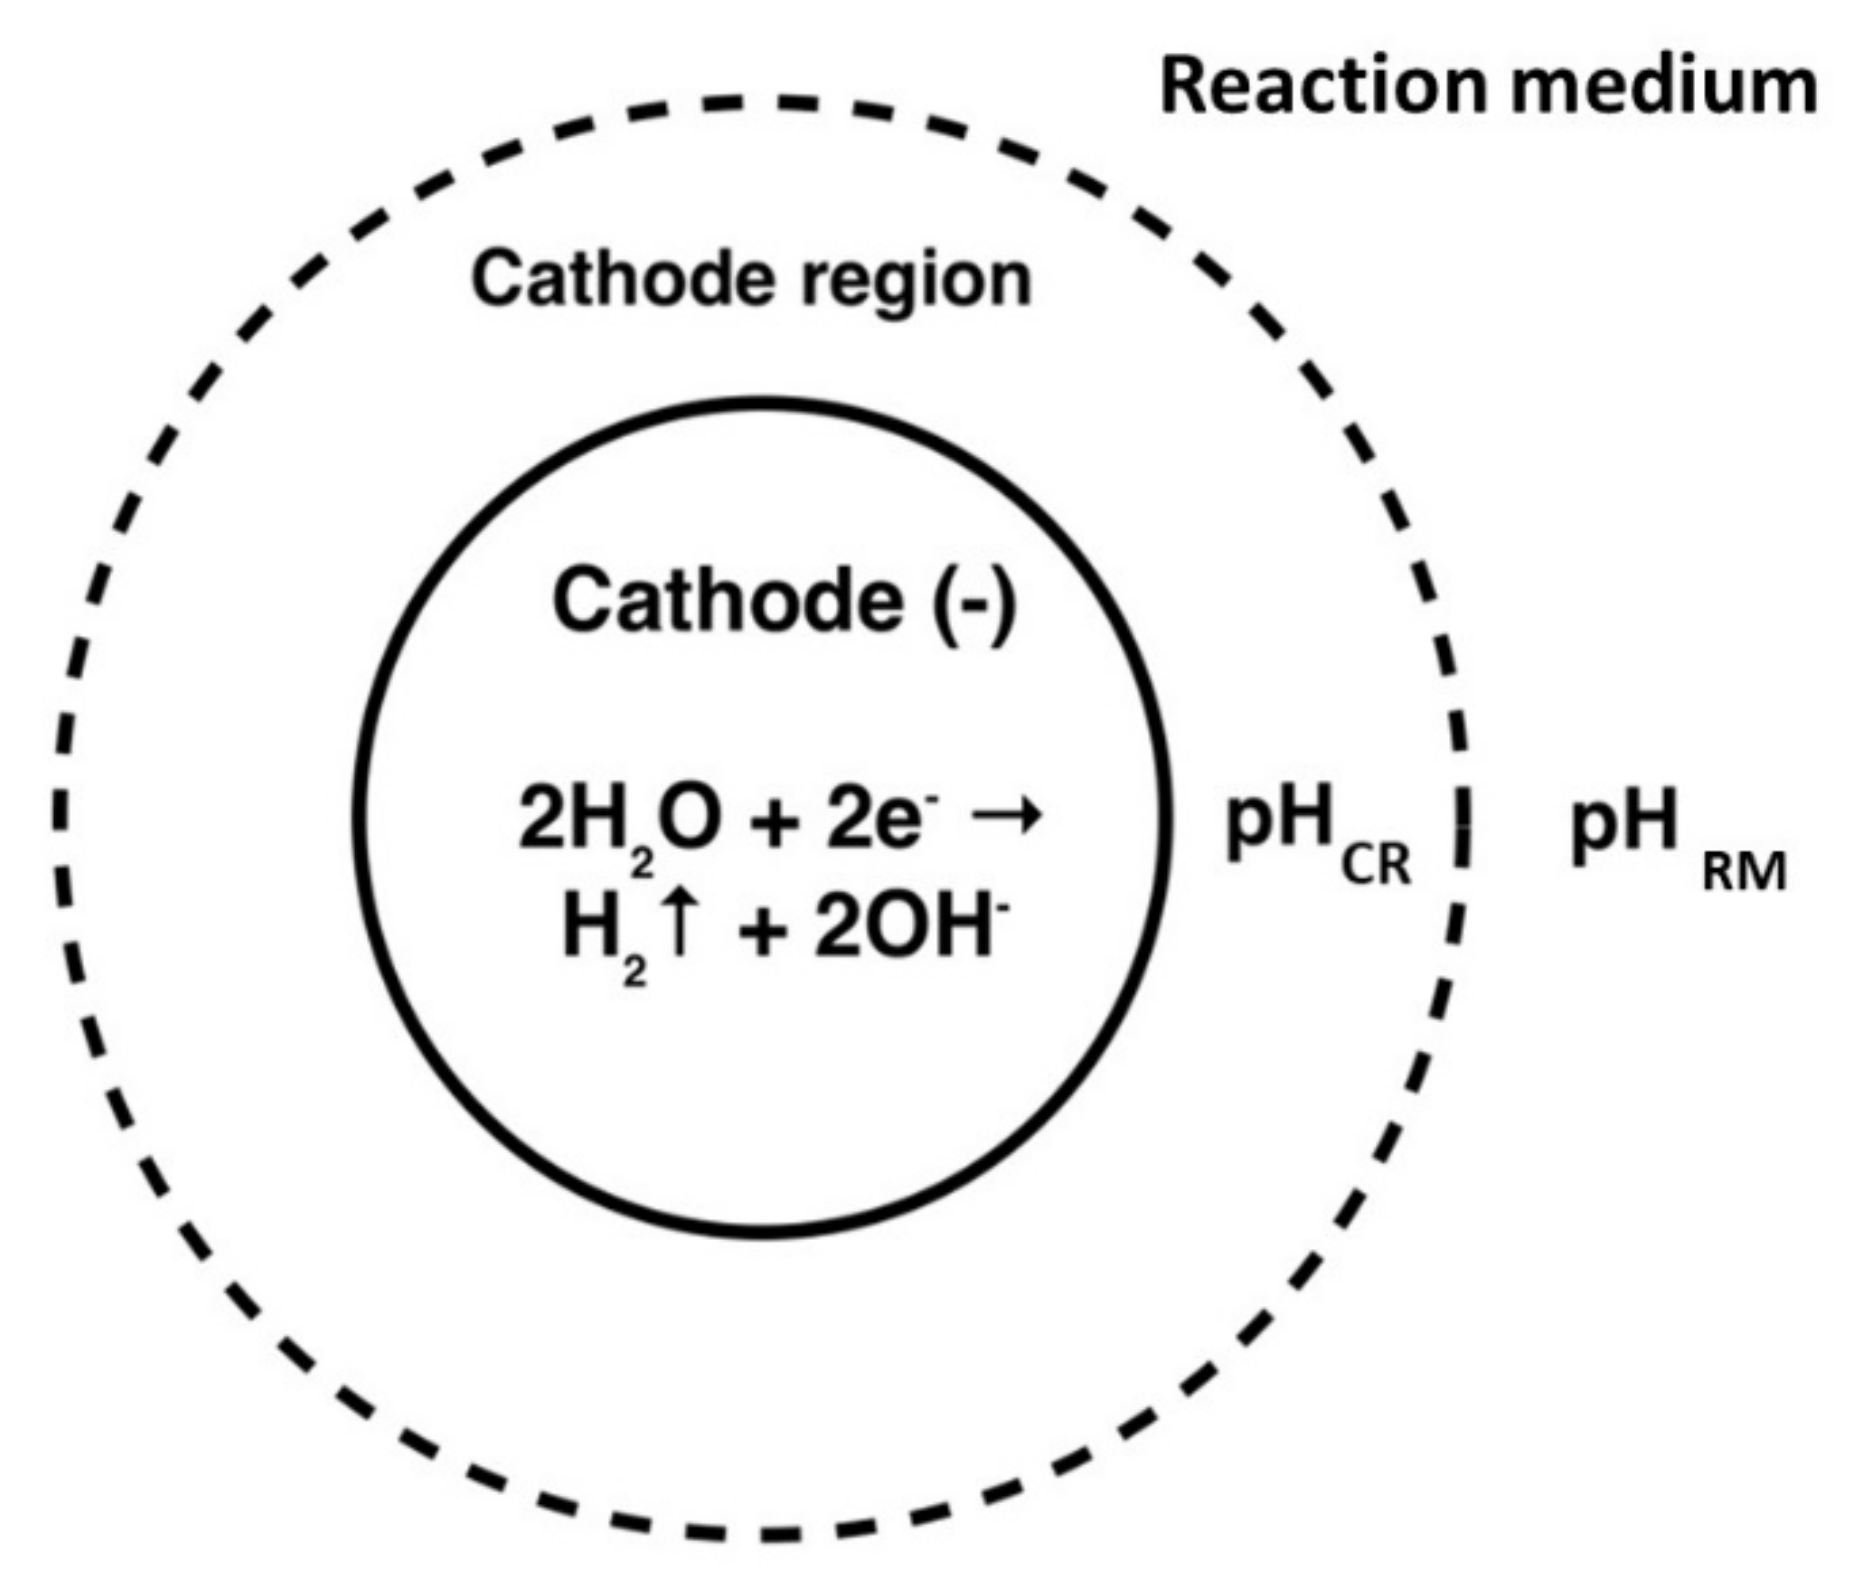
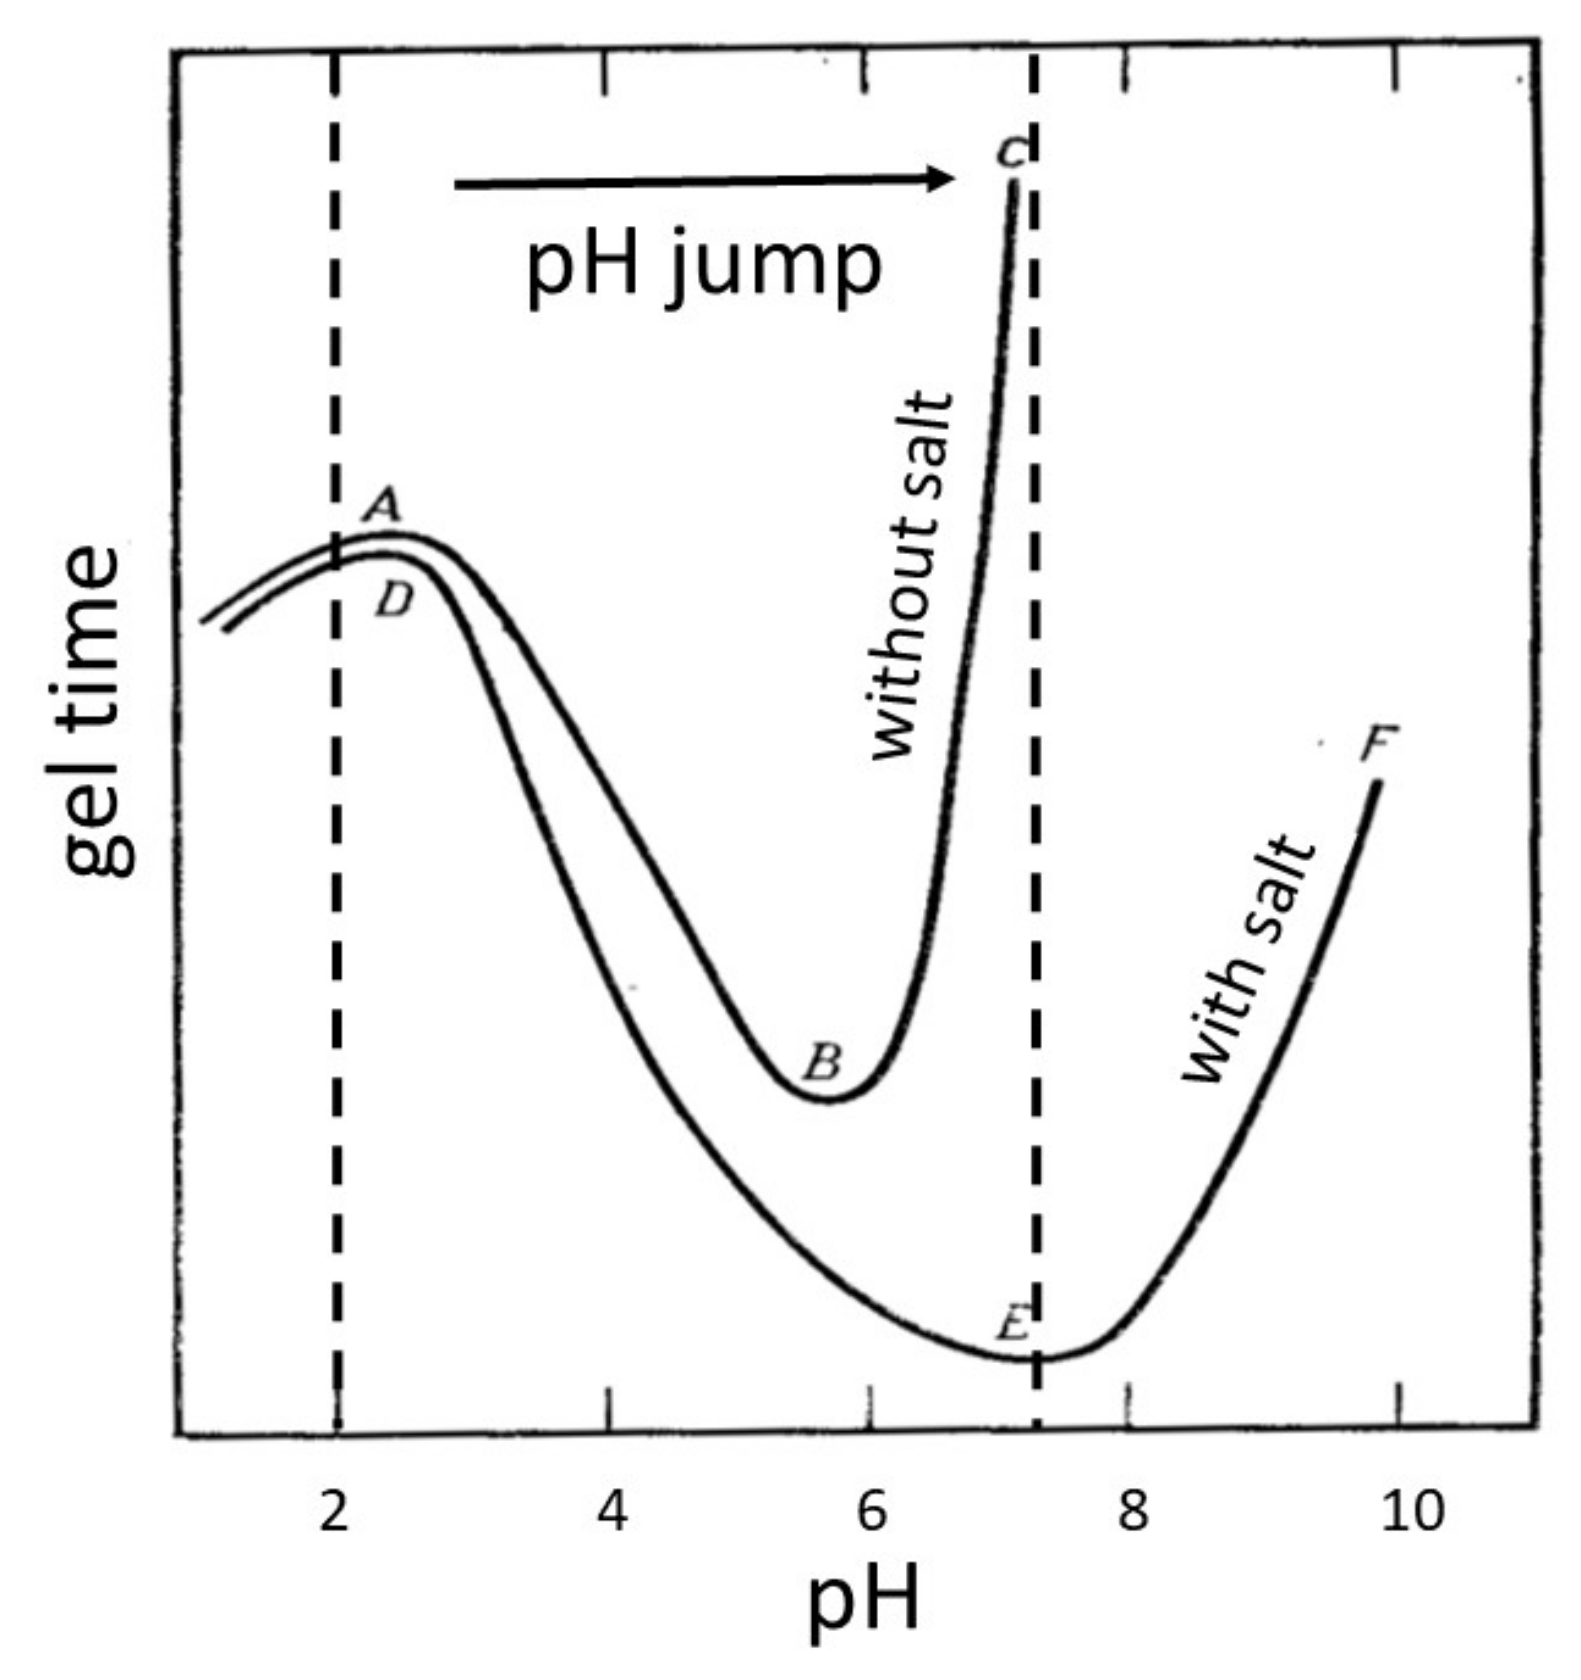
- The studies of the effect of KNO3 salt concentration have shown that the presence of salt in the medium of the studied composition is a necessary condition for coating formation. The investigations of the effect of the initial pH medium have demonstrated that for the coating to be formed, the pH jump at the cathode must provide a pH corresponding to the highest rate of gelation in the near-cathode volume (pH ≈ 7 under the studied conditions).
- An increase in the MR in the range from 50 to 300 leads to a decrease in the coating thickness. On the contrary, an increase in the alcohol concentration from 55 to 78% leads to its increase. In the alcohol concentration range from 40 to 55 vol.%, an increase in the concentration leads to an abnormal increase in the coating thickness; this fact does not fit with the classical concept and requires additional studies.
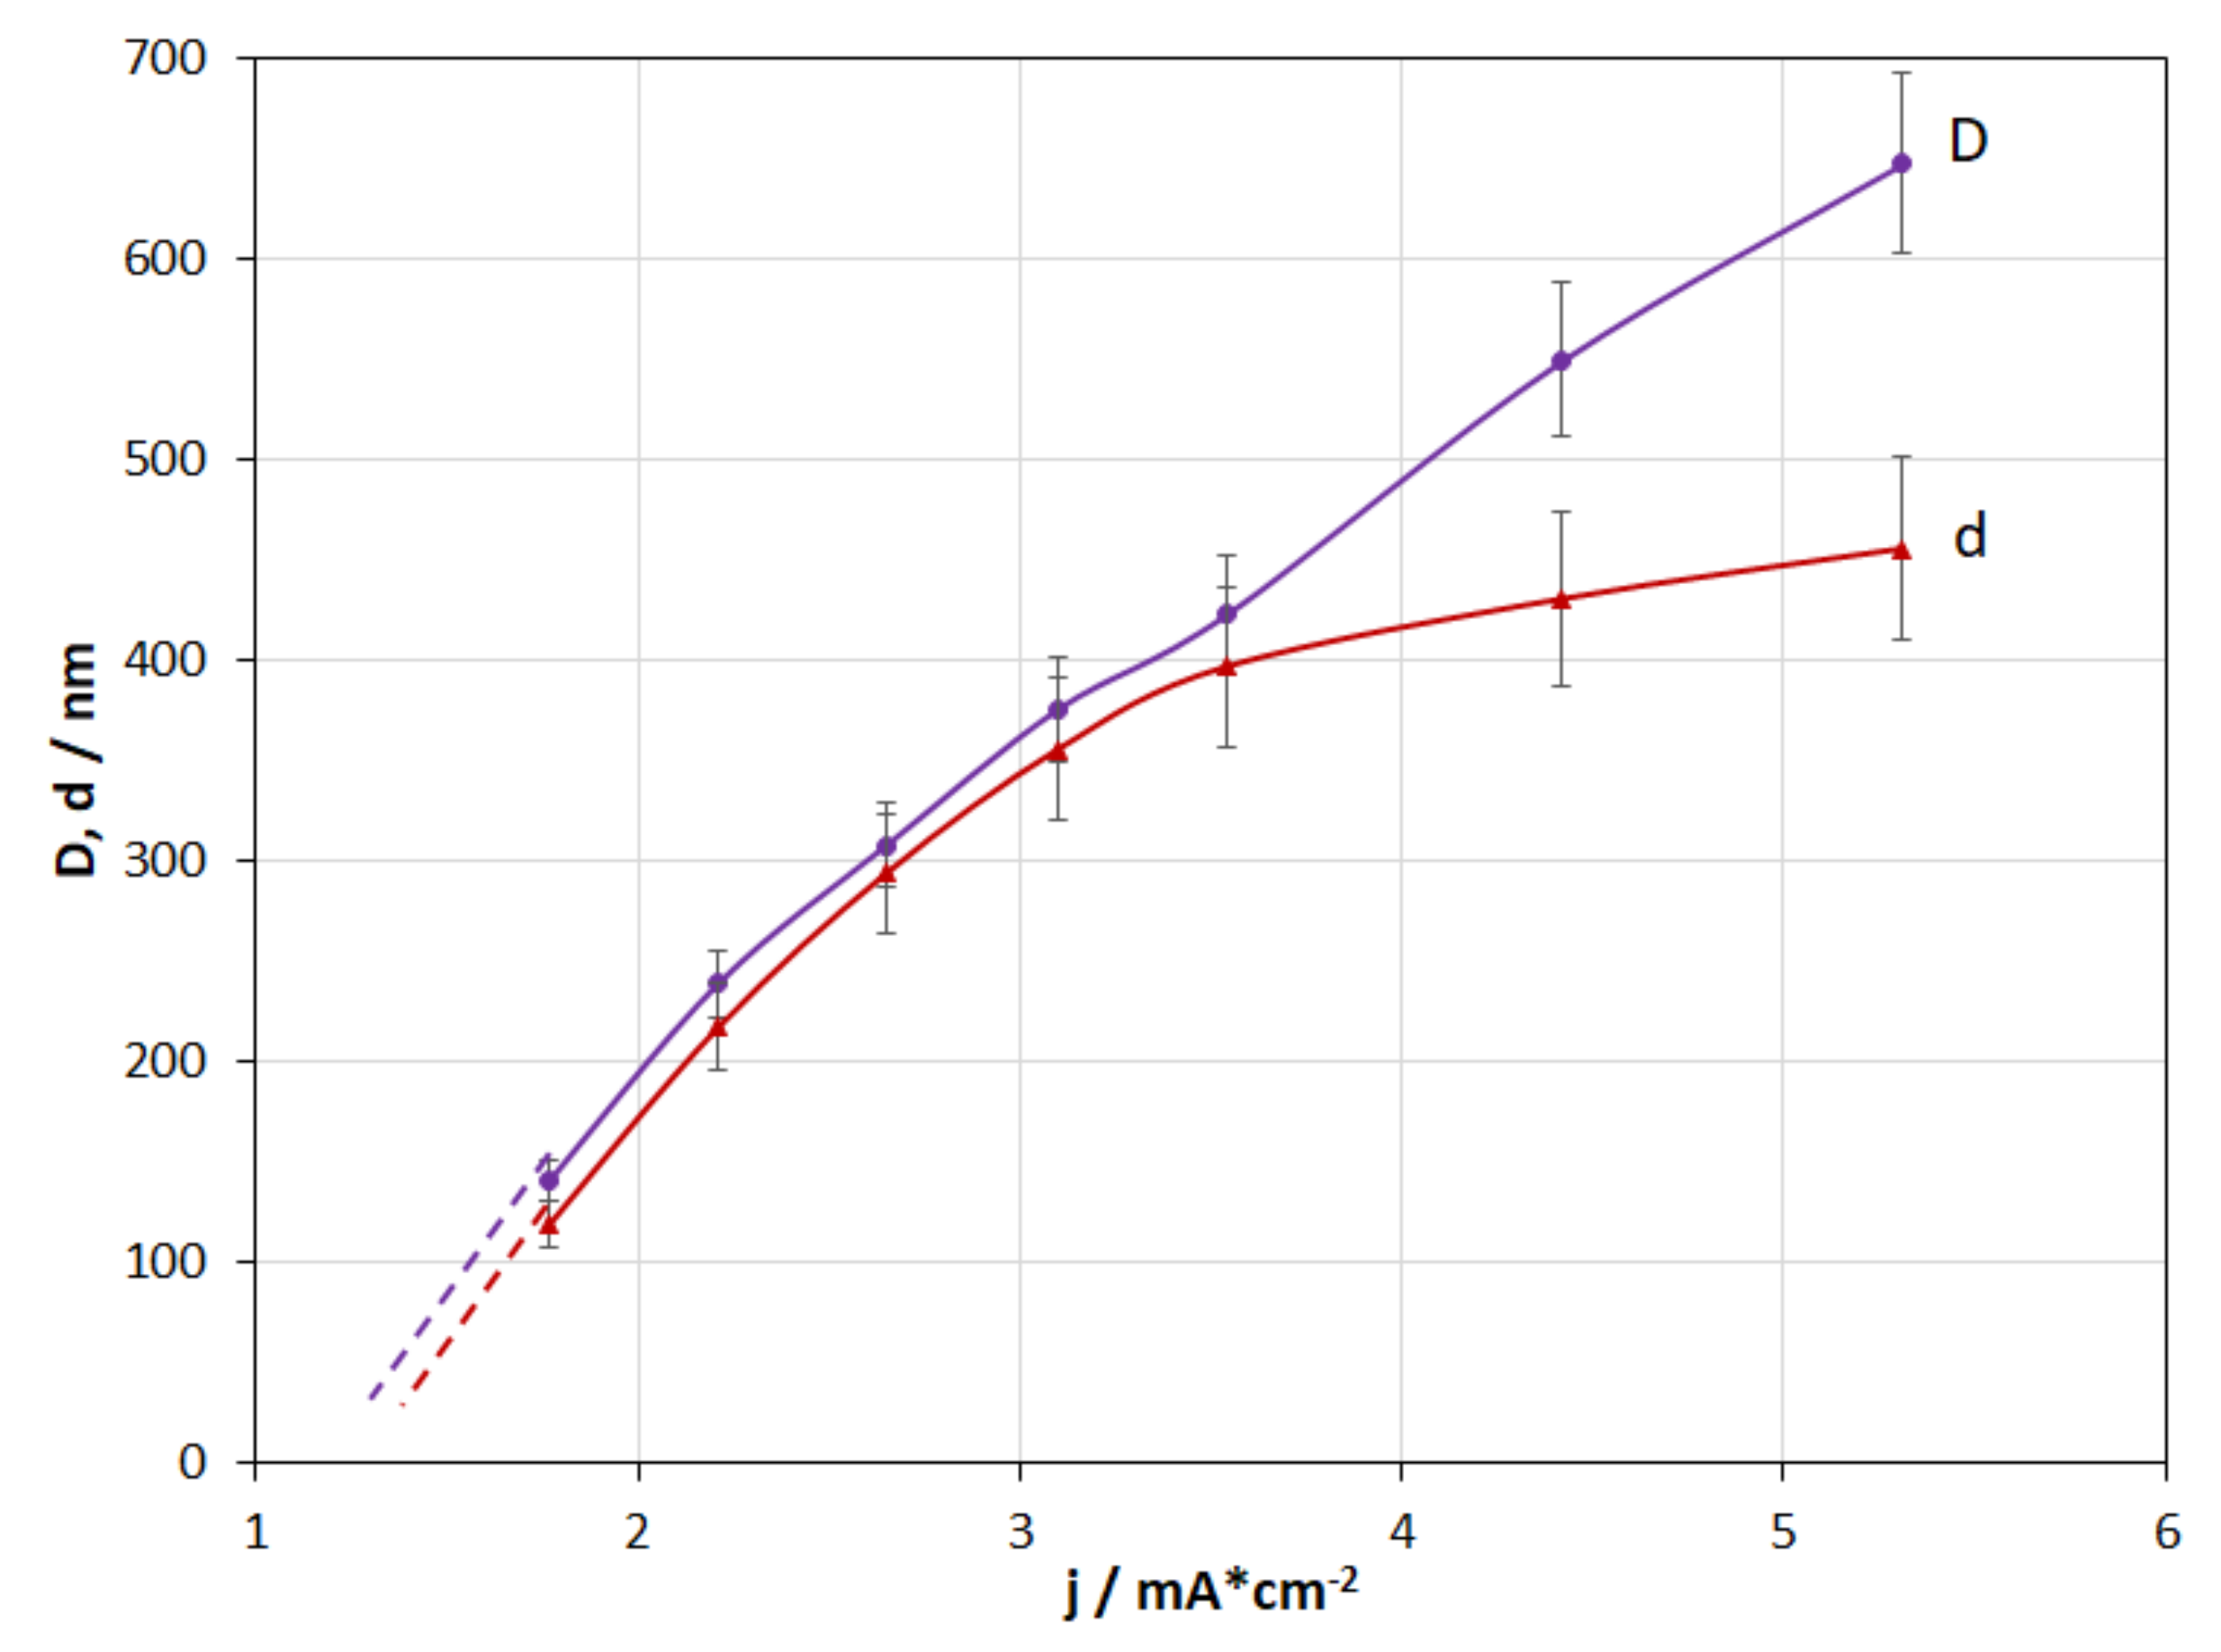
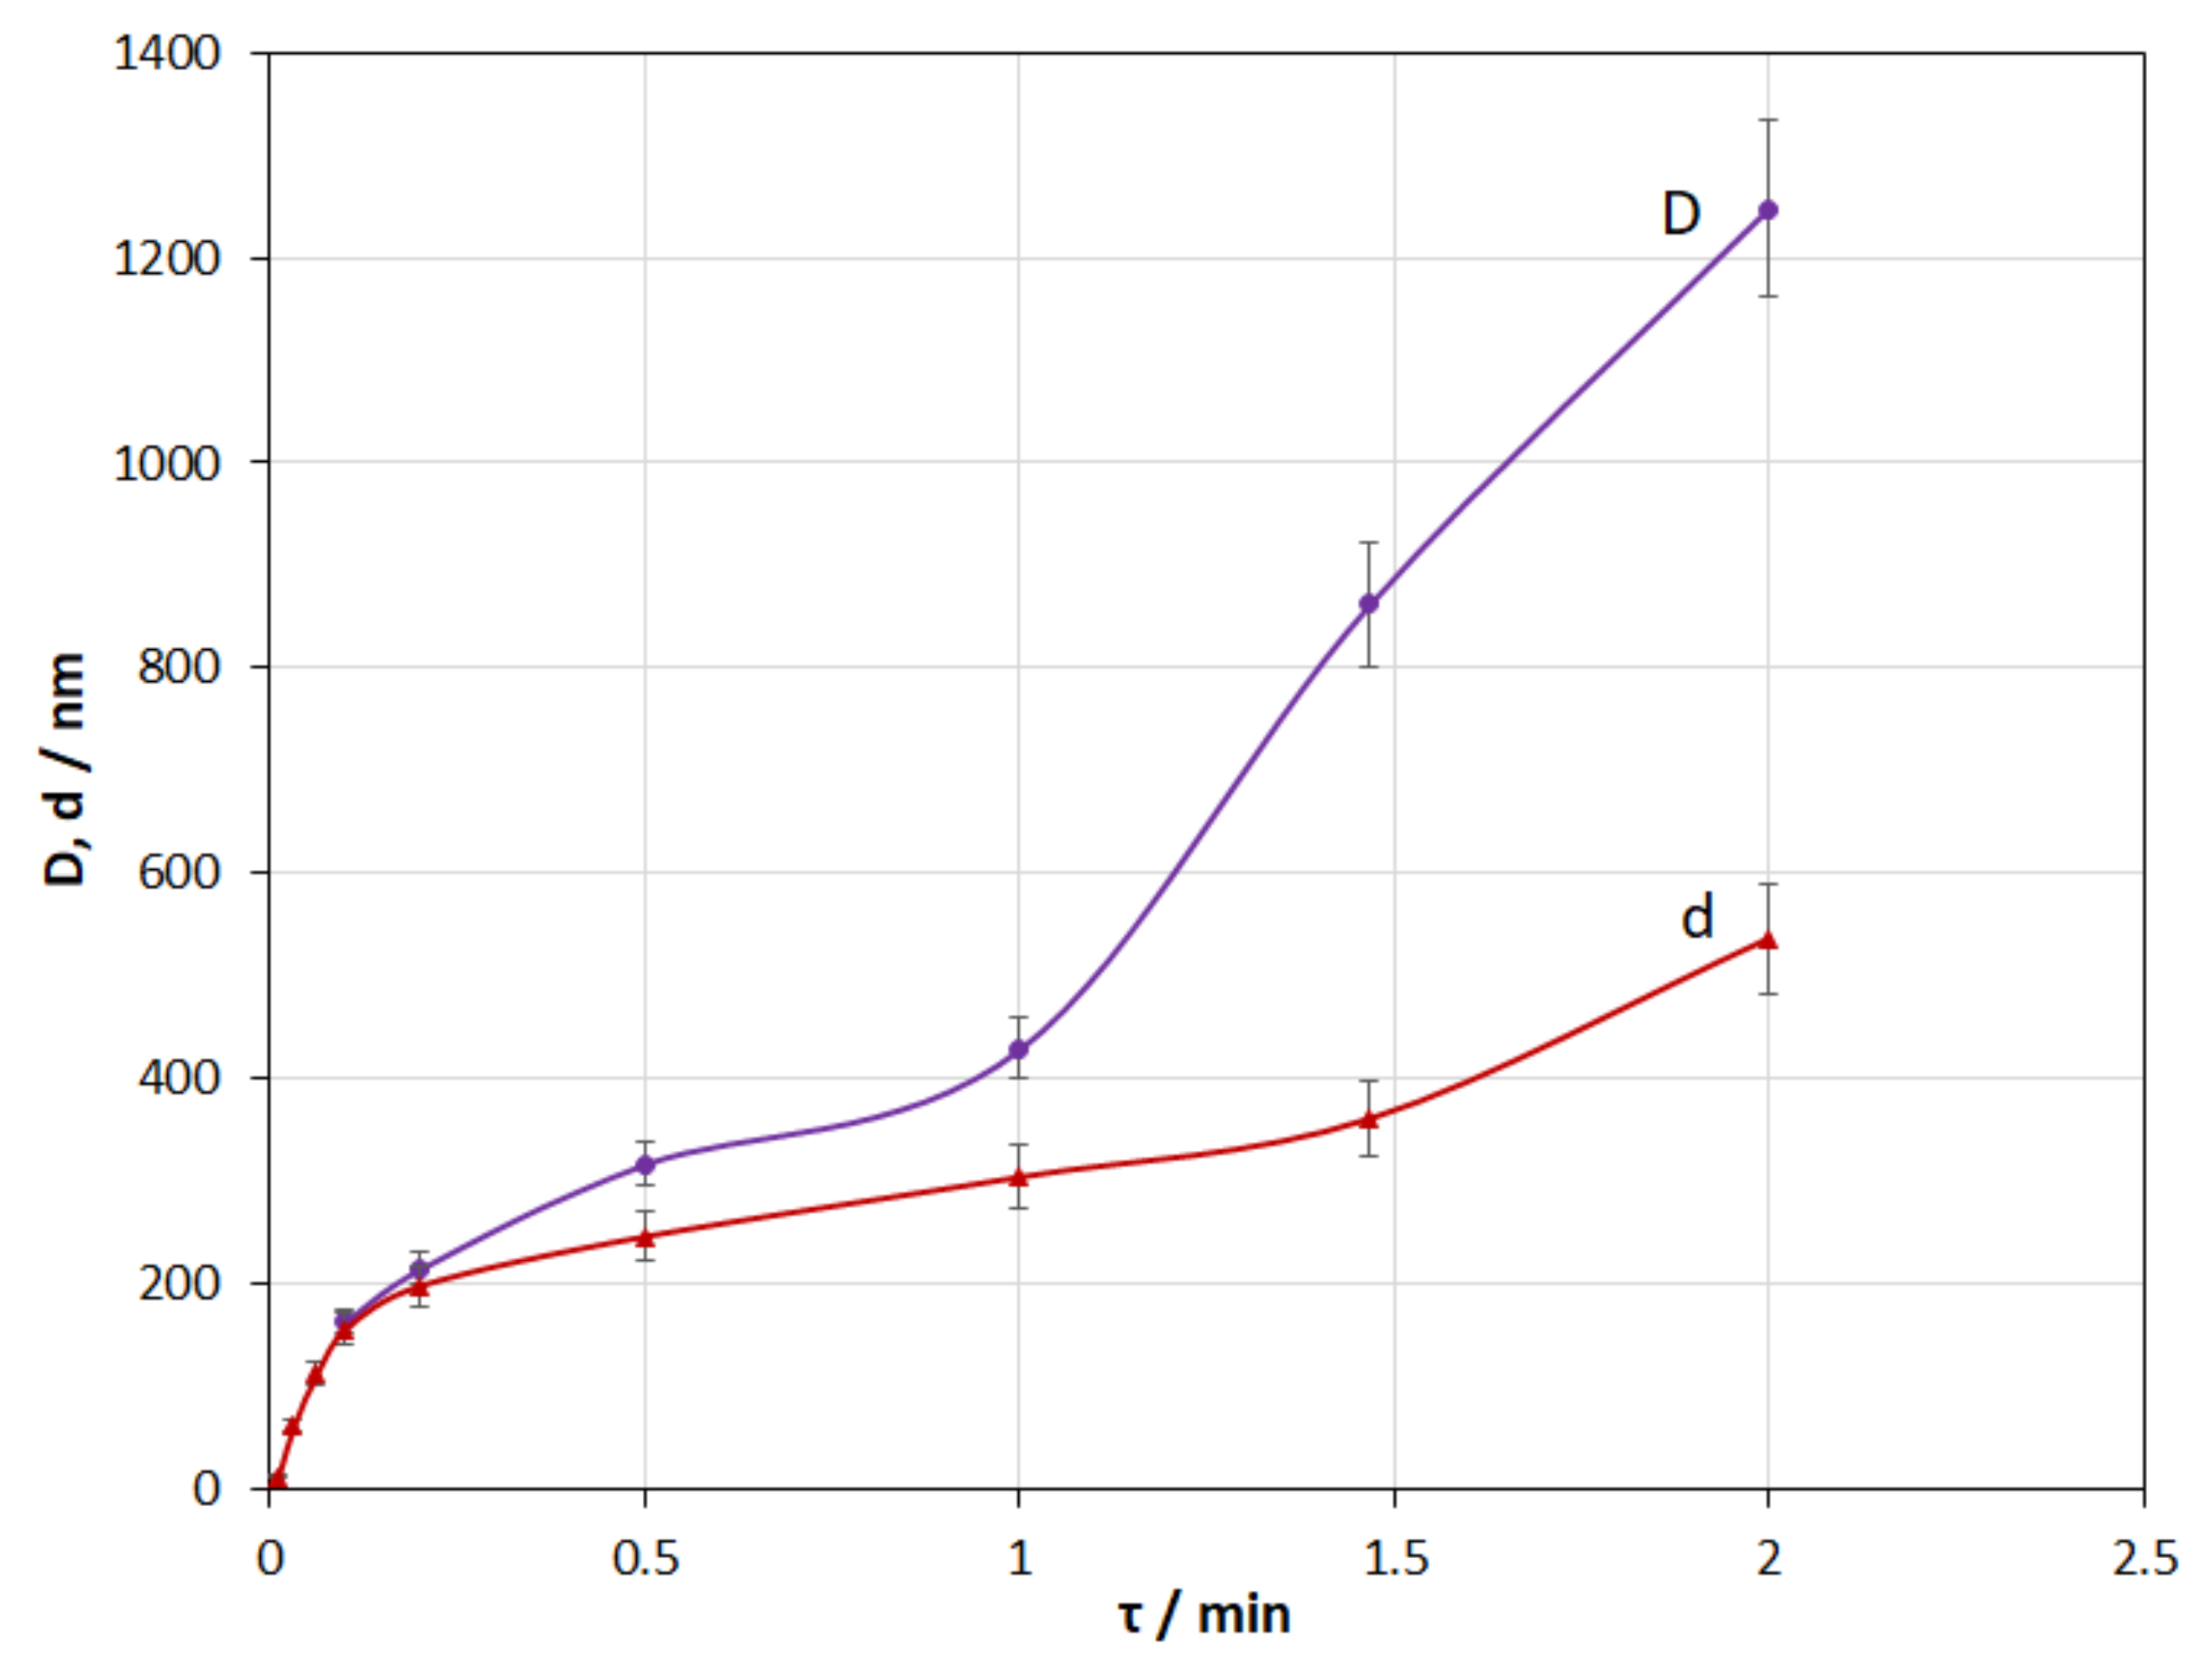
- The investigations of the current density effect and deposition time have shown that coating thickness directly depends on these parameters.
Author Contributions
Funding
Institutional Review Board Statement
Informed Consent Statement
Acknowledgments
Conflicts of Interest
References
- Sobczak, N.; Kudyba, A.; Siewiorek, A.; Homa, M.; Nowak, R.; Ruzda, G.; Sobczak, J.J.; Turalska, P.; Tchorz, A.; Andrzej, G.; et al. Textile Reinforced Carbon Fibre/Aluminium Matrix Composites for Lightweight Applications; Gude, M., Boczkowska, A., Eds.; Foundry Research Institute: Cracow, Poland, 2014; ISBN 9788388770975. [Google Scholar]
- Yu, J.K.; Li, H.L.; Shang, B.L. A functionally gradient coating on carbon fibre for C/Al composites. J. Mater. Sci. 1994, 29, 2641–2647. [Google Scholar] [CrossRef]
- Vidal-Sétif, M.H.; Lancin, M.; Marhic, C.; Valle, R.; Raviart, J.L.; Daux, J.C.; Rabinovitch, M. On the role of brittle interfacial phases on the mechanical properties of carbon fibre reinforced Al-based matrix composites. Mater. Sci. Eng. A 1999, 272, 321–333. [Google Scholar] [CrossRef]
- Huang, Y.; Ouyang, Q.; Zhang, D.; Zhu, J.; Li, R.; Yu, H. Carbon materials reinforced aluminum composites: A review. Acta Metall. Sin. 2014, 27, 775–786. [Google Scholar] [CrossRef]
- Tang, Y.; Deng, Y.; Zhang, K.; Liu, L.; Wu, Y.; Hu, W. Improvement of interface between Al and short carbon fibers by α-Al2O3 coatings deposited by sol-gel technology. Ceram. Int. 2008, 34, 1787–1790. [Google Scholar] [CrossRef]
- Zeng, Q. Fabrication of Al2O3-coated carbon fiber-reinforced Al-matrix composites. J. Appl. Polym. Sci. 1998, 70, 177–183. [Google Scholar] [CrossRef]
- Wang, X.; Huang, Z.X.; Yang, G.Y.; Song, J.Q. Preparation of the Anti-Oxidation SiO2 Coating on Carbon Fibers by Modified Sol-Gel Method. IOP Conf. Ser. Mater. Sci. Eng. 2018, 423, 012173. [Google Scholar] [CrossRef]
- Tselovalnikova, A.A.; Trubin, D.A.; Karandashev, A.N. Sol-gel synthesis of oxide protective coatings of carbon fibers to increase heat resistance in aggressive oxidizing environments. IOP Conf. Ser. Mater. Sci. Eng. 2019, 683, 012059. [Google Scholar] [CrossRef]
- Zhu, C.; Su, Y.; Zhang, D.; Ouyang, Q. Effect of Al2O3 coating thickness on microstructural characterization and mechanical properties of continuous carbon fiber reinforced aluminum matrix composites. Mater. Sci. Eng. A 2020, 793, 139839. [Google Scholar] [CrossRef]
- Heo, G.H.; Park, J.G.; Song, K.C.; Park, J.H.; Jun, H.M. Mechanical Properties of SiO2-Coated Carbon Fiber-Reinforced Mortar Composites with Different Fiber Lengths and Fiber Volume Fractions. Adv. Civ. Eng. 2020, 2020, 8881273. [Google Scholar] [CrossRef]
- Wu, L.K.; Liu, X.Y.; Hu, J.M. Electrodeposited SiO2 film: A promising interlayer of a highly active Ti electrode for the oxygen evolution reaction. J. Mater. Chem. A 2016, 4, 11949–11956. [Google Scholar] [CrossRef]
- Chigane, M.; Shinagawa, T. Titanium dioxide thin films prepared by electrolysis from aqueous solution of titanium-lactic acid complex for dye-sensitized solar cells. Thin Solid Film. 2012, 520, 3510–3514. [Google Scholar] [CrossRef]
- Chigane, M.; Shinagawa, T. Preparation of Thick Titanium Dioxide Films by Repeated Electrolysis-Calcination for Dye-Sensitized Solar Cells. J. Electrochem. Soc. 2014, 161, E40–E43. [Google Scholar] [CrossRef]
- Shacham, R.; Mandler, D.; Avnir, D. Pattern recognition in oxides thin-film electrodeposition: Printed circuits. Comptes Rendus Chim. 2010, 13, 237–241. [Google Scholar] [CrossRef]
- Sakka, S. Formation of Glass and Amorphous Oxide Fibers from Solution. MRS Proc. 1984, 32, 91. [Google Scholar] [CrossRef]
- Iler, R.K. Polymerization of silica. In The Chemistry of Silica: Solubility, Polymerization, Colloid and Surface Properties and Biochemistry of Silica; Wiley: New York, NY, USA, 1979; pp. 172–311. ISBN 978-0-471-02404-0. [Google Scholar]
- Iler, R.K. Colloidal silica-concentrated sols. In The Chemistry of Silica: Solubility, Polymerization, Colloid and Surface Properties and Biochemistry of Silica; Wiley: New York, NY, USA, 1979; p. 896. ISBN 978-0471024040. [Google Scholar]
- Metin, C.O.; Bonnecaze, R.T.; Lake, L.W.; Miranda, C.R.; Nguyen, Q.P. Aggregation kinetics and shear rheology of aqueous silica suspensions. Appl. Nanosci. 2014, 4, 169–178. [Google Scholar] [CrossRef]
- Hunt, J.; Ezzedine, S.; Bourcier, W.; Roberts, S. Silica gel behavior under different egs chemical and thermal conditions: An experimental study. In The Effects of Induced Hydraulic Fracturing on the Environment: Commercial Demands vs. Water, Wildlife, and Human Ecosystems; Matthew, M., Ed.; Apple Academic Press: New York, NY, USA, 2013; p. 16. ISBN 9780429069680. [Google Scholar]
- Trompette, J.L.; Meireles, M. Ion-specific effect on the gelation kinetics of concentrated colloidal silica suspensions. J. Colloid Interface Sci. 2003, 263, 522–527. [Google Scholar] [CrossRef]
- Vysotskii, Z.Z.; Strazhesko, D.N. Isoelectric State of Disperse Silicas and Ion Exchange in Acid Solutions. Adsorpt. Adsorbents 1973, 1, 55–71. [Google Scholar]


| CIPA, Vol.% | MR | Csalt, g/L | pH | J, mA/cm2 | τ, Min |
|---|---|---|---|---|---|
| 45 | 62 | 0–30 | 1.68 | 3.5 | 1 |
| CIPA, Vol.% | MR | Csalt, g/L | pH | J, mA/cm2 | τ, Min |
|---|---|---|---|---|---|
| 45 | 103 | 20 | 1.0–4.59 | 3.5 | 1 |
| CIPA, Vol.% | MR | Csalt, g/L | pH | J, mA/cm2 | τ, Min |
|---|---|---|---|---|---|
| 45 | 44–310 | 20 | 1.79 | 5.3 | 1 |
| CIPA, Vol.% | MR | Csalt, g/L | pH | J, mA/cm2 | τ, Min |
|---|---|---|---|---|---|
| 40–78 | 62 | 20 | 2.35 | 3.5 | 1 |
| CIPA, Vol.% | MR | Csalt, g/L | pH | J, mA/cm2 | τ, Min |
|---|---|---|---|---|---|
| 67 | 62 | 20 | 2.23 | 0.8–5.3 | 1 |
| CIPA, Vol.% | MR | Csalt, g/L | pH | J, mA/cm2 | τ, Min |
|---|---|---|---|---|---|
| 67 | 62 | 20 | 2.23 | 5.3 | 0.01–2 |
Publisher’s Note: MDPI stays neutral with regard to jurisdictional claims in published maps and institutional affiliations. |
© 2021 by the authors. Licensee MDPI, Basel, Switzerland. This article is an open access article distributed under the terms and conditions of the Creative Commons Attribution (CC BY) license (https://creativecommons.org/licenses/by/4.0/).
Share and Cite
Galyshev, S.; Postnova, E. Electrochemical Deposition of SiO2-Coatings on a Carbon Fiber. Fibers 2021, 9, 33. https://doi.org/10.3390/fib9050033
Galyshev S, Postnova E. Electrochemical Deposition of SiO2-Coatings on a Carbon Fiber. Fibers. 2021; 9(5):33. https://doi.org/10.3390/fib9050033
Chicago/Turabian StyleGalyshev, Sergei, and Evgeniya Postnova. 2021. "Electrochemical Deposition of SiO2-Coatings on a Carbon Fiber" Fibers 9, no. 5: 33. https://doi.org/10.3390/fib9050033
APA StyleGalyshev, S., & Postnova, E. (2021). Electrochemical Deposition of SiO2-Coatings on a Carbon Fiber. Fibers, 9(5), 33. https://doi.org/10.3390/fib9050033