Article

Combining Experimental Data with Statistical Methods to Evaluate Hydrolyzed Reactive Dye Removal by α-Fe2O3 in a Cellulose-Based Membrane

by
Mónica A. Silva
1,*,
Efres Belmonte-Reche
2 and
Maria T. P. de Amorim
1
1
Centre for Science and Textile Technology, University of Minho, Campus de Azurém, 4800-058 Guimarães, Portugal
2
Life Sciences Department, International Iberian Nanotechnology Laboratory, Av. Mestre José Veiga s/n, 4715-330 Braga, Portugal
*
Author to whom correspondence should be addressed.
Fibers 2021, 9(10), 61; https://doi.org/10.3390/fib9100061
Submission received: 8 August 2021 / Revised: 14 September 2021 / Accepted: 29 September 2021 / Published: 18 October 2021

Abstract

:
Water contaminated with toxic dyes poses serious problems for human health and environmental ecosystems. Unfixed reactive dyes and their hydrolyzed form are soluble in water, thus, their removal is particularly challenging. Among the different methodologies, adsorption is probably the most common since it is easy to handle and has a low cost. Here, the removal by adsorption of hydrolyzed Reactive Black 5 (hydRB5) from a model wastewater through cellulose acetate/hematite membranes (CA/α-Fe2O3), designated as M1, M2 and M3, was performed. The pristine cellulose acetate membrane (CA) was designated as M0. Toward understanding the adsorption mechanism of hydRB5 on membranes, the rate of adsorption and maximum value of the adsorption capacity were evaluated using kinetic and isothermal studies, respectively. The results showed that the adsorption mechanism follows pseudo-first-order kinetics, and data are best fitted by the Langmuir isotherm method with a maximum adsorption capacity of 105.26 mg g−1 in pH~7. Furthermore, these membranes can be also regenerated by washing with NaOH and NaCl solutions, and the regeneration efficiency remains effective over five cycles. To complete the work, two statistical models were applied, an Analysis of Variance (ANOVA) and a Response Surface Methodology (RSM). The optimum value found is located in the usable region, and the experimental validation shows good agreement between the predicted optimum values and the experimental data. These composite membranes are also good candidates for the adsorption of other pollutants, even at industrial scale, due to their effective regeneration process and low production costs.

1. Introduction

The textile industry is in between the most contaminating industries in the earth, as it involves high consumption of water and energy and uses a large number of compounds, of which paints and pigments are those with the greatest toxicity and persistence in wastewaters [1,2].
In the coloring process, and depending on the type of dye used, about 10−50% of the dye’s residual water is released into the environment, resulting in an increase in the chromaticity of polluted water and reducing the amount of incident light, which affects the ecological balance of water [3]. Dyes used in the coloring process are mostly synthetic dyes, classified into acid, reactive, direct, basic and azo dyes [4]. For example, it is known that reactive dyes are an important fraction of commercialized synthetic dyes, accounting for approximately 12% of world production, as mentioned by [5]. As the fixation efficiency of these dyes on strands are in a range of 60% to 90%, considerable quantities of the unfixed dyes can be found in wastewaters [4]. Consequently, the reactive dyes remaining in wastewaters are between 5 and 1500 mg L−1 [6], which are considered high values for the environment. In addition, due to their interaction with hydroxyl ions in the dyeing solution, these dyes are always disposed after the dyeing process in the hydrolyzed form, remaining in the effluents, thus hardly eliminated under aerobic conditions. Generally speaking, dye toxicity is independent of the dye itself, but highly dependent on its partial degradation products [7]. Thus, it is essential to take them out from the effluents to make a nontoxic release into rivers and seas.
One type of reactive diazo acid dye is Reactive Black 5 (RB5), whose partial degradation products are carcinogenic and mutagenic [8], requiring timely removal from wastewaters to minimize the consequences of their discharge into natural waters [9].
To date, a large number of conventional industrial processes have been used to eliminate dyes from wastewater, which includes electrolytic [10], oxidative [11], ionic exchange [12], biodegradative [13], photocatalytic [14], advanced oxidation [15] and adsorptive processes [16]. While chemical oxidation and biological degradation can decompose hydRB5, its degradation products are also confirmed to cause toxic and carcinogenic effects. Adsorption processes are considered very effective processes for the removal of several types of dissolved materials, including complete dye molecules, leaving no fragments in the effluent. Adsorption has low cost, can operate in a continuous or a batch mode, is easy to integrate with other conventional treatment processes and, at times, allows the regeneration and reuse of adsorbents [17]. However, the initial concentration of the dye, the amount of the adsorbent, the pH of the solution, the contact time and the temperature should be studied when evaluating adsorbents’ performance in the adsorption process.
Numerous adsorbents such as carbon materials, clays, polymers, active sludge and zeolites were prepared and functionalized to remove solutes from wastewater [18,19,20]. In general, these adsorbents should possess a high surface area and pore volume and low acid/base reactivity and thermal stability. These properties will make them suitable for the removal of a varied sort of dissolved pollutants in wastewater and air [21]. Nevertheless, reported adsorbents for hydrolyzed dyes removal in concrete hydrolyzed Reactive Black 5 (hydRB5) are quite limited in the literature; indeed, only one paper reported the adsorption of hydRB5 on a polyethylenimine–polyvinyl chloride composite fiber [22]. This gap in the literature justifies further work due to hydRB5’s toxicity in effluents. In the past, Silva et al. [23] reported that engineering materials processed through cellulose acetate (polymeric matrix) and iron oxide nanoparticles (inorganic nanoparticles) had porosities, hydrophilicities and surface charge densities superior to other adsorbents, as well as thermal stability, good optical properties and anti-(bio)fouling behaviors. Thus, these good physicochemical properties can be tested on the adsorption of charged pollutants (heavy metals and anionic dyes) and also in Advanced Oxidative Processes (AOPs). Therefore, the new composite membranes based on a low-cost polymer matrix with biodegradability and high surface area and inorganic paramagnetic nanoparticles with good optical properties are studied here to evaluate their adsorption efficiency in hydrolyzed RB5 at circumneutral pH. These materials may have comparatively lower adsorption capacities than other adsorbents, but they are cheaper, more ecological and have good recyclability, being a substitute in the removal of other pollutants and also degradation by AOPs.
From our previous studies about the removal of methylene blue (MB) from cellulose acetate/multi-walled carbon nanotubes (CA/MWCNTs) [24], it was observed that CA membranes modified with 5% (w/w) of multi-walled carbon nanotubes (MWCNTs) had an adsorption capacity in MB of 65.5%, while the pristine membrane (CA) presented an adsorption capacity of 15.0% after 60 min time and pH~7. The results were explained by the physicochemical properties of the nanocomposites when related to the CA membrane. Other authors also used cellulose-derived adsorbents and obtained excellent results in terms of the unfixed dye removal efficiency. Ali et al. [25] prepared cellulose acetate (CA) nanofibers by electrospinning and modified the surface with polyaniline/β-cyclodextrin (PANI/β-CD). Adsorption capacities for MB of 100%, 97.11%, 95.03% and 93.45% were obtained in seawater, industrialized wastewater, public wastewater and drinking water, respectively. Despite the easy recovery and recycling of the material from the treated water, its production proved to be poorly reproducible. Khan et al. [26] prepared cellulose acetate (CA) polymer sheets with 2%, 5% and 10% ZnAl grafted onto activated carbon (CA-ZA2, CA-ZA5, CA-ZA10) to then modify them with Ni particles. The materials exhibited a high catalytic effect on the reduction and of nitrophenols but a tedious synthetic procedure. Parsaeian et al. [27] mixed chitosan with functionalized magnetic nanoparticles (FMNPs) and produced a new magnetic polymeric nanocomposite (MPNC), which obtained an optimum adsorption capacity for RB5 of 163.93 mg g−1; though; its usefulness for reuse is not known.
Although the previous adsorbents mentioned [25,26,27] have shown good rejection capacity, they generally suffer from some disadvantages such as complex processing steps, low reproducibility and high cost-effectiveness. Thus, materials based on CA and obtained by the acetylation of cellulose, which is achieved from raw materials, seem to be a simple alternative to other adsorbent materials as they are highly accessible, easy to handle/process and are efficiently functionalized by NPs [22,23,28].
Combining experimental studies with statistical methods is common practice since it helps to reduce the number of experiments needed to reach optimal experimental conditions for the high performance of adsorbents. Askari et al. [29] used the Response Surface Methodology (RSM, Box-Behnken project) for an experimental project where it was investigated the effect of process conditions on the removal efficacy of methylene blue, dispersed red 73 and acid blue 25 by nanofiltration through a membrane, varying the operating pressure (0.5–1.1 MPa), the pH (3–10) and also the initial concentration (40–180 mg L−1). According to their results, it was observed that pH had the greatest significant effect on dispersed red 73 and acid blue removal efficiency owing to the repulsive electrostatic forces and membrane intumescence, while the concentration had the greatest significant effect on methylene blue removal due to the screen effect. Baneshi et al. [30] reported the optimization and modeling by RSM of mixed matrix membranes, P84 polyimide incorporated with metallic organic structures based on cadmium (MOF-Cd), for the high flow of simultaneous dyes and its rejection, revealing a good correlation between the membranes’ performance and their different physicochemical properties. Pooralhossini et al. [31] used an Artificial Neural Network (ANN) and RSM for modeling the removal of sunset yellow (SY) and disulfine blue (DB) with nanoparticles of tin oxide loaded onto activated carbon and showed that the ANN was much more precise in the modeling analysis when compared to RSM.
As already mentioned, there is great interest in removing unfixed dyes from wastewater due to its harmful effects on humans and environmental ecosystems, but it is even more important to remove the hydrolyzed products of the dyes, as they are the most abundant form of reactive dyes in effluents. Among them is hydRB5, whose effluent removal has been neglected despite its adverse effects. Here, the effects of pH, the contact time and the initial concentration of hydRB5 on the batch adsorption by CA/α-Fe2O3 membranes are evaluated, and the synergism between experimental and statistical results, something that has not been approached so far for these adsorbent–adsorbate systems, is described. The pseudo-first-order (PFO) model is the greatest mathematical model to fit adsorption’s kinetic data. The Langmuir equilibrium isotherm was chosen as the mathematical model to analyze the adsorption equilibrium data. The recyclability with NaOH and NaCl solutions on M2 membrane over five cycles is also demonstrated. Additionally, Analysis of Variance (ANOVA) is used to adjust non-linear models and investigate the significance of the parameters pH, initial dye concentration and contact time in the response (adsorption capacity), and Response Surface Methodology (RSM) is used to find the optimal conditions to increase the membrane performance.

2. Materials and Methods

The previously prepared nanocomposite membranes were used in adsorption studies and characterized in terms of morphology, optical properties, porosity, hydrophobicity, zeta potential, crystallinity, magnetic and antimicrobial properties [23]. M0 refers to the pristine membrane CA. M1 is the CA membrane modified with hematite NPs with estimated size was of 37.1 nm (NPs005 precursors had a size of 32.0 nm). M2 is the CA membrane modified with hematite NPs with estimated size of 35.6 nm (NPs01 precursors had a size of 38.3 nm). M3 is the CA membrane modified with hematite NPs with estimated size of 49.7 nm (NPs02 precursors had a size of 39.0 nm). The percentage by weight (%, w/w) of NPs in the CA matrix was 5% (w/w). Higher values of NPs were avoided to prevent cluster formation. The introduction of hematite NPs in CA demonstrated the cooperation between the structure of membranes and their physicochemical properties, which influenced the performance of membranes.

2.1. Materials

The reagent reactive black 5 (RB5) was acquired from Sigma-Aldrich Korea Ltd. The characteristics of RB5 are C.I. number 20505, empirical formula C26H21N5Na4O19S6, MW = 991.82, dye content 55% and absorption at λmax = 597 nm. All other reagents used in this study were of analytical grade and purchased from local chemical suppliers.

2.2. Dye Hydrolysis

HydRB5 was prepared using a method previously described with some upgrades [22]. An amount of approximatively 5 g of dye was solubilized in 1 L of 0.1 M aqueous NaOH solution to obtain 5 g L−1 of RB5 at pH = 11. The alkaline RB5 solution was immersed in a water bath at 90 °C for 5 h to produce complete dye hydrolysis. After this time, the solution pH was adjusted to circumneutral pH (pH~7). The obtained solution of hydRB5 was kept under dark conditions and in the refrigerator. It was diluted whenever necessary for the adsorption experiments. Some properties of hydRB5 are given in Table 1.

2.3. Adsorption Experiments for hydRB5

All sorption tests were carried out in conical flasks of 100 mL containing 50 mL of the hydRB5 solutions, agitated at a speed of 150 rpm. The batch experiments were done under different experimental factors such as the solution pH, the contact time and the dye concentration. Herein, HCl or NaOH solutions were useful for the initial pH adjustments, aliquots of the reaction solutions were taken from each flask, periodically, and then the residual dye content was determined using UV–Vis spectroscopy.
pH’s effect on the adsorption capacity of membranes was assessed with 50 mL of hydRB5 with an initial concentration of 100 mg L−1 (considering the optimal concentration). The solutions’ pH, which ranged between 2 and 11, were adjusted with the help of 36 g L−1 HCl or 40 g L−1 NaOH, which were added slowly to the respective flasks, and controlled by a pH meter (pH meter/ISE Thermo Orion Dual Star, Thermo Scientific Orion, Alvarado, TX, USA). After pH adjustments, ~0.025 g of each membrane (M0, M1, M2 and M3) was added to the flasks at 25 ± 0.5 °C. Residual dye concentration in the solution was measured every 10 min until the equilibrium was reached and the maximum adsorption capacity was obtained. This concentration was evaluated by measuring the absorbance at 597 nm, with an UV–Vis spectrophotometer (UV–2600, Shimadzu Europa GmbH, Duisburg, Germany). Calibration curves between absorbance and dye concentration in the solution were plotted but are not shown here. The adsorption capacity of the membranes, qt (mg g−1), at time t (min), was calculated from Equation (1):
q t = ( C 0 C t ) m × V
where C0 and Ct (mg L−1) are the dye concentrations in the liquid phase at the initial time (t = 0) and at any time t, respectively. V (L) is the volume of the solution, and m (g) is the weight of the adsorbent.
The contact time and the initial dye concentration’ effects on the adsorption capacity of each membrane were evaluated using 50 mL of hydRB5 at concentrations of 40, 60, 80 and 100 mg L−1, in pH~7 and 25 ± 0.5 °C, mixed with ~0.025 g of each membrane. Solution aliquots were taken periodically and the residual concentrations in solution of hydRB5 were obtained from the analysis of their UV–Vis spectra at 597 nm. The adsorption capacity (qt, mg g−1) was calculated from Equation (1). From the membrane adsorption capacity, three conventional kinetic models were applied, specifically the pseudo-first-order (PFO), the pseudo-second-order (PSO) and the intraparticle diffusion (IPD) mathematical models. This information on batch adsorption is used for future designing and establishment of industrial adsorption processes in real applications.
In addition to that, analysis of adsorption equilibrium data was made since it is also a critical point in designing adsorption systems. The adsorption experiments under batch equilibrium were carried out by mixing 50 mL of hydRB5 and a dye initial concentration ranging between 10 and 150 mg L−1. An amount of ~0.025 g of each membrane was added to dye solutions in pH~7 and 25 ± 0.5 °C. The equilibrium concentration was experimentally determined by monitoring the adsorbed amounts of hydRB5 by UV–Vis at 597 nm, until the difference between the two consecutive readings was smaller than the absolute error of the spectrophotometer (0.003 AU). The adsorption capacity values in the equilibrium, qe (mg g−1), were determined according to Equation (2):
q e = ( C 0 C e ) m × V
where C0 and Ce (mg L−1) are the dye concentrations in the liquid phase at the initial time (t = 0) and at equilibrium, respectively, V (L) is the volume of the solution and m (g) is the weight of the adsorbent. The experiments were adjusted to the Langmuir, Freundlich and Temkin isotherms. The data are summarized in the results section.

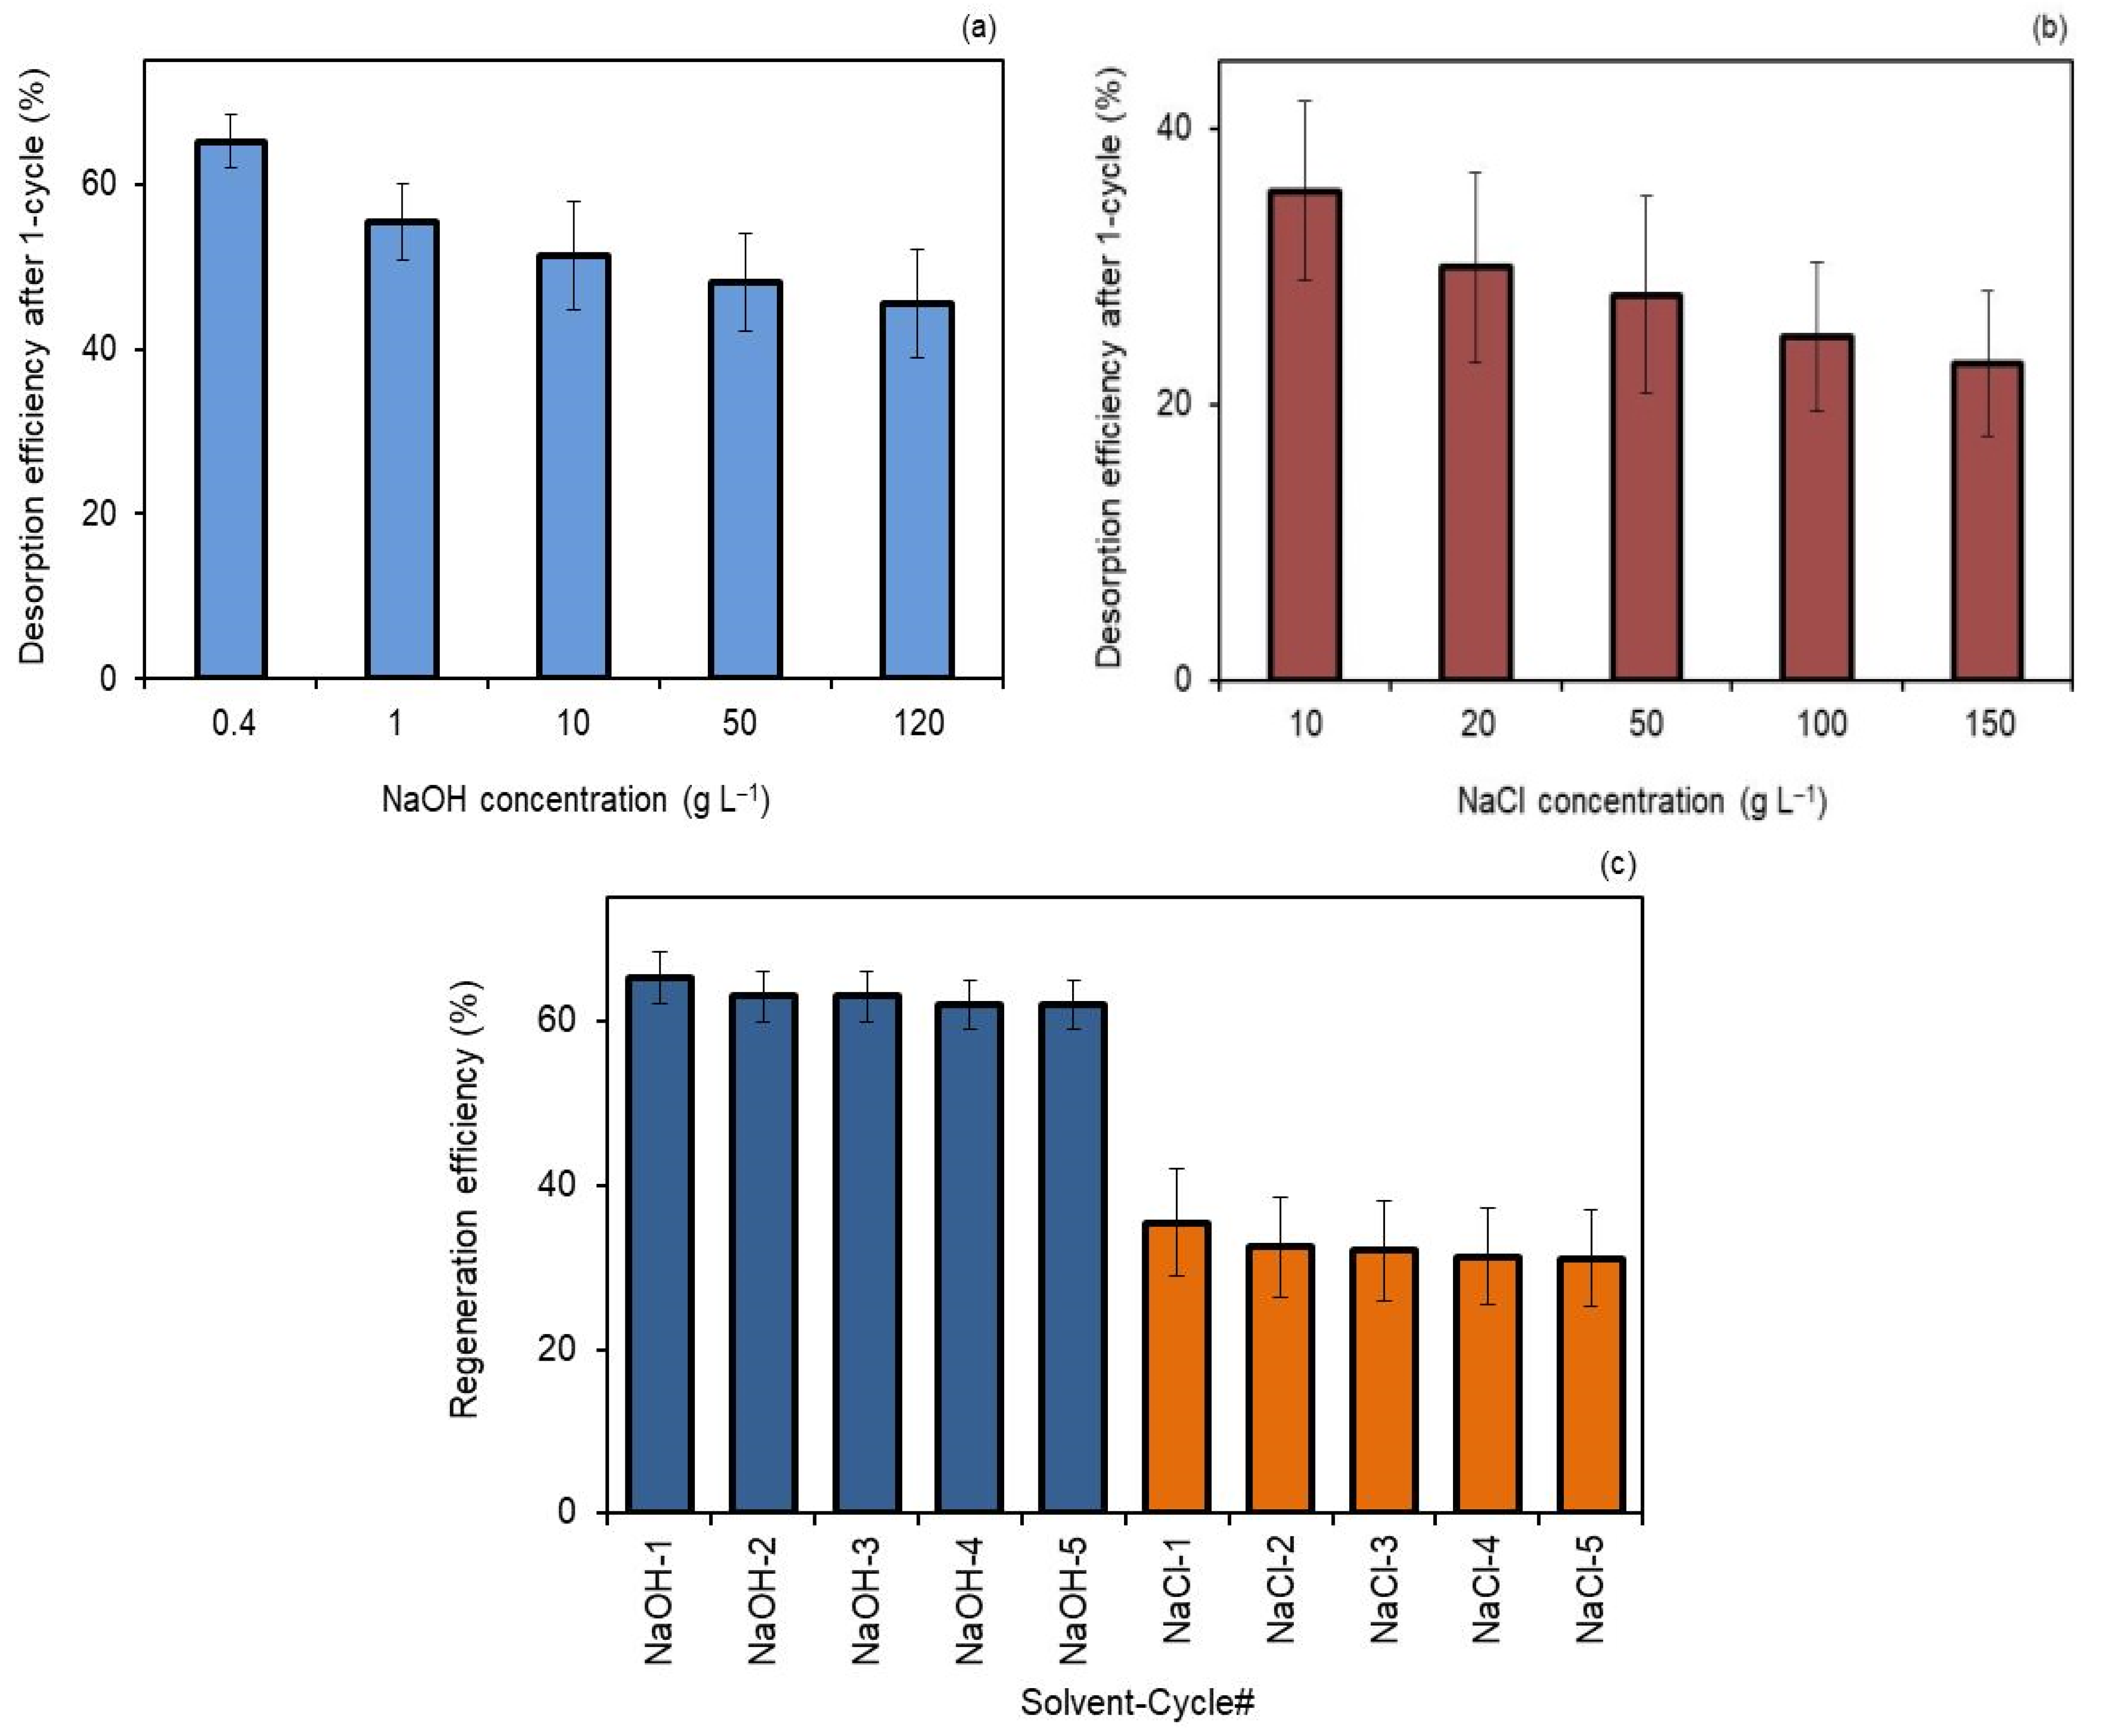
2.4. Recyclability of a Membrane for hydRB5 Adsorption

NaCl (10–150 g L−1) and NaOH (0.4–120 g L−1) aqueous solutions were prepared and used for the desorption experiments.
First, the adsorption on the membrane was obtained by mixing 50 mL of hydRB5 at 100 mg L−1, in pH~7 and 25 ± 0.5 °C, with an amount of ~0.025 g of the membrane and left under stirring for enough time to ensure that the difference between two consecutive readings was less than the absolute error of the spectrophotometer (0.003 AU). After adsorption, the hydRB5 residual concentration in the solution was separated from the membrane and then the membrane was resuspended in 50 mL of aqueous NaCl and NaOH solutions. The suspensions were under stirring at 150 rpm for 24 h, to allow dye to release from the membrane. In the end, the concentration of the desorbed dye was evaluated by UV–Vis at 597 nm, and desorption efficiency was calculated from Equation (3):
d e s o r p t i o n e f f i c i e n c y ( % ) = C d ( C 0 C t ) × 100
where the concentration of desorbed hydRB5 in the solution is defined as Cd (mg L−1).
The regenerated adsorbent was dried with cellulose filter paper and weighed to assess whether any change in adsorbent weight was observed.
After the first desorption test for all solutions of NaCl and NaOH, the suitable solution for each was used in consecutive cycles of adsorption to measure the regeneration efficiency.

2.5. Experimental Design, Statistical Analysis and Mathematical Modeling

Design of Experiments (DoE) is a systematic methodology that aims to explain the variation of the dependent variable/response (the dye adsorption capacity on the membrane) through the careful selection, study and expansion of the model’s independent variables (pH, contact time and dye concentration). Thus, we studied the response (dye adsorption on each membrane after 120 min) in function of five pH values and four dye concentrations according to Table 2. The equilibrium time was considered at 120 min.
Within DoE, analysis of variance (ANOVA) was used to adjust a quadratic model (nonlinear), where the parameters evaluated were significant (p ≥ 0.05). The models obtained for each of the membranes were compared to each other, and their suitability was determined using the determination coefficient (R2) and the determination adjusted coefficient (Radj2). The comparison was made with the predicted coefficient of determination (Rpred2), the standard deviation (Std. Dev.) and the sum of squares of the predicted residual error (PRESS). One-way ANOVA and pairwise comparisons were also used to elucidate the significance of each factor, except time, in the response. The time-response dependence was studied using another non-linear modeling.
In addition, the Response Surface Methodology (RSM), which uses a sequence of planned experiments to obtain an estimate of the expected optimal response, was also explored. This methodology has the benefits of orthogonality, rotation and uniformity. Quantitative variables were used to adjust predictors’ first or second-order functions to the response variable, and then examine its characteristics to decide on the validity and usefulness of the model obtained.
R version 4.0.3 [32] and Rstudio version 1.3.1093 [33] were used for statistical analysis and mathematical modeling. The nonlinear log-logistic model was fitted using the drc R package [34]. The plots were made using the R packages ggplot2 [35], plotly [36], cowplot [37] and ggtext [38].

3. Results and Discussion

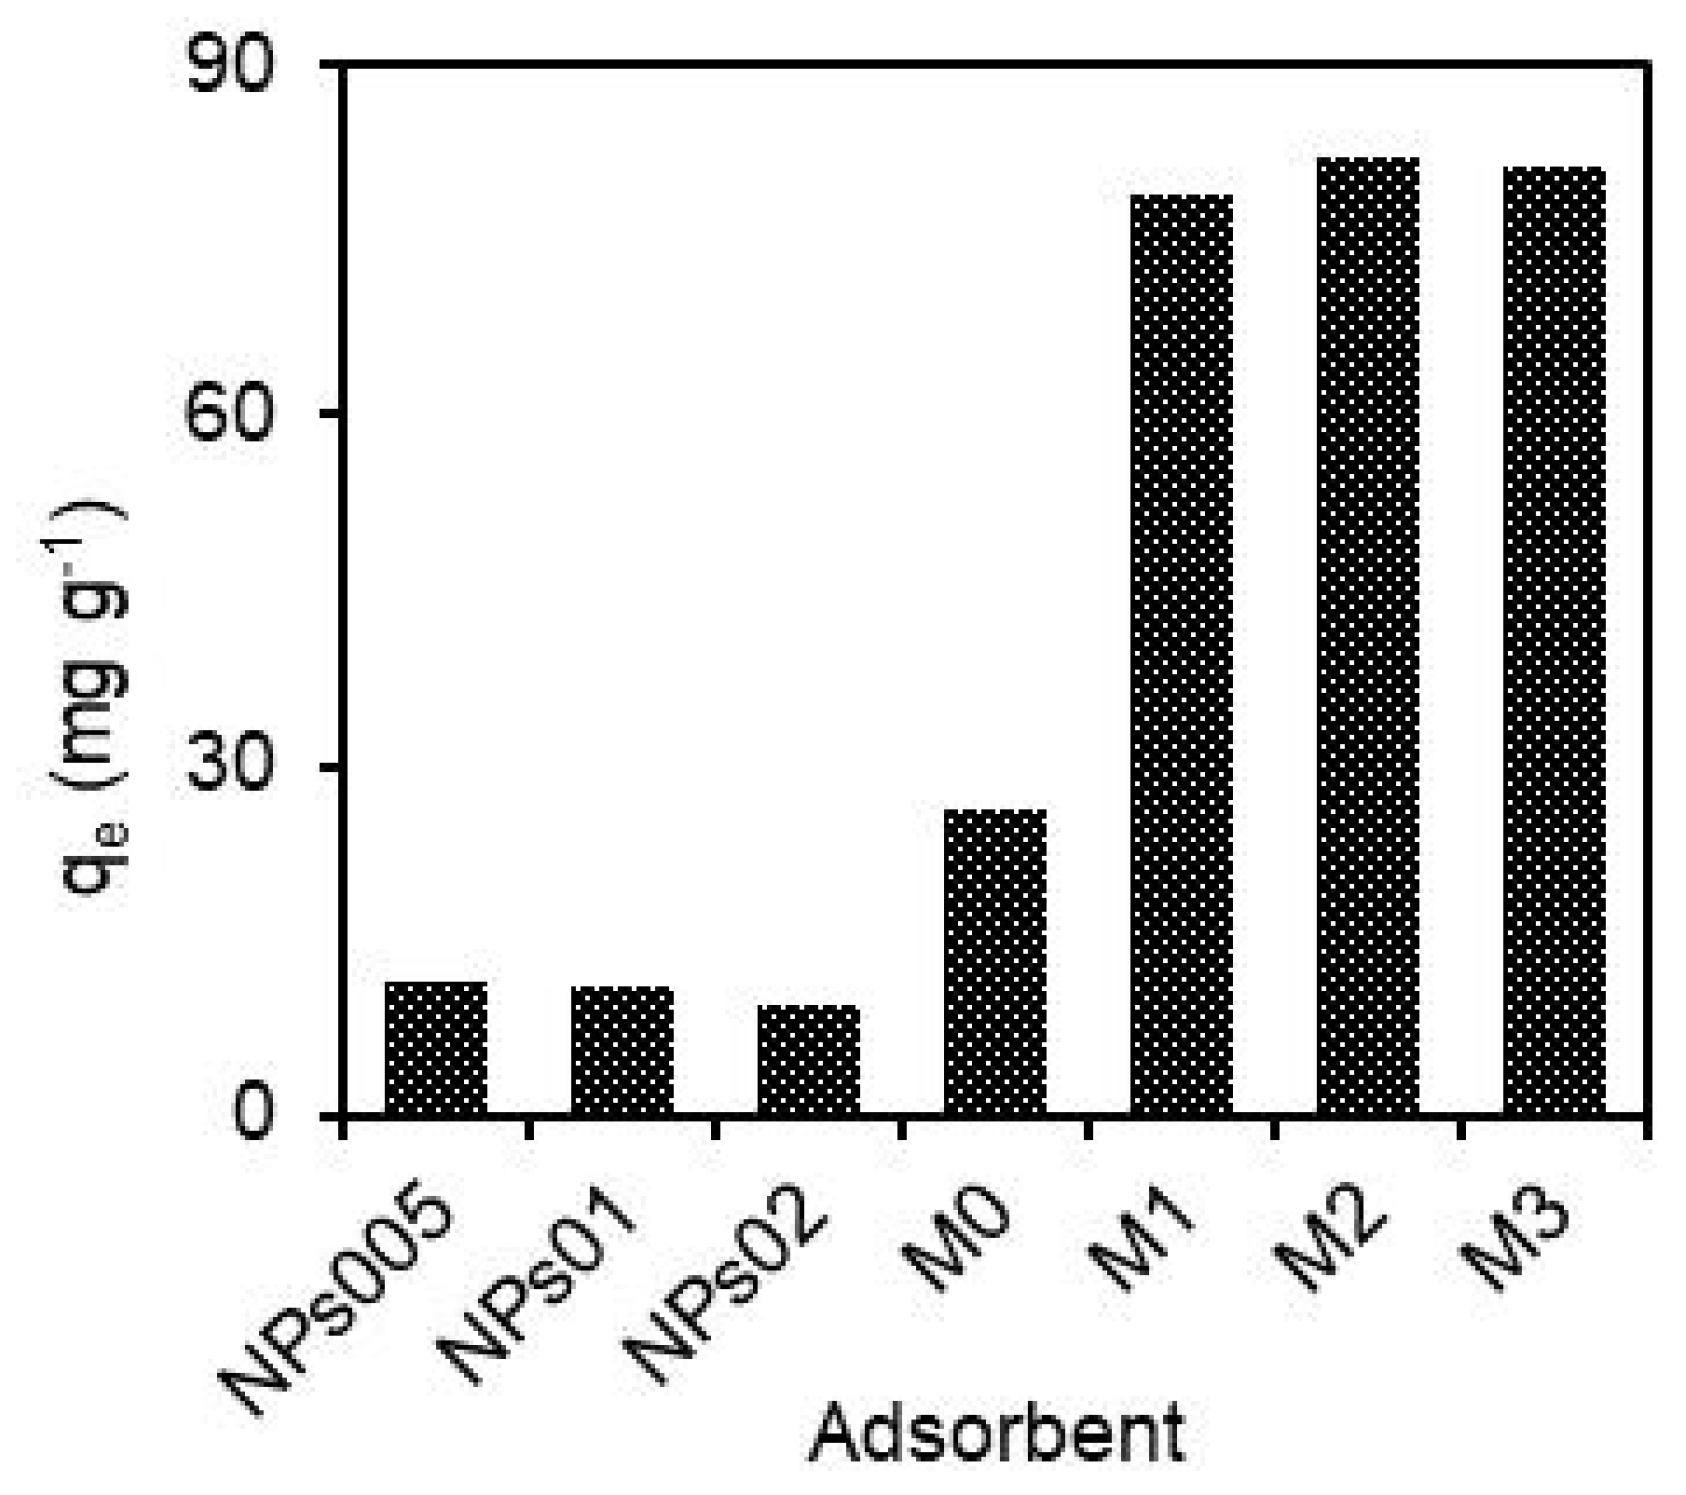
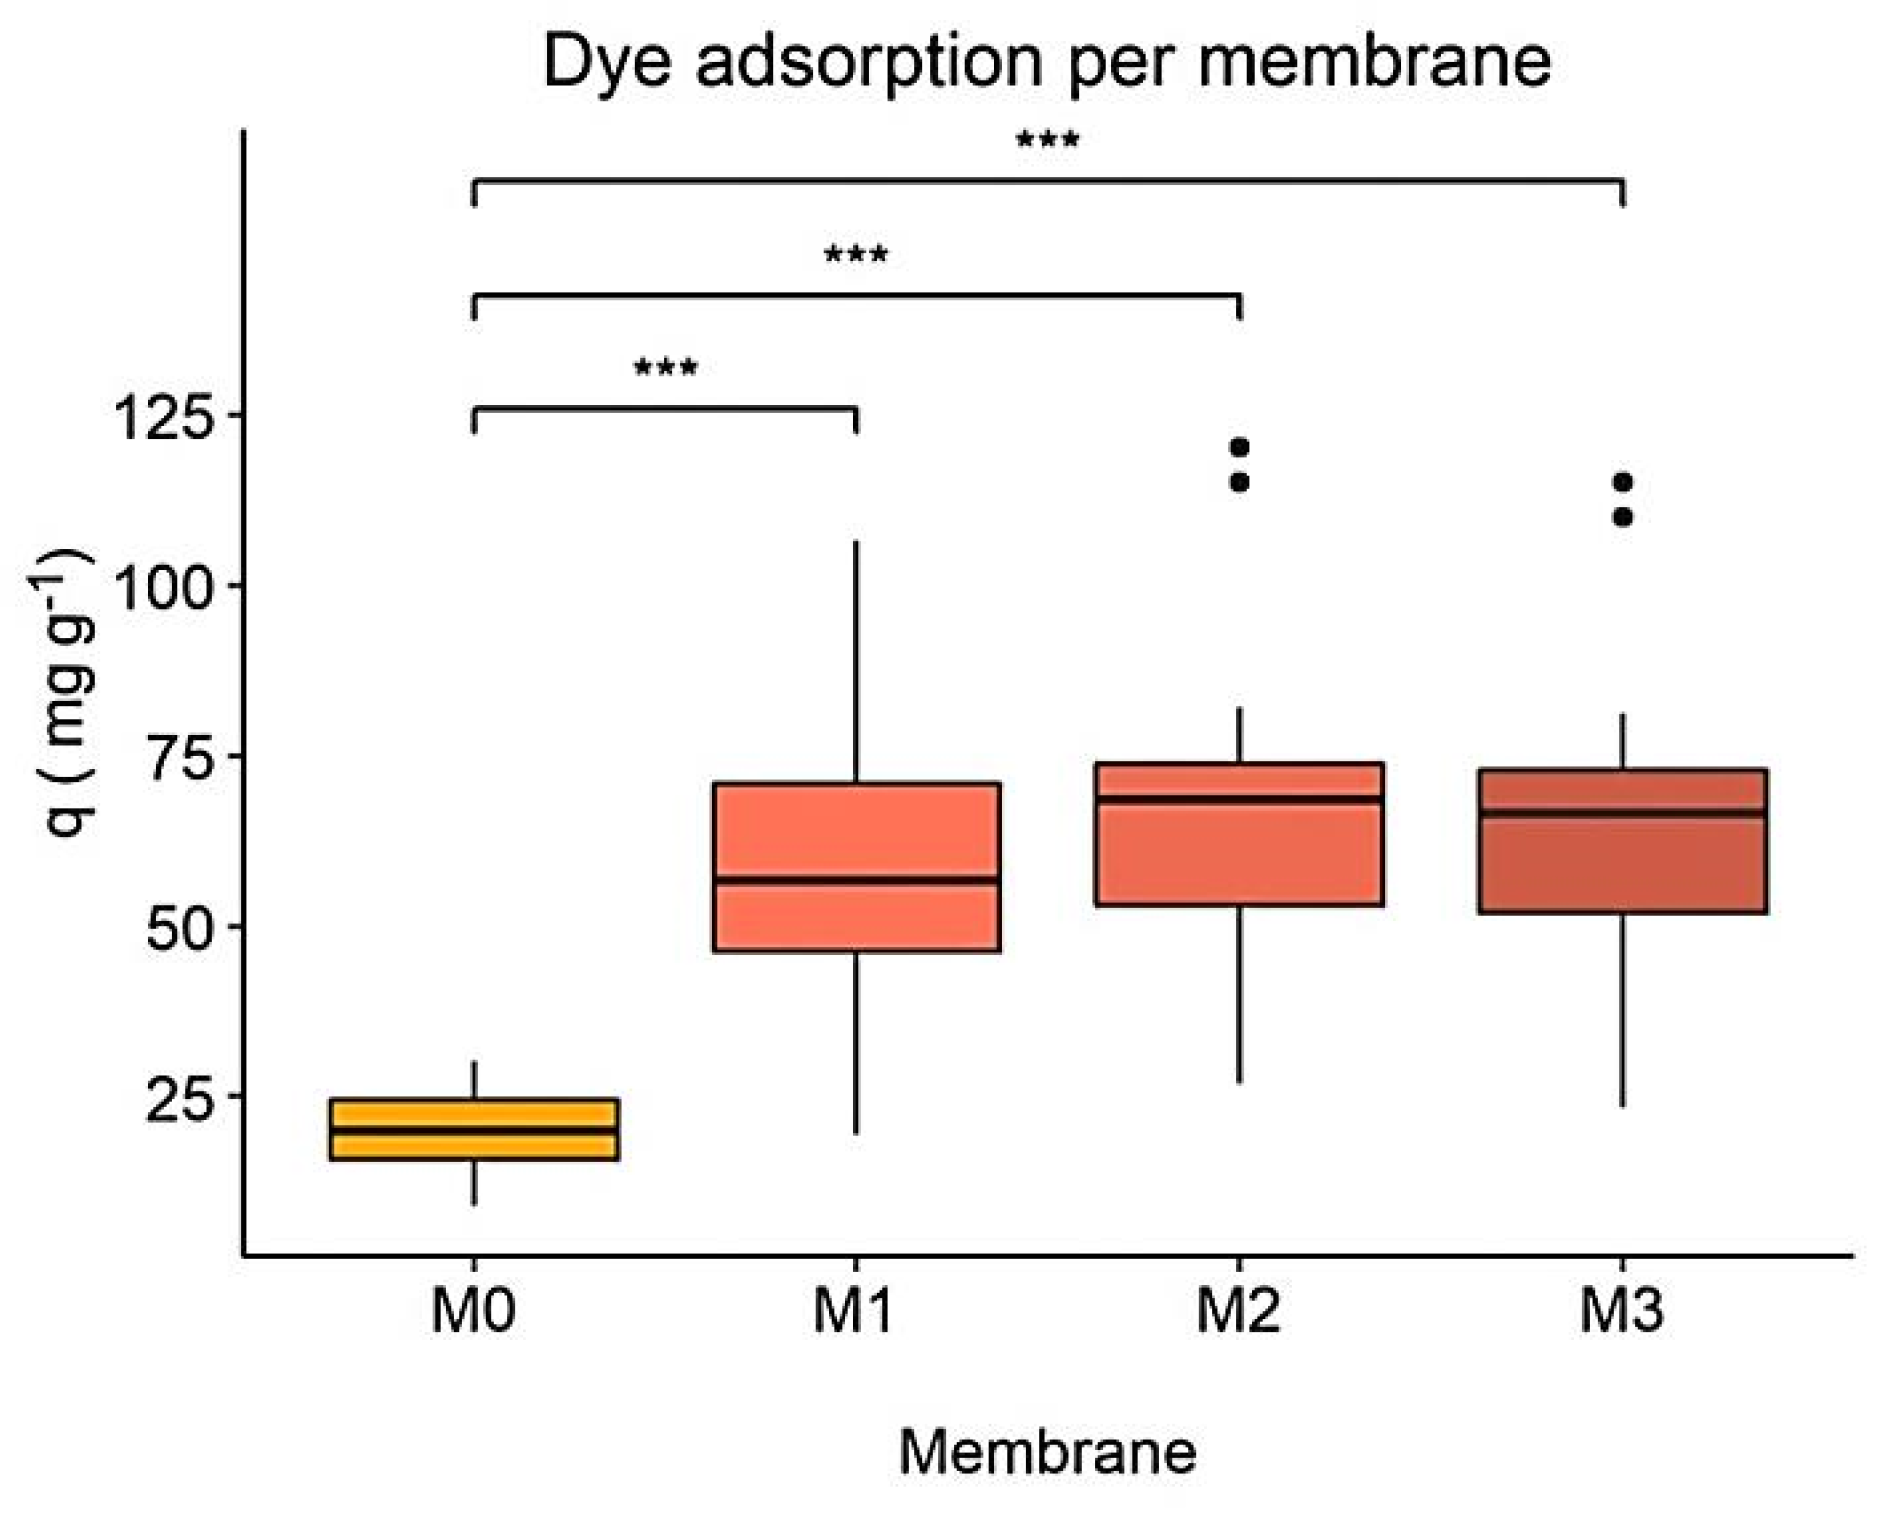
3.1. Comparison of hydRB5 Adsorption on Different Membranes

The studies of hydRB5 removal were made through different materials (NPs and membranes) to reach a conclusion about the most efficient adsorbent.
To know the adsorption capacity of each one, the performance of each adsorbent in hydRB5 removal was estimated under the same experimental conditions. Figure 1 shows that the adsorption capacities achieved by M0 and NPs were markedly inferior than those of the prepared composites. The hydRB5 adsorption capacities of NPs005, NPs01, NPs02 and M0 were 11.5, 10.8, 9.5 and 26 mg g−1, respectively. However, higher capacities (79.0, 82.0 and 81.2 mg g−1) were obtained when M1, M2 and M3 were applied as adsorbents, respectively. CA was superior to the hematite NPs, which can be attributed to the larger pore size in comparison to NPs. On the other hand, the composites were superior to both CA and NPs. The probable reason for this occurrence is related to the incorporation of NPs in CA membranes that provided more accessible reactive surface sites for contaminant adsorption and, therefore, improved its adsorption capacity. This improvement reveals the important effect of pore size, particle size and accessible reactive sites in the adsorption capacity of membranes. Furthermore, a synergistic effect between hematite NPs and the CA membrane in the removal of hydRB5 was verified. This effect was also evaluated using the dye removal efficiencies achieved by the composite, CA and NPs using an “enhancement factor”, R, according to Equation (4). When the combined effect found in composite membranes is equal to some of the individual effects in NPs or the CA membrane, an additive effect occurs, and R is equal to 1. For R > 1.0, a synergistic effect is assumed, thus the combined effect is much greater than the sum of all the individual effects. When the combined effect is poorer than the sum of the individual effects, then R is <1.0, which is called “antagonism” [39]. Here, the values of R were 2.11, 2.23 and 2.29 for M1, M2 and M3, respectively, which evidences an important synergistic effect due to the incorporation of NPs in CA that give additional sorption reactive sites for hydRB5 removal. The composite membranes were selected as the best adsorbents to continue experiments of hydRB5 adsorption optimization. Equation (4) is calculated as follows:
R = C d y e r e m o v e d b y c o m p o s i t e m e m b r a n e s ( C d y e r e m o v e d b y C A + C d y e r e m o v e d b y N P s )
As observed in Figure 1, the value of the adsorption capacity in composites was better than the resultant amounts in individual CA and NPs. The values of hydRB5 adsorption capacity on the studied adsorbents follows the order M2 > M3 > M1 > M0 > NP005 > NPs01 > NPs02. This means that the adsorption capability of as-prepared composites was greater than that of all other adsorbents. It also suggests that the pore size and availability of reactive groups on adsorbents are very important factors affecting hydRB5 removal, and that the adsorption capability of CA enhanced effectively after the loading of hematite NPs. Finally, the adsorption capacities of the membranes were subjected to the available hydRB5 ions to reactive adsorption sites in the adsorbents that depend on the molecular size of adsorbents [39].

3.2. pH’s Effect on the Adsorption Capacity of Membranes

pH is one of the factors that has a greater effect on the adsorption capacity of adsorbents, as it modifies the charge of adsorbent surface and also dye molecules, as well as the availability of functional groups (reactive sites) of adsorbents. Very low and very high pH values are not suitable for industrial processes due to the high amounts of HCl and NaOH required, respectively, which increases processing costs and reduces the possibility of recycling the adsorbent due to the low chemical resistance of most adsorbents (except for ceramic matrices) to extreme pH values. Data acquired for adsorption capacity on membranes as a function of pH are shown in Figure 2.
As seen from Figure 2, the solution pH is an important factor in the adsorption of hydRB5 in the nanocomposite membranes. The adsorption capacity was lower at pH = 11 and reached maximum adsorption at pH = 2. As shown by Silva et al. [23] the zero charge point (pHpzc) for nanocomposite membranes varies between 5 and 6. Therefore, the adsorption must be higher at pH < pHpzc and lower at pH > pHpzc. This means that the surface charge on the membranes was negative at pH > pHpzc, and as the pH increased to more basic values, the negative charge on the surface also increased due to the adsorbed OH groups. As a result, a lower adsorption capacity was observed in the membranes under alkaline conditions, since a greater number of negative charges exists on the membrane surface, implying a greater electrostatic repulsion between the adsorbent and the anionic dye molecules [40]. Thus, we can conclude that acidic conditions are the most favorable for the adsorption of hydRB5 in the nanocomposite membranes because there is an attraction between the charge on the surface of the adsorbent and the anionic dye. However, the adsorption capacity at circumneutral pH is still good.
Furthermore, it is observed in Figure 2 that there was a marginal variation in the dye removal capacity between the M1, M2 and M3 membranes, due to the small pHpzc variation between them, suggesting a similar surface charge density [23]. However, the nanocomposite membrane that presented the highest adsorption capacity compared to the pristine membrane (M0) was M2. M2 was the membrane which showed a greater increase in porosity and hydrophilicity, and a greater decrease in crystallinity, with the integration of hematite nanoparticles in the CA matrix [23]. The results about the effect of pH on unfixed dye adsorption have been discussed [27,41].
Although the maximum dye removal occurred at pH = 2, the following adsorption studies were conducted at circumneutral pH, pH~7.0, to avoid adjustments in the solution pH value, which increases the treatment cost and reduces random errors in adsorbed amounts by the addition of acids or bases to dye solutions.

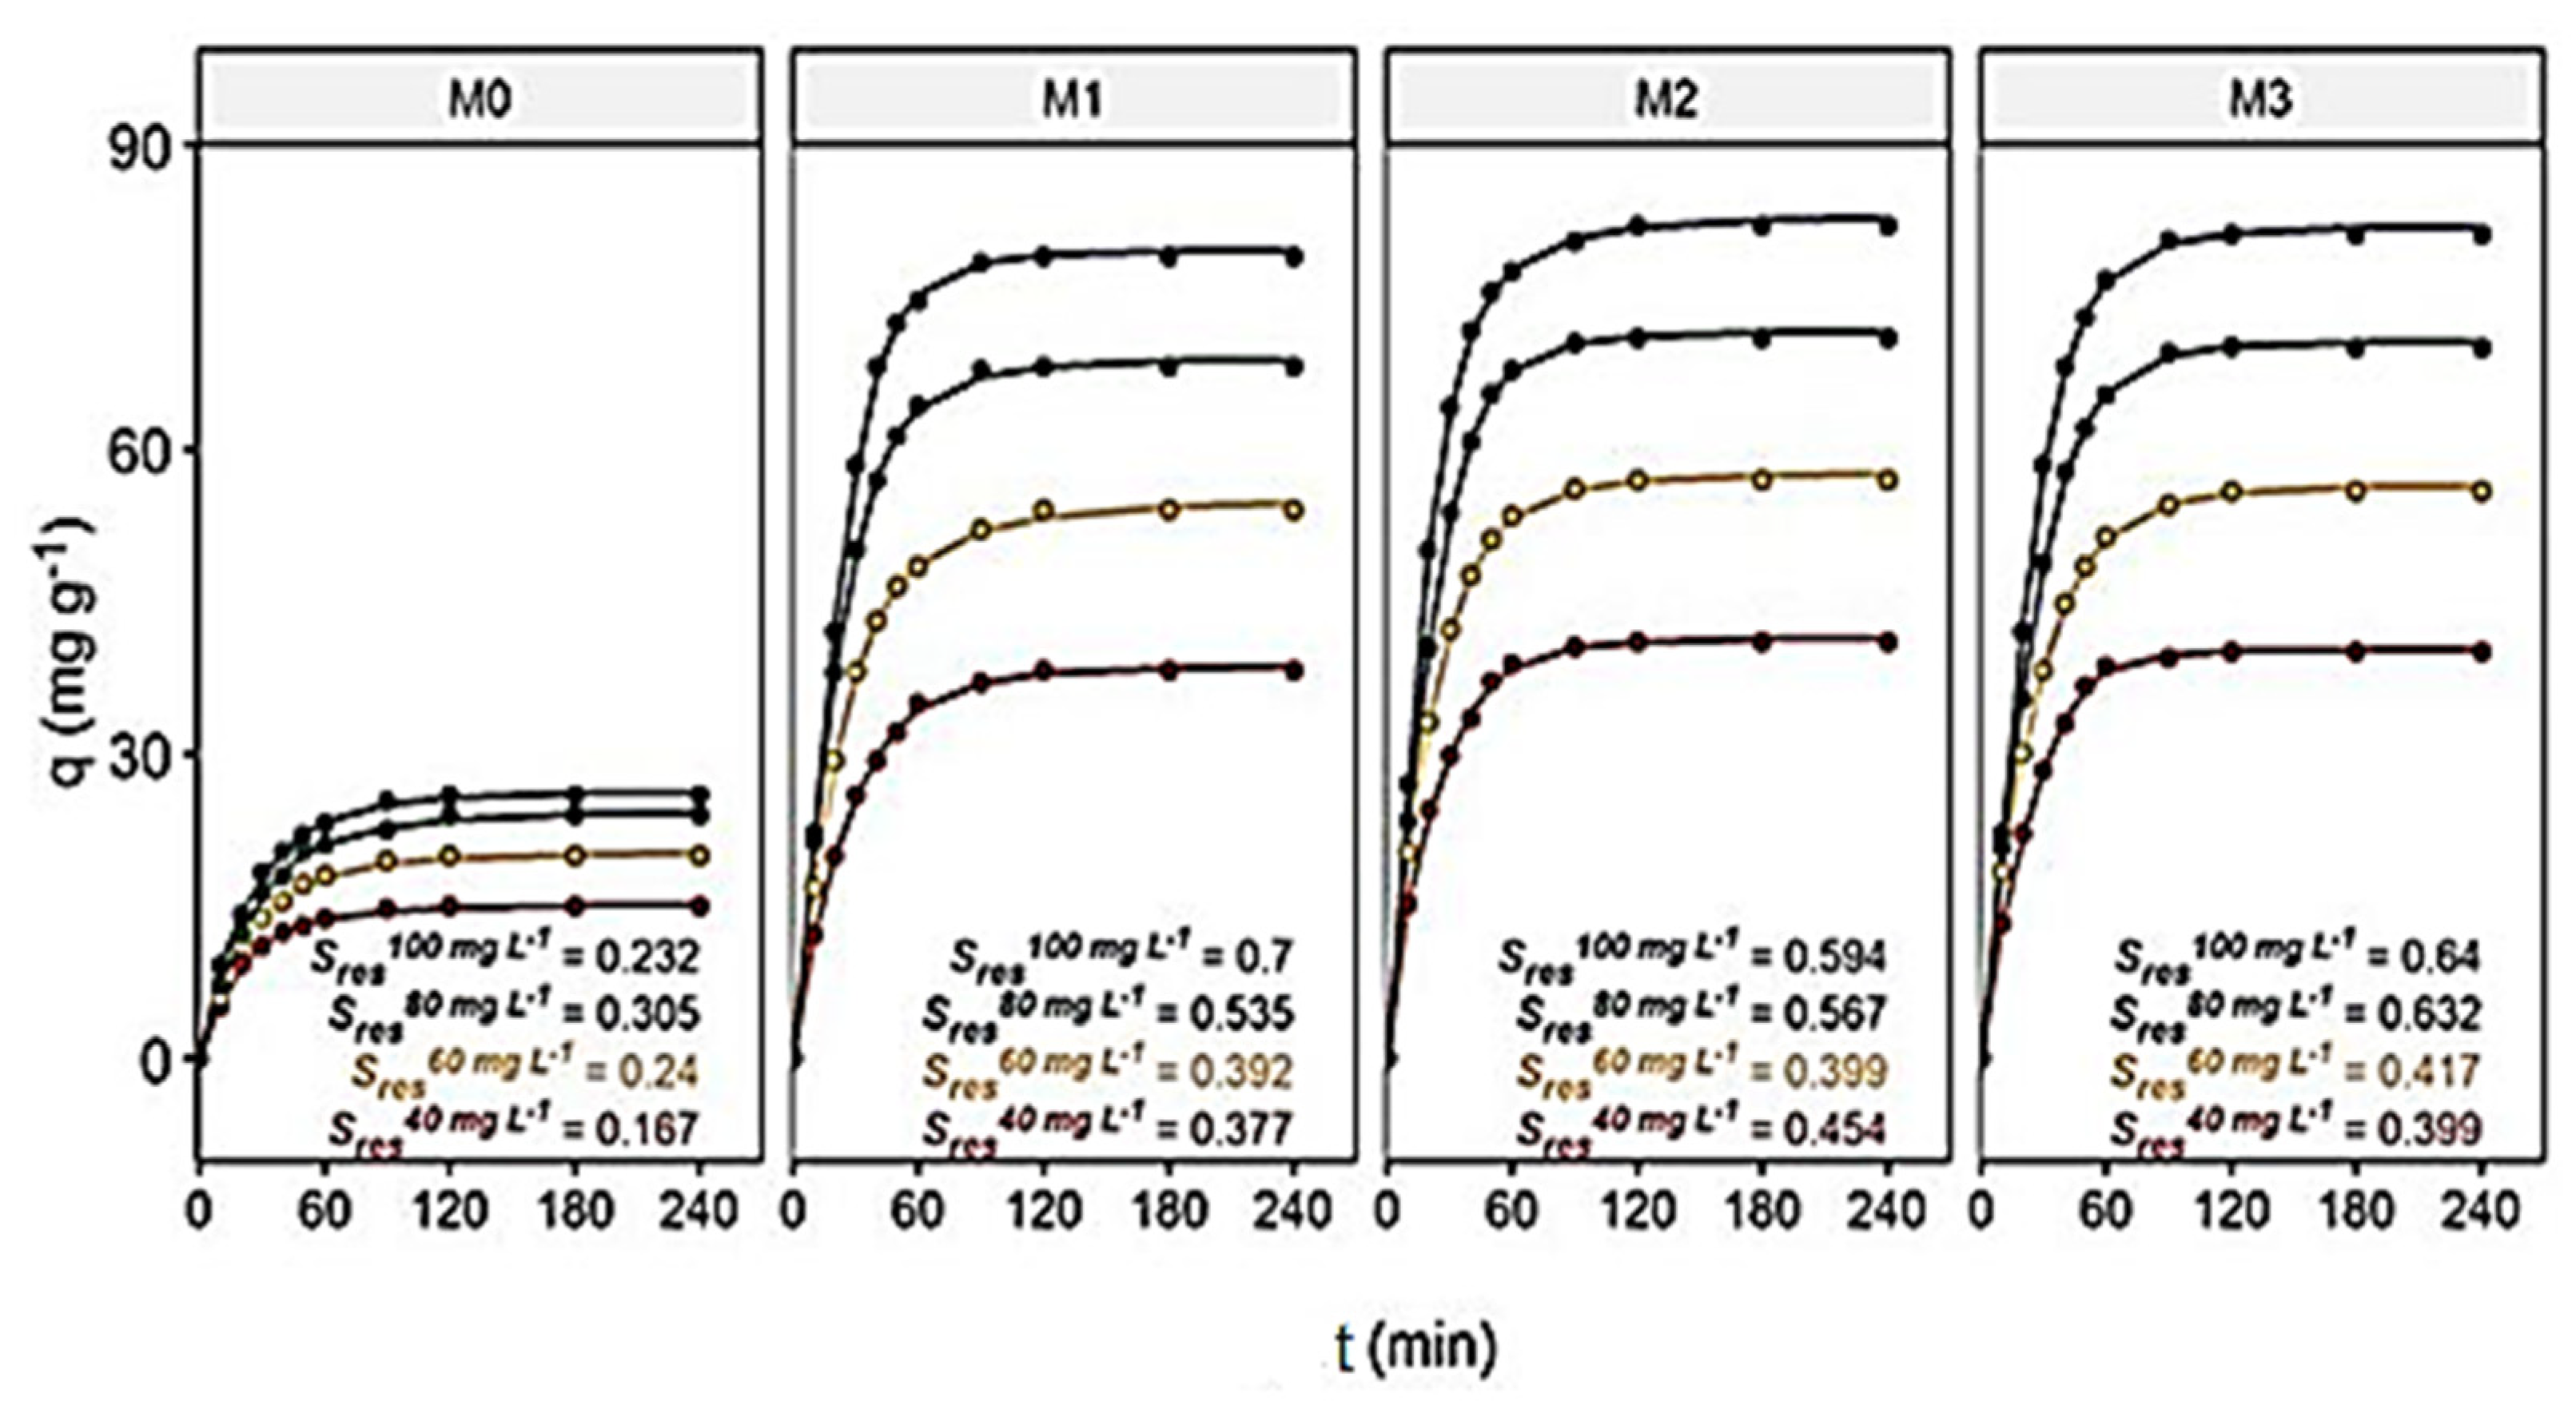
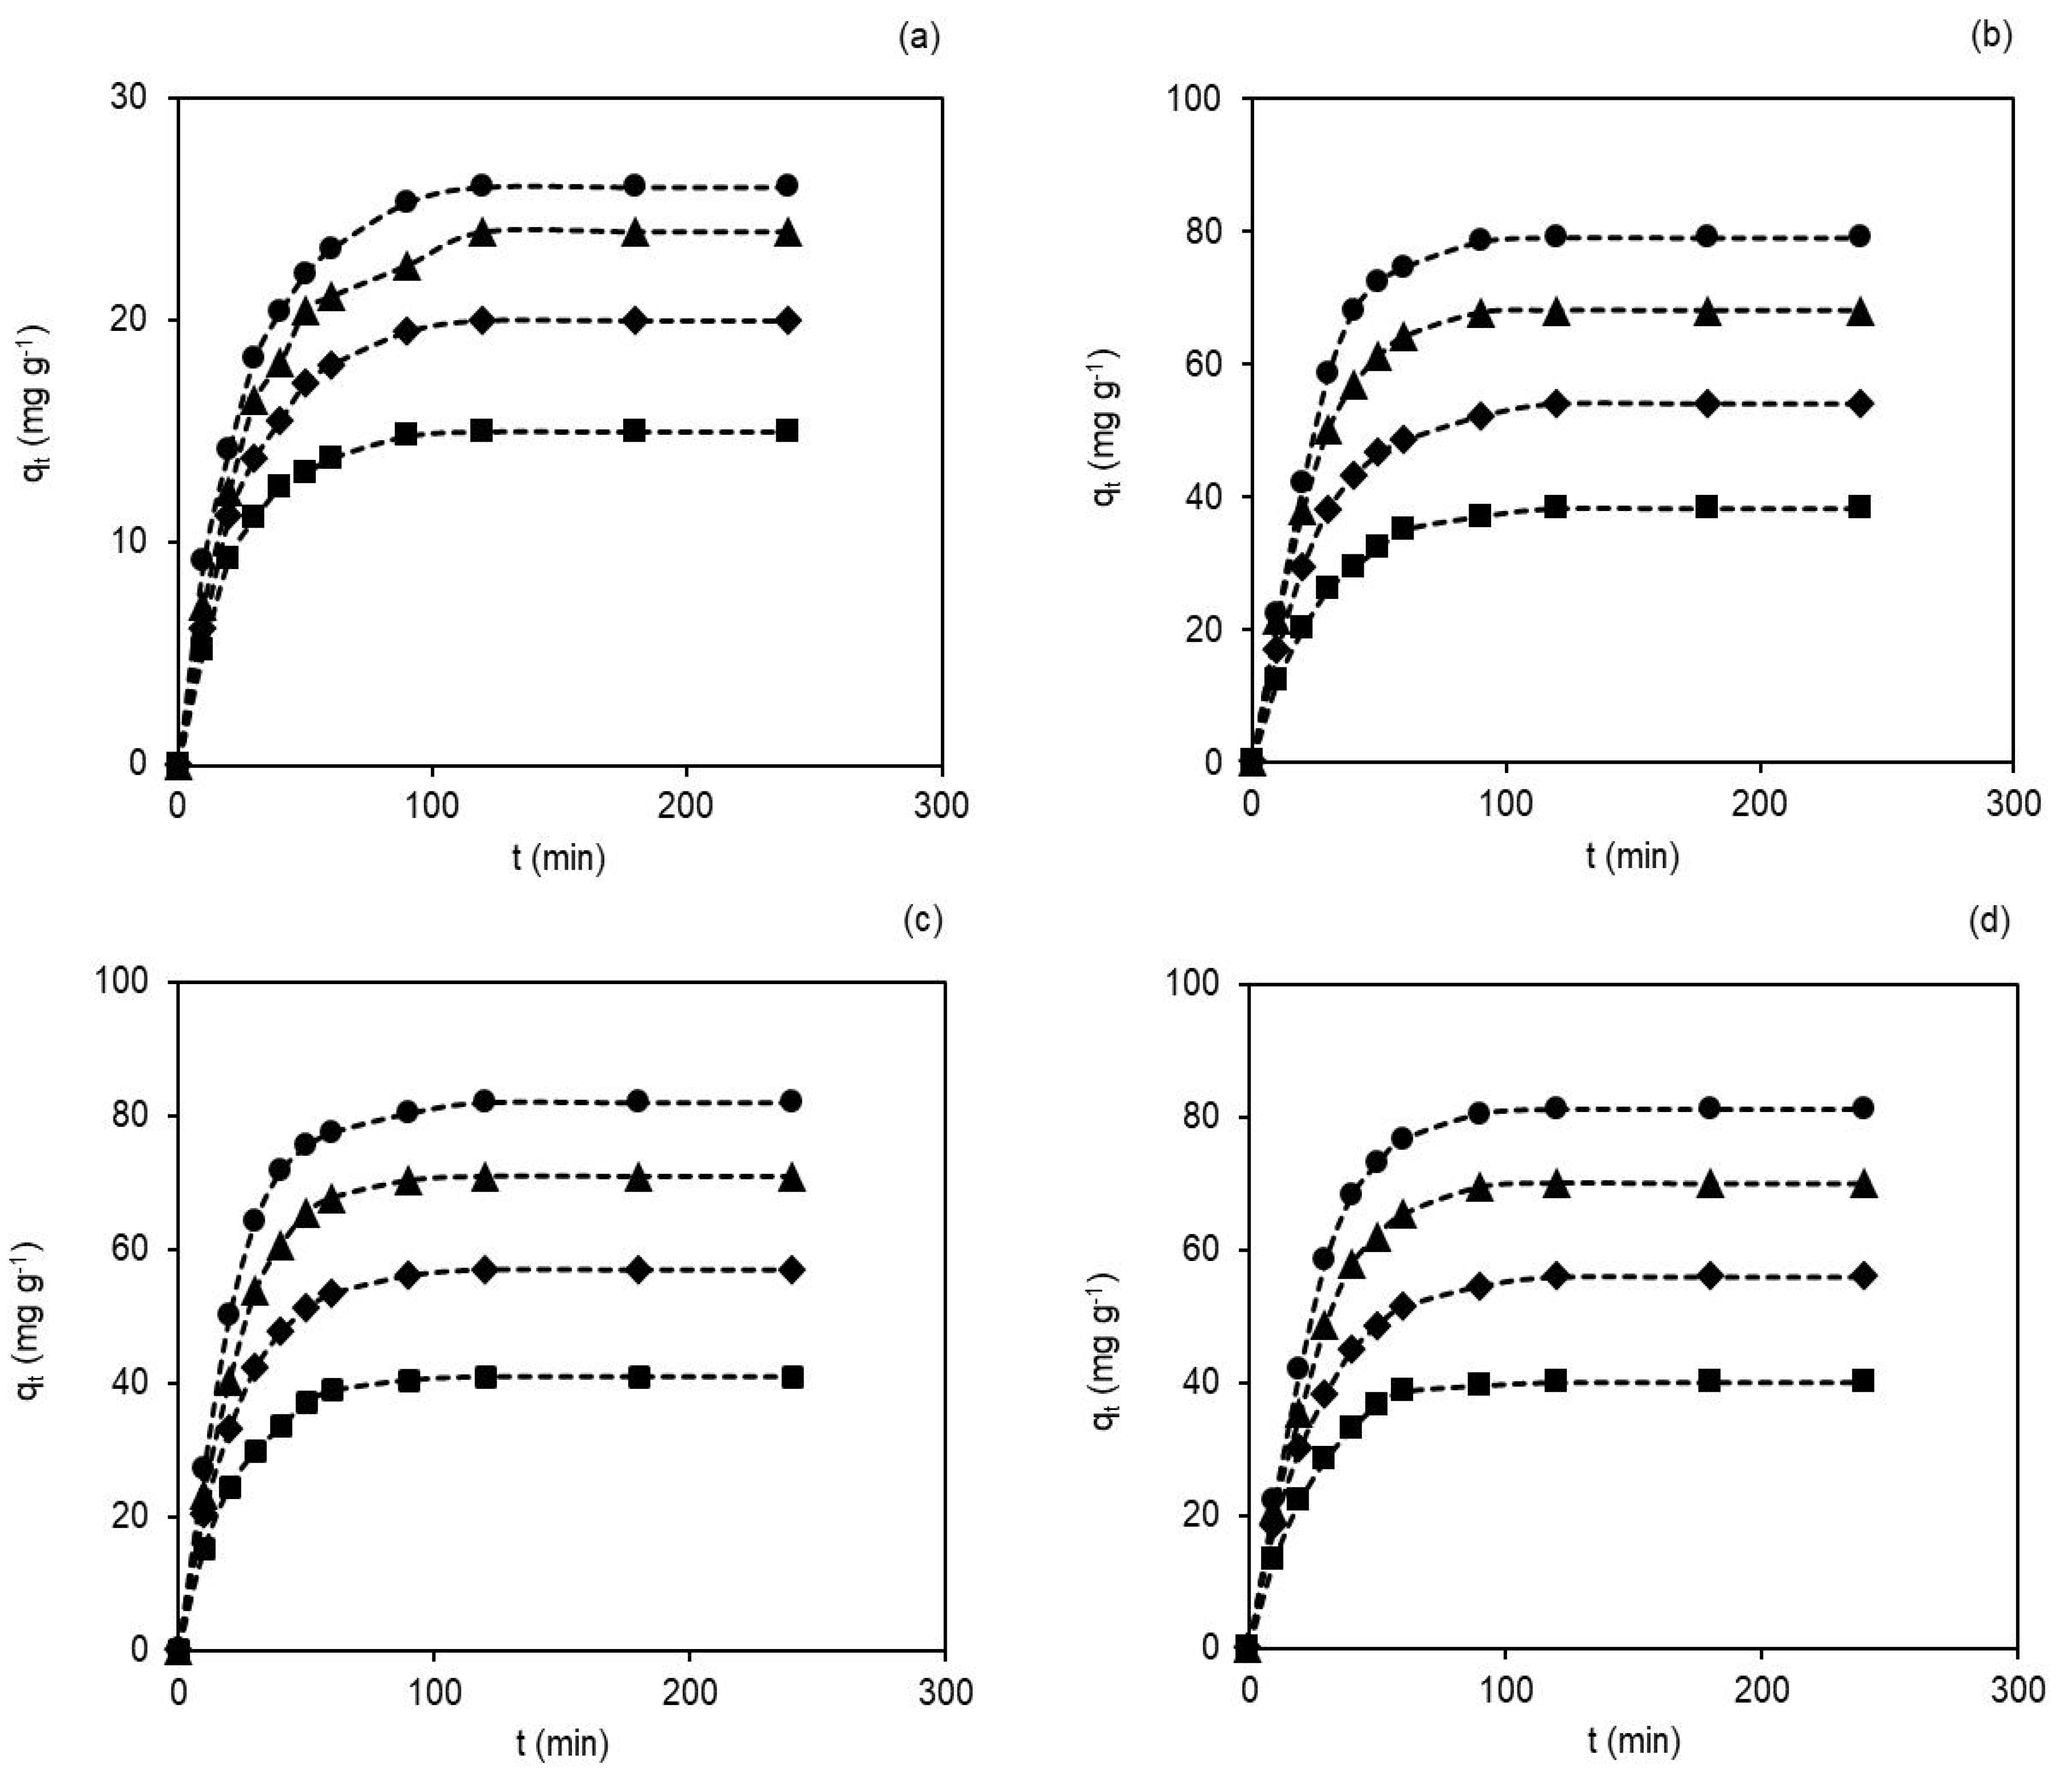
3.3. Contact Time and Initial Dye Concentration’ Effects on the Adsorption Capacity of Membranes

Contact time between the membranes and the dye is another significant factor in the adsorption processes designed in industries, since very long contact times are not cost-effective nor desirable. The initial dye concentration is a factor that also shows relevance, but its control is not easy, as the concentration depends on the effluents (domestic, industrial or clinical). The effect of contact time on adsorption in the membranes was assessed as qt vs. t and is shown in Figure 3a–d. The experiments were conducted with different initial dye concentrations (40, 60, 80 and 100 mg L−1) in pH~7 and 25 ± 0.5 °C.
As seen in Figure 3a–d, the dye adsorption capacity on membranes improved with the increasing contact time and initial dye concentrations [42]. The observed adsorption capacities of hydRB5 in the membranes were faster in the initial stage, followed by a gradual decrease until reaching equilibrium (saturation). The shape of the curves suggests a possible dye monolayer on the membrane surface [43].
For example, the adsorption capacities in the M0 and M2 membranes changed with the change in the concentration of hydRB5. For example, at 40 mg L−1 and 100 mg L−1 the adsorption capacities were 15.0 mg g−1 and 26.0 mg g−1 in the M0 membrane and 41.0 mg g−1 and 82.0 mg g−1 in the M2 membrane. Thus, the highest adsorption capacities are observed for highest initial dye concentration due to the increase in the potential chemical offered by the increase in the dye concentrations in the solution [44]. Moreover, equilibrium was reached more quickly in the M0 membrane than in the other membranes. As the M0 membrane has fewer binding sites than nanocomposites, it reached its maximum adsorption capacity before the others. With the presence of acetate and hydroxyl groups in nanocomposite membranes’ prominent binding sites, there was an increase in the acessible reactive sites and, consequently, an increase in the adsorbent–adsorbate interactions and an increase in the adsorption capacity [17,27,45]. The percentage of dye removal observed at a concentration of 100 mg L−1 was 13.3% in the M0 membrane and 41.0% in the M2 membrane.
From these results, it can be concluded that the dye adsorption capacity in the membranes depends on the straight relationship between the dye concentration and the reactive sites available in the membrane. Therefore, the nanocomposite membranes showed better adsorption behavior than the pristine membrane (M0) due to integrated hydrophilic Fe2O3 NPs in the polymer matrix, as argued by Khosravi and Eftekhar [45] and Silva et al. [23]. For this reason, the adsorption behavior in the nanocomposites varied according to the order M2 > M3 > M1, due not only to the observed differences in porosity, hydrophilicity and charge density, which were small, but also due to the different crystallinity and dispersion homogeneity of the NPs [23].

3.4. Adsorption Kinetic Studies

The mechanism of hydrolyzed dye adsorption on membranes was obtained by kinetic models, namely, the pseudo-first-order model (PFO) [46], the pseudo-second-order model (PSO) [47] and the intra-particle diffusion model (IPD) [48]. This study can provide an understanding of the type of interaction between the dye and the membrane and thus the concepts behind the adsorption mechanism.
The PFO was proposed by Lagergren [46] and is used to presume that the rate-limiting step in the adsorption depends on collisions between adsorbate with empty reactive sites and the adsorbents’ surface. The integrated form for the PFO model is provided in Equation (5):
l n ( q e q t ) = l n q e k 1 t
where qt and qe (mg g−1) are the amounts of hydRB5 bound to the adsorbent at time t and in equilibrium, respectively, k1 (min−1) is the rate constant and t (min) is the adsorption time. These parameters were calculated from the plots ln (qeqt) against t (SI, Figure S1a–d).
On the other hand, Ho and McKay’s [47] proposed the PSO model, which assumes as a rate-limiting step that which depends on the adsorption and chemisorption of the dye. The integrated form is indicated in Equation (6):
t q t = 1 k 2 q e 2 + ( 1 q e ) t
where qt and qe (mg g−1) are the amounts of hydRB5 bound to the adsorbent at time t and in equilibrium, respectively, k2 (g mg−1 min−1) is the rate constant and t (min) is the adsorption time. From the plots of t/qt against t (SI, Figure S2a–d), the parameters were obtained.
Another parameter from this model, h (mg g−1 min−1) at t → 0, that is, the initial adsorption rate, is obtained by Equation (7):
h = k 2 q 2 2
The IPD model recommended by Weber Jr. and Morris [48] involves the transport of adsorbent molecules in the aqueous phase to the surface of the adsorbent and then the diffusion of the adsorbent into the pores. This model is better described by Equation (8):
q t = k i t 0.5 + C
where qt (mg g−1) is the amount of hydRB5 bound to the adsorbent at time t, ki is the intraparticle diffusion rate constant (mg g−1 min−0.5) and C is a parameter proportional to the boundary layer effect or surface adsorption (mg g−1). The parameters were determined from the plots of qt against t0.5 (SI, Figure S3a–d). The curves had two zones, the first being the one that we are interested in evaluating. The slope of the curve in the first linear part gives the initial adsorption rate (here taken between 10 and 50−60 min before equilibrium is reached). The linear part of the curves is ascribed to diffusion effects in the boundary layer of the adsorbent/adsorbate. The extrapolation of this part of the curve to time axis provides values proportional to the boundary layer (C) thickness.
From the results presented in Table 3, the PFO model gave a better fit to the experimental values than the PSO model. Although the correlation coefficients’ values of (R2) in both models, PFO and PSO, were high (R2 > 0.990), the value of qe,cal estimated by the PFO model was closer to qe,exp, indicating that the PFO model is the best fit to adjust and explain the kinetics of adsorption of hydRB5 in the nanocomposite membranes. However, for the pristine membrane (M0) it was established that the PSO model gave the best fit to the kinetic results.
From the above, what is observed in the nanocomposite membranes is in contradiction with results reported for other adsorbents [17,22,27,41], where the PSO model was the model that best fit to the experimental values. However, our findings met the concerns noted by Xiao et al. [49] and helped us to make mathematical interpretations of all the models as mathematical models, solely. The PFO model suggests the adsorption capacity was affected by mass transfer, which supposes that the adsorption is dependent on the amount of adsorbed molecules on the surface of the adsorbent in equilibrium.
The IPD model was used here to discriminate the diffusion mechanism and to determine the rate-controlling step. It is known that intraparticle diffusion would be responsible for the adsorption rate if the intercept of the curves in the coordinate axes were zero. The plots qt vs. t0.5 (SI, Figure S3a–d) did not pass through the origin, meaning that the adsorption was not fully controlled by the IPD but is part of the adsorption mechanism.
From the mathematical analysis carried out, we conclude that the mechanism of adsorption in the nanocomposite membranes was performed by the following steps: (i) the movement of the charged dye from the solution to the surface of the membranes; (ii) the diffusion of the charged dye to the surface of the membranes through the boundary layer; and (iii) intraparticle or pore diffusion. However, for the pristine membrane (M0) the best fitting of experimental results was achieved with the PFO model, which assumes the chemical sorption, or chemisorption, as limiting rate step in accordance with what was already reported for porous cellulosic materials [50].

3.5. Adsorption Isotherms

The adsorption isotherms offer important physicochemical data to assess the applicability of adsorption, since these isotherms define the interaction of adsorbate with the adsorbent and, therefore, are important in improving the adsorption conditions for membranes. In this work, three isothermic models were used: (i) Langmuir [51], (ii) Freundlich [52] and (iii) Temkin [53].
The Langmuir [51] isotherm proposes that the adsorption occurs in a monolayer, homogeneously and in identical locations. It also suggests that adsorption no longer occurs at the adsorbent’s surface after the formation of a monolayer, as the reactive sites are already covered by the dye molecules. The Langmuir equation is given in Equation (9):
C e q e = 1 K L q m a x + C e q m a x
where Ce (mg L−1) is the adsorbate concentration in the equilibrium, qe (mg g−1) is the adsorption capacity in the equilibrium, KL is the Langmuir constant (L mg−1) and qmax (mg g−1) gives the maximum amount of adsorbent adsorbed after the formation of a complete monolayer (mg g−1).
An important dimensionless separation factor, RL, which provides information related to the adsorption affinity of an adsorbate for the adsorbent, is estimated from Equation (10):
R L = 1 ( 1 + K L C 0 )
where KL is the Langmuir constant, and C0 (mg L−1) is the initial dye concentration. If RL = 0, the adsorption is irreversible; if 0 < RL < 1, the adsorption is favorable; if RL = 1, the adsorption is linear; and if RL > 1, the adsorption is unfavorable.
On other hand, the Freundlich [52] isotherm is an empirical model that assumes a non-homogeneous adsorption. The linear form is written in Equation (11):
l n q e = 1 n l n C e + l n K F
where qe (mg g−1) is the adsorption capacity in the equilibrium, Ce (mg L−1) is the adsorbate concentration in the equilibrium and KF (mg g−1) (L mg−1)1/n and n (adimensional) are empirical parameters that represent the adsorption capacity and adsorption strength, respectively.
The values of n, which are related to the (non)-linearity between the dye concentration in solution and the dye’s adsorbed amount, changes in this form: if n = 1, the adsorption capacity is directly proportional to the dye amount in solution; if n < 1, the adsorption process is a chemical process based on chemical interactions between ions; if n > 1, the adsorption is a physical process made by electrostatic interactions.
Finally, the Temkin model [53] accepts that the adsorption of adsorbed molecules decreases in direct proportion to the number of layers due to adsorbent–adsorbate interactions; thus, a uniform distribution of binding energies up to the maximum binding energy characterizes the adsorption. Temkin’s model is given in Equation (12):
q e = B l n K T + B l n C e
where KT (L mg−1) is the binding constant in the equilibrium, which relates to the maximum binding energy, and the constant B (J mol−1) is associated to adsorption heat.
According to the plots presented in SI, Figure S4a–c, and the parameters presented in SI, Table S1, the adsorption equilibrium models that fitted the experimental data varied in the following order: Langmuir > Freundlich > Temkin. This order was based on the comparison between R2 values. The qmax obtained by the Langmuir model was 105.26 mg g−1. The RL values ranged between 0.1923 and 0.3731, revealing favorable adsorption in the M2 membrane. The correlation coefficient obtained by this model was higher than with the other mathematical models (R2 = 0.9908). Thus, it is assumed that the adsorption capacity in the M2 membrane follows at energetically uniform adsorption sites, with a hydRB5 monolayer formation on the adsorbent surface. Additionally, the adsorption of hydRB5 on occupied adsorption sites is excluded, as assumed previously [43].
Comparing the maximum adsorption capacity of hydRB5 in the nanocomposite membranes studied here with that of other adsorbents, in the period from 2015 to 2021, we found that only one article addressed the issue of hydrolyzed RB5 adsorption [22], and the others referred to the adsorbate in the unfixed (native) form. There is thus an important gap in knowledge in this area given the persistence of hydrolyzed forms and hydrolyzed forms being the most common form of these reactive dyes in wastewaters. In the work by Kim et al. [22], a polyethyleneimine-polyvinyl chloride (PEI-PVC) fiber was used to remove hydRB5. They obtained a maximum adsorption capacity of 310 mg g−1 in pH = 2. Although the amount of dyes adsorbed is greater than in our composites, most of these adsorbents have several operating limitations, such as costly synthesis, filtration and centrifugation processes, and promotes the turbidity in the effluents. Thus, the synthesized composites, Fe2O3@CA, not only provide adequate adsorption capacity for dye removal at circumneutral pH but can also be rapidly separated and recovered. In addition, almost all the reported studies involved lower pH, which is not friendly to most adsorbents and cannot withstand these harsh conditions and becomes degraded. Thus, adsorption at a less acidic pH, around 7 or 8, is the most suitable in the adsorption processes even though it sacrifices adsorption performance, as we have shown here.

3.6. Recyclability of M2 Membrane in hydRB5 Adsorption

The recyclability of an adsorbent is one of the relevant factors for considering their applicability in industrial processes. The tests to assess the recyclability capacity of the M2 membrane were performed under optimized conditions, with good recyclability for five consecutive cycles.
In the previous sections, the adsorption of hydRB5 to M2 has been attributed mainly to electrostatic attraction between the M2 membrane, as M2 is positively charged at pH < 6 [23], and hydRB5, as it is an anionic dye. In order to interfere with the electrostatic attraction and desorb hydRB5 from M2, a typical anion, OH, was exchanged with the anionic hydRB5. Thus, NaOH was employed for regeneration. In addition, we also used NaCl solutions as a solvent for washing the adsorbed M2 due to Cl ions having smaller ionic radius when compared to OH ions.
Figure 4a shows that the desorption efficiency was better with 0.4 g L−1 NaOH than using 120 g L−1 NaOH. Figure 4b shows that 10 g L−1 NaCl had better performance than 150 g L−1 NaCl in terms of desorption. The results propose that greater concentrations of NaOH and NaCl are not favorable, and smaller concentrations of both are more adequate to elute hydRB5 from membranes. Thus, under more alkaline and saline conditions, higher concentrations of base and salt, there was an increase in OH and Cl ions in solution and, consequently, an increase in electrostatic repulsions with the anionic dye molecules, avoiding their desorption from the surface of the adsorbent.
Comparing both, Figure 4c shows that NaOH achieved higher regeneration efficiency than NaCl. The reason for this result is related to the size of the anion. As OH is bigger than Cl, the strength of the interactions between the adsorbent surface and OH were higher, resulting in a more efficient regeneration.
Thus, the reused M2 exhibits stable and effective regeneration efficiency over a five-cycle test by washing it with NaOH solution, without any change in the weight and color (chemical stability). The greater regeneration obtained with NaOH shows that diluted NaOH solution can be a useful solvent for regenerating cellulose acetate composite membranes. According to these results, the CA composite membranes may be utilized as an economical and effective material for the adsorptive removal of dyes in aqueous environs or at industrial applications, with high reusability. The chemical stability of these composites in low concentration NaOH solutions has been shown here, and it has also been described previously for cellulose acetate composites with carbon nanoparticles under different pH conditions [28].

3.7. Experimental Design

3.7.1. Statistical Analyses

The adsorption capacities of the dye on membranes (q), at t = 120 min, were studied by analysis of variance (ANOVA) to assess differences between the conditions tested experimentally. The t = 120 min was chosen because it was the equilibrium time.
One-way ANOVA and its pair comparisons for all dye concentrations tested, Figure 5, revealed significant differences between the M0 membrane and the M1, M2, and M3 membranes but not between the nanocomposites. In absolute numbers, M0 had the lowest adsorption capacity and M2 the highest, which confirms the results discussed above.
ANOVA allowed us to verify the importance of parameters such as the concentration and the pH, their interactions, and the effect of each parameter on adsorption, as shown in SI, Table S2. It is noteworthy that only parameters with significant values are reported. The results showed that the models generate very low p-values and high F-values for the four responses (membranes).
The equation models obtained from Equations (S13)–(S16) are shown in SI, Table S3. The quadratic and simple terms, without interaction, were considered significant for the M0 membrane. For the other membranes (M1, M2 and M3), neither the quadratic term nor the interaction was considered significant. The results were different from the ones discussed in Askari et al. [29] due to differences in the chosen adsorbent–adsorbate system, as well as in the tested parameters in the models.
To confirm the efficiency of the suggested models, the F-value, the p-value, the predicted R2 (R2pred), the adjusted R2 (R2adj), the standard deviation (Std. Dev.) and the sum of squares of the predicted residual error (PRESS) were calculated (SI, Table S2).
The high R2 values and the non-significance of p-values demonstrate that the models are highly comparable to the results obtained and explain the good correlation between responses and adsorption conditions.
The values of F and p showed that the obtained models disturb the predictable response (adsorption capacity). The coefficient of determination (R2) was great for all models, which demonstrates that the models are highly comparable to the results obtained and can explain the good correlation between the responses and the adsorption conditions [54]. The F-values were 813.17, 99.58, 87.98 and 134.8 for M0, M1, M2 and M3, respectively; the low probability value (p < 0.0001) suggests the importance of the models.
From Table S3, Equation (S13), the number of parameters needed to describe M0 were different when compared to the other models to describe M1, M2 or M3 (Table S3, Equations (14)–(16)), and to take into account the number of parameters used for the adjustment, the predicted and adjusted R2 values were also calculated and used to compare the models. Thus, the values of the predicted R2 were 0.994, 0.917, 0.910 and 0.941 for M0, M1, M2 and M3, respectively. These are in reasonable agreement with the values of the adjusted R2 of 0.997, 0.947, 0.941, and 0.961; that is, the differences are ≤ 0.3%. As can be seen from these results, the best fit of the data was for M0, followed by M3, M1 and M2. This order was further confirmed by the distance of the model between the data values and the adjusted values, the standard deviation and the PRESS parameters.
The correlation between experimentally and predicted dye adsorption efficiencies is shown in SI, Figure S5a. According to these graphs, a linear relationship and good agreement between actual and predicted values were observed, suggesting the applicability of the models, with higher success for M0 and lower for M1. The residuals of the models were analyzed later (SI, Figure S5b–d). Overall, the results validate the ability and usefulness of the models in predicting the adsorption capacity in membranes.

3.7.2. Influence of Factors on Dye Adsorption and Its Interactions

In Figure 6a–c, the impact of factors on dye adsorption is shown, and the interactive 3D surface graphics show the response as a function of these factors (SI, Figure S6).
  • pH effect
As already discussed, pH would have a great effect on the adsorption capacity of membranes (Figure 6a). Acidic media increased the adsorption capacity in all membranes, although the effect of pH was much more significant for nanocomposite membranes, following the order of M2 > M3 > M1, than for M0, as discussed above. This supposes that the surface charge of the adsorbent at low pH (pH < 6) is positive, and at higher pH (pH > 6) it becomes negative. Therefore, adsorbents effectively remove hydRB5 at low pH due to increased electrostatic attraction between the anionic dye and the positive surface-charged adsorbent [40].
2.
Dye concentration effect
A positive relationship was found between the dye concentration and the membrane adsorption capacity, as shown in Figure 6b. Higher dye concentrations are also associated with a higher adsorption capacity in all membranes. However, the increase in adsorption capacity in M0 was significantly smaller than in other membranes as the concentration increased. This fact was previously discussed and argued [15,27,44]. The combination of initial dye concentration and pH on the adsorption capacity of membranes can be seen in the contour plots (Figure 6c). Interactive 3D surface graphs explaining the response in terms of these factors can be found in SI, Figure S5.
3.
Time effect
Figure 7 shows the relationship of the contact time to the adsorption capacity of the membranes, which was used to determine the minimum time needed to produce a maximum response (assuming 95% of the total adsorption capacity).
For each membrane and at each concentration analyzed at pH~7, non-linear functions were used to model the experimental data. These functions were then compared by calculating the Akaike Information Criterion (AIC) (SI, Table S4). For all membranes, the best function to fit the data was of log-logistic (LL.5) and is given in Equation (17):
q = f ( t ) = c + d c ( 1 + e ( b × ( l n ( t ) e ) ) ) f
where the variables to be adjusted were {b, c, d, e and f}, and t is the time (min). For all, variable c was considered non-significant and, consequently, was eliminated from the equations. The residual standard deviation of the models (Sres) presented in Figure 7, and their t50 and t95 presented in SI, Table S5, were then calculated (where Sres determines the adequacy of the data for the adjustment, while t50 and t95 determine the time required to produce 50% and 95% of the total possible capacity, by membrane and concentration, which were used for comparison between models).
It can be seen that adsorption rates differed more and more from each other when the membranes stayed in contact with the dye for a longer time. This is in agreement with the experiments.
The magnitude of Sres provides an indication of how close the approximations were to the model. Therefore, the closer the adjustment is to the actual data estimate, the lower the Sres will be, suggesting better adjustments. The LL.5 model for the M0 membrane had smaller Sres than those found for the other membranes, although they were also small. The residual analysis of the LL.5 model suggested a good fit of the proposed relationships (SI, Figure S7a,b). Furthermore, their t50 values showed subtle differences between membranes but very different values for their t95 values. The M2 membrane was the fastest membrane to adsorb 50% and 95% of its total adsorption capacity (SI, Table S5).
These results are corroborated in SI, Figure S8, where, for example, at the optimal initial dye concentration of 100 mg L−1 and pH = 3, M0 needed 93.6 min, while the time requirements for M1, M2 and M3 were significantly shorter, with 62.5, 68.0 and 67.2 min, respectively. Hence, M0 is overall the slowest in addition to being the least adsorbent membrane for the dye, as discussed.

3.7.3. Optimization Process and Confirmation of Related Forecasts

RSM was used to find the optimal pH and dye initial concentration conditions to produce a maximum dye adsorption capacity at t = 120 min.
The variance between the actual and predicted adsorption capacities of the membranes and the percentage of this variance with the actual adsorption capacity were also calculated. Results can be found in SI, Table S6, at the top. The maximum (optimal) parameters found in the experimental range tested were pH = 3 and at an initial dye concentration of 100 mg L−1 for all membranes. Therefore, under these optimal conditions, the differences between the actual and predicted adsorption values were less than three adsorption units and less than 3% of all adsorption, confirming the good fits of the models used.
The mathematical models developed also predicted that lower pH and higher dye concentrations would increase the adsorption capacity in the membranes, which are sustainable conditions for nanocomposites due to their chemical resistance and good anti-(bio)fouling behavior. Therefore, extending the range to very acidic media through the use of prediction models for membranes (especially M1, M2 and M3), even higher adsorption capacity results were estimated. To further validate the models, these conditions were tested empirically. In addition, the pseudo-optimal concentration conditions were also tested and compared to their actual values as further validation. The results of experiments at pH = 2 and with the ideal dye concentration of 100 mg L−1 (SI, Table S6, medium) and with a suboptimal dye concentration of 40 mg L−1 (SI, Table S6, bottom) were compared with the predicted values. These results confirm that the adsorption capacity of membranes increases at a more acidic pH, with little difference between predicted and actual results. Although the other conditions explored had slightly larger variances, the results together confirm the good agreement between these models and the real adsorption capacity on membranes, showing the success of the statistical analysis in this original work.

4. Conclusions

We have successfully tested the adsorption of hydrolyzed RB5. The adsorption of this form of the dye is generally overlooked in research articles, as it implies a previous step, the hydrolysis of the dye that occurs naturally in waters. It is nevertheless of the utmost importance due to the relevance and potential toxicity of this degradation product. We used as adsorbents the cellulose acetate membranes modified with α-Fe2O3 NPs due to their pore size, surface porosity, crystallinity, hydrophilicity, thermal and chemical resistance, reproducibility and cost-effectiveness.
Our results showed that the adsorption capacity was significantly influenced by all the operating parameters (i.e., initial dye concentration, contact time and solution pH). It was found that size and crystallinity of α-Fe2O3 nanoparticles on CA, as well as the porosity of the CA, were relevant factors, and the adsorption capacity was significantly enhanced due to this synergistic effect. α-Fe2O3@CA composites showed a better performance at pH < 7. However, to avoid the continuous adding of HCl to dye solutions, we have chosen the circumneutral pH to study the adsorption capacity (kinetic and equilibrium studies). The adsorption mechanism was coherent with the pseudo-first-order kinetic model and the adsorbent with best performance was the M2 membrane. The time for attaining equilibrium was 120 min, and the data from the equilibrium studies were best adjusted by the Langmuir isotherm model; the obtained maximum adsorption capacity in the M2 membrane was 105.26 mg g−1 in pH~7 and 25 ± 0.5 °C. The as-synthesized composite membranes indicated an excellent reusability potential for hydRB5 adsorption with five successive cycles and without further modification.
A one-way ANOVA confirmed the experimental data, and the RSM showed that the ideal conditions to maximize adsorption were pH = 3 and a maximum initial dye concentration of 100 mg L−1, providing an adsorption capacity of 120.2 mg g−1 in the M2 membrane; this value is greater than the qmax found experimentally at pH~7.
In conclusion, the composite α-Fe2O3@CA is a promising adsorbent that can be used effectively in the treatment of contaminated waters due to its easy separation, excellent recyclability, as well as good adsorption performance. The adsorption mechanism can be optimized with DoE methodology.

Supplementary Materials

The following are available online at https://www.mdpi.com/article/10.3390/fib9100061/s1, Figure S1: The pseudo-first-order plots for the adsorption of hydRB5 at 40 mg L−1 (■), 60 mg L−1(♦), 80 mg L−1 (▲), and 100 mg L−1 (●) on the membranes: (a) M0, (b) M1, (c) M2, and (d) M3. Figure S2: The pseudo-second-order plots for the adsorption of hydRB5 at 40 mg L−1 (■), 60 mg L−1(♦), 80 mg L−1 (▲), and 100 mg L−1 (●) on the membranes: (a) M0, (b) M1, (c) M2, and (d) M3. Figure S3: The intraparticle diffusion plots for the adsorption of hydRB5 at 40 mg L−1 (■), 60 mg L−1(♦), 80 mg L−1 (▲), and 100 mg L−1 (●) on the membranes: (a) M0, (b) M1, (c) M2, and (d) M3. Figure S4: The isotherm models for the adsorption of hydRB5 on the membrane M2: (a) Langmuir, (b) Freundlich, and (c) Temkin. Figure S5: (a) The residuals as a function of membrane adsorption, (b) the residual density histogram by model, (c) the Q-Q plot by model, and (d) the location-scale plots by model for each membrane. Figure S6: The interactive 3D-surface plots for the M0, M1, M2, and M3 membranes. Figure S7: (a) The residuals of the log-logistic models as a function of the adsorption capacity, and (b) the residual histograms for each model and per membrane. Figure S8: The desirability functions for the adsorption capacity for each membrane. Table S1: The parameters of isothermal models for the adsorption of hydRB5 on the M2 membrane, in pH~7 and 25 °C. Table S2: The ANOVA results for the response surface quadratic model. Significance levels are expressed as: (.) >0.05; (*) ≤0.05; (**) ≤0.01; (***) ≤0.001. Table S3: The equation models where qt is the adsorption capacity of membranes, pH is the acidity of the medium and C is the dye concentration. Table S4: The functions used to adjust membrane adsorption capacity as a function of time and initial dye concentration (Akaike Information Criterion, AIC, was used for each model). Table S5: The time-dependent and parameter-dependent log-logistic formula per membrane and initial dye concentration. Table S6: The optimal conditions found by the RSM at t = 120 min (Top position), the optimal dye concentration at 100 mg L−1 and pH = 2 (Medium position), and the pseudo-optimal conditions at 40 mg L−1 and pH = 2 (Bottom position).

Author Contributions

Conceptualization, M.A.S.; Methodology, M.A.S.; Software, E.B.-R.; Validation, M.A.S.; Formal analysis, M.A.S.; Investigation, M.A.S.; Data curation, M.A.S. and E.B.-R.; Writing—original Draft, M.A.S.; Writing—review & editing, M.A.S.; Visualization, M.A.S.; Supervision, M.A.S.; Funding acquisition, M.T.P.d.A. All authors have read and agreed to the published version of the manuscript.

Funding

This work was funded by NORTE2020, funding reference NORTE-01-0145-FEDER-000015, within the Project TSSiPRO-Technologies for Sustainable and Smart Innovative Products, and also by national funds through FCT—Foundation for Science and Technology within the scope of the PROJECT UID/CTM/00264/2013.

Institutional Review Board Statement

Not applicable.

Informed Consent Statement

Not applicable.

Conflicts of Interest

The authors have no conflict of interest to declare. The founders did not take any part in the collection, analyses, or understanding of data, nor in the writing of the manuscript, or in the decision to publish the results.

References

  1. Gogate, P.R.; Pandit, A.B. A review of imperative technologies for wastewater treatment I: Oxidation technologies at ambient conditions. Adv. Environ. Res. 2018, 8, 501–551. [Google Scholar] [CrossRef]
  2. Sharma, S.K. Green Chemistry for Dyes Removal from Wastewater: Research Trends and Applications; John Wiley & Sons, Inc.: Hoboken, NJ, USA, 2015. [Google Scholar] [CrossRef]
  3. Zhang, X.; Hao, C.; Ma, C.; Shen, Z.; Guo, J.; Sun, R. Studied on sonocatalytic degradation of Rhodamine B in aqueous solution. Ultrason. Sonochem. 2019, 58, 104691. [Google Scholar] [CrossRef] [PubMed]
  4. Yagub, M.T.; Sen, T.K.; Afroze, S.; Ang, H.M. Dye and its removal from aqueous solution by adsorption: A review. Adv. Colloid Interface Sci. 2014, 209, 172–184. [Google Scholar] [CrossRef] [PubMed]
  5. Zhou, L.; Gao, C.; Xu, W. Magnetic Dendritic Materials for Highly Efficient Adsorption of Dyes and Drugs. ACS Appl. Mater. Interfaces 2010, 2, 1483–1491. [Google Scholar] [CrossRef] [PubMed]
  6. Pierce, J. Colour in textile effluents-the origins of the problem. J. Soc. Dyers Colour. 1994, 110, 131–133. [Google Scholar] [CrossRef]
  7. Gottlieb, A.; Shaw, C.; Smith, A.; Wheatley, A.; Forsythe, S. The toxicity of textile reactive azo dyes after hydrolysis and decolourisation. J. Biotechnol. 2003, 101, 49–56. [Google Scholar] [CrossRef]
  8. Jalali Sarvestani, M.R.; Doroudi, Z. Removal of Reactive Black 5 from Waste Waters by Adsorption: A Comprehensive Review. J. Water Environ. Nanotechnol. 2020, 5, 180–190. [Google Scholar] [CrossRef]
  9. Bhaumik, M.; McCrindle, R.I.; Maity, A.; Agarwal, S.; Gupta, V.K. Polyaniline nanofibers as highly effective re-usable adsorbent for removal of reactive black 5 from aqueous solutions. J. Colloid Interface Sci. 2016, 466, 442–451. [Google Scholar] [CrossRef]
  10. Kumar, V. A review on the feasibility of electrolytic treatment of wastewater: Prospective and constraints. Arch. Agric. Environ. Sci. 2017, 2, 52–62. [Google Scholar]
  11. Devi, P.; Das, U.; Dalai, A.K. In-situ chemical oxidation: Principle and applications of peroxide and persulfate treatments in wastewater systems. Sci. Total Environ. 2016, 571, 643–657. [Google Scholar] [CrossRef]
  12. Zhao, W.-Y.; Zhou, M.; Yan, B.; Sun, X.; Liu, Y.; Wang, Y.; Xu, T.; Zhang, Y. Waste Conversion and Resource Recovery from Wastewater by Ion Exchange Membranes: State-of-the-Art and Perspective. Ind. Eng. Chem. Res. 2018, 18, 6025–6039. [Google Scholar] [CrossRef]
  13. Singh, R.L.; Singh, P.K.; Singh, R.P. Enzymatic decolorization and degradation of azo dyes—A review. Int. Biodeterior. Biodegrad. 2015, 104, 21–31. [Google Scholar] [CrossRef]
  14. Ahmed, S.N.; Haider, W. Heterogeneous photocatalysis and its potential applications in water and wastewater treatment: A review. Nanotechnology 2018, 34, 342001. [Google Scholar] [CrossRef] [PubMed] [Green Version]
  15. Buthiyappan, A.; Abdul Aziz, A.R.; Wan Daud, W.M.A. Recent advances and prospects of catalytic advanced oxidation process in treating textile effluents. Rev. Chem. Eng. 2016, 32, 1–47. [Google Scholar] [CrossRef]
  16. Crini, G.; Lichtfouse, E.; Wilson, L.; Morin-Crini, N. Conventional and nonconventional adsorbents for wastewater treatment. Environ. Chem. Lett. 2019, 17, 195–213. [Google Scholar] [CrossRef]
  17. Munagapati, V.S.; Wen, J.-C.; Pan, C.-L.; Gutha, Y.; Wen, J.-H.; Reddy, G.M. Adsorptive removal of anionic dye (Reactive Black 5) from aqueous solution using chemically modified banana peel powder: Kinetic, isotherm, thermodynamic, and reusability studies. Int. J. Phytorem. 2019, 22, 267–278. [Google Scholar] [CrossRef]
  18. Emik, S. Preparation and characterization of an IPN type chelating resin containing amino and carboxyl groups for removal of Cu(II) from aqueous solutions. React. Funct. Polym. 2014, 75, 63–74. [Google Scholar] [CrossRef]
  19. Anirudhan, T.S.; Rauf, T.A. Adsorption performance of amine functionalized cellulose grafted epichlorohydrin for the removal of nitrate from aqueous solutions. J. Ind. Eng. Chem. 2013, 19, 1659–1667. [Google Scholar] [CrossRef]
  20. Rashed, M.N.; Palanisamy, P.N. Introductory chapter: Adsorption and ion exchange properties of zeolites for treatment of polluted water. In Zeolites and Their Applications; Rashed, M.N., Ed.; IntechOpen: London, UK, 2018. [Google Scholar] [CrossRef] [Green Version]
  21. Kajjumba, G.W.; Emik, S.; Öngen, A.; Özcan, H.K.; Aydın, S. Modelling of adsorption kinetic processes—Errors, theory and application. In Advanced Sorption Process Applications; Edebali, S., Ed.; IntechOpen: London, UK, 2018. [Google Scholar] [CrossRef] [Green Version]
  22. Kim, M.H.; Hwang, C.-H.; Kang, S.B.; Kim, S.; Park, S.W.; Yun, Y.-S.; Won, S.W. Removal of hydrolyzed Reactive Black 5 from aqueous solution using a polyethylenimine–polyvinyl chloride composite fiber. Chem. Eng. J. 2015, 280, 18–25. [Google Scholar] [CrossRef]
  23. Silva, M.; Rocha, C.; Gallo, J.; Felgueiras, H.; Amorim, M. Porous composites based on cellulose acetate and alfa-hematite with optical and antimicrobial properties. Carbohydr. Polym. 2020, 241, 116362. [Google Scholar] [CrossRef]
  24. Silva, M.; Hilliou, L.; Amorim, M. Fabrication of pristine-multiwalled carbon nanotubes/cellulose acetate composites for removal of methylene blue. Polym. Bull. 2020, 77, 623–653. [Google Scholar] [CrossRef]
  25. Ali, A.S.M.; El-Aassar, M.R.; Hashem, F.S.; Moussa, N.A. Surface Modified of Cellulose Acetate Electrospun Nanofibers by Polyaniline/β-cyclodextrin Composite for Removal of Cationic Dye from Aqueous Medium. Fibers Polym. 2019, 20, 2057–2069. [Google Scholar] [CrossRef]
  26. Khan, S.A.; Baksh, E.M.; Akhtar, K.; Khan, S.B. A template of cellulose acetate polymer-ZnAl layered double hydroxide composite fabricated with Ni NPs: Applications in the hydrogenation of nitrophenols and dyes degradation. Spectrochim. Acta Part A 2020, 241, 118671. [Google Scholar] [CrossRef]
  27. Parsaeian, M.R.; Dadfarnia, S.; Haji Shabani, A.M.; Hafezi Moghaddam, R. Green synthesis of a high capacity magnetic polymer nanocomposite sorbent based on the natural products for removal of Reactive Black 5. Int. J. Environ. Anal. Chem. 2020, 1–15. [Google Scholar] [CrossRef]
  28. Silva, M.A.; Felgueiras, H.P.; Amorim, M.T.P. Carbon based membranes with modified properties: Thermal, morphological, mechanical and antimicrobial. Cellulose 2020, 27, 1497–1516. [Google Scholar] [CrossRef]
  29. Askari, N.; Farhadian, M.; Razmjou, A. Simultaneous effects of pH, concentration, pressure on dye removal by a polyamide nanofilter membrane; optimization through response surface methodology. Environ. Nanotechnol. Monit. Manag. 2018, 10, 223–230. [Google Scholar] [CrossRef]
  30. Baneshi, M.M.; Ghaedi, A.M.; Vafaei, A.; Emadzadeh, D.; Lau, W.J.; Marioryad, H.; Jamshidi, A. A high-flux P84 polyimide mixed matrix membranes incorporated with cadmium-based metal organic frameworks for enhanced simultaneous dyes removal: Response surface methodology. Environ. Res. 2020, 183, 109278. [Google Scholar] [CrossRef] [PubMed]
  31. Pooralhossini, J.; Zanjanchi, M.A.; Ghaedi, M.; Asfaram, A.; Azqhandi, M.H.A. Statistical optimization and modeling approach for azo dye decolorization: Combined effects of ultrasound waves and nanomaterial-based adsorbent. Appl. Organomet. Chem. 2018, 32, e4205. [Google Scholar] [CrossRef]
  32. Team, R.C. R: A Language and Environment for Statistical Computing. Available online: https://www.R-project.org (accessed on 6 May 2021).
  33. Team, R. R Studio: Integrated Development for R. Available online: http://www.rstudio.com (accessed on 6 May 2021).
  34. Ritz, C.; Baty, F.; Streibig, J.C.; Gerhard, D. Dose-Response Analysis Using R. PLoS ONE 2015, 10, e0146021. [Google Scholar] [CrossRef] [Green Version]
  35. Hadley, W. ggplot2: Elegant Graphics for Data Analysis; Springer: New York, NY, USA, 2016. [Google Scholar]
  36. Sievert, C. Interactive Web-Based Data Visualization with R, Plotly, and Shiny; Chapman and Hall/CRC: London, UK, 2020. [Google Scholar]
  37. Wilke, C.O. Streamlined Plot Theme and Plot Annotations for ‘ggplot2’. Available online: https://wilkelab.org/cowplot (accessed on 6 May 2021).
  38. Wilke, C.O. ggtext: Improved Text Rendering Support for ‘ggplot2’. Available online: https://wilkelab.org/ggtext/index.html (accessed on 6 May 2021).
  39. Ahmadi, M.; Hazrati Niari, M.; Kakavandi, B. Development of maghemite nanoparticles supported on cross-linked chitosan (γ-Fe2O3@CS) as a recoverable mesoporous magnetic composite for effective heavy metals removal. J. Mol. Liq. 2017, 248, 184–196. [Google Scholar] [CrossRef]
  40. Banerjee, S.; Chattopadhyaya, M.C. Adsorption characteristics for the removal of a toxic dye, tartrazine from aqueous solutions by a low cost agricultural by-product. Arabian J. Chem. 2017, 10, S1629–S1638. [Google Scholar] [CrossRef] [Green Version]
  41. Patil, H.; Shanmugam, V.; Marathe, K. Studies in synthesis and modification of PES membrane and its application for removal of reactive black 5 dye. Indian Chem. Eng. 2020. [Google Scholar] [CrossRef]
  42. Yan, H.; Yang, L.; Yang, Z.; Yang, H.; Li, A.; Cheng, R. Preparation of chitosan/poly (acrylic acid) magnetic composite microspheres and applications in the removal of copper (II) ions from aqueous solutions. J. Haz. Mat. 2012, 229, 371–380. [Google Scholar] [CrossRef]
  43. Mane, V.S.; Mall, I.D.; Srivastava, V.C. Use of bagasse fly ash as an adsorbent for the removal of brilliant green dye from aqueous solution. Dyes Pigm. 2007, 73, 269–278. [Google Scholar] [CrossRef]
  44. Asgher, M.; Bhatti, H.N. Evaluation of thermodynamics and effect of chemical treatments on sorption potential of Citrus waste biomass for removal of anionic dyes from aqueous solutions. Ecol. Eng. 2012, 38, 79–85. [Google Scholar] [CrossRef]
  45. Khosravi, I.; Eftekhar, M. Characterization and evaluation catalytic efficiency of NiFe2O4 nano spinel in removal of reactive dye from aqueous solution. Powder Technol. 2013, 250, 147–153. [Google Scholar] [CrossRef]
  46. Lagergren, S. Zur theorie der sogenannten adsorption geloster stoffe, Kungliga Svenska Vetenskapsakademiens. Handlingar 1898, 24, 1–39. [Google Scholar]
  47. Ho, Y.S.; McKay, G. Pseudo-second order model for sorption processes. Process Biochem. 1999, 34, 451–465. [Google Scholar] [CrossRef]
  48. Weber, W.J., Jr.; Morris, J.C. Kinetics of Adsorption on Carbon from Solution. J. Sanit. Eng. Div. 1963, 89, 31–59. [Google Scholar] [CrossRef]
  49. Xiao, Y.; Azaiez, J.; Hill, J.M. Erroneous Application of Pseudo-Second-Order Adsorption Kinetics Model: Ignored Assumptions and Spurious Correlations. Ind. Eng. Chem. Res. 2018, 57, 2705–2709. [Google Scholar] [CrossRef]
  50. Hubbe, M.A.; Azizian, S.; Douven, S. Implications of apparent pseudo-second-order adsorption kinetics onto cellulosic materials: A review. BioResources 2019, 14, 7582–7626. [Google Scholar] [CrossRef]
  51. Langmuir, I. The adsorption of gases on plane surface of glass, mica and platinum. J. Am. Chem. Soc. 1918, 40, 1361–1403. [Google Scholar] [CrossRef] [Green Version]
  52. Freundlich, H. Over the Adsorption in Solution. J. Phys. Chem. 1906, 57, 385–470. [Google Scholar]
  53. Temkin, M.; Pyzhev, V. Kinetics of Ammonia Synthesis on Promoted Iron Catalysts. Acta Physicochim. URSS 1940, 12, 217–222. [Google Scholar]
  54. Ghaedi, M.; Khafri, H.Z.; Asfaram, A.; Goudarzi, A. Response surface methodology approach for optimization of adsorption of Janus Green B from aqueous solution onto ZnO/Zn(OH)2-NP-AC: Kinetic and isotherm study. Spectrochim. Acta Part A 2016, 152, 233–240. [Google Scholar] [CrossRef]
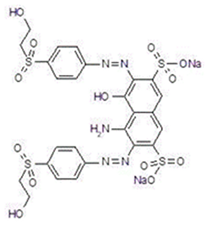
Figure 1. Adsorption capacity of hydRB5 with a concentration of 100 mg L−1 for prepared adsorbents, in pH = 7 and 25 ± 0.5 °C.
Fibers 09 00061 g001
Figure 2. pH’s effect on the adsorption capacity of membranes, at 25 ± 0.5 °C.
Fibers 09 00061 g002
Figure 3. Contact time (0–240 min) and initial dye concentration’ effects (40 mg L−1 (■), 60 mg L−1(♦), 80 mg L−1 (▲) and 100 mg L−1 (●)) on the membranes’ adsorption capacity, in pH~7 and 25 ± 0.5 °C: (a) M0, (b) M1, (c) M2 and (d) M3.
Fibers 09 00061 g003
Figure 4. (a) Desorption behavior of M2 membrane with NaOH solutions after one cycle, (b) desorption behavior of M2 membrane with NaCl solutions after one cycle and (c) the recyclability of M2 for hydRB5 adsorption by regeneration using 0.4 g L−1 NaOH and 10 g L−1 NaCl.
Fibers 09 00061 g004
Figure 5. Dye adsorption capacity (q) per membrane. Statistical significance between membranes at equal time points is indicated by *, with * p < 0.05, ** p < 0.001 and *** p < 0.0001.
Fibers 09 00061 g005
Figure 6. (a) pH’s effect on adsorption capacity, regardless of dye concentration (dots are the predicted mean response for those pH values (from 1 to 14), while the dotted line is the standard deviation range), (b) dye concentrations’ effect on adsorption capacity, regardless of pH value, at t = 120 min (dots are the predicted mean response for dye’s concentrations (from 10 to 100 mg L−1, every 10), while the dotted line is the standard deviation range of the response) and (c) contour graphs for adsorption capacity of each membrane in relation to pH and dye concentration.
Fibers 09 00061 g006
Figure 7. The contact time’s effect on dye adsorption capacity (q, mg g−1) as a function of the initial dye concentration (C, mg L−1).
Fibers 09 00061 g007
Table 1. Properties of the hydrolyzed Reactive Black 5 (hydRB5).
Fibers 09 00061 i001ClassAnionic, diazo
Molecular formulaC26H23N5Na2O13S4
Molecular weight787.708
UV absorption maximum597 nm
Reactive groupSulfatoethylsulfone
Table 2. Variables, experimental range and levels for the time independent (t = 120 min) statistical analysis.
VariablesUnitsLevels
Membrane-MoM1M2M3
Dye concentrationmg L−1406080100
pH-357911
Table 3. Parameters calculated from the PFO, PSO and IPD models for the adsorption of hydRB5 in the nanocomposite membranes in pH~7 and 25 ± 0.5 °C.
MembraneModelsParametersDye Concentration at Initial Time
Ci (mg L−1)
406080100
M0PFOqe,exp (mg g−1)15.020.024.026.0
q1 (mg g−1)15.820.821.526.0
k1 × 10−2 (min−1)4.624.043.193.91
R20.9900.9970.9800.997
PSOq2 (mg g−1)17.724.729.731.25
k2 × 10−4 (g mg−1 min−1)29.816.312.614.4
h (mg g−1 min−1)0.941.01.11.4
R20.9950.9940.9940.998
IPDki (mg g−1 min−0.5)1.822.112.472.57
C (mg g−1)0.4301.351.422.88
R20.9430.9240.9120.937
M1PFOqe,exp (mg g−1)38.254.068.179.0
q1 (mg g−1)39.151.694.397.8
k1 × 10−2 (min−1)3.903.745.855.46
R20.9960.9980.9710.993
PSOq2 (mg g−1)47.466.283.399.0
k2 × 10−4 (g mg−1 min−1)8.316.345.524.23
h (mg g−1 min−1)1.922.843.854.14
R20.9950.9940.9740.987
IPDki (mg g−1 min−0.5)4.415.837.929.96
C (mg g−1)0.6725.014.841.28
R20.9890.9640.9600.928
M2PFOqe,exp (mg g−1)41.057.071.082.0
q1 (mg g−1)44.758.782.075.2
k1 × 10−2 (min−1)4.924.635.444.58
R20.9950.9980.9980.987
PSOq2 (mg g−1)48.567.685.597.1
k2 × 10−4 (g mg−1 min−1)11.17.845.975.76
h (mg g−1 min−1)2.643.624.315.44
R20.9950.9940.9870.987
IPDki (mg g−1 min−0.5)5.236.217.658.37
C (mg g−1)0.4127.127.2716.0
R20.9820.9670.8750.929
M3PFOqe,exp (mg g−1)40.055.970.181.2
q1 (mg g−1)45.557.790.9102.8
k1 × 10−2 (min−1)5.174.185.245.32
R20.9840.9990.9840.992
PSOq2 (mg g−1)48.868.588.5103.1
k2 × 10−4 (g mg−1 min−1)9.656.234.443.76
h (mg g−1 min−1)2.362.923.453.91
R20.9880.9940.9830.973
IPDki (mg g−1 min−0.5)4.335.926.667.42
C (mg g−1)3.124.1211.516.1
R20.9010.9250.8760.855
Publisher’s Note: MDPI stays neutral with regard to jurisdictional claims in published maps and institutional affiliations.

