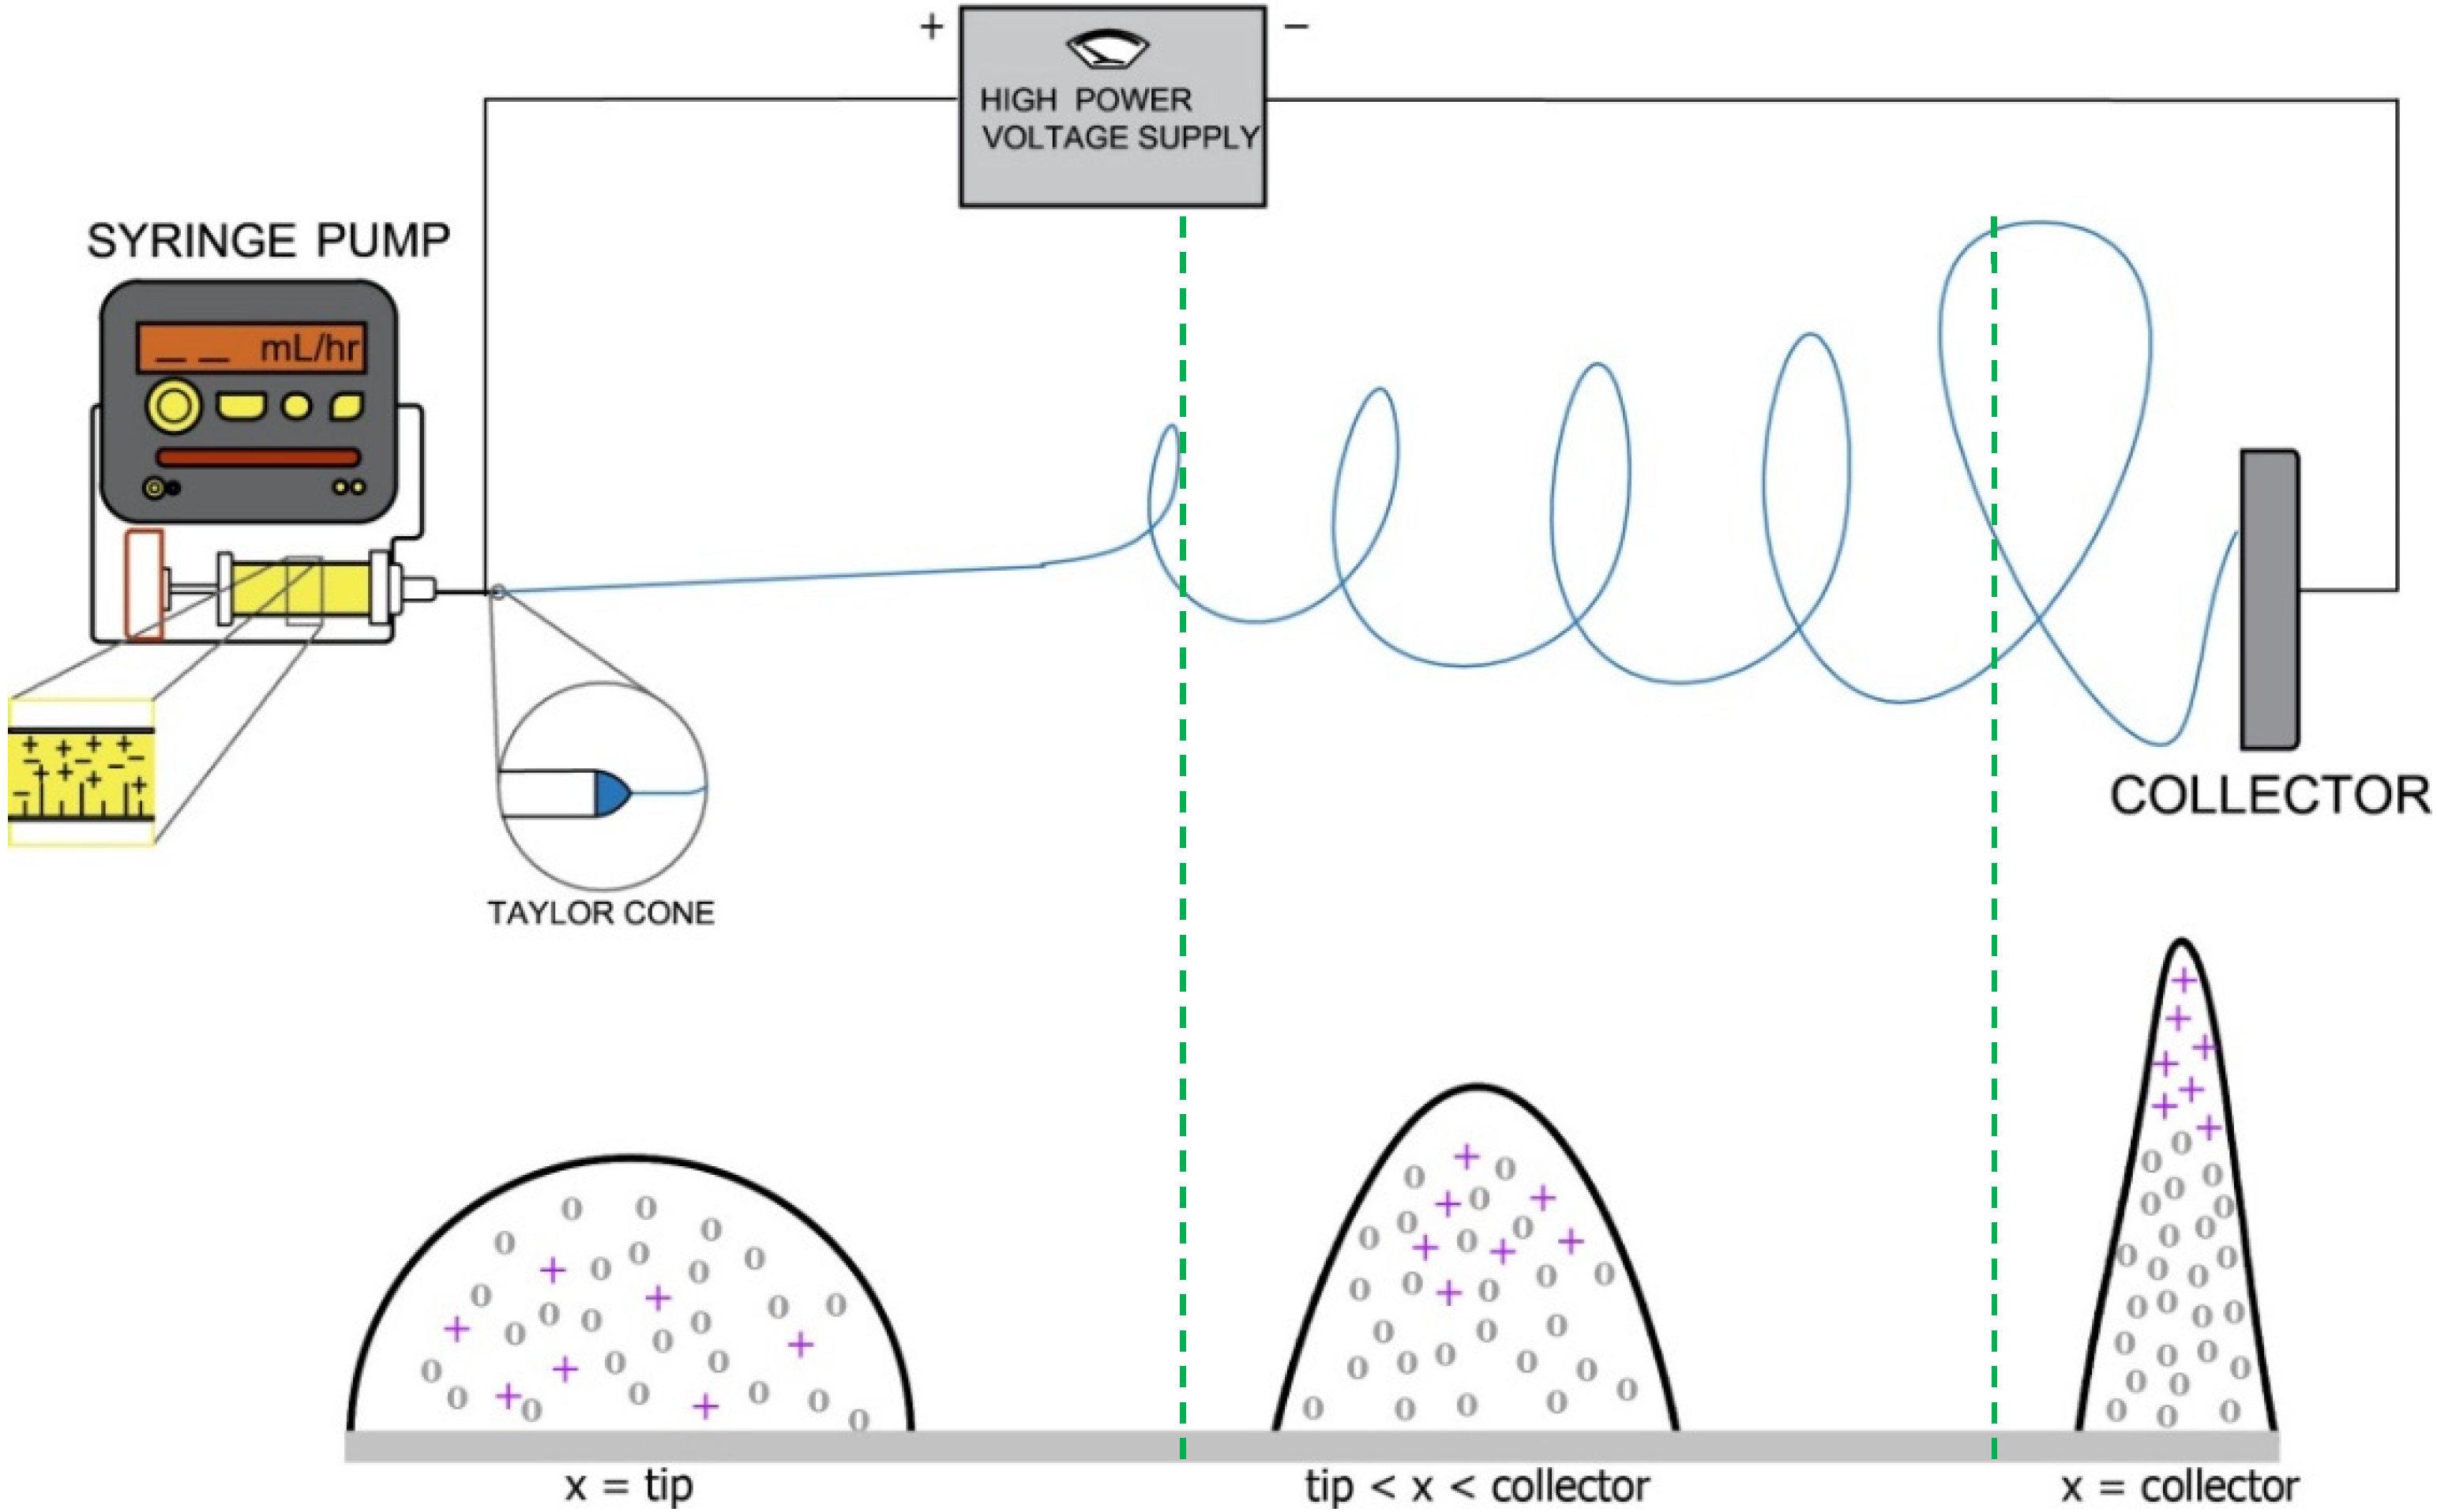
1. Introduction
Electrospinning is one of the simplest ways to produce a nanomaterial: it involves a polymer solution being drawn from a syringe through a high electric field [
1,
2,
3]. A vast array of morphologies can be created using the electrospinning technique; several primary structures obtained in electrospinning are of a fibrous [
4,
5], ribbon [
5,
6,
7,
8], helical [
9,
10], web [
11,
12] or pillared [
13] morphology with a secondary structure of beads, pores and protrusions [
14]. The variation in the solution and process parameters could lead to a unique configuration that displays novel characteristics for use in broad areas of interest. An example of this is the hydrophilic polymer polyvinyl alcohol (PVA), where changes in molecular weight and concentration modify its overall structural characteristics, from a fibrous to a ribbon type morphology [
4,
8,
15]. In blended polymers, the adjustment of each polymer content could alter the secondary structure of the material, such as in the polymer blend of polyethylene oxide and polyaniline sulfonic acid, in which the increased polyethylene oxide content increases the loop diameter of the formed helical fibers [
10]. Additionally, process parameters such as the tip-to-collector distance (TCD), voltage and flow rate can greatly affect the characteristics of the material produced [
16,
17].
Upon the production of an electrospun material, its overall morphology will affect the general characteristics of the surface developed [
18,
19]. For tissue engineering applications, the surface becomes important as the cell–material interaction happens initially on the interface before the molecules, proteins and cells permeate to the inner portion of the scaffold [
17,
18]. Currently, there is little or no published literature on the surface characterization and vertical orientation of electrospun nanomaterials based on a standardized roughness profile analysis, with few papers only discussing surface roughness [
20,
21,
22]. Therefore, more information needs to be developed to attain a better knowledge on the morphological effects of the electrospun material to its macrostructural surface properties, and so develop an improved correlation about cell–material interactions.
In this paper, we present a method to produce a distinct morphology from a hydrophilic polymer–protein blend using electrospinning, wherein the polymer solution used is a tri-solvent system of deionized water, acetic acid and formic acid. Generally, the morphologies produced by electrospinning PVA–EA blends are characterized as “nanoridges”, a long narrow elevation from the flat substrate, different from our previously reported study on a PVA–gelatin blend in which nanofibres are observed [
23,
24]. Here, we analyzed the surface produced from the PVA–EA nanoridges, as well as the effects of the solution and process parameters on the surface characteristics of the material. By understanding the parameters involved in its synthesis, the nanoridges could be used for tissue engineering purposes, or for developing new types of Janus nanomaterials [
25] because of the hypothesized distinct phase creation of PVA and EA in the nanoridge formed.
2. Materials and Methods
The technical grade polyvinyl alcohol (PVA, 87%–90% hydrolyzed, average mol wt 30,000–70,000), food grade egg albumin (EA), deionized water (H2O), formic acid (FA, reagent grade, 95%) and glacial acetic acid (HAc, anhydrous) were purchased at Sigma Aldrich and used as received. On preparing the solution, a 12% w/v polymer–solvent composition was made by dissolving both PVA and EA in a mixture of a H2O, FA and HAc solvent using a magnetic stirrer at 500 rpm for 5 h at 40 °C.
2.1. Design of Experiment
To evaluate the effects of different parameters, we have used the Taguchi method to assess the factor effects and minimize the required number of runs [
26]. An L9 orthogonal array was prepared for 4 factors with 3 levels, with the solution factors of the PVA–EA mass ratio (9:1, 8:2 and 7:3) and the H
2O/FA/HAc volume ratio (4:4:2, 4:2:4 and 2:4:4); the process factors were the tip-to-collector distance (TCD, 10, 12 and 14 cm) and flow rate (1, 2, and 3 mL/h). This design was made for the Taguchi method of analysis on the estimation of factor effects, as used in our study on a PVA–gelatin blend [
23]. Below is the experimental design used for the electrospinning (
Table 1):
2.2. Electrospinning of PVA–EA Solution
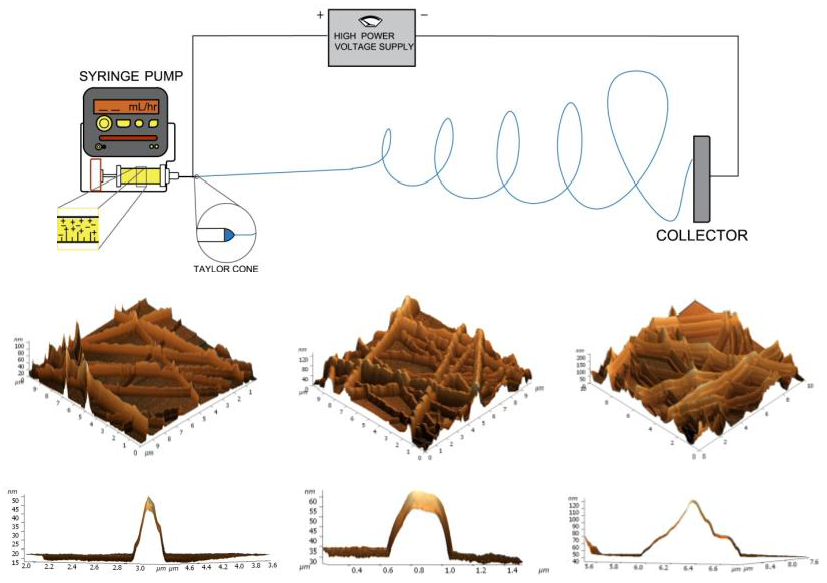
The electrospinning of the PVA–EA solution was similar to our work on PVA–gelatin [
23]. Briefly, the prepared solution was cooled at room temperature, loaded into a Terumo syringe (20 mL) with a 20G spinal needle, and attached in a Bbraun Perfusion syringe pump. The pumping was performed for 5 min initially to remove the startup effects, and then the flow rates and TCD were varied according to
Table 1. A mesh type collector and the body of the syringe needle were clamped on a high-DC voltage generator, with the voltage set at 15 kV.
2.3. Response Analysis
The nanoridge surface morphology was determined using atomic force microscopy (NT-MDT Solver Pro, single crystal silicon cantilever tip of a 6 nm radius, resonant frequency of ≈320 kHz and force constant of 40 N/m). The atomic force microscope (AFM) micrographs obtained were digitized and analyzed using the Nova RC1 software. The images obtained were preprocessed prior to the roughness analysis, where a subtraction of the second-order plane was done to equalize the heights of the micrograph and deconvolution was done to remove the effect of the tip geometry to the overall topology of the sample. The roughness parameters analyzed were based on ISO 4287–1997 and the specific equations are found in
Appendix A.
3. Results
3.1. Surface Characterization of Electrospun PVA–EA
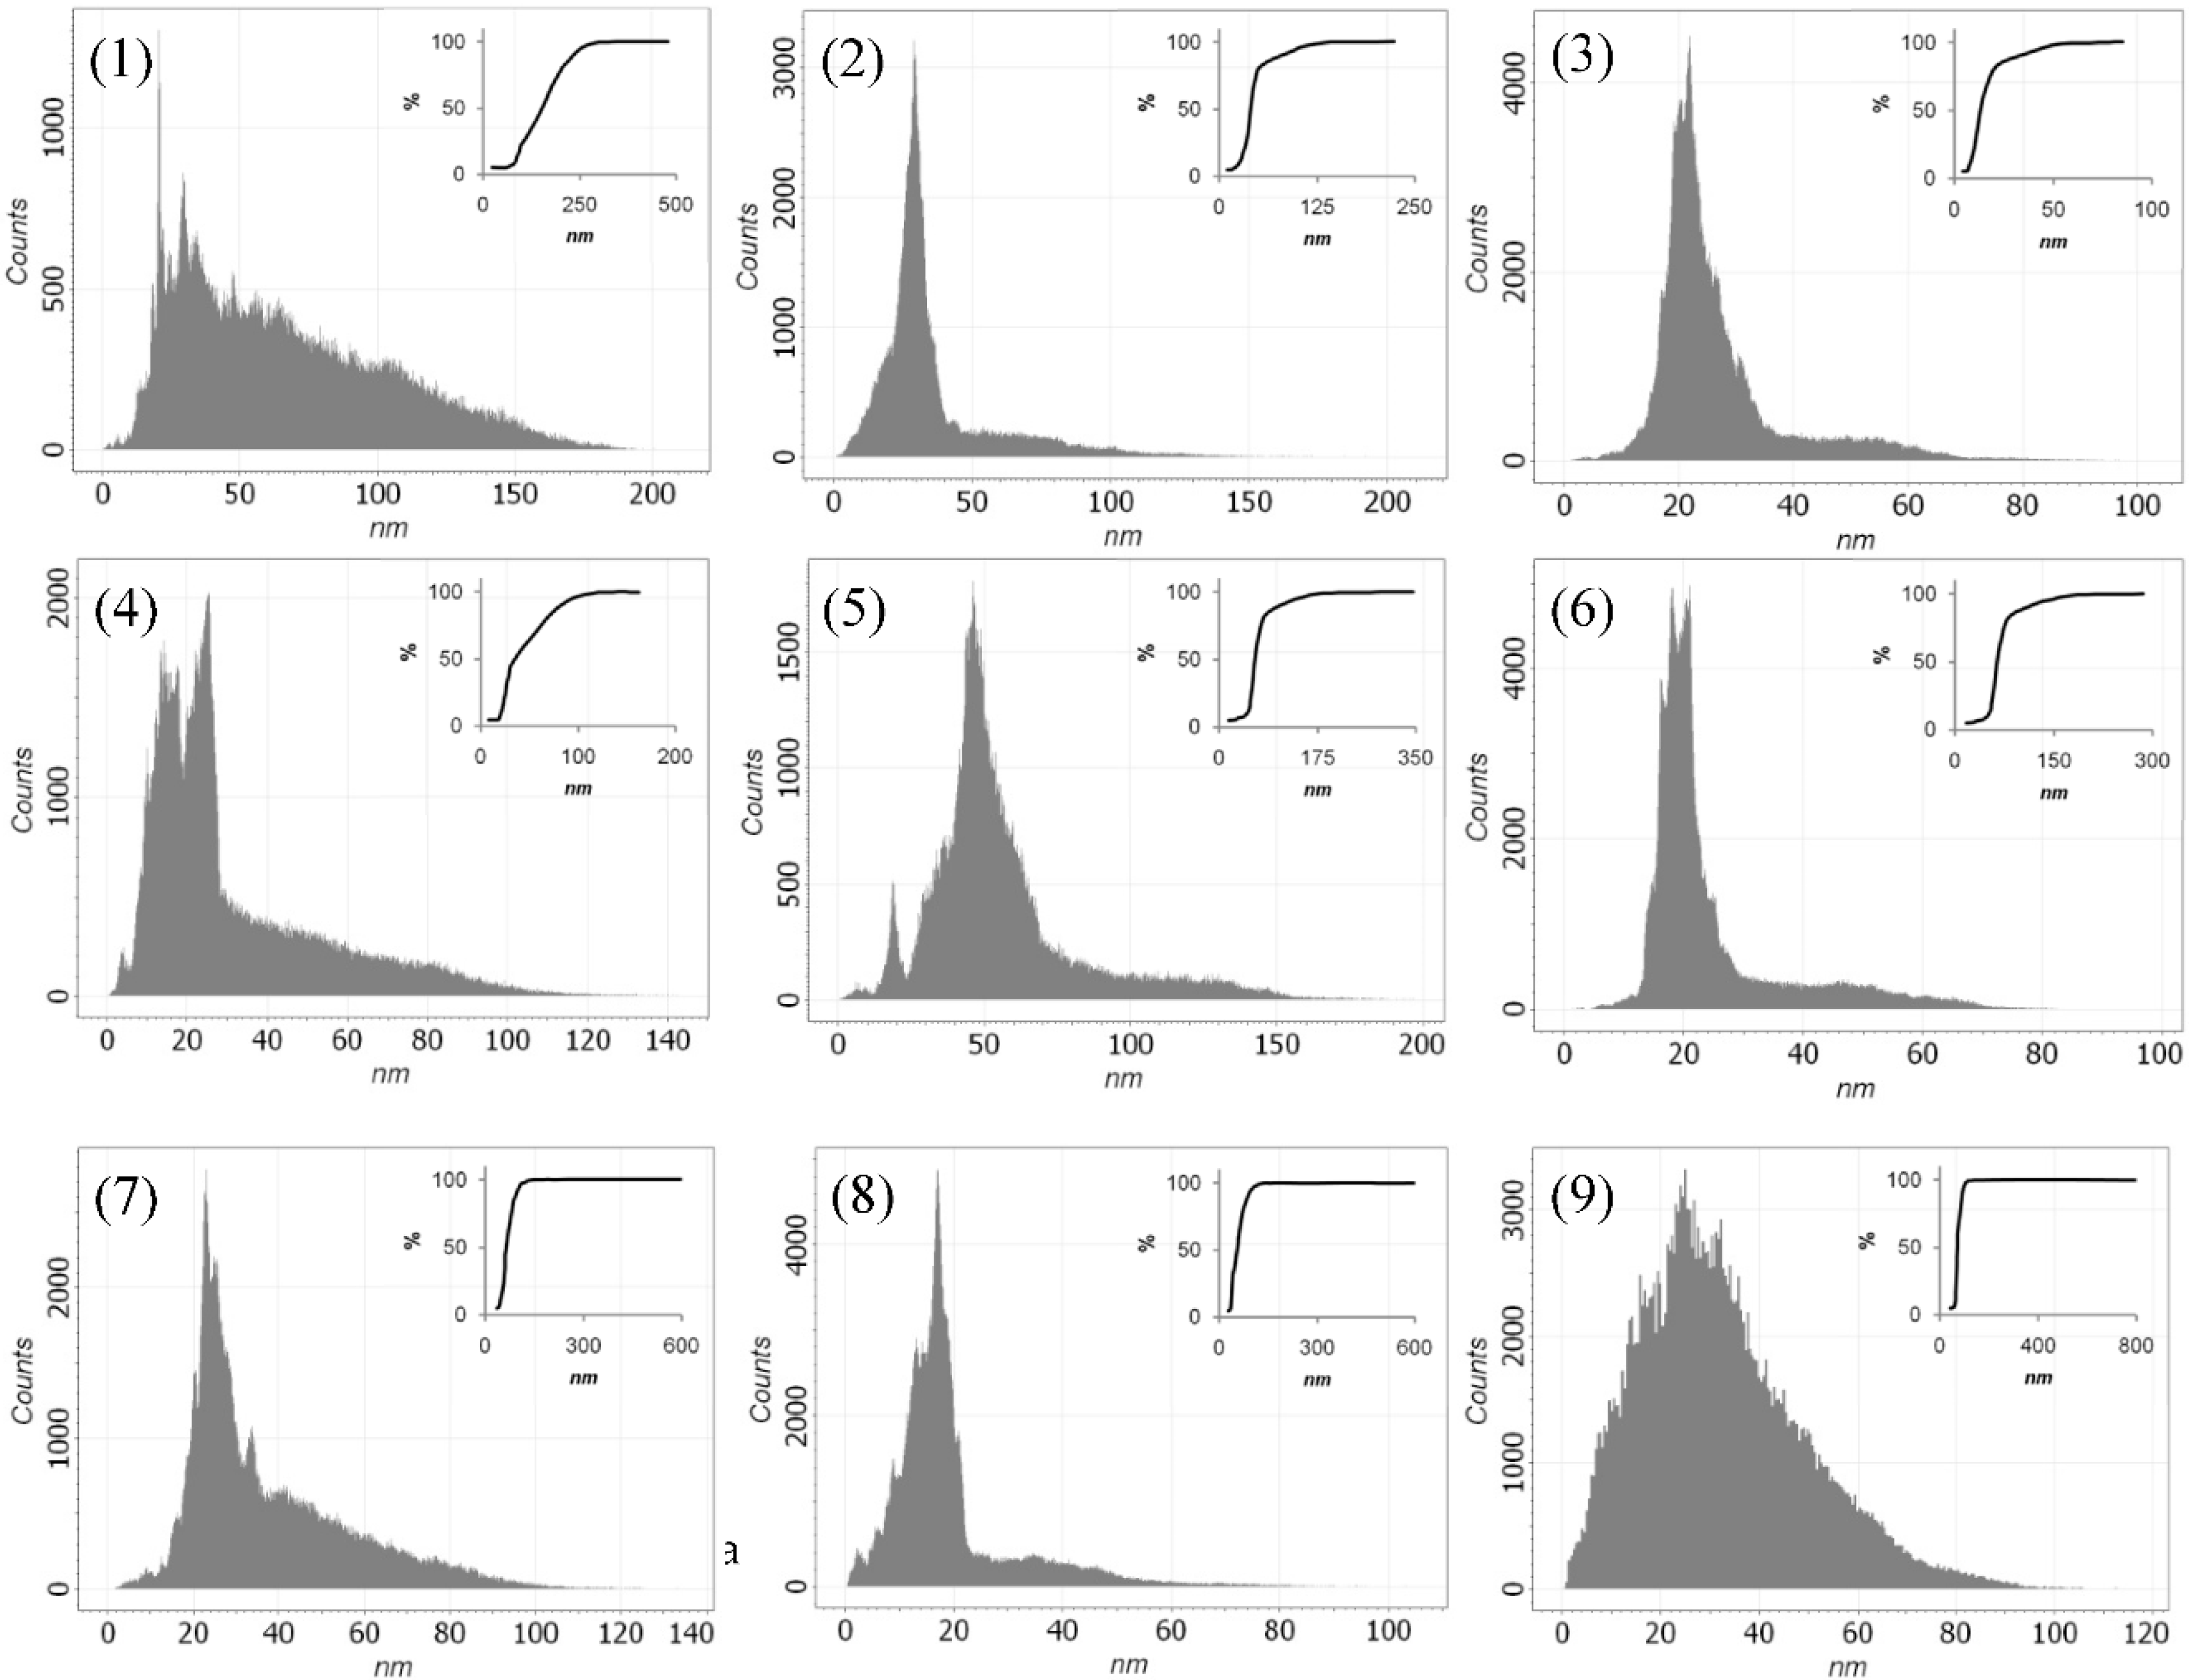
Surfaces produced by the PVA–EA nanoridges are generally very smooth in definition, with seven samples of roughness of grade number N1 and only one sample of the N2 grade from sample 1; the average roughness ranges from 7.85 to 47.56 nm and the root mean square roughness ranges from 11.37 to 57.56 nm. Large sample differences in the peak to peak and ten-point heights are also observed, thus the resulting variance (second moment) and entropy of the surface is expected to spread out far from the mean value overall, which are at 65.52 and 9.47, respectively. The specific values on each parameter for all the samples are listed in
Supplementary Table S1.
The surface topography shows positive skewness values, indicating that the majority of the grooves produced are valleys. Probing at the kurtosis of the surfaces, most of the profiles are typically sharp (positive k). The microstructural surface is consistent with its macrostructural expression, as the coefficients of kurtosis on both 50 × 50 and 10 × 10 µm have similar values. The bearing ratio curves showed a high material ratio over air, which reinforces the smoothness of the surface found in the parameters discussed above.
Figure 1 shows the histogram profile and the bearing ratio curves of the different samples produced.
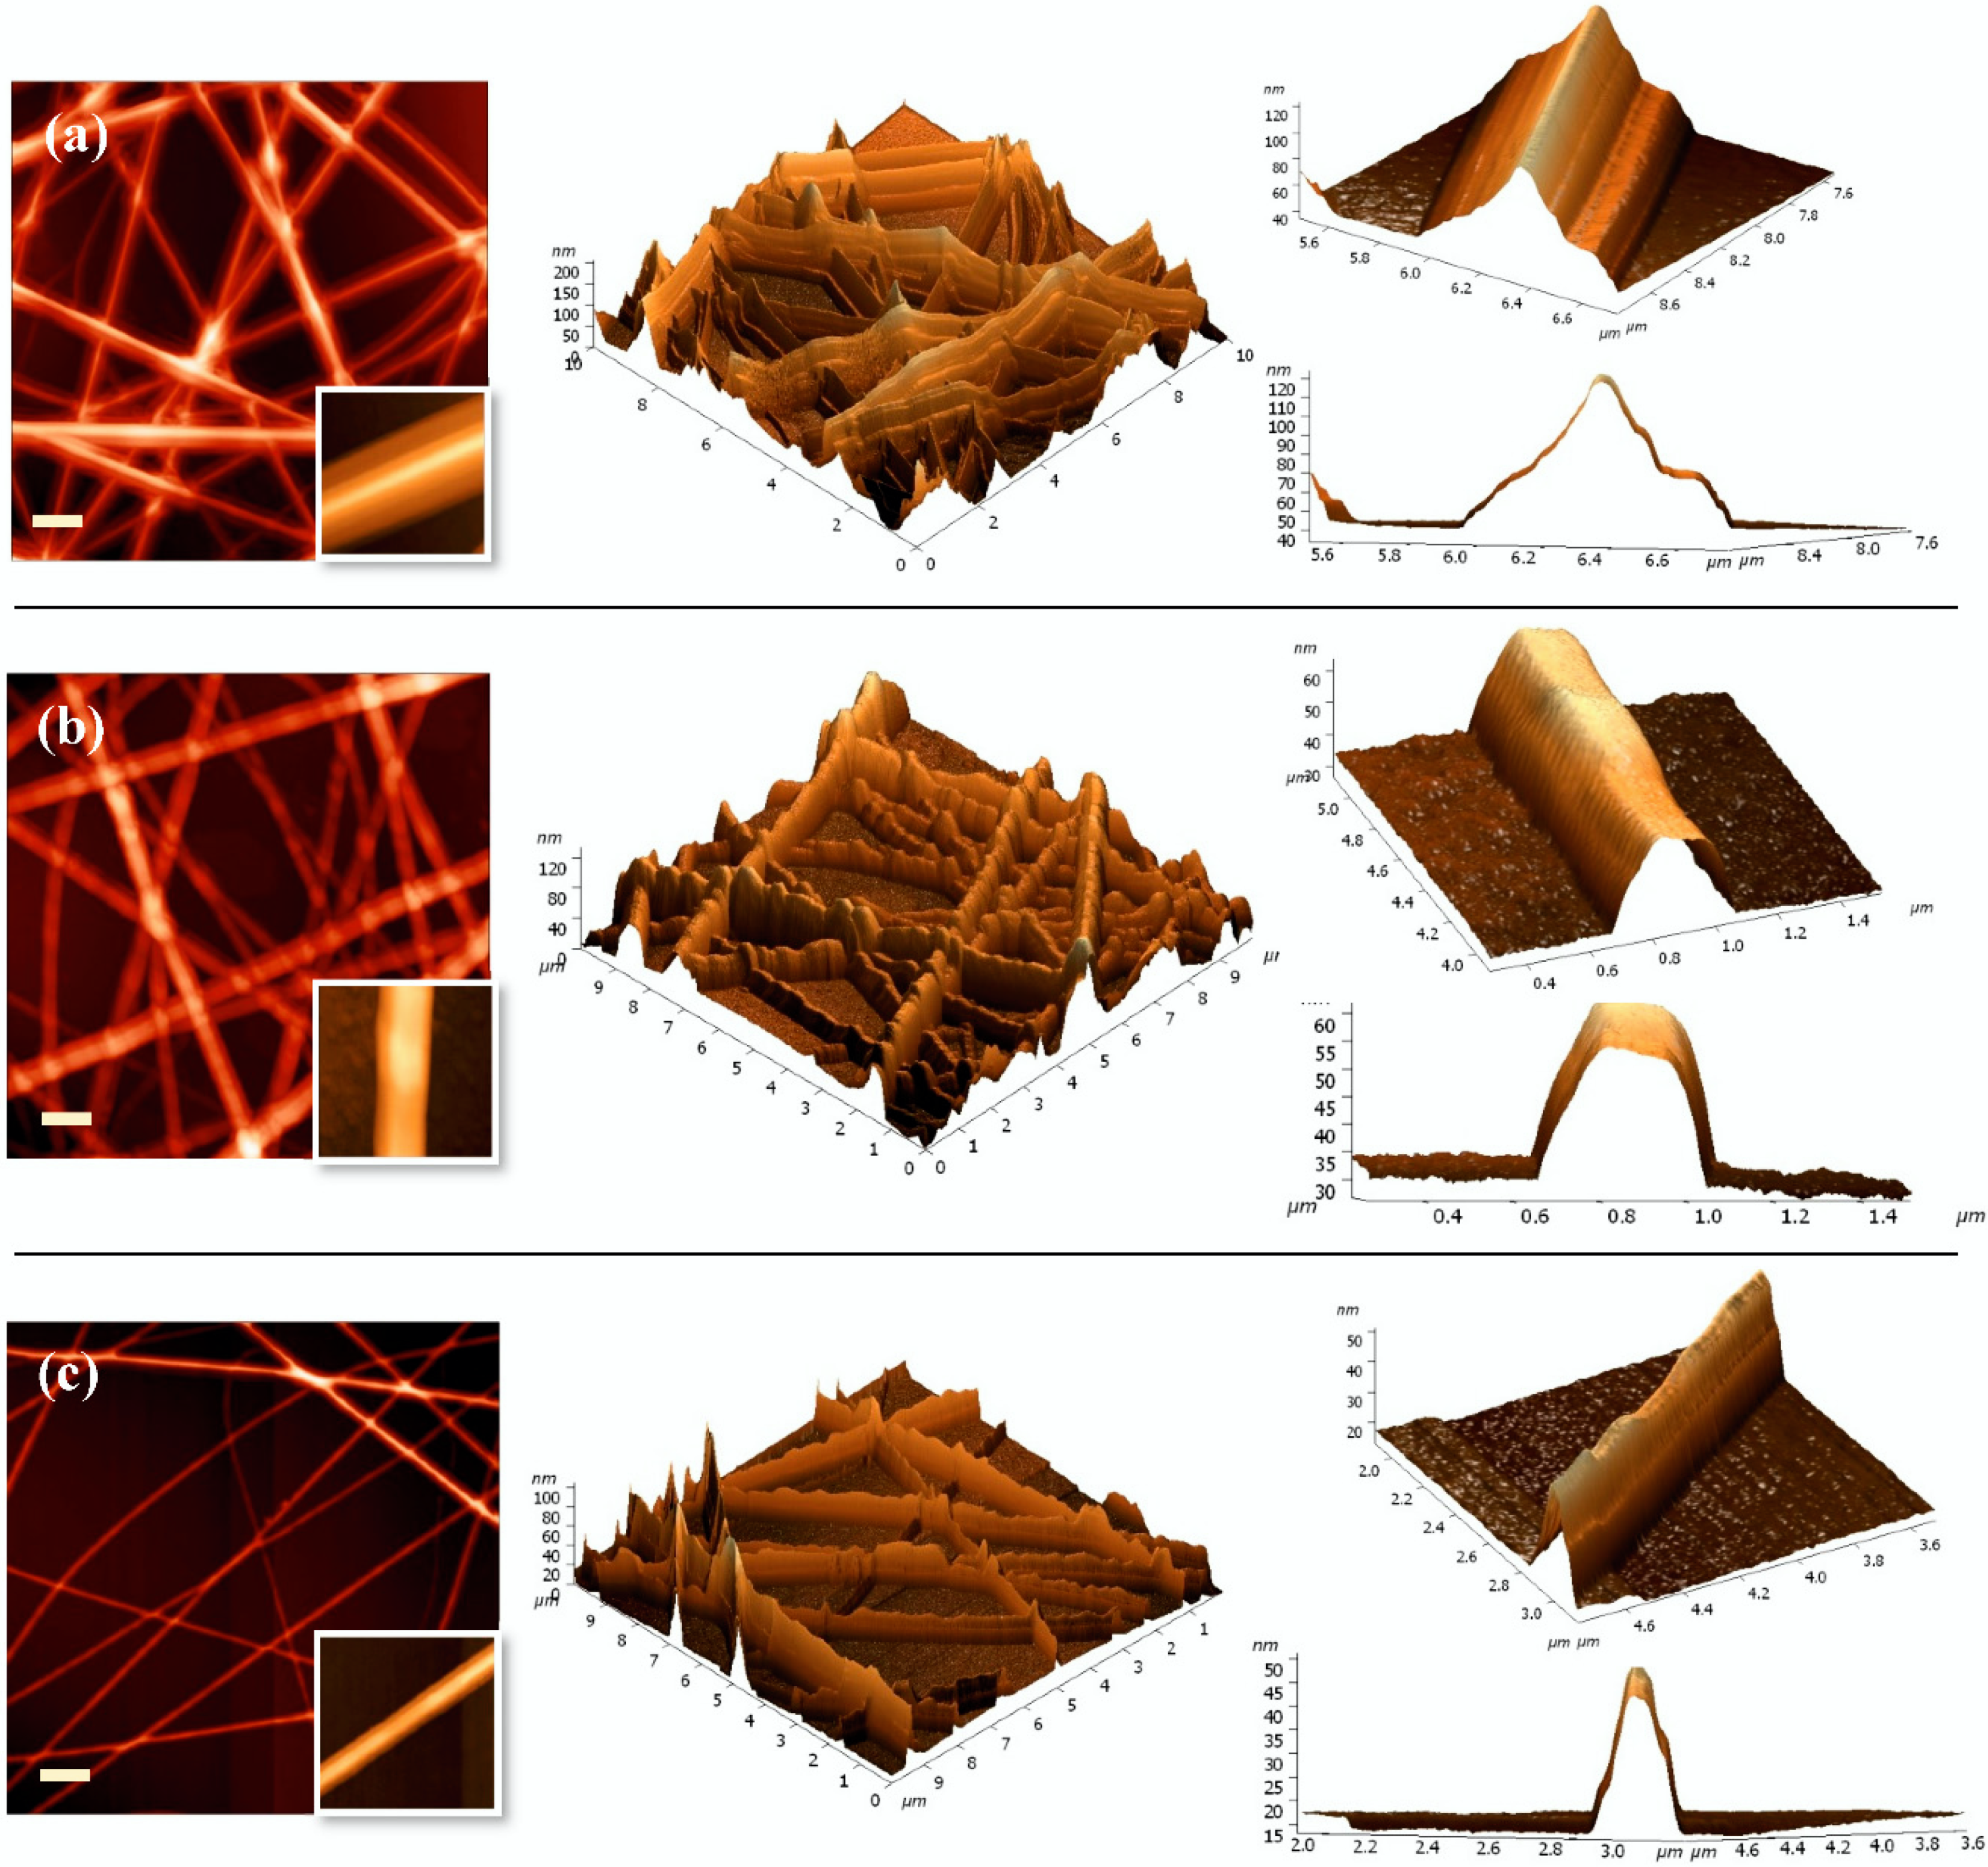
Atomic force microscopy shows three major morphologies across all parameters: broad, blunt and narrow nanoridge formation (
Figure 2). Runs 1, 2 and 5 have broad widths, whereas Runs, 3, 4 and 6 have narrow widths, and Runs 7 and 9 have blunt peaks. “Broad” and “narrow” nanoridges were defined as samples that are above (broad), or below (narrow) 0.4 µm in width. In the case of a blunt nanoridge, we defined it as having a radius of curvature below 100 nm. The ridge heights measured ranged from 84.82 nm to 639.95 nm, in which narrow nanoridges have the highest peak height across all the samples. The ridge width varied instead from 0.2–0.8 µm, with the broad samples having the largest width. Observations on the tip height homogeneity of each ridge reveal that the broad-peaked samples have a consistent peak height, while both the blunt and narrow ridges have a much more variable peak height in the individual fibers. The slopes from the base to the peak in both the narrow- and broad-peaked samples also show features that are nearly parallel to the surface, suggesting that the protein migration is inhomogeneous after being subjected to high-voltage conditions in the electrospinning.
3.2. Mean Effect Analysis
The Taguchi orthogonal array design of experiment (DOE) enabled us to assess the factors involved in the electrospinning and quantify the response on the changing factors with a minimal number of samples required [
26,
27]. Compared with the one factor at a time (OFAT) approach, the Taguchi DOE also includes the non-controllable aspects of the work, i.e., temperature fluctuation, dynamic changes in the electric field and other sources of noise that can affect the result [
27,
28,
29]. The result of the analysis reveals trends of the factors (i.e., solution and process parameters) to the response (ridge height, root-mean square (RMS) roughness and radius of curvature) in a robust degree [
30]. Whether the factors themselves or points on each factor are significant enough to influence the result is also shown through a post-hoc test [
29,
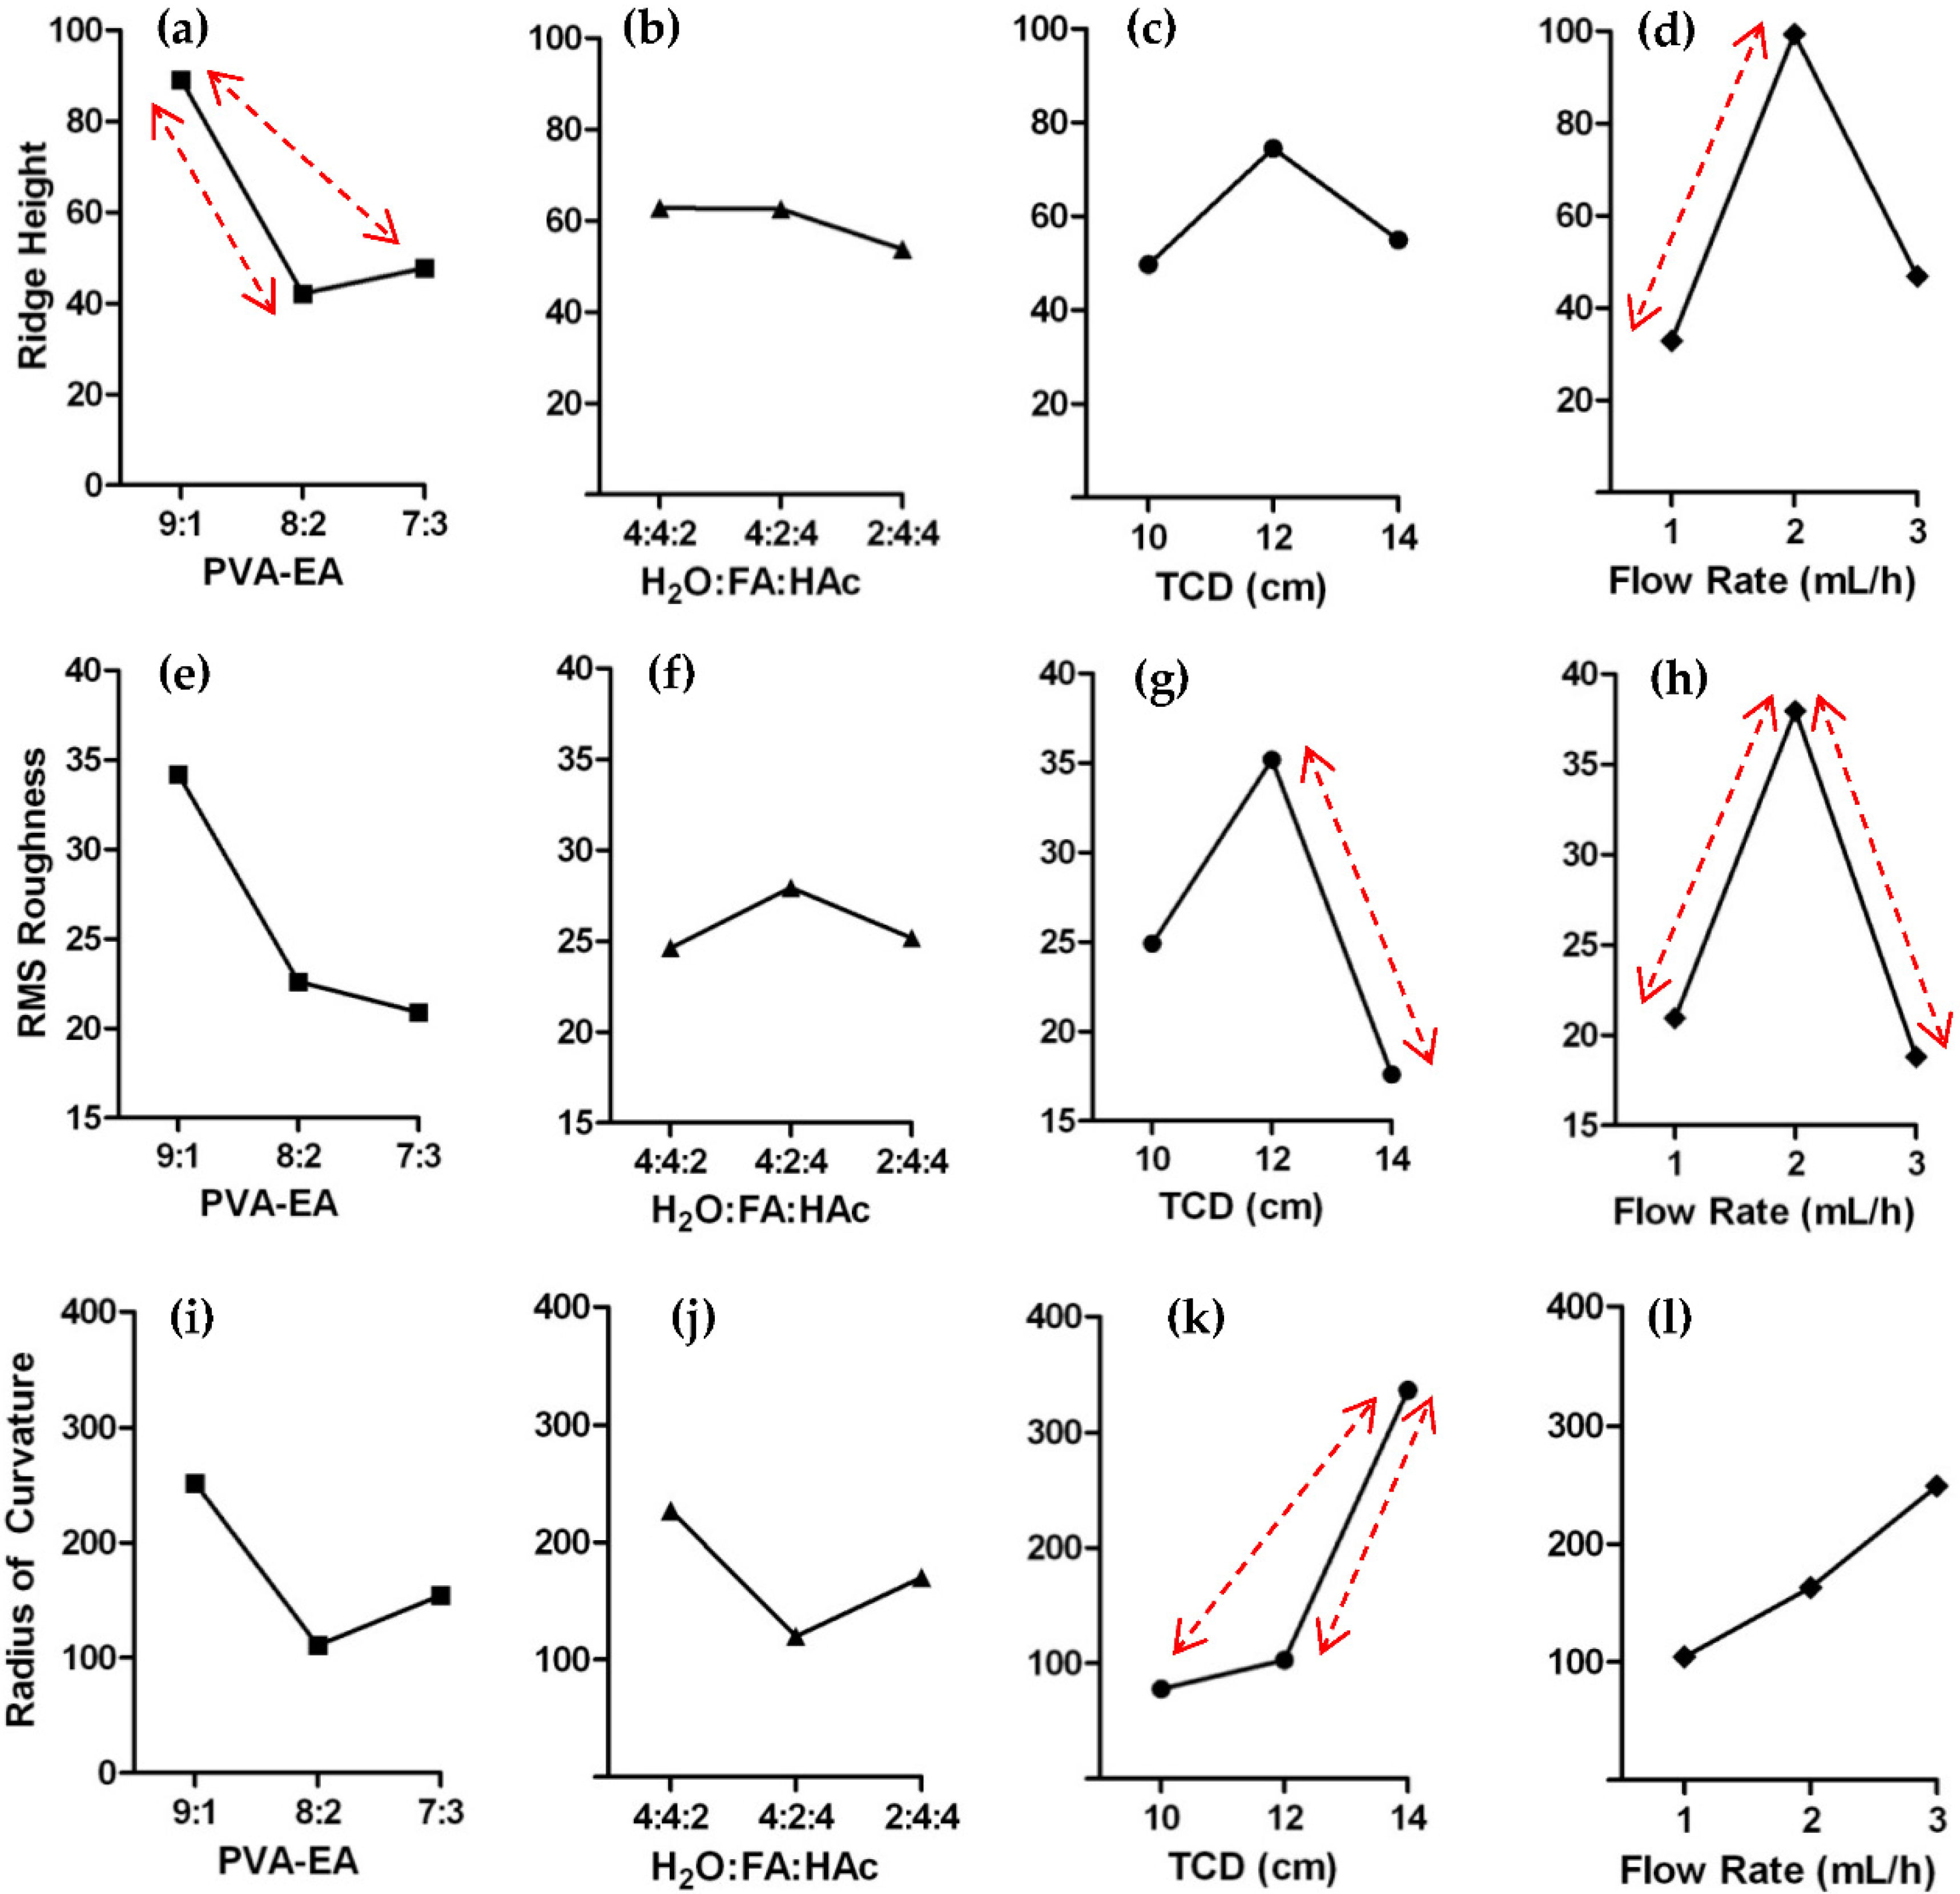
30]. Generally, the effects of the factors to the responses are non-linear. The effect of PVA–EA on the ridge height, RMS roughness and radius of curvature (
Figure 3) is similar, wherein there is a considerable decrease in the response from the 9:1 to 8:2 and 7:3 ratio of PVA–EA (
Figure 3a). It is highly plausible that these responses are interrelated, in which a decrease in the ridge height will also decrease the RMS roughness of the surface as well as its radius of curvature. On the other hand, the solvent composition does not have any significant effect on all the surface properties of the material being investigated. Additionally, although trends can be seen in the plots, other factors also have no significant effect on the surface properties: TCD on the ridge height, the PVA–EA ratio on the RMS roughness and the PVA–EA ratio together with the flow rate on the radius of curvature.
Process parameters have a more profound effect on the surface and ridge morphology of the material produced. The flow rate increases the ridge height from 1 to 2 mL/h, whereas pairwise from 2 to 3 and 1 to 3 mL/h have no significant difference on the trend. The TCD has an inverse effect on the RMS roughness from the 12 to 14 cm values (
Figure 3g) and a direct effect on its radius of curvature (
Figure 3k). Other pairwise comparisons are not statistically significant. As the distance from the tip of the syringe increases, the field strength decreases, and so it weakly affects the polarization of the solution. Assuming the previous hypothesis on ridge formation applies, the decrease in polarization decreases the overall curvature of the nanoridge formed, which in turn reduces the RMS roughness of the surface. The flow rate, on the other hand, affects the ridge height (
Figure 3d) and RMS roughness (
Figure 3h); increasing the flow rate from 1 to 2 mL/h both increases the ridge height and the RMS roughness, while increasing it further to 3 mL/h reduces both responses almost similarly to 1 mL/h.
4. Discussion
Upon designing the experiment, we have used active DOEs to ensure the reproducibility of the process. This is because the experiment accounted the experimental errors which can affect the final morphology of the material being produced [
30]. Unlike passive/classical DOEs, the Taguchi orthogonal array DOE includes uncontrollable factors such as environmental variation, errors from experimental sequence and bias errors, making the result robust and reproducible [
29]. Regarding the morphology, it is seen as hardly distinguishable as compared with nanofibrous constructs and other assemblies. Looking at the 2D structure of the PVA–EA, it can be easily mistaken for a nanofiber assembly as it looks similar on SEM images published for the said blend. Prior studies on electrospun PVA–EA blends claimed to produce a nanofiber morphology [
5,
31]; it is deduced that the solvent composition highly affected the formation of the fiber morphology. Studies that used acetic acid and formic acid as a solvent for the electrospinning produced a nanoribbon morphology [
5,
32,
33] which is somewhat similar to the present manufactured material, however, the consistent upright orientation and its varying sharpness (
Figure 2) makes the morphology distinct from nanoribbons and nanofibres.
One probable cause for this is the solvent–EA interaction of the system. Although it is seen in the plots that there are no significant differences within the means of the H
2O/FA/HAc ratios, there is probably an interaction between the EA content and the solution used due to the solvation effects. The isoelectric point of EA is relatively around 4.8, and below this value the overall charge of the solution is highly positive due to the polyelectrolyte nature of EA [
34]. All solvents prepared are highly acidic, and so EA proteins, being positively charged in the solution, will repel in the collector (charged positive) and move towards the negative electric field side (i.e., the tip of the syringe).
Figure 4 shows the hypothetical formation of the nanoridge.
It is theorized that there is an initial formation of fibers upon the ejection of the stream of the PVA–EA blend. After being subjected on a highly polarized electric field, EA aggregates begin to form and migrate from a homogenous PVA–EA fiber to a distinct PVA and EA phase. This distinct phase is comprised of a base PVA and an EA rich apex; the apex is formed from the stretching of the upper portion of the nanofibers due to EA migration, thus developing a nanoridge. A lower EA content could have a higher protein mobility that increases the velocity of migration towards the apex, and thus results in a higher ridge formation upon deposition into the substrate. On the effects of the other parameters, the increased flight time by having high TCD values resulted in a blunt ridge, which is most likely to be the result of the evening out of the EA transfer to the apex upon substrate arrival. Meanwhile, the non-linear response of the flowrate into the RMS roughness and the ridge height (albeit not significantly different from 2–3 mL/h) seemed unclear. As discussed previously, an increased ridge height also translates into an increased surface roughness; however, it is rather unclear on the sudden drop in the ridge height and the RMS roughness upon increasing the flow rate from 2–3 mL/h, though it might be possibly due to the complex interaction of the amount of solution being subjected into the electric field and the ejection perturbation to the collector.
5. Conclusions
The production of a PVA–EA nanoridge has been successful, and the surface and morphological parameters have been assessed to characterize the material. The ridges produced were broad-, blunt- or sharp-peaked, and the effects of the solution and process parameters on the surface and morphology characteristics of the material have been analyzed. The ridge formation hypothesis has been associated with the polarization of the solution, wherein the initial formation of nanofibres upon ejection from the syringe is stretched due to the migration of positively charged EA proteins to the apex. The higher the EA content, the smaller the fibers formed and the blunter the ridges being produced. Additionally, increasing the TCD has an inverse outcome on the RMS roughness and a direct effect on its radius of curvature, while increasing the flow rate has a nonlinear response to the ridge height and RMS roughness. Increasing the levels of THE factors could be done to evaluate further the trend of each factor on the surface properties of the material and reinforce the results in this paper. In addition, other 3D imaging techniques such as micro-CT could be utilized to confirm the existence of a nanoridge morphology, and time-of-flight secondary ion mass spectrometry (TOF-SIMS) to evaluate the chemical composition of the apex. Using the technique on electrospinning with a polarized solution could produce other types of polymer blends containing a globular protein with a nanoridge morphology, obtaining a new class of morphology that could be used from guided cell growth to filtration membranes.
Supplementary Materials
The following are available online at
https://www.mdpi.com/2079-6439/8/5/29/s1, Table S1: Surface roughness parameters on samples produced from experimental conditions at 50 × 50 µm surface area (w/coefficient of kurtosis at 10 × 10 µm) in Table S1.
Author Contributions
Data curation, M.J.V.O.; Formal analysis, J.R. and M.J.V.O.; Funding acquisition B.P.; Investigation, J.R. and C.N.; Methodology, J.R., C.N. and C.T.; Project administration, B.P. and C.T.; Resources, C.N. and R.D.; Software, J.A.S.; Supervision, B.P.; Validation, B.P. and R.D.; Visualization, J.A.S.; Writing—original draft, J.R.; Writing—review and editing, B.P. All authors have read and agreed to the published version of the manuscript.
Funding
This work and the APC has been supported by the research grant of the Department of Science and Technology—Engineering Research for Development of Technology program (DOST-ERDT) and the Philippine Council for Industrial, Energy and Emerging Technology Research and Development (DOST-PCIEERD), as well as the Commission on Higher Education (CHED) Dissemination Grant.
Acknowledgments
The authors would also like to thank Remylyn Magbiray, Jennifer Corsanes, Jielyn Cruz, Mary Pauline Escanilas, and Francis Lim for the assistance during the experimentation, Bess Singidas and Roland Sarmago for the AFM testing, and Mark Anderson for the help during the statistical analysis of data.
Conflicts of Interest
The authors declare no conflict of interest. The funders had no role in the design of the study; in the collection, analyses, or interpretation of data; in the writing of the manuscript, or in the decision to publish the results.
Appendix A
Calculation of surface properties and sharpness of the nanoridge synthesized.
The roughness parameters analyzed were based on ISO 4287-1997 and are as follows:
Height range of the input micrograph:
The sum of five maximum and minimum heights divided by ten:
Standard deviation of surface roughness:
Square root of the arithmetic mean of heights:
Measurement on whether asperities (+
) or valleys (-
) are dominant in the surface:
Measurement of peakedness of the height distribution:
Degree of randomness of surface height distribution:
Plot of the volume ratio of air/material at the surface:
On calculating the sharpness (radius of curvature,
) of the material, individual ridge height profiles are extracted from the digitized AFM micrograph, and a span of
(the minimum ridge height span found on all samples) is evaluated from the apex of the tip of the curve so that all samples can be compared in their degree of sharpness. Inclusive points are determined from the height span, and the radius of curvature is determined using the least squares method. To provide the mathematical description of the least squares method, starting from the equation of a circle (with center at
h and
k), we have
substituting the radius to be
, after simplifying, the equation becomes
setting the least squares method for Equation 11:
where
is the weight coefficient. Differentiating with respect to
,
and
and equating to zero to obtain the minimum:
Recasting into matrix format:
where
are the summations of the
height profile of the material with a variable origin defined at
Choosing the origin to be at the midpoint (
) and setting
, and
, we have
Solving for the
h and
k values:
Finally, the radius of curvature
r is computed as
This method was derived by Robert Israel and is translated into an algorithm using MatLab (2015a, Mathworks, Natick, MA, USA).
References
- Lukáš, D.; Sarkar, A.; Martinová, L.; Vodsed’álková, K.; Lubasová, D.; Chaloupek, J.; Pokorný, P.; Mikes, P.; Chvojka, J.; Komárek, M. Physical principles of electrospinning (Electrospinning as a nano-scale technology of the twenty-first century). Text. Prog. 2009, 41, 59–140. [Google Scholar] [CrossRef]
- Islam, S.; Ang, B.C.; Andriyana, A.; Afifi, A.M. A review on fabrication of nanofibers via electrospinning and their applications. SN Appl. Sci. 2019, 1, 1248. [Google Scholar] [CrossRef]
- Persano, L.; Camposeo, A.; Tekmen, C.; Pisignano, D. Industrial Upscaling of Electrospinning and Applications of Polymer Nanofibers: A Review. Macromol. Mater. Eng. 2013, 298, 504–520. [Google Scholar] [CrossRef]
- Park, J.-C.; Ito, T.; Kim, K.-O.; Kim, K.-W.; Kim, I.S.; Khil, M.-S.; Kim, H.Y.; Kim, I.-S. Electrospun poly(vinyl alcohol) nanofibers: Effects of degree of hydrolysis and enhanced water stability. Polym. J. 2010, 42, 273–276. [Google Scholar] [CrossRef]
- Zahedi, P.; Fallah-Darrehchi, M. Electrospun egg albumin-PVA nanofibers containing tetracycline hydrochloride: Morphological, drug release, antibacterial, thermal and mechanical properties. Fibers Polym. 2015, 16, 2184–2192. [Google Scholar] [CrossRef]
- Zhang, L.; Hu, J.; Voevodin, A.A.; Fong, H. Synthesis of continuous TiC nanofibers and/or nanoribbons through electrospinning followed by carbothermal reduction. Nanoscale 2010, 2, 1670. [Google Scholar] [CrossRef]
- Nagapudi, K.; Brinkman, W.T.; Leisen, J.E.; Huang, L.; McMillan, R.A.; Apkarian, R.P.; Conticello, V.P.; Chaikof, E.L. Photomediated Solid-State Cross-Linking of an Elastin−Mimetic Recombinant Protein Polymer. Macromolecules 2002, 35, 1730–1737. [Google Scholar] [CrossRef]
- Koski, A.; Yim, K.; Shivkumar, S. Effect of molecular weight on fibrous PVA produced by electrospinning. Mater. Lett. 2004, 58, 493–497. [Google Scholar] [CrossRef]
- Wu, H.; Bian, F.; Gong, R.H.; Zeng, Y. Effects of Electric Field and Polymer Structure on the Formation of Helical Nanofibers via Coelectrospinning. Ind. Eng. Chem. Res. 2015, 54, 9585–9590. [Google Scholar] [CrossRef]
- Kessick, R.; Tepper, G.C. Microscale polymeric helical structures produced by electrospinning. Appl. Phys. Lett. 2004, 84, 4807. [Google Scholar] [CrossRef]
- Ding, B.; Li, C.; Miyauchi, Y.; Kuwaki, O.; Shiratori, S. Formation of novel 2D polymer nanowebs via electrospinning. Nanotechnology 2006, 17, 3685. [Google Scholar] [CrossRef]
- Enis, I.Y.; Vojtech, J.; Sadikoglu, T.G. Alternative solvent systems for polycaprolactone nanowebs via electrospinning. J. Ind. Text. 2016, 47, 57–70. [Google Scholar] [CrossRef]
- Miyauchi, Y.; Ding, B.; Shiratori, S. Fabrication of a silver-ragwort-leaf-like super-hydrophobic micro/nanoporous fibrous mat surface by electrospinning. Nanotechnology 2006, 17, 5151–5156. [Google Scholar] [CrossRef]
- Zander, N.E. Hierarchically Structured Electrospun Fibers. Polymers 2013, 5, 19–44. [Google Scholar] [CrossRef]
- Supaphol, P.; Chuangchote, S. On the electrospinning of poly(vinyl alcohol) nanofiber mats: A revisit. J. Appl. Polym. Sci. 2008, 108, 969–978. [Google Scholar] [CrossRef]
- Sanchez-Alvarado, D.I.; Guzmán-Pantoja, J.; Paramo-Garcia, U.; Cerda, A.M.; Martínez-Orozco, R.D.; Vera-Graziano, R. Morphological Study of Chitosan/Poly (Vinyl Alcohol) Nanofibers Prepared by Electrospinning, Collected on Reticulated Vitreous Carbon. Int. J. Mol. Sci. 2018, 19, 1718. [Google Scholar] [CrossRef]
- Haider, A.; Haider, S.; Kang, I.-K. A comprehensive review summarizing the effect of electrospinning parameters and potential applications of nanofibers in biomedical and biotechnology. Arab. J. Chem. 2018, 11, 1165–1188. [Google Scholar] [CrossRef]
- Denchai, A.; Tartarini, D.; Mele, E. Cellular Response to Surface Morphology: Electrospinning and Computational Modeling. Front. Bioeng. Biotechnol. 2018, 6, 155. [Google Scholar] [CrossRef]
- Desai, K.; Kit, K.; Li, J.; Zivanovic, S. Morphological and Surface Properties of Electrospun Chitosan Nanofibers. Biomacromolecules 2008, 9, 1000–1006. [Google Scholar] [CrossRef]
- Ding, B.; Fujimoto, K.; Shiratori, S. Preparation and characterization of self-assembled polyelectrolyte multilayered films on electrospun nanofibers. Thin Solid Film. 2005, 491, 23–28. [Google Scholar] [CrossRef]
- Hassan, M.I.; Sultana, N. Characterization, drug loading and antibacterial activity of nanohydroxyapatite/polycaprolactone (nHA/PCL) electrospun membrane. 3 Biotech. 2017, 7, 249. [Google Scholar] [CrossRef] [PubMed]
- Milleret, V.; Hefti, T.; Hall, H.; Vogel, V.; Eberli, D. Influence of the fiber diameter and surface roughness of electrospun vascular grafts on blood activation. Acta Biomater. 2012, 8, 4349–4356. [Google Scholar] [CrossRef] [PubMed]
- Ramis, J.; Pajarito, B.B. New Solvent System for the Fabrication of Polyvinyl Alcohol—Gelatin Nanofibers via Electrospinning. Adv. Mater. Res. 2015, 1125, 406–410. [Google Scholar] [CrossRef]
- Ramis, J.; Pajarito, B.B. Effect of Morphology and Chemical Modification on Water Degradation Behavior of Polyvinyl Alcohol—Gelatin Blend. Key Eng. Mater. 2016, 705, 82–86. [Google Scholar] [CrossRef]
- Lv, N.; Ma, Q.; Dong, X.; Wang, J.; Yu, W.; Liu, G. Flexible Janus Nanofibers: Facile Electrospinning Construction and Enhanced Luminescent-Electrical-Magnetic Trifunctionality. ChemPlusChem 2014, 79, 690–697. [Google Scholar] [CrossRef]
- Ramis, J.; Pajarito, B.B.; Deocaris, C.C. Characterization and Multi-Response Morphological Optimization for Preparation of Defect-Free Electrospun Nanofibers Using the Taguchi Method. J. Biomim. Biomater. Biomed. Eng. 2017, 30, 61–75. [Google Scholar] [CrossRef]
- Fei, N.C.; Mehat, N.M.; Kamaruddin, S. Practical Applications of Taguchi Method for Optimization of Processing Parameters for Plastic Injection Moulding: A Retrospective Review. ISRN Ind. Eng. 2013, 2013, 1–11. [Google Scholar] [CrossRef]
- Gaitonde, V.; Karnik, S.; Davim, J.P. Multiple performance optimization in drilling using Taguchi method with utility and modified utility concepts. In Materials Forming and Machining; Elsevier BV: Amsterdam, The Netherlands, 2015; pp. 99–115. [Google Scholar]
- Ross, P.J.; Ross, P.J. Taguchi Techniques for Quality Engineering: Loss Function, Orthogonal Experiments, Parameter and Tolerance Design; McGraw-Hill: New York, NY, USA, 1988. [Google Scholar]
- Menten, T.; Phadke, M. Quality Engineering Using Robust Design. Technometrics 1991, 33, 236. [Google Scholar] [CrossRef]
- Rathna, G.V.N.; Jog, J.P.; Gaikwad, A.B. Development of non-woven nanofibers of egg albumen-poly (vinyl alcohol) blends: Influence of solution properties on morphology of nanofibers. Polym. J. 2011, 43, 654–661. [Google Scholar] [CrossRef]
- Ner, Y.; Stuart, J.A.; Whited, G.; Sotzing, G.A. Electrospinning nanoribbons of a bioengineered silk-elastin-like protein (SELP) from water. Polymers 2009, 50, 5828–5836. [Google Scholar] [CrossRef]
- Meretoja, V.; Dahlin, R.L.; Wright, S.; Kasper, F.; Mikos, A.G. Articular Chondrocyte Redifferentiation in 3D Co-cultures with Mesenchymal Stem Cells. Tissue Eng. Part. C Methods 2014, 20, 514–523. [Google Scholar] [CrossRef] [PubMed]
- Smith, E.R.B. The effect of variations in ionic strength on the apparent isoelectric point of egg albumin. J. Biol. Chem. 1935, 108, 187–194. [Google Scholar]
© 2020 by the authors. Licensee MDPI, Basel, Switzerland. This article is an open access article distributed under the terms and conditions of the Creative Commons Attribution (CC BY) license (http://creativecommons.org/licenses/by/4.0/).


